
Impact of Income Inequality on Urban Air Quality: A Game Theoretical and Empirical Study in China


Abstract
:1. Introduction
2. Literature Review and Development of Hypotheses
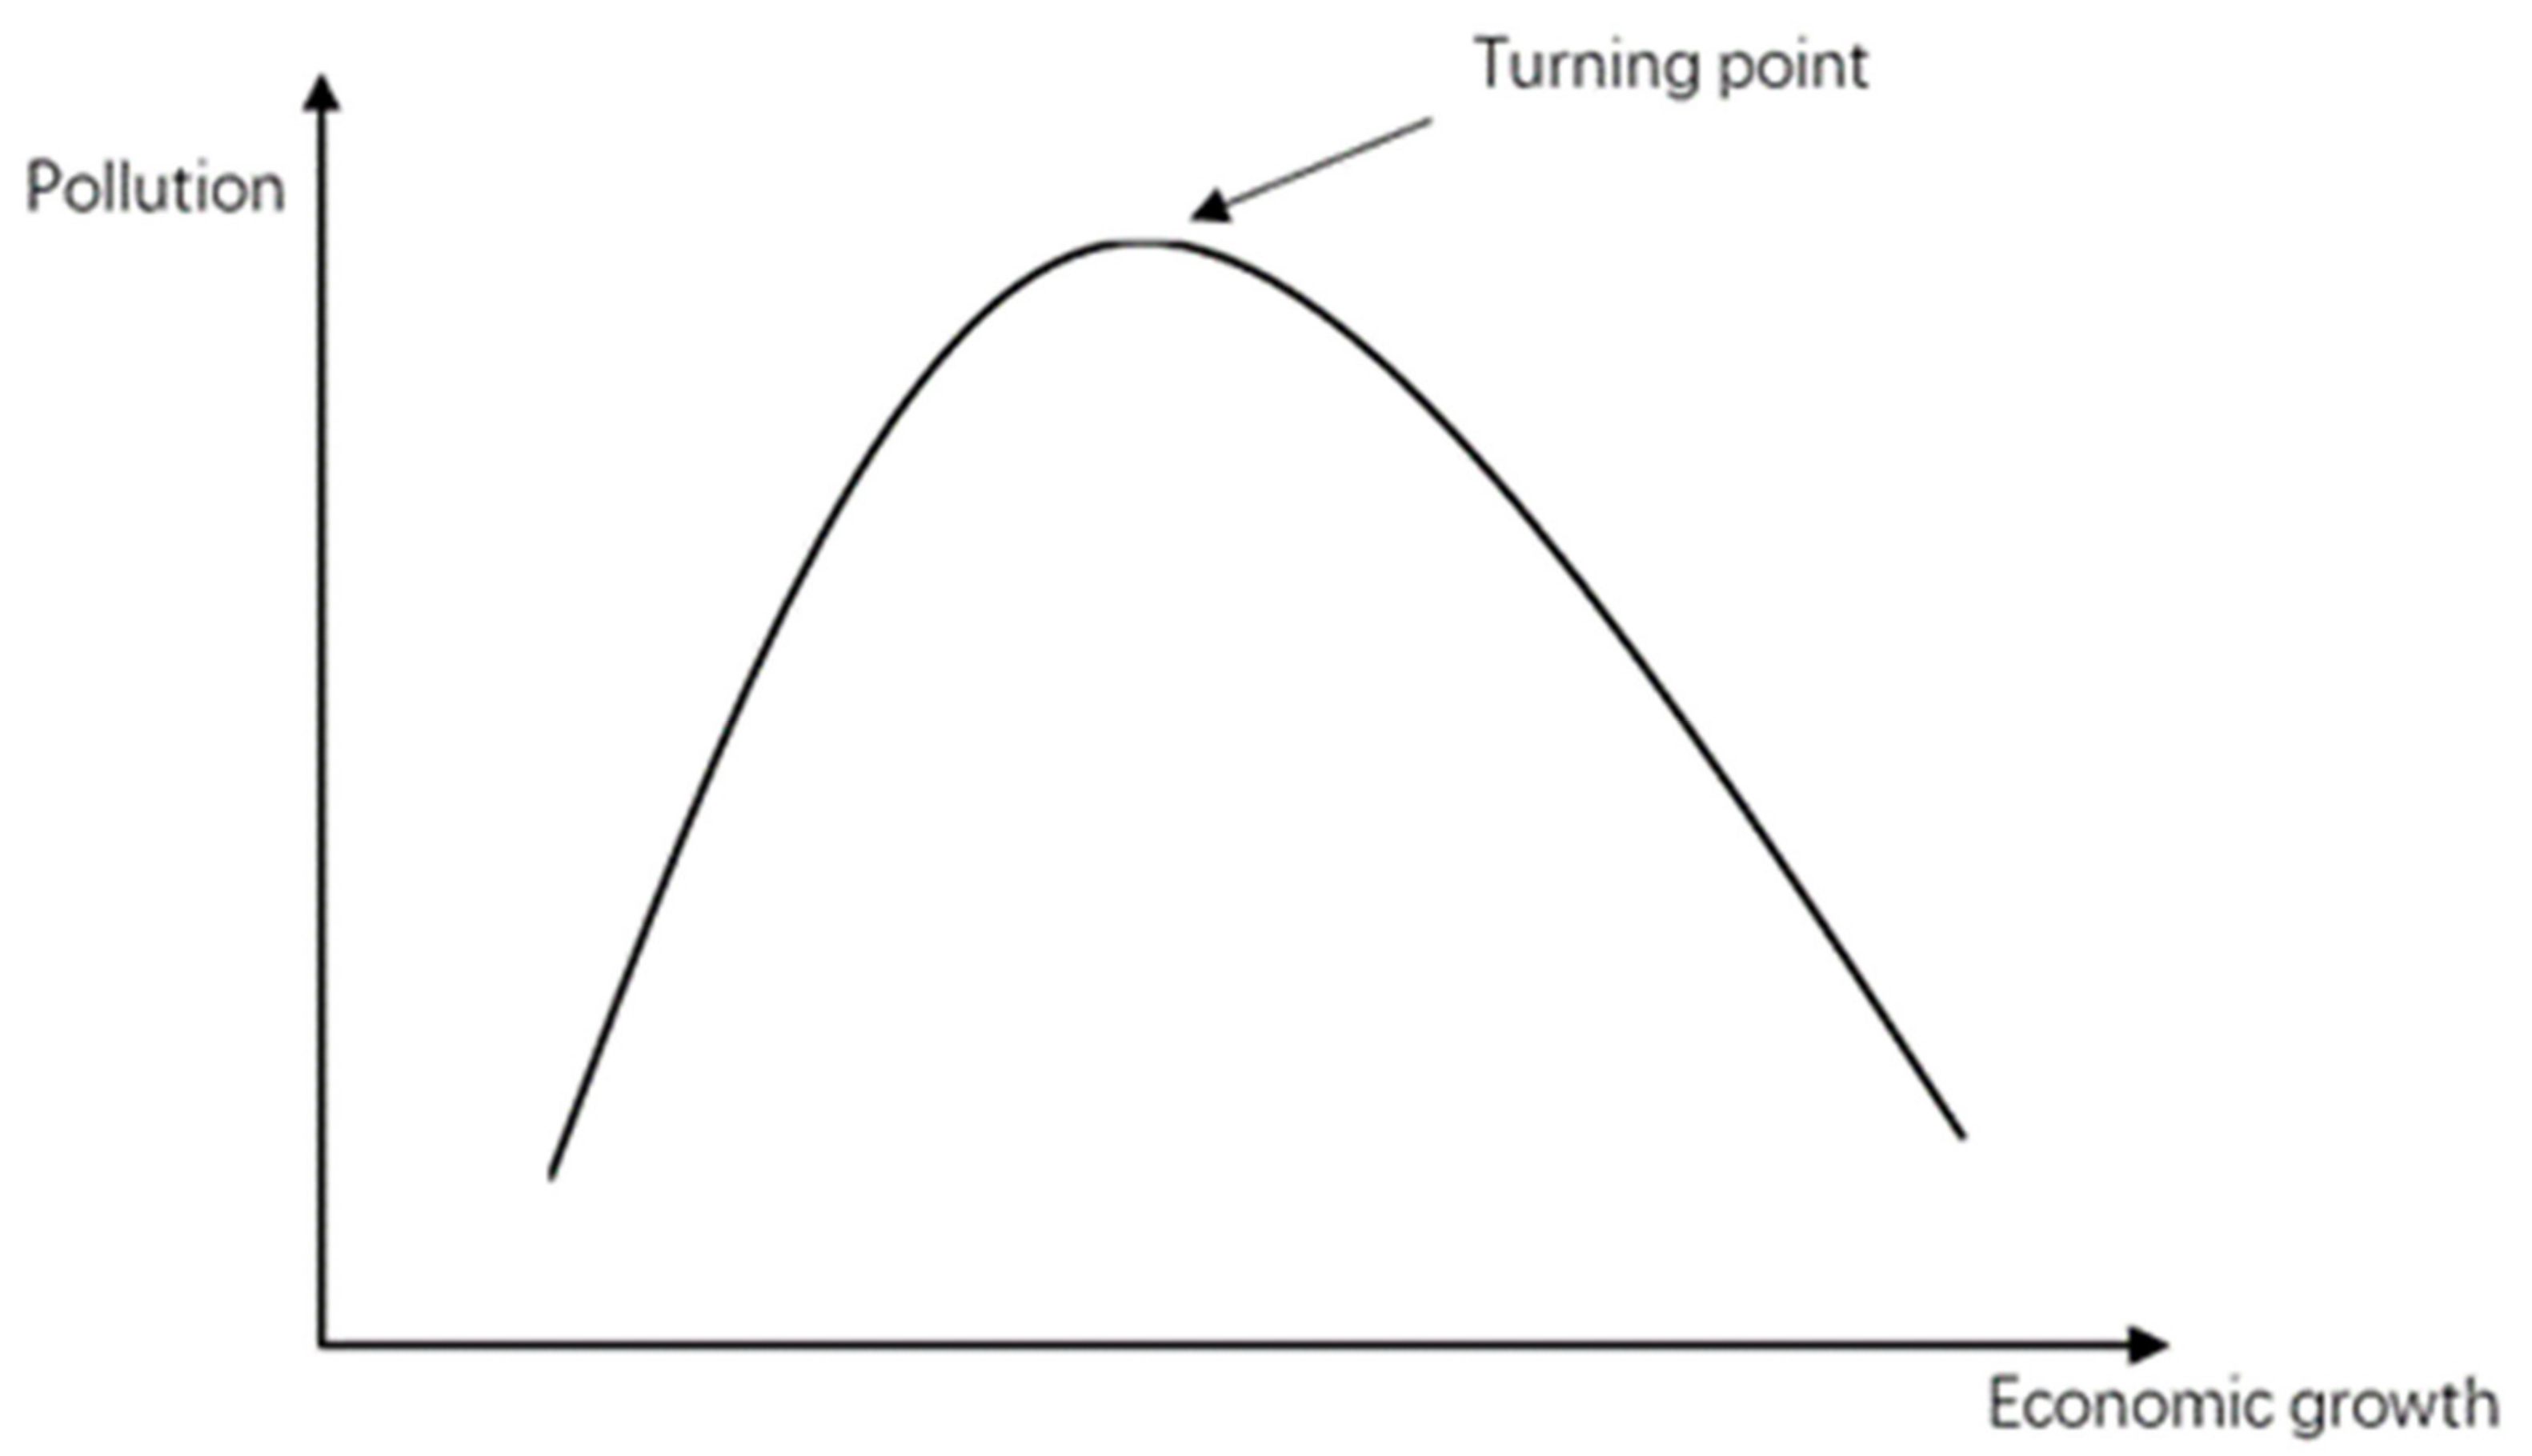
2.1. Trade-Off between Economic Growth and the Environment
2.2. Empirical Evidence on the Linkage between Inequality and Emissions
2.3. Game Theoretical Approach and Other Formal Models
3. Materials and Methods
3.1. Game-Theoretic Model
3.2. Model Specification
3.3. Sample and Data
4. Results and Discussion
4.1. Income Inequality and Air Pollution
4.2. Endogeneity Concerns
4.3. Testing Environmental Kuznets Curves with Urban-Rural Inequality
5. Conclusions and Policy Implications
Author Contributions
Funding
Institutional Review Board Statement
Informed Consent Statement
Data Availability Statement
Conflicts of Interest
References
- Liu, X.; Da, W.; Martin, G.; Liu, K. Regional income mobility in large cities throughout China. Appl. Econ. Lett. 2019, 26, 1322–1327. [Google Scholar] [CrossRef]
- Jain-Chandra, S.; Khor, N.; Mano, R.; Schauer, J.; Wingender, P.; Zhuang, J. Inequality in China—Trends, Drivers and Policy Remedies; International monetary Fund: Washington, DC, USA, 2018. [Google Scholar] [CrossRef] [Green Version]
- Zhu, B. Study of Chinese Gini Coefficients Issues. Ph.D. Thesis, Southwest University of Finance and Economics, Chengdu, China, 2014. [Google Scholar]
- Hao, Y.; Chen, H.; Zhang, Q. Will income inequality affect environmental quality? Analysis based on China’s provincial panel data. Ecol. Indic. 2016, 67, 533–542. [Google Scholar] [CrossRef]
- Galor, O.; Moav, O. From Physical to Human Capital Accumulation: Inequality and the Process of Development. Rev. Econ. Stud. 2004, 71, 1001–1026. [Google Scholar] [CrossRef]
- Zhao, Y. Air Quality Improved in More Cities: MEP. Global Times. 2017. Available online: http://www.globaltimes.cn/content/1036183.shtml (accessed on 5 March 2017).
- Jorgenson, A.; Thombs, R.; Clark, B.; Givens, J.; Hill, T.; Huang, X.; Kelly, O.; Fitzgerald, J. Inequality amplifies the negative association between life expectancy and air pollution: A cross-national longitudinal study. Sci. Total Environ. 2021, 758, 143705. [Google Scholar] [CrossRef]
- World Health Organization. Global Health Data Repository. 2018. Available online: http://apps.who.int/gho/data/view.main.BODAMBIENTAIRDTHS8 (accessed on 15 November 2018).
- Meadows, D.H.; Goldsmith, E.; Meadow, P. The Limits to Growth; New American Library: New York, NY, USA, 1972. [Google Scholar]
- Grossman, G.M.; Krueger, A.B. Environmental Impacts of a North American Free Trade Agreement; Working Paper No. 3914; National Bureau of Economikc Research: Cambridge, MA, USA, 1991. [Google Scholar]
- Grossman, G.M.; Krueger, A.B. Economic Growth and the Environment. Q. J. Econ. 1995, 110, 353–377. [Google Scholar] [CrossRef] [Green Version]
- Panayotou, T. Empirical Tests and Policy Analysis of Environmental Degradation at Different Stages of Economic Development; Working Paper No. 238; ILO: Geneva, Switzerland, 1993. [Google Scholar]
- Kuznets, S. Economic Growth and Income Inequality. Am. Econ. Rev. 1955, 45, 1–28. [Google Scholar]
- Kuznets, S. Quantitative Aspects of the Economic Growth of Nations: VIII. Distribution of Income by Size. Econ. Dev. Cult. Chang. 1963, 11, 1–80. [Google Scholar] [CrossRef] [Green Version]
- Arrow, K.; Bolin, B.; Costanza, R.; Dasgupta, P.; Folke, C.; Holling, C.S.; Jansson, B.-O.; Levin, S.; Mäler, K.-G.; Perrings, C.; et al. Economic growth, carrying capacity, and the environment. Science 1995, 268, 520–521. [Google Scholar] [CrossRef] [PubMed]
- Galeotti, M.; Lanza, A. Richer and cleaner? A study on carbon dioxide emissions in developing countries. Energy Policy 1999, 27, 565–573. [Google Scholar] [CrossRef] [Green Version]
- Kaufmann, R.K.; Davidsdottir, B.; Garnham, S.; Pauly, P. The determinants of atmospheric SO2 concentrations: Reconsidering the environmental Kuznets curve. Ecol. Econ. 1998, 25, 209–220. [Google Scholar] [CrossRef]
- Karapetyan, D.; D’Adda, G. Determinants of conservation among the rural poor: A charitable contribution experiment. Ecol. Econ. 2014, 99, 74–87. [Google Scholar] [CrossRef] [Green Version]
- Baek, J.; Gweisah, G. Does income inequality harm the environment? Empirical evidence from the United States. Energy Policy 2013, 62, 1434–1437. [Google Scholar] [CrossRef]
- Baloch, M.A.; Khan, S.U.-D.; Ulucak, Z.Ş.; Ahmad, A. Analyzing the relationship between poverty, income inequality, and CO2 emission in Sub-Saharan African countries. Sci. Total Environ. 2020, 740, 139867. [Google Scholar] [CrossRef]
- Zhang, C.; Zhao, W. Panel estimation for income inequality and CO2 emissions: A regional analysis in China. Appl. Energy 2014, 136, 382–392. [Google Scholar] [CrossRef]
- Jorgenson, A.; Schor, J.; Huang, X. Income Inequality and Carbon Emissions in the United States: A State-level Analysis, 1997–2012. Ecol. Econ. 2017, 134, 40–48. [Google Scholar] [CrossRef]
- Borghesi, S. Income inequality and the environmental Kuznets curve. In Environment, Inequality and Collective Action; Basili, M., Franzini, M., Vercelli, A., Eds.; Routledge: New York, NY, USA; London, UK, 2006. [Google Scholar]
- Wolde-Rufael, Y.; Idowu, S. Income distribution and CO2 emission: A comparative analysis for China and India. Renew. Sustain. Energy Rev. 2017, 74, 1336–1345. [Google Scholar] [CrossRef]
- Ravallion, M.; Heil, M.; Jalan, J. Carbon emissions and income inequality. Oxf. Econ. Pap. 2000, 52, 651–669. [Google Scholar] [CrossRef]
- Du, X.; Li, H. European and American Experiences and Its Implications on Air Pollution Control Strategy in China during the 13th Five-Year Period. Chin. J. Environ. Manag. 2016, 5, 57–62. [Google Scholar] [CrossRef]
- Hao, L.; Wang, Y.; Su, L.; Qin, H. The Evolution Mechanism of China’ s Air Pollution Control Policy Based on Advocacy Coalition Perspective. J. China Univ. Geosci. 2016, 16, 34–43. [Google Scholar] [CrossRef]
- Torras, M.; Boyce, J.K. Income, inequality, and pollution: A reassessment of the environmental Kuznets Curve. Ecol. Econ. 1998, 25, 147–160. [Google Scholar] [CrossRef]
- Scruggs, L.A. Political and economic inequality and the environment. Ecol. Econ. 1998, 26, 259–275. [Google Scholar] [CrossRef]
- Heerink, N.; Mulatu, A.; Bulte, E. Income inequality and the environment: Aggregation bias in environmental Kuznets curves. Ecol. Econ. 2001, 38, 359–367. [Google Scholar] [CrossRef]
- Brännlund, R.; Ghalwash, T. The income–pollution relationship and the role of income distribution: An analysis of Swedish household data. Resour. Energy Econ. 2008, 30, 369–387. [Google Scholar] [CrossRef]
- Kasuga, H.; Takaya, M. Does inequality affect environmental quality? Evidence from major Japanese cities. J. Clean. Prod. 2017, 142, 3689–3701. [Google Scholar] [CrossRef]
- Qi, Y.; Lu, H. Income Inequality, Environmental Quality and Public Health. Bus. Manag. J. 2013, 35, 157–169. [Google Scholar] [CrossRef]
- Bimonte, S. Information access, income distribution, and the Environmental Kuznets Curve. Ecol. Econ. 2002, 41, 145–156. [Google Scholar] [CrossRef]
- Magnani, E. The Environmental Kuznets Curve, environmental protection policy and income distribution. Ecol. Econ. 2000, 32, 431–443. [Google Scholar] [CrossRef]
- Drabo, A. Impact of Income Inequality on Health: Does Environment Quality Matter? Environ. Plan. A Econ. Space 2011, 43, 146–165. [Google Scholar] [CrossRef] [Green Version]
- Jun, Y.; Zhong-Kui, Y.; Peng-Fei, S. Income Distribution, Human Capital and Environmental Quality: Empirical Study in China. Energy Procedia 2011, 5, 1689–1696. [Google Scholar] [CrossRef] [Green Version]
- Liu, Q.; Wang, S.; Zhang, W.; Li, J. Income distribution and environmental quality in China: A spatial econometric perspective. J. Clean. Prod. 2018, 205, 14–26. [Google Scholar] [CrossRef]
- Liu, F.; Zheng, M.; Wang, M. Does air pollution aggravate income inequality in China? An empirical analysis based on the view of health. J. Clean. Prod. 2020, 271, 122469. [Google Scholar] [CrossRef]
- Hill, T.D.; Jorgenson, A.K.; Ore, P.; Balistreri, K.S.; Clark, B. Air quality and life expectancy in the United States: An analysis of the moderating effect of income inequality. SSM Popul. Health 2019, 7, 100346. [Google Scholar] [CrossRef]
- Stern, N. The Economics of Climate Change: The Stern Review; Cambridge University Press: Cambridge, UK; New York, NY, USA, 2006. [Google Scholar]
- Garnaut, R. The Garnaut Climate Change Review: Final Report; Cambridge University Press: Port Melbourne, Australia, 2008. [Google Scholar]
- Weitzman, M.L. On Modeling and Interpreting the Economics of Catastrophic Climate Change. Rev. Econ. Stat. 2009, 91, 1–19. [Google Scholar] [CrossRef]
- Friedman, J.W. A Non-cooperative Equilibrium for Supergames. Rev. Econ. Stud. 1971, 38, 1–12. [Google Scholar] [CrossRef]
- Ostrom, E. A Polycentric Approach for Coping with Climate Change; Policy Research Working Paper 5095; World Bank: Washington, DC, USA, 2009. [Google Scholar]
- Baer, P.; Harte, J.; Haya, B.; Herzog, A.V.; Holdren, J.; Hultman, N.E.; Kammen, D.M.; Norgaard, R.B.; Raymond, L. Climate Change: Equity and Greenhouse Gas Responsibility. Science 2000, 289, 2287. [Google Scholar] [CrossRef]
- Meyer, A. Contraction and Convergence: The Global Solution to Climate Change; Green Books for the Schumacher Society: Totnes, UK, 2000. [Google Scholar]
- Osborne, M.J.; Rubinstein, A. A Course in Game Theory; The MIT Press: Cambridge, MA, USA, 1994. [Google Scholar]
- Finus, M. Game Theory and International Environmental Cooperation; Edward Elgar: Cheltenman, UK; Northampton, MA, USA, 2001. [Google Scholar]
- Yanase, A. Global environment and dynamic games of environmental policy in an international duopoly. J. Econ. 2009, 97, 121–140. [Google Scholar] [CrossRef]
- Nagase, Y.; Silva, E.C. Acid rain in China and Japan: A game-theoretic analysis. Reg. Sci. Urban Econ. 2007, 37, 100–120. [Google Scholar] [CrossRef]
- Chander, P.; Tulkens, H. A core-theoretic solution for the design of cooperative agreements on transfrontier pollution. Int. Tax Public Financ. 1995, 2, 279–293. [Google Scholar] [CrossRef] [Green Version]
- Chander, P.; Tulkens, H. Cooperation, Stability, and Self-Enforcement: A Conceptual Discussion. In The Design of Climate Policy; Guesnerie, R., Tulkens, H., Eds.; MIT Press: Cambridge, MA, USA, 2008; pp. 165–186. [Google Scholar]
- Boadway, R.; Song, Z.; Tremblay, J.-F. The efficiency of voluntary pollution abatement when countries can commit. Eur. J. Political Econ. 2011, 27, 352–368. [Google Scholar] [CrossRef] [Green Version]
- Roemer, J.E. Would Economic Democracy Decrease the Amount of Public Bads? Scand. J. Econ. 1993, 95, 227. [Google Scholar] [CrossRef]
- Boyce, J.K. Inequality as a cause of environmental degradation. Ecol. Econ. 1994, 11, 169–178. [Google Scholar] [CrossRef] [Green Version]
- Golley, J.; Meng, X. Income inequality and carbon dioxide emissions: The case of Chinese urban households. Energy Econ. 2012, 34, 1864–1872. [Google Scholar] [CrossRef]
- Wei, S.; Wang, Q. Research on the Effects of Environmental Policies of North and South Countries—Based on the Game Analysis of Carbon Tax and Carbon Tariff. Financ. Trade Econ. 2015, 11, 012. [Google Scholar] [CrossRef]
- Caparros, A.; Pereau, J.C.; Tazdait, T. North-South Climate Change Negotiations: A Sequential Game with Asymmetric Information. Public Choice 2004, 121, 455–480. [Google Scholar] [CrossRef] [Green Version]
- Mussa, M.; Rosen, S. Monopoly and product quality. J. Econ. Theory 1978, 18, 301–317. [Google Scholar] [CrossRef]
- Gabszewicz, J.J.; Thisse, J.-F. Price competition, quality and income disparities. J. Econ. Theory 1979, 20, 340–359. [Google Scholar] [CrossRef]
- Shaked, A.; Sutton, J. Relaxing Price Competition Through Product Differentiation. Rev. Econ. Stud. 1982, 49, 3–13. [Google Scholar] [CrossRef]
- Wauthy, X. Quality choice in models of vertical differentiation. J. Ind. Econ. 1996, 44, 345–353. [Google Scholar] [CrossRef]
- Wei, S.-J.; Wu, Y. Globalization and Inequality: Evidence from within China; NBER Working Paper No. 8611; NBER: Cambridge, MA, USA, 2001. [Google Scholar] [CrossRef]
- Yao, S.; Zhang, Z.; Feng, G. Rural-urban and regional inequality in output, income and consumption in China under economic reforms. J. Econ. Stud. 2005, 32, 4–24. [Google Scholar] [CrossRef]
- Wan, G.; Lu, M.; Chen, Z. The inequality–Growth Nexus in the Short and Long Run: Empirical Evidence from China. J. Comp. Econ. 2006, 34, 654–667. [Google Scholar] [CrossRef] [Green Version]
- Im, K.; Pesaran, M.; Shin, Y. Testing for Unit Roots in Heterogeneous Panels. J. Econom. 2003, 115, 53–74. [Google Scholar] [CrossRef]
- Harris, R.; Tzavalis, E. Inference for Unit Roots in Dynamic Panels where the time Dimension is Fixed. J. Econom. 1999, 91, 201–226. [Google Scholar] [CrossRef]
- Donkelaar, V.A.; Martin, R.V.; Brauer, M.; Boys, B.L. Use of Satellite Observations for Long-term Exposure Assessment of Global Concentrations of Fine Particulate Matter. Environ. Health Perspect. 2015, 123, 135–143. [Google Scholar] [CrossRef] [PubMed] [Green Version]
- Bourguignon, F.; Morrisson, C. Inequality and development: The role of dualism. J. Dev. Econ. 1998, 57, 233–257. [Google Scholar] [CrossRef]
- Wang, F.; Shackman, J.; Liu, X. Carbon emission flow in the power industry and provincial CO2 emissions: Evidence from cross-provincial secondary energy trading in China. J. Clean. Prod. 2017, 159, 397–409. [Google Scholar] [CrossRef]

| Air Quality Indicators | Obs | Mean | Media | SD | Min | Max | Unit Root Test | |
|---|---|---|---|---|---|---|---|---|
| IPS t-Bar | HT z-Statistic | |||||||
| Annual average SO2 concentration (μg/m3) | 565 | 25.5 | 21.0 | 16.6 | 5 (Haikou, 2015, 2018) | 123 (Zibo, 2014) | −1.681 | 1.408 |
| Annual average NO2 concentration (μg/m3) | 565 | 37.3 | 37.0 | 10.3 | 12 (Haikou, 2017) | 67 (Zibo, 2014) | −2.201 *** | −2.252 ** |
| Average annual PM10 concentration (μg/m3) | 565 | 90.9 | 86.0 | 30.5 | 35 (Haikou, 2016) | 224 (Baoding, 2014) | −2.002 *** | −4.069 *** |
| 95th percentile of average daily CO concentration (μg/m3) | 565 | 1.99 | 1.7 | 0.85 | 0.8 (Haikou, 2017, 2018; Xiamen, 2017; Quanzhou, 2018) | 5.8 (Baoding, 2015) | −1.629 | -8.863 ** |
| 90th percentile of the daily maximum 8-h average O3 concentration (μg/m3) | 565 | 149.8 | 149.0 | 27.2 | 69 (Hefei, 2014) | 218 (Baoding, 2017) | −2.281 *** | −4.512 *** |
| Annual average PM2.5 concentration (μg/m3) | 565 | 52.0 | 52.0 | 17.8 | 18 (Haikou, 2018) | 129 (Baoding, 2014) | −2.117 *** | −3.793 *** |
| Number of days with air quality reaching or exceeding grade II | 565 | 258 | 260 | 61.3 | 79 (Baoding, 2014) | 366 (Panzhihua, 2016) | −2.332 *** | −7.844 *** |
| Variables | URIk,t | lnPCGRPi,t | lnDPi,t | SIPi,t | LnCCk,t | GRi,t | lnFDi,t |
|---|---|---|---|---|---|---|---|
| URIk,t | 1 | ||||||
| lnPCGRPi,t | −0.124 | 1 | |||||
| lnDPi,t | −0.276 | 0.137 | 1 | ||||
| SIPi,t | 0.107 | 0.148 | −0.187 | 1 | |||
| lnCCk,t | −0.464 | 0.067 | 0.303 | −0.092 | 1 | ||
| GRi,t | −0.094 | 0.208 | 0.113 | −0.049 | 0.162 | 1 | |
| lnFDi,t | −0.123 | 0.655 | 0.359 | −0.327 | 0.037 | 0.165 | 1 |
| VIF | 1.325 | 2.516 | 1.334 | 1.547 | 1.384 | 1.076 | 2.930 |
| Dimension | Eigenvalue | Condition Index | Variance Proportions | |||||||
|---|---|---|---|---|---|---|---|---|---|---|
| Constant | URIk,t | lnPCGRPi,t | lnDPi,t | SIPi,t | lnCCk,t | GRi,t | lnFDi,t | |||
| 1 | 7.893 | 1.000 | 0.00 | 0.00 | 0.00 | 0.00 | 0.00 | 0.00 | 0.00 | 0.00 |
| 2 | 0.053 | 12.187 | 0.00 | 0.00 | 0.00 | 0.01 | 0.52 | 0.02 | 0.01 | 0.00 |
| 3 | 0.025 | 17.827 | 0.00 | 0.19 | 0.00 | 0.01 | 0.08 | 0.26 | 0.00 | 0.00 |
| 4 | 0.012 | 25.830 | 0.00 | 0.02 | 0.00 | 0.16 | 0.00 | 0.01 | 0.82 | 0.00 |
| 5 | 0.010 | 27.755 | 0.00 | 0.20 | 0.00 | 0.38 | 0.03 | 0.51 | 0.05 | 0.00 |
| 6 | 0.005 | 38.380 | 0.01 | 0.33 | 0.02 | 0.38 | 0.00 | 0.05 | 0.12 | 0.06 |
| 7 | 0.001 | 86.937 | 0.66 | 0.22 | 0.00 | 0.00 | 0.12 | 0.15 | 0.01 | 0.33 |
| 8 | 0.000 | 137.694 | 0.32 | 0.04 | 0.97 | 0.07 | 0.24 | 0.00 | 0.01 | 0.60 |
| Variables | SO2 | NO2 | PM10 | CO | O3 | PM2.5 | GAQD | ||
|---|---|---|---|---|---|---|---|---|---|
| Ground Monitoring | Satellite Observations | ||||||||
| Income Inequality | Urban–Rural Inequality URIk,t | 65.885 *** (14.431) | 2.906 (6.128) | 52.685 *** (19.252) | 1.936 *** (0.553) | −61.216 ** (26.815) | 47.220 *** (12.195) | 68.540 *** (9.718) | −61.609 (41.796) |
| Social development | Per capita gross regional product lnPCGRPi,t | 10.560 ** (4.686) | 3.290 * (1.990) | 16.755 *** (6.252) | 0.482 *** (0.179) | −2.992 (8.708) | 11.884 *** (3.960) | 6.066 * (3.156) | −37.253 *** (13.573) |
| Population density lnDPi,t | 1.585 (2.096) | −0.493 (0.890) | 5.506 ** (2.797) | 0.032 (0.080) | 2.195 (3.895) | 4.332 ** (1.771) | 0.587 (1.412) | 0.998 (6.071) | |
| Source of pollution | Secondary industries proportion SIPi,t | 0.871 *** (0.142) | 0.155 *** (0.060) | 1.461 *** (0.190) | 0.025 *** (0.005) | −1.600 *** (0.264) | 0.770 *** (0.120) | 0.494 *** (0.096) | −2.094 *** (0.412) |
| Coal consumption lnCCi,t | −3.509 (5.472) | 5.218 ** (2.324) | 13.351 * (7.301) | 0.389 * (0.210) | 15.615 (10.169) | 15.820 *** (4.625) | 4.219 (3.685) | −36.993 ** (15.850) | |
| Greening rate GRi,t | 0.185 (0.130) | 0.093 * (0.055) | 0.293 * (0.174) | 0.004 (0.005) | 0.067 (0.242) | 0.143 (0.110) | -0.093 (0.088) | −0.663 ** (0.378) | |
| Financial development lnFDi,t | −16.192 *** (3.495) | −2.081 (1.484) | −27.751 *** (4.663) | −0.747 *** (0.134) | 25.445 *** (6.494) | −18.755 *** (2.954) | −14.110 *** (2.353) | 27.366 *** (10.122) | |
| Intercept term | −108.324 * (59.421) | −25.602 (25.233) | −116.844 (79.275) | −3.819 * (2.276) | −3.984 (110.416) | −160.914 *** (50.217) | −87.387 ** (40.015) | 881.058 *** (172.104) | |
| Urban fixed effect | Yes | Yes | Yes | Yes | Yes | Yes | Yes | Yes | |
| Sample size | 535 | 535 | 535 | 535 | 535 | 535 | 535 | 535 | |
| Adjusted R2 | 0.716 | 0.866 | 0.854 | 0.842 | 0.642 | 0.823 | 0.846 | 0.826 | |
| Variables | SO2 | NO2 | PM10 | CO | O3 | PM2.5 | GAQD | ||
|---|---|---|---|---|---|---|---|---|---|
| Ground Monitoring | Satellite Observations | ||||||||
| Income inequality | Urban-rural inequality URIk,t | 30.127 *** (8.460) | 13.042 ** (5.181) | 97.159 *** (19.136) | 1.784 *** (0.449) | −22.270 * (12.854) | 45.952 *** (10.883) | 36.448 *** (9.540) | −157.248 *** (36.858) |
| Social development | Per capita gross regional product lnPCGRPi,t | −10.413 *** (2.443) | −3.288 ** (1.496) | −17.598 *** (5.527) | −0.581 *** (0.130) | 3.825 (3.713) | −8.072 *** (3.143) | −0.337 (2.756) | 16.526 (10.646) |
| Population density lnDPi,t | 0.215 (1.059) | 3.471 *** (0.648) | 10.803 *** (2.395) | 0.126 ** (0.056) | 1.842 (1.609) | 9.262 *** (1.362) | 10.334 *** (1.194) | −23.313 *** (4.613) | |
| Source of pollution | Secondary industries proportion SIPi,t | 0.256 *** (0.077) | 0.039 (0.047) | 0.389 ** (0.175) | −0.001 (0.004) | −0.078 (0.118) | 0.199 ** (0.100) | 0.066 (0.087) | -0.368 (0.337) |
| Coal consumption lnCCi,t | 9.658 *** (1.285) | 4.942 *** (0.787) | 21.420 *** (2.908) | 0.360 *** (0.068) | 10.712 *** (1.953) | 10.538 *** (1.654) | 9.410 *** (1.450) | −44.104 *** (5.601) | |
| Greening rate GRi,t | 0.035 (0.142) | −0.142 * (0.087) | −0.411 (0.320) | 0.003 (0.008) | 0.098 (0.215) | −0.129 (0.182) | −0.104 (0.160) | 0.524 (0.617) | |
| Financial development lnFDi,t | 1.562 (1.692) | 5.020 *** (1.036) | 0.348 (3.827) | −0.009 (0.090) | −0.732 (2.571) | −3.437 (2.177) | −5.672 *** (1.908) | 6.663 (7.372) | |
| Intercept term | −31.346 (40.304) | −69.704 *** (24.682) | −180.246 ** 91.169) | 0.788 (2.139) | 86.987 (61.241) | −71.011 (51.849) | −113.085 ** (45.452) | 844.158 *** (175.601) | |
| Urban fixed effect | Yes | Yes | Yes | Yes | Yes | Yes | Yes | Yes | |
| Sample size | 535 | 535 | 535 | 535 | 535 | 535 | 535 | 535 | |
| R2 | 0.747 | 0.941 | 0.871 | 0.861 | 0.977 | 0.877 | 0.856 | 0.935 | |
| IV | Urbanization rate | ||||||||
| Under Identification Test (p-value) | 48.434 *** (0.000) | ||||||||
| Weak Identification Test | 52.459 *** | ||||||||
| Overidentification Test | 0.000 | ||||||||
| Variables | SO2 | PM2.5 | ||||
|---|---|---|---|---|---|---|
| Ground Monitoring | Satellite Observations | |||||
| Urban-rural inequality URIk,t | 125.708 *** (12.965) | 67.327 *** (14.401) | 119.465 *** (11.569) | 48.910 *** (12.120) | 111.960 *** (8.830) | 69.787 *** (9.669) |
| Per capita gross regional product lnPCGRPi,t | 184.394 *** (66.491) | 134.438 ** (83.981) | 224.738 *** (59.334) | 157.044 *** (53.699) | 150.678 *** (45.284) | 113.121 *** (42.844) |
| Squared term of Per capita gross regional product lnPCGRPi,t2 | −8.646 *** (2.985) | −5.596 * (2.974) | −10.483 *** (2.664) | −6.556 *** (2.419) | −7.234 *** (2.033) | −4.835 ** (1.930) |
| Population density lnDPi,t | —— | 0.980 (2.112) | —— | 3.623 ** (1.777) | —— | 0.064 (1.418) |
| Secondary industries proportion SIPi,t | —— | 0.864 *** (0.142) | —— | 0.762 *** (0.119) | —— | 0.488 ** (0.095) |
| Coal consumption lnCCi,t | —— | −3.578 (5.454) | —— | 15.738 *** (4.590) | —— | 4.159 (3.662) |
| Greening rate GRi,t | —— | 0.197 (0.130) | —— | 0.156 (0.109) | —— | -0.083 (0.087) |
| Financial development lnFDi,t | —— | −15.610 *** (3.496) | —— | −18.074 *** (2.942) | —— | −13.608 *** (2.347) |
| Intercept term | −1273.248 *** (371.675) | −798.854 ** (359.566) | −1450.867 *** (331.667) | −969.884 *** (302.593) | −1020.639 *** (253.131) | −683.999 *** (241.421) |
| Urban fixed effect | YES | YES | YES | YES | YES | YES |
| Sample size | 565 | 535 | 565 | 535 | 565 | 535 |
| Adjusted R2 | 0.679 | 0.718 | 0.777 | 0.826 | 0.824 | 0.848 |
| EKC | YES | YES | YES | YES | YES | YES |
| Turning Point of EKC | 42,768 RMB | 164,714 RMB | 45,214 RMB | 159,072 RMB | 33,342 RMB | 120,347 RMB |
| Variables | NO2 | PM10 | CO | O3 | GAQD |
|---|---|---|---|---|---|
| Urban–rural inequality URIk,t | 2.639 (6.138) | 56.374 *** (18.977) | 1.966 *** (0.553) | −62.347 ** (26.861) | −64.810 (41.790) |
| Per capita gross regional product lnPCGRPi,t | −19.659 (27.196) | 333.577 *** (84.085) | 3.000 (2.452) | −100.112 (119.016) | −312.163 * (185.165) |
| Squared term of Per capita gross regional product lnPCGRPi,t2 | 1.036 (1.225) | −14.307 *** (3.787) | −0.114 (0.110) | 4.386 (5.360) | 12.415 (8.340) |
| Population density lnDPi,t | −0.381 (0.900) | 3.959 (2.783) | 0.019 (0.081) | 2.670 (3.940) | 2.340 (6.129) |
| Secondary industries proportion SIPi,t | 0.157 *** (0.060) | 1.442 *** (0.187) | 0.024 *** (0.005) | −1.594 *** (0.264) | −2.078 *** (0.411) |
| Coal consumption lnCCi,t | 5.231 ** (2.325) | 13.173 * (7.187) | 0.387 * (0.210) | 15.670 (10.173) | −36.838 ** (15.827) |
| Greening rate GRi,t | 0.091 (0.055) | 0.322 * (0.171) | 0.004 (0.005) | 0.058 (0.243) | −0.689 * (0.377) |
| Financial development lnFDi,t | −2.188 (1.490) | −26.265 *** (4.607) | −0.735 *** (0.134) | 24.990 *** (6.521) | 26.076 *** (10.145) |
| Intercept term | 102.289 (153.250) | −1882.415 *** (473.816) | −17.854 (13.817) | 537.260 (670.651) | 2413.114 ** (1043.396) |
| Urban fixed effect | YES | YES | YES | YES | YES |
| Sample size | 535 | 535 | 535 | 535 | 535 |
| Adjusted R2 | 0.866 | 0.858 | 0.842 | 0.641 | 0.827 |
| EKC | YES | YES | YES | YES | YES |
| Turning Point of EKC | —— | 115,548 RMB | —— | —— | —— |
Publisher’s Note: MDPI stays neutral with regard to jurisdictional claims in published maps and institutional affiliations. |
© 2021 by the authors. Licensee MDPI, Basel, Switzerland. This article is an open access article distributed under the terms and conditions of the Creative Commons Attribution (CC BY) license (https://creativecommons.org/licenses/by/4.0/).
Share and Cite
Wang, F.; Yang, J.; Shackman, J.; Liu, X. Impact of Income Inequality on Urban Air Quality: A Game Theoretical and Empirical Study in China. Int. J. Environ. Res. Public Health 2021, 18, 8546. https://doi.org/10.3390/ijerph18168546
Wang F, Yang J, Shackman J, Liu X. Impact of Income Inequality on Urban Air Quality: A Game Theoretical and Empirical Study in China. International Journal of Environmental Research and Public Health. 2021; 18(16):8546. https://doi.org/10.3390/ijerph18168546
Chicago/Turabian StyleWang, Feng, Jian Yang, Joshua Shackman, and Xin Liu. 2021. "Impact of Income Inequality on Urban Air Quality: A Game Theoretical and Empirical Study in China" International Journal of Environmental Research and Public Health 18, no. 16: 8546. https://doi.org/10.3390/ijerph18168546
APA StyleWang, F., Yang, J., Shackman, J., & Liu, X. (2021). Impact of Income Inequality on Urban Air Quality: A Game Theoretical and Empirical Study in China. International Journal of Environmental Research and Public Health, 18(16), 8546. https://doi.org/10.3390/ijerph18168546