
Predicting Australian Adults at High Risk of Cardiovascular Disease Mortality Using Standard Risk Factors and Machine Learning

 ,
,  and
and
Abstract
1. Introduction
2. Materials and Methods
2.1. Study Sample
2.2. Risk Factors and CVD Mortality
2.3. Participant Numbers and Missing Values
2.4. Framingham Risk Prediction Model
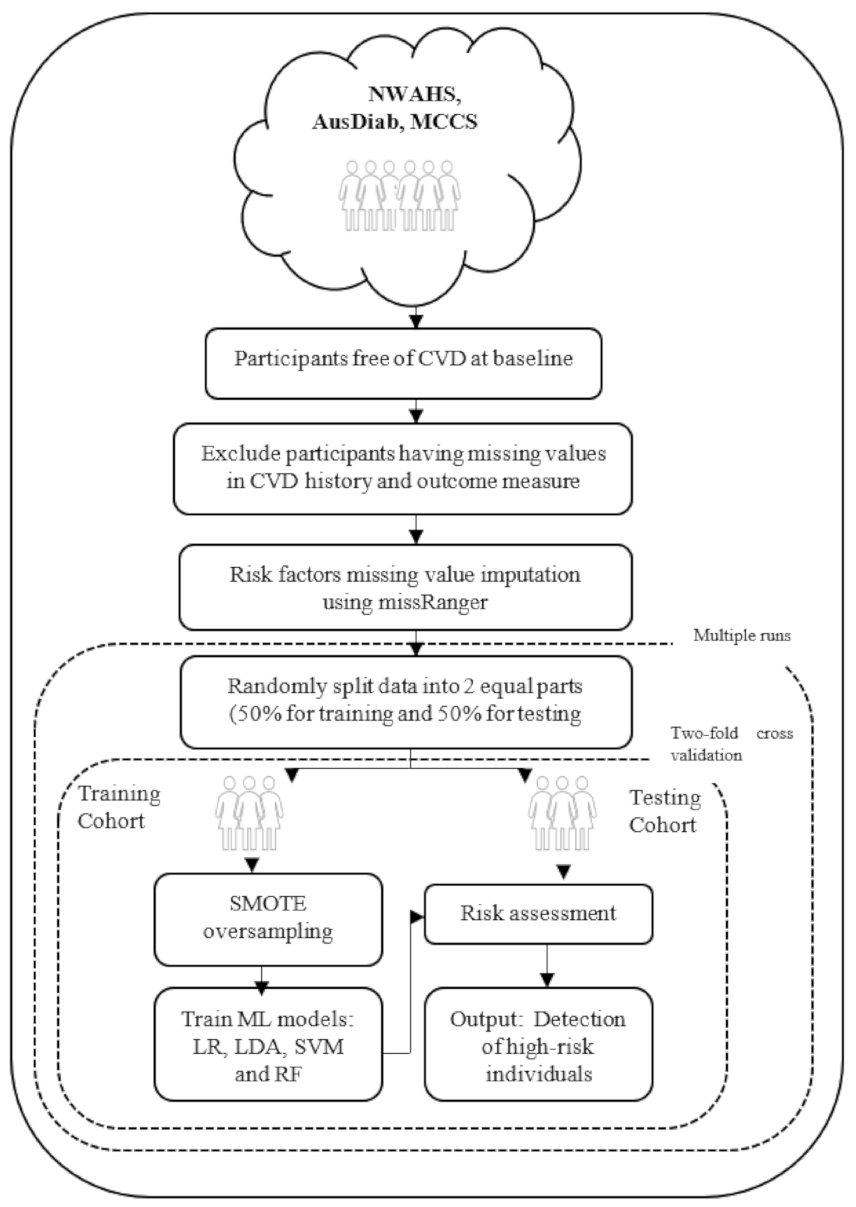
2.5. Machine Learning Risk Prediction Model
2.6. Software
2.7. Statistical Analysis
2.8. Ethics Approval
3. Results
3.1. Sex Stratification
3.2. Diabetes Stratification
3.3. External Validation
4. Discussion
5. Conclusions
Author Contributions
Funding
Institutional Review Board Statement
Informed Consent Statement
Data Availability Statement
Acknowledgments
Conflicts of Interest
References
- Australian Institute of Health and Welfare. Cardiovascular Disease. Canberra: Australian Institute of Health and Welfare. Available online: https://www.aihw.gov.au/reports/heart-stroke-vascular-diseases/cardiovascular-health-compendium (accessed on 15 October 2020).
- World Health Organisation. Cardiovascular Diseases (CVDs); World Health Organisation: Geneva, Switzerland, 2017; Available online: https://www.who.int/news-room/fact-sheets/detail/cardiovascular-diseases-(cvds) (accessed on 15 October 2020).
- Damen, J.A.A.G.; Hooft, L.; Schuit, E.; Debray, T.P.A.; Collins, G.S.; Tzoulaki, I.; Lassale, C.M.; Siontis, G.C.M.; Chiocchia, V.; Roberts, C.; et al. Prediction models for cardiovascular disease risk in the general population: Systematic review. BMJ 2016, 353, i2416. [Google Scholar] [CrossRef] [PubMed]
- Pylypchuk, R.; Wells, S.; Kerr, A.; Poppe, K.; Riddell, T.; Harwood, M.; Exeter, D.; Mehta, S.; Grey, C.; Wu, B.P.; et al. Cardiovascular disease risk prediction equations in 400 000 primary care patients in New Zealand: A derivation and validation study. Lancet 2018, 391, 1897–1907. [Google Scholar] [CrossRef]
- Weng, S.F.; Reps, J.; Kai, J.; Garibaldi, J.M.; Qureshi, N. Can machine-learning improve cardiovascular risk prediction using routine clinical data? PLoS ONE 2017, 12, e0174944. [Google Scholar] [CrossRef] [PubMed]
- Beswick, A.D.; Brindle, P.; Fahey, T.; Ebrahim, S. A systematic review of risk scoring methods and clinical decision aids used in the primary prevention of coronary heart disease. R. Coll. Gen. Pract. [GRA] 2008, 4, 105. [Google Scholar]
- Goh, L.G.H.; Welborn, T.A.; Dhaliwal, S.S. Independent external validation of cardiovascular disease mortality in women utilising Framingham and SCORE risk models: A mortality follow-up study. BMC Women’s Health 2014, 14, 118. [Google Scholar] [CrossRef]
- Goldstein, B.A.; Navar, A.M.; Carter, R.E. Moving beyond regression techniques in cardiovascular risk prediction: Applying machine learning to address analytic challenges. Eur. Hear. J. 2016, 38, 1805–1814. [Google Scholar] [CrossRef]
- Shameer, K.; Johnson, K.W.; Glicksberg, B.S.; Dudley, J.T.; Sengupta, P.P. Machine learning in cardiovascular medicine: Are we there yet? Hear. 2018, 104, 1156–1164. [Google Scholar] [CrossRef]
- Alaa, A.M.; Bolton, T.; Di Angelantonio, E.; Rudd, J.H.F.; Van Der Schaar, M. Cardiovascular disease risk prediction using automated machine learning: A prospective study of 423,604 UK Biobank participants. PLoS ONE 2019, 14, e0213653. [Google Scholar] [CrossRef]
- Ambale-Venkatesh, B.; Yang, X.; Wu, C.O.; Liu, K.; Hundley, W.G.; McClelland, R.; Gomes, A.S.; Folsom, A.R.; Shea, S.; Guallar, E.; et al. Cardiovascular event prediction by machine learning: The multi-ethnic study of atherosclerosis. Circ. Res. 2017, 121, 1092–1101. [Google Scholar] [CrossRef]
- Kakadiaris, I.A.; Vrigkas, M.; Yen, A.A.; Kuznetsova, T.; Budoff, M.; Naghavi, M. Machine learning outperforms ACC/AHA CVD risk calculator in MESA. J. Am. Heart Assoc. 2018, 7, e009476. [Google Scholar] [CrossRef]
- Krittanawong, C.; Virk, H.U.H.; Bangalore, S.; Wang, Z.; Johnson, K.W.; Pinotti, R.; Zhang, H.; Kaplin, S.; Narasimhan, B.; Kitai, T.; et al. Machine learning prediction in cardiovascular diseases: A meta-analysis. Sci. Rep. 2020, 10, 16057. [Google Scholar] [CrossRef]
- Albarqouni, L.; Doust, J.A.; Magliano, D.; Barr, E.L.; Shaw, J.E.; Glasziou, P.P. External validation and comparison of four cardiovascular risk prediction models with data from the Australian Diabetes, Obesity and Lifestyle study. Med. J. Aust. 2019, 210, 161–167. [Google Scholar] [CrossRef]
- Hastie, T.; Tibshirani, R.; Friedman, J. The Elements of Statistical Learning: Data Mining, Inference, and Prediction; Springer Science & Business Media: New York, NY, USA, 2009. [Google Scholar]
- Grant, J.F.; Taylor, A.W.; Ruffin, R.E.; Wilson, D.H.; Phillips, P.J.; Adams, R.J.T.; Price, K. North West Adelaide Health Study Team: Cohort profile: The North West Adelaide Health Study. Int. J. Epidemiol. 2009, 38, 1479–1486. [Google Scholar] [CrossRef]
- Dunstan, D.W.; Zimmet, P.Z.; Welborn, T.A.; Cameron, A.J.; Shaw, J.; de Courten, M.; Jolley, D.; McCarty, D.J.; AusDiab Steering Committee. The Australian diabetes, obesity and lifestyle study (AusDiab)—methods and response rates. Diabetes Res. Clin. Pract. 2002, 57, 119–129. [Google Scholar] [CrossRef]
- Milne, R.L.; Fletcher, A.S.; MacInnis, R.J.; Hodge, A.M.; Hopkins, A.H.; Bassett, J.K.; Bruinsma, F.J.; Lynch, B.M.; Dugué, P.A.; Jayasekara, H.; et al. Cohort Profile: The Melbourne Collaborative Cohort Study (Health 2020). Int. J. Epidemiology 2017, 46, 1757–1757i. [Google Scholar] [CrossRef] [PubMed]
- Mayer, M.; Mayer, M.M. Fast Imputation of Missing Values: Package ‘missRanger’. 2019. Version 2.1.0. Available online: https://cran.uni-muenster.de/web/packages/missRanger/missRanger.pdf (accessed on 15 October 2020).
- Shah, A.D.; Bartlett, J.W.; Carpenter, J.; Nicholas, O.; Hemingway, H. Comparison of Random Forest and Parametric Imputation Models for Imputing Missing Data Using MICE: A CALIBER Study. Am. J. Epidemiol. 2014, 179, 764–774. [Google Scholar] [CrossRef]
- D’agostino, R.B.; Vasan, R.S.; Pencina, M.J.; Wolf, P.A.; Cobain, M.; Massaro, J.M.; Kannel, W.B. General cardiovascular risk profile for use in primary care. Circulation 2008, 117, 743–753. [Google Scholar] [CrossRef]
- Chawla, N.V.; Bowyer, K.W.; Hall, L.O.; Kegelmeyer, W.P. SMOTE: Synthetic minority over-sampling technique. J. Artif. Intell. Res. 2002, 16, 321–357. [Google Scholar] [CrossRef]
- Breiman, L. Random forests. Mach. Learn. 2001, 45, 5–32. [Google Scholar] [CrossRef]
- MATLAB; Version. 9.5; 0.944444 (R2018b); The MathWorks Inc.: Natick, MA, USA, 2018.
- Pedregosa, F.; Varoquaux, G.; Gramfort, A.; Michel, V.; Thirion, B.; Grisel, O.; Blondel, M.; Prettenhofer, P.; Weiss, R.; Dubourg, V.; et al. Scikit-learn: Machine learning in Python. J. Mach. Learn. Res. 2011, 12, 2825–2830. [Google Scholar]
- Yang, J.; Yao, D.; Zhan, X.; Zhan, X. Predicting disease risks using feature selection based on random forest and support vector machine. In Proceedings of the International Symposium on Bioinformatics Research and Applications, Zhangjiajie, China, 28–30 June 2014; Springer: Cham, Switzerland, 2014; pp. 1–11. [Google Scholar]
- Isiadinso, I.; Wenger, N.K. Do We Need a Different Approach to Assess Cardiovascular Risk in Women? US Cardiol. Rev. 2017, 11. [Google Scholar] [CrossRef]
- Bucholz, E.M.; Butala, N.M.; Rathore, S.S.; Dreyer, R.P.; Lansky, A.J.; Krumholz, H.M. Sex differences in long-term mortality after myocardial infarction: A systematic review. Circulation 2014, 130, 757–767. [Google Scholar] [CrossRef] [PubMed]
- Gore, M.O.; McGuire, D.K.; Lingvay, I.; Rosenstock, J. Predicting Cardiovascular Risk in Type 2 Diabetes: The Heterogeneity Challenges. Curr. Cardiol. Rep. 2015, 17, 1–9. [Google Scholar] [CrossRef]
- Sajeev, S.; Maeder, A. Cardiovascular risk prediction models: A scoping review. In Proceedings of the Australasian Computer Science Week Multiconference, Sydney, Australia, 29–31 January 2019; pp. 1–5. [Google Scholar]
- Tang, F.; Ishwaran, H. Random forest missing data algorithms. Stat. Anal. Data Min. ASA Data Sci. J. 2017, 10, 363–377. [Google Scholar] [CrossRef]


| Risk Factor | Data Collection Methods | Measures |
|---|---|---|
| Age | Self-report | Years |
| Sex | Self-report | Male/Female |
| Total Cholesterol | Biomedical measure | Fasting blood sample Lipids |
| High-density lipoprotein (HDL) Cholesterol | ||
| Systolic blood pressure | Biomedical measure | Dinamap/mercury sphygmomanometer, average of two recorded measures |
| Hypertension medication | Self-report | No/Yes |
| Diabetes | Self-report or biological measure | Told by a doctor that they have diabetesFasting plasma glucose (FPG) level of at least 7.0 mmol/L |
| Smoking status | Self-report | No/Yes |
| North West Adelaide Health Study (NWAHS) | Australian Diabetes, Obesity, and Lifestyle (AusDiab) | Melbourne Collaborative Cohort Study (MCCS) | Combined | |||||
|---|---|---|---|---|---|---|---|---|
| Summary | Missing | Summary | Missing | Summary | Missing | Summary | Missing | |
| n | 3654 | 10,150 | 32,611 | 46,305 | ||||
| Age, y | 48.5 ± 15.8 | nil | 50.0 ± 7.5 | nil | 54.4 ± 8.6 | nil | 53.0 ± 10.9 | nil |
| Male, n% | 1693 (46.3) | nil | 4437 (43.7) | nil | 12,790 (39.3) | nil | 18,919 (40.8) | nil |
| Female, n% | 1961 (53.7) | nil | 5713 (56.3) | nil | 19,722 (60.7) | nil | 27,386 (59.2) | nil |
| Total cholesterol (mg/dL) | 94.9 ± 18.8 | 41 | 102.1 ± 23.4 | 2 | 99.2 ± 19.0 | 151 | 99.5 ± 19.1 | 194 |
| HDL cholesterol (mg/dL) | 24.7 ± 6.8 | 41 | 25.8 ± 1.6 | 4 | 29.4 ± 7.9 | 10,503 | 29.7 ± 42.4 | 10,548 |
| Systolic blood pressure (mm Hg) | 126.6 ± 17.9 | 0 | 128.4 ± 7.5 | 54 | 135.9 ± 18.7 | 117 | 133.5 ± 18.9 | 171 |
| Hypertension medication, n% | 451 (12.3) | 0 | 792 (7.8) | 98 | 4671 (14.4) | 94 | 6452(13.9) | 192 |
| Diabetes, n% | 233 (6.4) | 13 | 1252 (12.3) | 169 | 1051 (3.2) | 9 | 3791(8.2) | 191 |
| Smoker | 1957 (53.6) | 22 | 2124 (20.9) | 212 | 13,382 (41.2) | 10 | 19,833(42.8) | 244 |
| History of CVD | 326 | 6 | 938 | 142 | 7035 | nil | 8299 | 148 |
| CVD death, n% | 121 (3.3) | 70 | 341 (3.4) | 17 | 520 (1.6) | 1867 | 982(2.1) | 1954 |
| Models | Area-under-curve (AUC) (95% CI) | p Value | Difference from Framingham |
|---|---|---|---|
| NWAHS | |||
| BL: Framingham Score | 0.837 (0.792–0.882) | – | – |
| ML: Logistic Regression | 0.874 (0.833–0.915) | <0.001 | +3.7% |
| ML: Linear Discriminant Analysis | 0.874 (0.833–0.915) | <0.001 | +3.7% |
| ML: Support Vector Machine | 0.873 (0.832–0.914) | <0.001 | +3.6% |
| ML: Random Forest | 0.854 (0.811–0.897) | 0.0162 | +1.7% |
| AusDiab | |||
| BL: Framingham Score | 0.850 (0.824–0.876) | – | – |
| ML: Logistic Regression | 0.900 (0.878–0.922) | <0.001 | +5.0% |
| ML: Linear Discriminant Analysis | 0.901 (0.879–0.923) | <0.001 | +5.1% |
| ML: Support Vector Machine | 0.902 (0.880–0.924) | <0.001 | +5.2% |
| ML: Random Forest | 0.891 (0.868–0.914) | <0.001 | +4.1% |
| MCCS | |||
| BL: Framingham Score | 0.754 (0.730–0.778) | – | – |
| ML: Logistic Regression | 0.753 (0.729–0.777) | 0.230 | −0.1% |
| ML: Linear Discriminant Analysis | 0.756 (0.732–0.780) | 0.070 | +0.2% |
| ML: Support Vector Machine | 0.758 (0.734–0.782) | 0.008 | +0.4% |
| ML: Random Forest | 0.781 (0.757–0.805) | <0.001 | +2.7% |
| Combined | |||
| BL: Framingham Score | 0.802 (0.783–0.817) | – | |
| ML: Logistic Regression | 0.852 (0.837–0.867) | <0.001 | +5.1% |
| ML: Linear Discriminant Analysis | 0.852 (0.837–0.867) | <0.001 | +5.1% |
| ML: Support Vector Machine | 0.851 (0.836–0.866) | <0.001 | +5.1% |
| ML: Random Forest | 0.832 (0.814–0.848) | 0.001 | +3.0% |
| Models | Sensitivity | Specificity | Precision | NRI % (95%) | p Value |
|---|---|---|---|---|---|
| NWAHS | |||||
| BL: Framingham Score | 41.3 | 91.3 | 14.0 | – | |
| ML: Logistic Regression | 79.5 | 81.7 | 13.2 | 28.5 (25.9–30.5) | <0.001 |
| ML: Linear Discriminant Analysis | 77.7 | 84.1 | 14.5 | 29.1 (26.1–30.6) | <0.001 |
| ML: Support Vector Machine | 80.7 | 81.0 | 12.9 | 29.0 (26.0–31.8) | <0.001 |
| ML: Random Forest | 79.4 | 80.8 | 12.7 | 27.5 (25.7–29.6) | <0.001 |
| AusDiab | |||||
| BL: Framingham Score | 57.1 | 88.2 | 14.4 | – | |
| ML: Logistic Regression | 84.6 | 84.1 | 16.1 | 23.3 (21.1–25.2) | <0.001 |
| ML: Linear Discriminant Analysis | 85.2 | 84.0 | 15.7 | 23.8 (20.7–26.1) | <0.001 |
| ML: Support Vector Machine | 84.0 | 85.4 | 16.7 | 24.1 (22.7–27.7) | <0.001 |
| ML: Random Forest | 84.3 | 83.6 | 15.3 | 22.5 (20.5–24.4) | <0.001 |
| MCCS | |||||
| BL: Framingham Score | 31.2 | 91.4 | 5.6 | – | |
| ML: Logistic Regression | 71.1 | 68.4 | 3.5 | 16.9 (13.6–19.9) | <0.001 |
| ML: Linear Discriminant Analysis | 70.4 | 69.5 | 3.6 | 17.3 (14.1–20.2) | <0.001 |
| ML: Support Vector Machine | 72.0 | 68.1 | 3.6 | 17.5 (13.6–20.4) | <0.001 |
| ML: Random Forest | 81.6 | 63.1 | 3.5 | 22.1 (19.1–24.8) | <0.001 |
| Combined | |||||
| BL: Framingham Score | 41.5 | 90.7 | 8.8 | – | |
| ML: Logistic Regression | 81.0 | 77.7 | 8.1 | 26.5 (20.1–29.8) | <0.001 |
| ML: Linear Discriminant Analysis | 80.5 | 78.2 | 8.2 | 26.5 (20.0–29.9) | <0.001 |
| ML: Support Vector Machine | 80.8 | 77.8 | 8.1 | 26.4 (19.8–29.5) | <0.001 |
| ML: Random Forest | 77.4 | 76.9 | 6.8 | 22.0 (16.5–27.5) | <0.001 |
| NWAHS | AusDiab | MCCS | Combined | ||||
|---|---|---|---|---|---|---|---|
| Variable | Score | Variable | Score | Variable | Score | Variable | Score |
| Age | 0.412 | Age | 0.429 | Age | 0.422 | Age | 0.563 |
| Systolic blood pressure | 0.251 | Systolic blood pressure | 0.301 | Systolic blood pressure | 0.222 | Systolic blood pressure | 0.201 |
| Hypertension Medication | 0.141 | Hypertension medication | 0.116 | Hypertension medication | 0.141 | Hypertension medication | 0.125 |
| Diabetes status | 0.089 | Diabetes status | 0.077 | HDL | 0.105 | Diabetes status | 0.070 |
| Tot. Cholesterol | 0.057 | HDL | 0.036 | Tot. Cholesterol | 0.066 | HDL | 0.020 |
| HDL | 0.028 | Tot. Cholesterol | 0.028 | Diabetes status | 0.032 | Sex | 0.011 |
| Sex | 0.011 | Sex | 0.008 | Sex | 0.005 | Tot. Cholesterol | 0.008 |
| Smoking status | 0.010 | Smoking status | 0.004 | Smoking status | 0.004 | Smoking status | 0.005 |
| Models | AUC (95% CI) | p Value | Difference from Framingham |
|---|---|---|---|
| Men | |||
| BL: Framingham Score | 0.799 (0.776–0.823) | – | – |
| ML: Logistic Regression | 0.816 (0.793–0.839) | <0.001 | +1.7% |
| ML: Linear Discriminant Analysis | 0.818 (0.795–0.841) | <0.001 | +1.9% |
| ML: Support Vector Machine | 0.818 (0.795–0.841) | <0.001 | +1.9% |
| ML: Random Forest | 0.812(0.791–0.837) | <0.001 | +1.7% |
| Women | |||
| BL: Framingham Score | 0.836 (0.814–0.858) | – | – |
| ML: Logistic Regression | 0.871 (0.851–0.892) | <0.001 | +3.5% |
| ML: Linear Discriminant Analysis | 0.869 (0.848–0.890) | <0.001 | +3.4% |
| ML: Support Vector Machine | 0.870 (0.850–0.891) | <0.001 | +3.4% |
| ML: Random Forest | 0.854 (0.833–0.876) | < 0.001 | +2.0% |
| Models | Sensitivity | Specificity | Precision | NRI % (95%) | p Value |
|---|---|---|---|---|---|
| Men | |||||
| BL: Framingham Score | 66.3 | 79.3 | 8.0 | – | |
| ML: Logistic Regression | 75.9 | 75.8 | 8.6 | 6.1 (5.0–8.4) | <0.001 |
| ML: Linear Discriminant Analysis | 76.2 | 75.5 | 8.8 | 6.1 (5.0–8.8) | <0.001 |
| ML: Support Vector Machine | 76.1 | 76.0 | 8.6 | 6.5 (6.1–7.7) | <0.001 |
| ML: Random Forest | 77.1 | 74.0 | 7.6 | 5.5 (4.0–6.4) | <0.001 |
| Women | |||||
| BL: Framingham Score | 15.6 | 98.5 | 15.7 | – | |
| ML: Logistic Regression | 83.4 | 79.1 | 7.7 | 48.4 (46.4–50.1) | <0.001 |
| ML: Linear Discriminant Analysis | 81.9 | 80.8 | 8.6 | 48.7 (46.0–50.0) | <0.001 |
| ML: Support Vector Machine | 83.4 | 79.4 | 8.1 | 48.7 (47.3–49.6) | <0.001 |
| ML: Random Forest | 80.6 | 77.6 | 6.1 | 44.1 (43.6–46.5) | <0.001 |
| Models | AUC (95% CI) | p Value | Difference from Framingham |
|---|---|---|---|
| Diabetes | |||
| BL: Framingham Score | 0.734 (0.696–0.771) | – | – |
| ML: Logistic Regression | 0.823 (0.790–0.856) | <0.001 | +9.0% |
| ML: Linear Discriminant Analysis | 0.824 (0.791–0.857) | <0.001 | +9.1% |
| ML: Support Vector Machine | 0.824 (0.791–0.857) | <0.001 | +9.0% |
| ML: Random Forest | 0.800 (0.766–0.835) | <0.001 | +6.6% |
| Non-Diabetes | |||
| BL: Framingham Score | 0.789 (0.770–0.88) | – | – |
| ML: Logistic Regression | 0.842 (0.824–0.860) | <0.001 | +5.3% |
| ML: Linear Discriminant Analysis | 0.843 (0.825–0.861) | <0.001 | +5.4% |
| ML: Support Vector Machine | 0.844 (0.826–0.862) | <0.001 | +5.5% |
| ML: Random Forest | 0.831 (0.813–0.850) | <0.001 | +4.2% |
| Models | Sensitivity | Specificity | Precision | NRI % (95%) | p Value |
|---|---|---|---|---|---|
| Diabetes | |||||
| BL: Framingham Score | 70.1 | 63.4 | 11.1 | – | |
| ML: Logistic Regression | 78.8 | 72.7 | 16.0 | 17.9 (15.1–19.6) | <0.001 |
| ML: Linear Discriminant Analysis | 80.0 | 72.2 | 16.0 | 18.7 (16.9–20.0) | <0.001 |
| ML: Support Vector Machine | 79.6 | 72.2 | 15.8 | 18.2 (15.6–20.0) | <0.001 |
| ML: Random Forest | 79.7 | 70.7 | 15.3 | 16.8 (14.5–19.2) | <0.001 |
| Non-Diabetes | |||||
| BL: Framingham Score | 32.6 | 93.0 | 7.7 | – | |
| ML: Logistic Regression | 81.2 | 75.3 | 5.7 | 30.8 (28.6–34.2) | <0.001 |
| ML: Linear Discriminant Analysis | 83.7 | 73.1 | 5.6 | 31.2 (27.6–34.4) | <0.001 |
| ML: Support Vector Machine | 80.2 | 76.2 | 6.6 | 30.8 (28.7–34.0) | <0.001 |
| ML: Random Forest | 77.4 | 76.7 | 5.7 | 28.5 (26.4–32.5) | <0.001 |
| Models | AUC | Sensitivity | Specificity | Precision | NRI |
|---|---|---|---|---|---|
| BL: Framingham Score | 0.837 | 41.3 | 91.3 | 14.0 | - |
| ML: Logistic Regression | 0.879 | 76.0 | 85.7 | 15.4 | 29.1 |
| ML: Linear Discriminant Analysis | 0.880 | 75.2 | 86.8 | 16.4 | 29.4 |
| ML: Support Vector Machine | 0.880 | 72.5 | 89.0 | 18.5 | 28.9 |
| ML: Random Forest | 0.866 | 79.4 | 80.4 | 12.2 | 27.2 |
| Men | |||||
| BL: Framingham Score | 0.841 | 72.1 | 82.4 | 13.3 | - |
| ML: Logistic Regression | 0.858 | 73.8 | 83.8 | 14.6 | 3.1 |
| ML: Linear Discriminant Analysis | 0.857 | 73.7 | 83.5 | 14.3 | 2.7 |
| ML: Support Vector Machine | 0.856 | 73.9 | 84.6 | 14.8 | 1.3 |
| ML: Random Forest | 0.846 | 72.13 | 82.65 | 13.5 | 0.28 |
| Women | |||||
| BL: Framingham Score | 0.871 | 10.5 | 97.4 | 22.2 | - |
| ML: Logistic Regression | 0.898 | 87.3 | 78.8 | 11.6 | 58.2 |
| ML: Linear Discriminant Analysis | 0.898 | 88.1 | 78.6 | 11.7 | 58.8 |
| ML: Support Vector Machine | 0.900 | 88.4 | 78.4 | 13.5 | 58.9 |
| ML: Random Forest | 0.891 | 84.5 | 83.1 | 11.6 | 59.7 |
| Diabetes | |||||
| BL: Framingham Score | 0.675 | 66.7 | 57.8 | 15.3 | - |
| ML: Logistic Regression | 0.744 | 74.4 | 71.4 | 23.1 | 21.3 |
| ML: Linear Discriminant Analysis | 0.741 | 75.0 | 70.5 | 22.5 | 21.0 |
| ML: Support Vector Machine | 0.738 | 75.8 | 65.3 | 19.8 | 16.6 |
| ML: Random Forest | 0.706 | 62.5 | 79.1 | 25.4 | 17.1 |
| Non-Diabetes | |||||
| BL: Framingham Score | 0.841 | 35.1 | 93.4 | 13.5 | - |
| ML: Logistic Regression | 0.889 | 80.4 | 83.6 | 12.5 | 35.5 |
| ML: Linear Discriminant Analysis | 0.888 | 83.5 | 80.4 | 11.1 | 35.4 |
| ML: Support Vector Machine | 0.890 | 87.6 | 76.0 | 9.7 | 35.1 |
| ML: Random Forest | 0.866 | 78.4 | 81.9 | 11.0 | 31.8 |
Publisher’s Note: MDPI stays neutral with regard to jurisdictional claims in published maps and institutional affiliations. |
© 2021 by the authors. Licensee MDPI, Basel, Switzerland. This article is an open access article distributed under the terms and conditions of the Creative Commons Attribution (CC BY) license (http://creativecommons.org/licenses/by/4.0/).
Share and Cite
Sajeev, S.; Champion, S.; Beleigoli, A.; Chew, D.; Reed, R.L.; Magliano, D.J.; Shaw, J.E.; Milne, R.L.; Appleton, S.; Gill, T.K.; et al. Predicting Australian Adults at High Risk of Cardiovascular Disease Mortality Using Standard Risk Factors and Machine Learning. Int. J. Environ. Res. Public Health 2021, 18, 3187. https://doi.org/10.3390/ijerph18063187
Sajeev S, Champion S, Beleigoli A, Chew D, Reed RL, Magliano DJ, Shaw JE, Milne RL, Appleton S, Gill TK, et al. Predicting Australian Adults at High Risk of Cardiovascular Disease Mortality Using Standard Risk Factors and Machine Learning. International Journal of Environmental Research and Public Health. 2021; 18(6):3187. https://doi.org/10.3390/ijerph18063187
Chicago/Turabian StyleSajeev, Shelda, Stephanie Champion, Alline Beleigoli, Derek Chew, Richard L. Reed, Dianna J. Magliano, Jonathan E. Shaw, Roger L. Milne, Sarah Appleton, Tiffany K. Gill, and et al. 2021. "Predicting Australian Adults at High Risk of Cardiovascular Disease Mortality Using Standard Risk Factors and Machine Learning" International Journal of Environmental Research and Public Health 18, no. 6: 3187. https://doi.org/10.3390/ijerph18063187
APA StyleSajeev, S., Champion, S., Beleigoli, A., Chew, D., Reed, R. L., Magliano, D. J., Shaw, J. E., Milne, R. L., Appleton, S., Gill, T. K., & Maeder, A. (2021). Predicting Australian Adults at High Risk of Cardiovascular Disease Mortality Using Standard Risk Factors and Machine Learning. International Journal of Environmental Research and Public Health, 18(6), 3187. https://doi.org/10.3390/ijerph18063187