Physical Activity, Screen Time, and Emotional Well-Being during the 2019 Novel Coronavirus Outbreak in China

 , , , ,
Abstract
1. Introduction
2. Materials and Methods
2.1. Study Population
2.2. Procedures
2.3. Statistical Analysis
3. Results
3.1. Survey Respondents
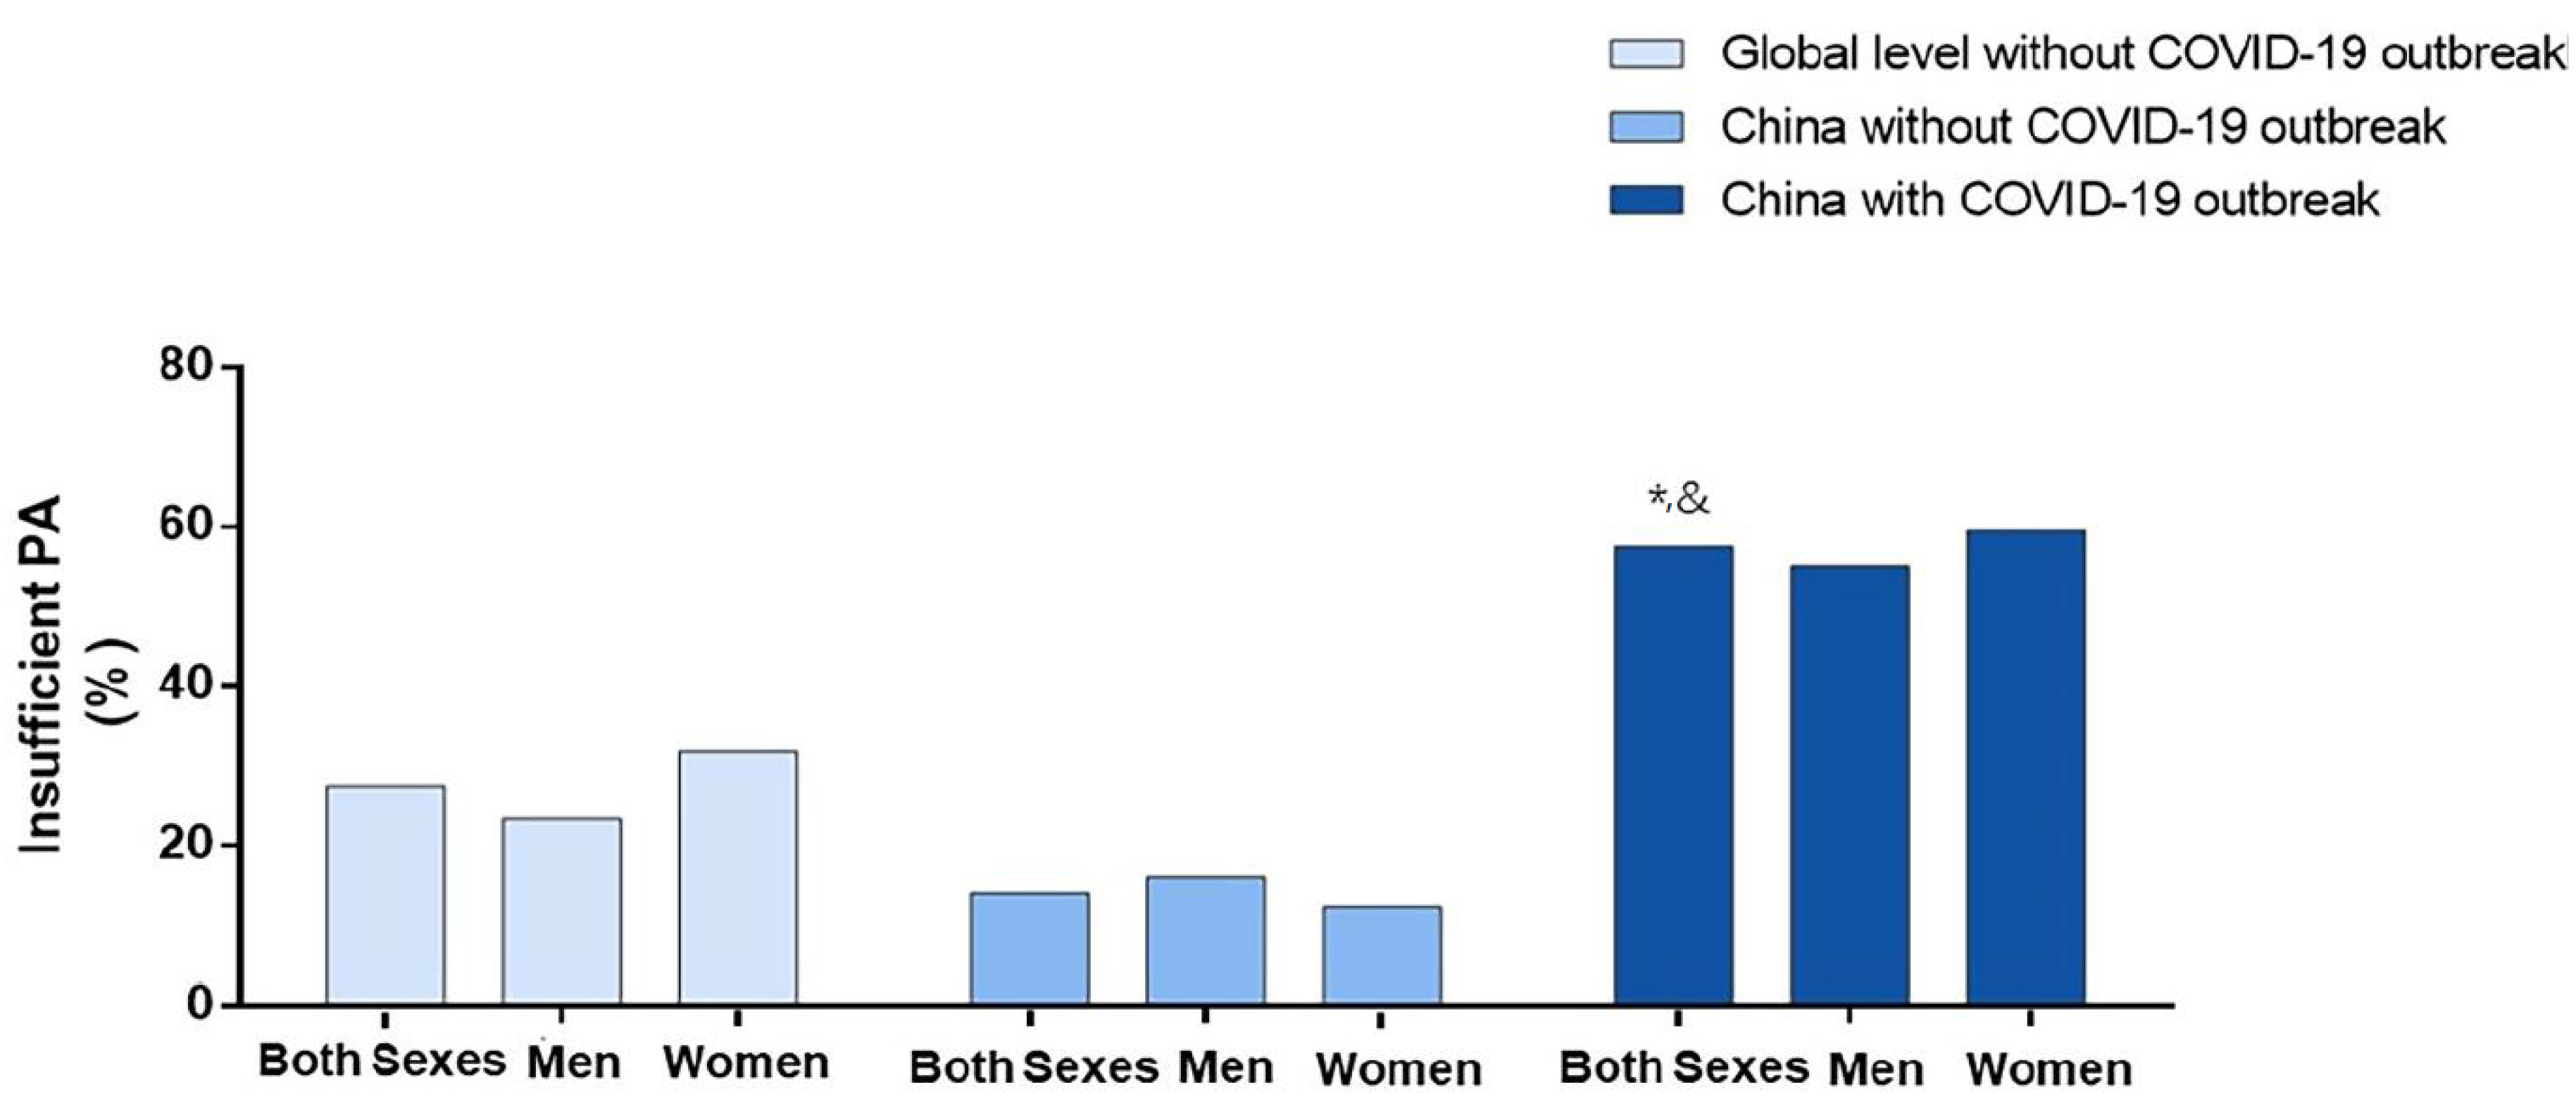
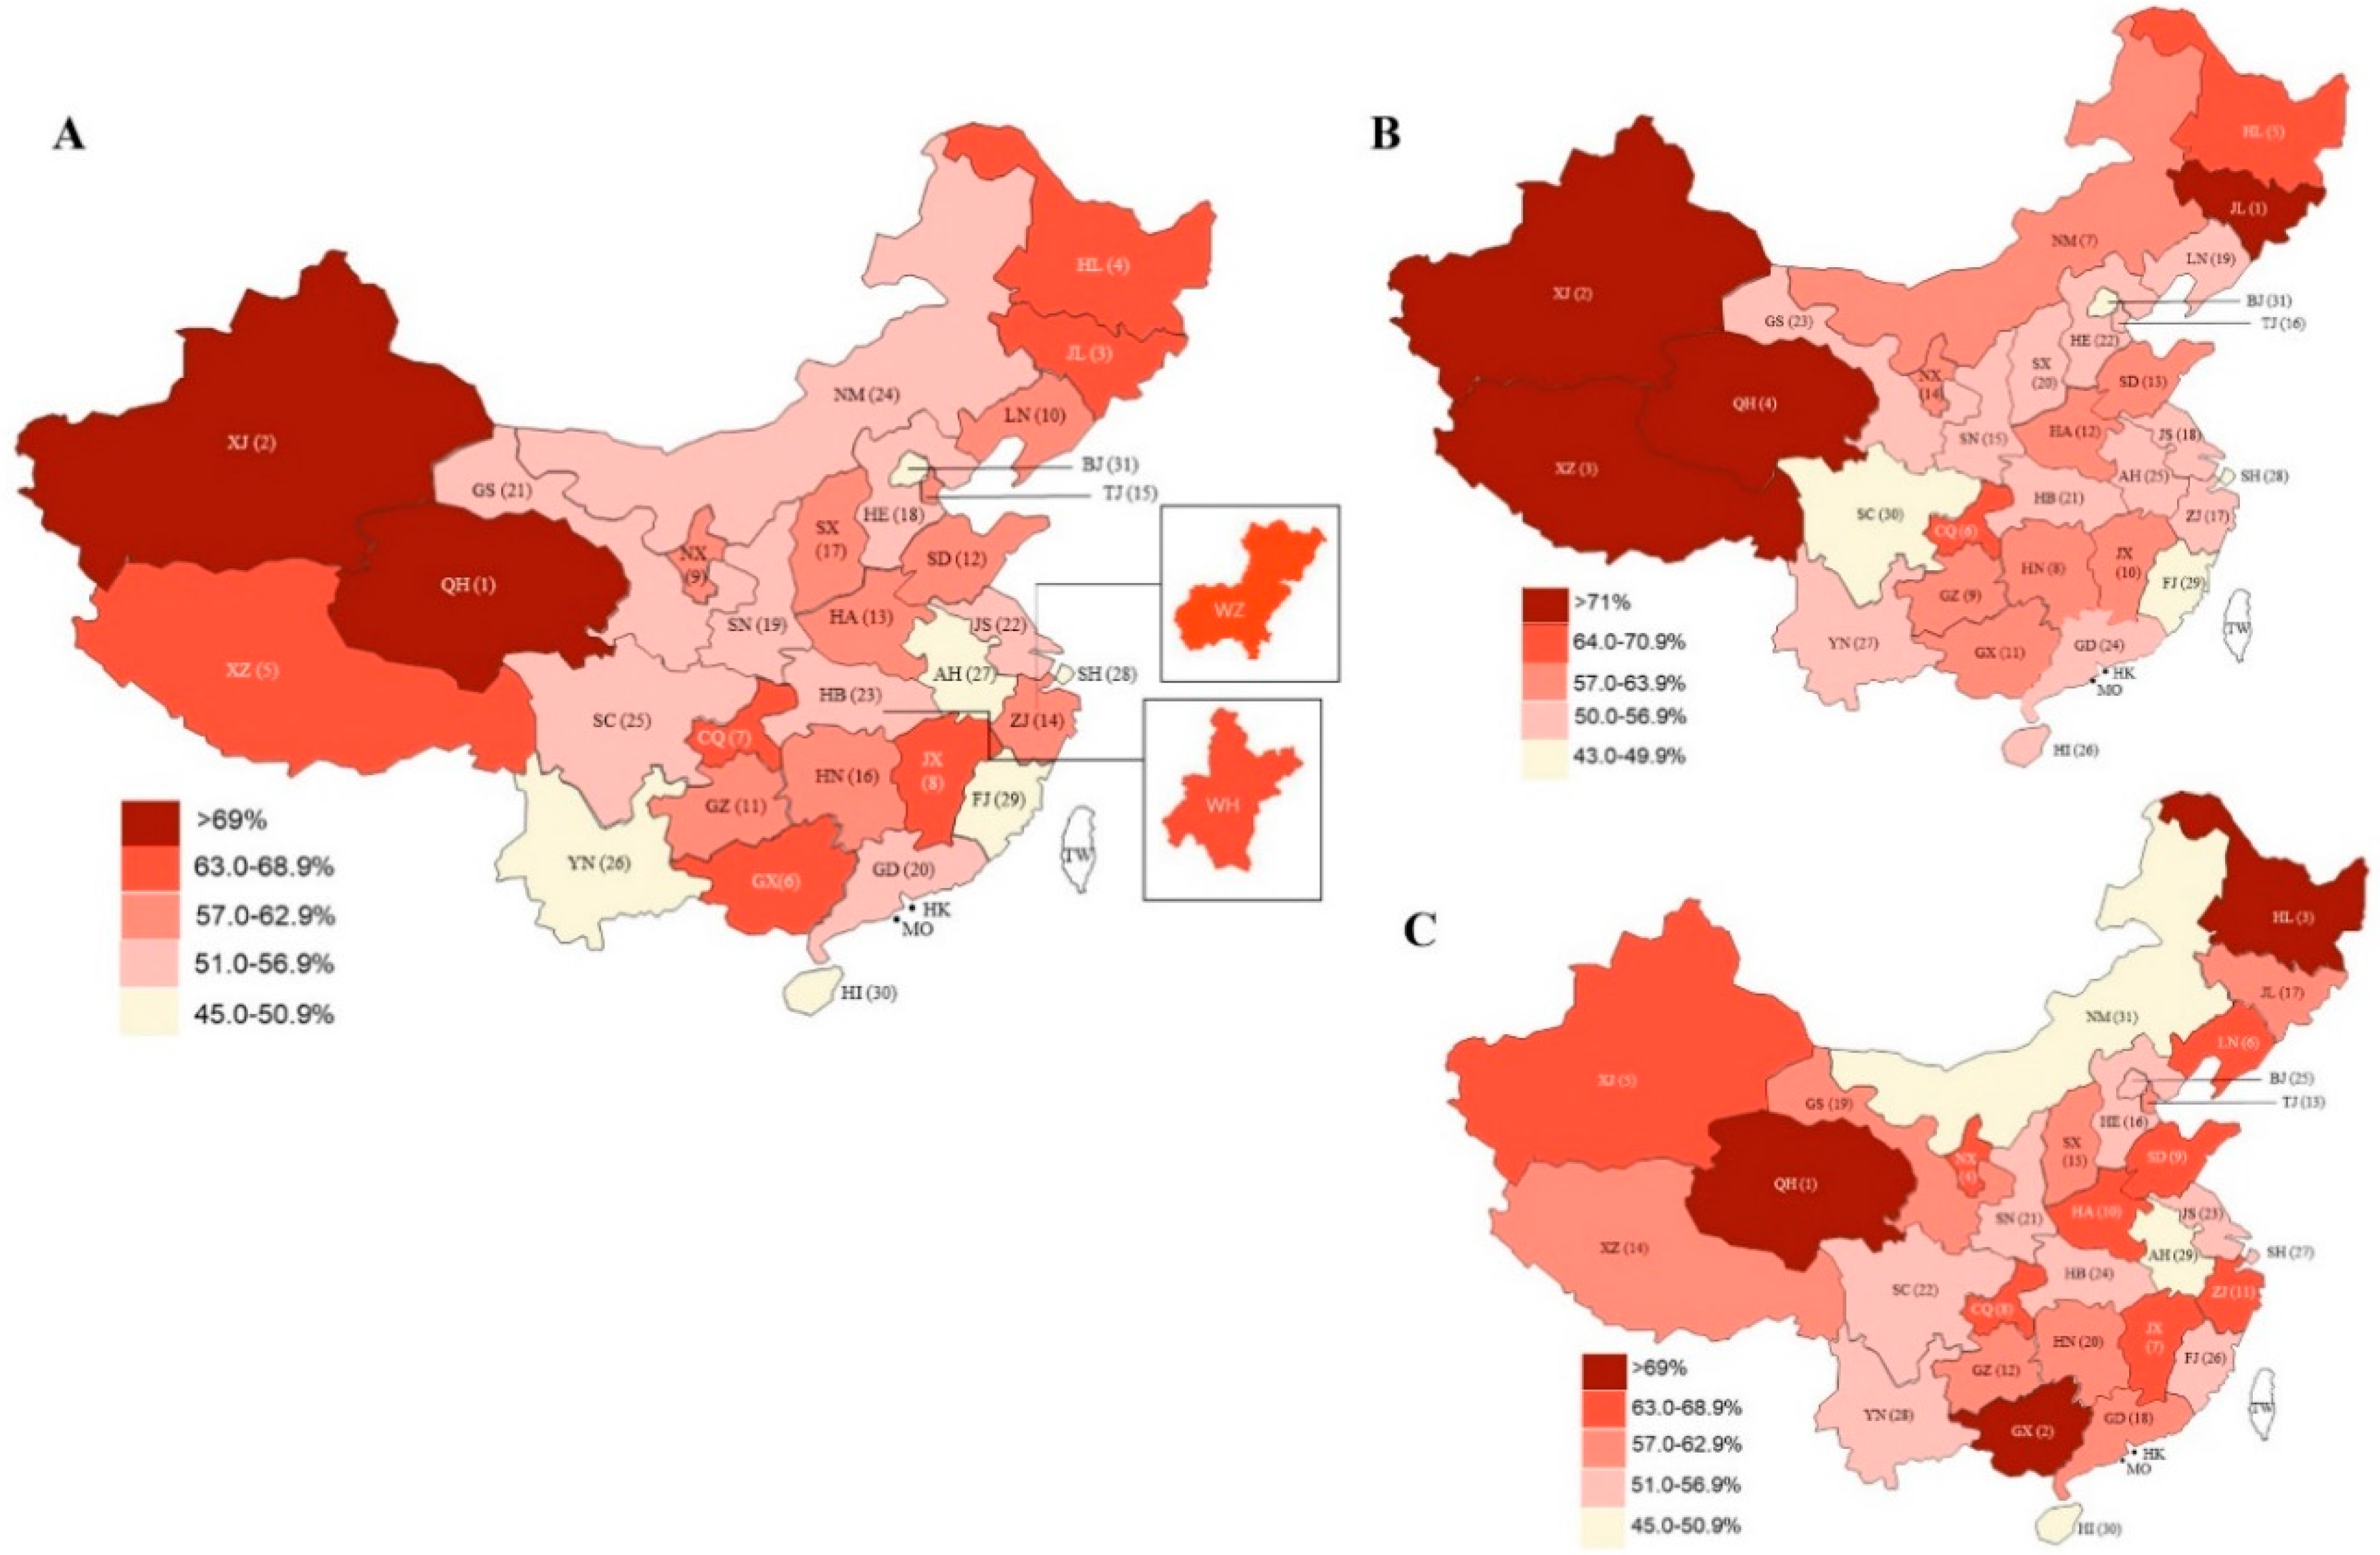
3.2. Physical Activity Impact
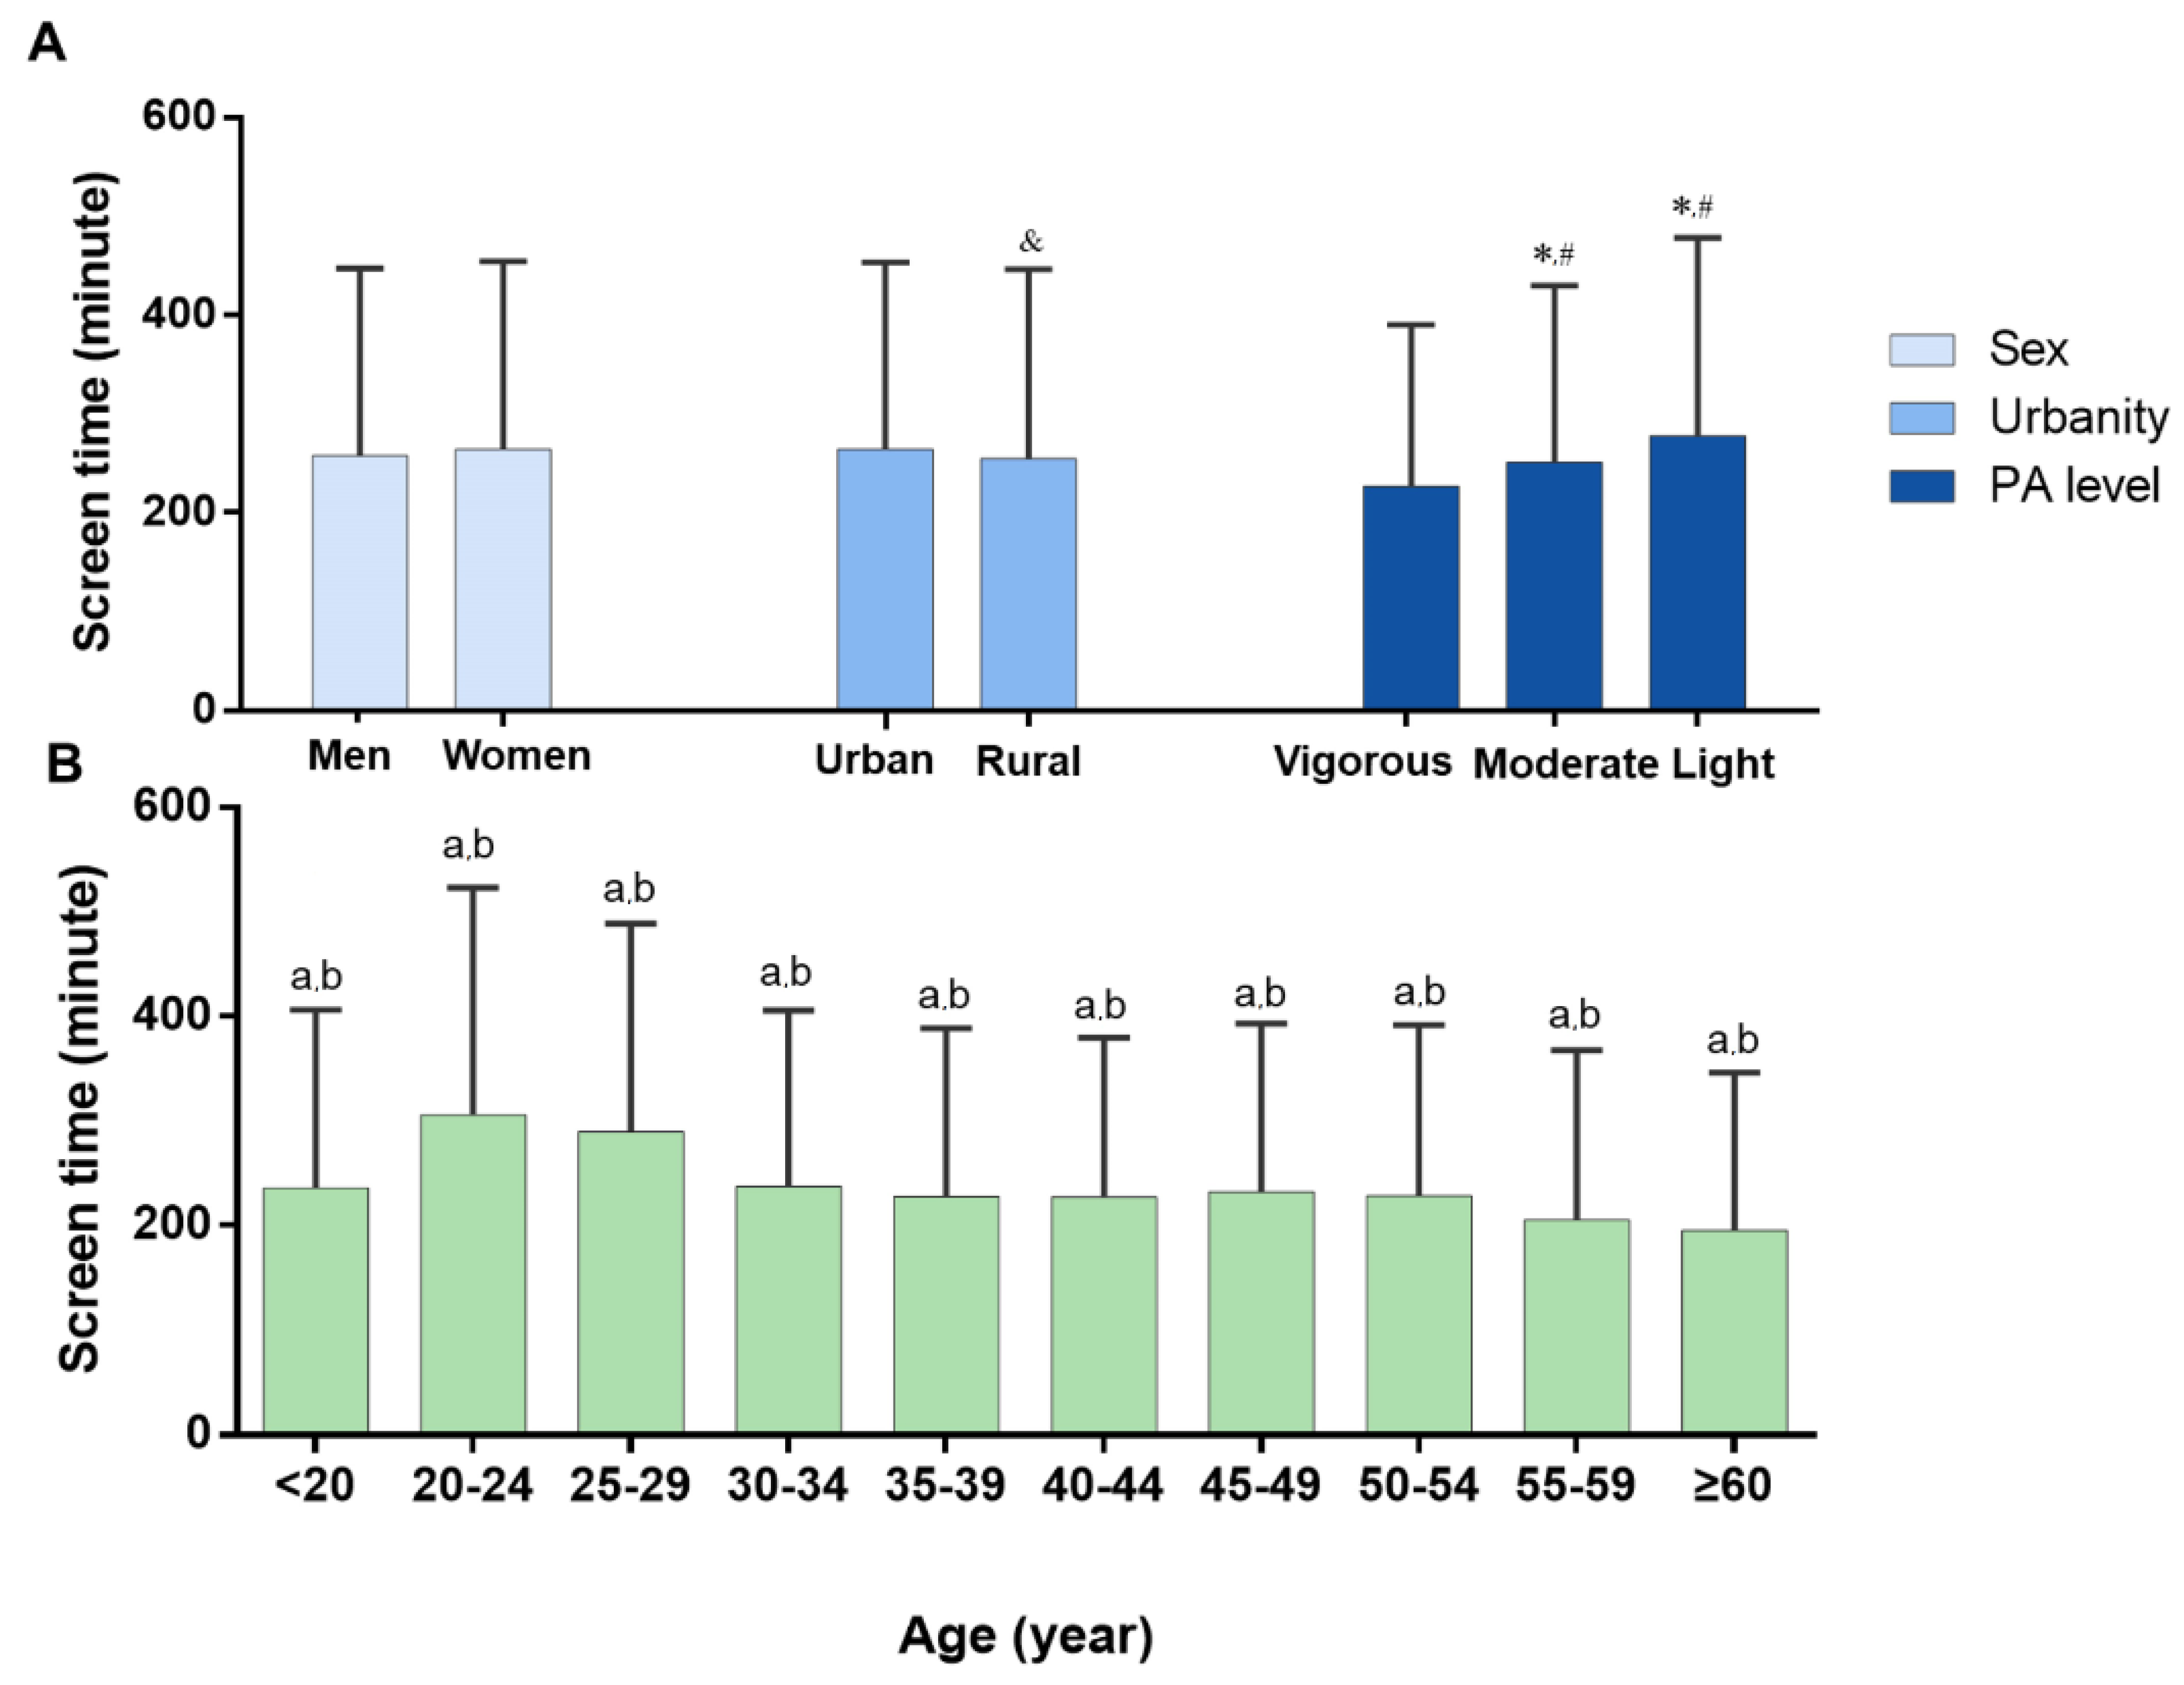
3.3. Screen Time Impact
3.4. Emotional Well-Being Impact
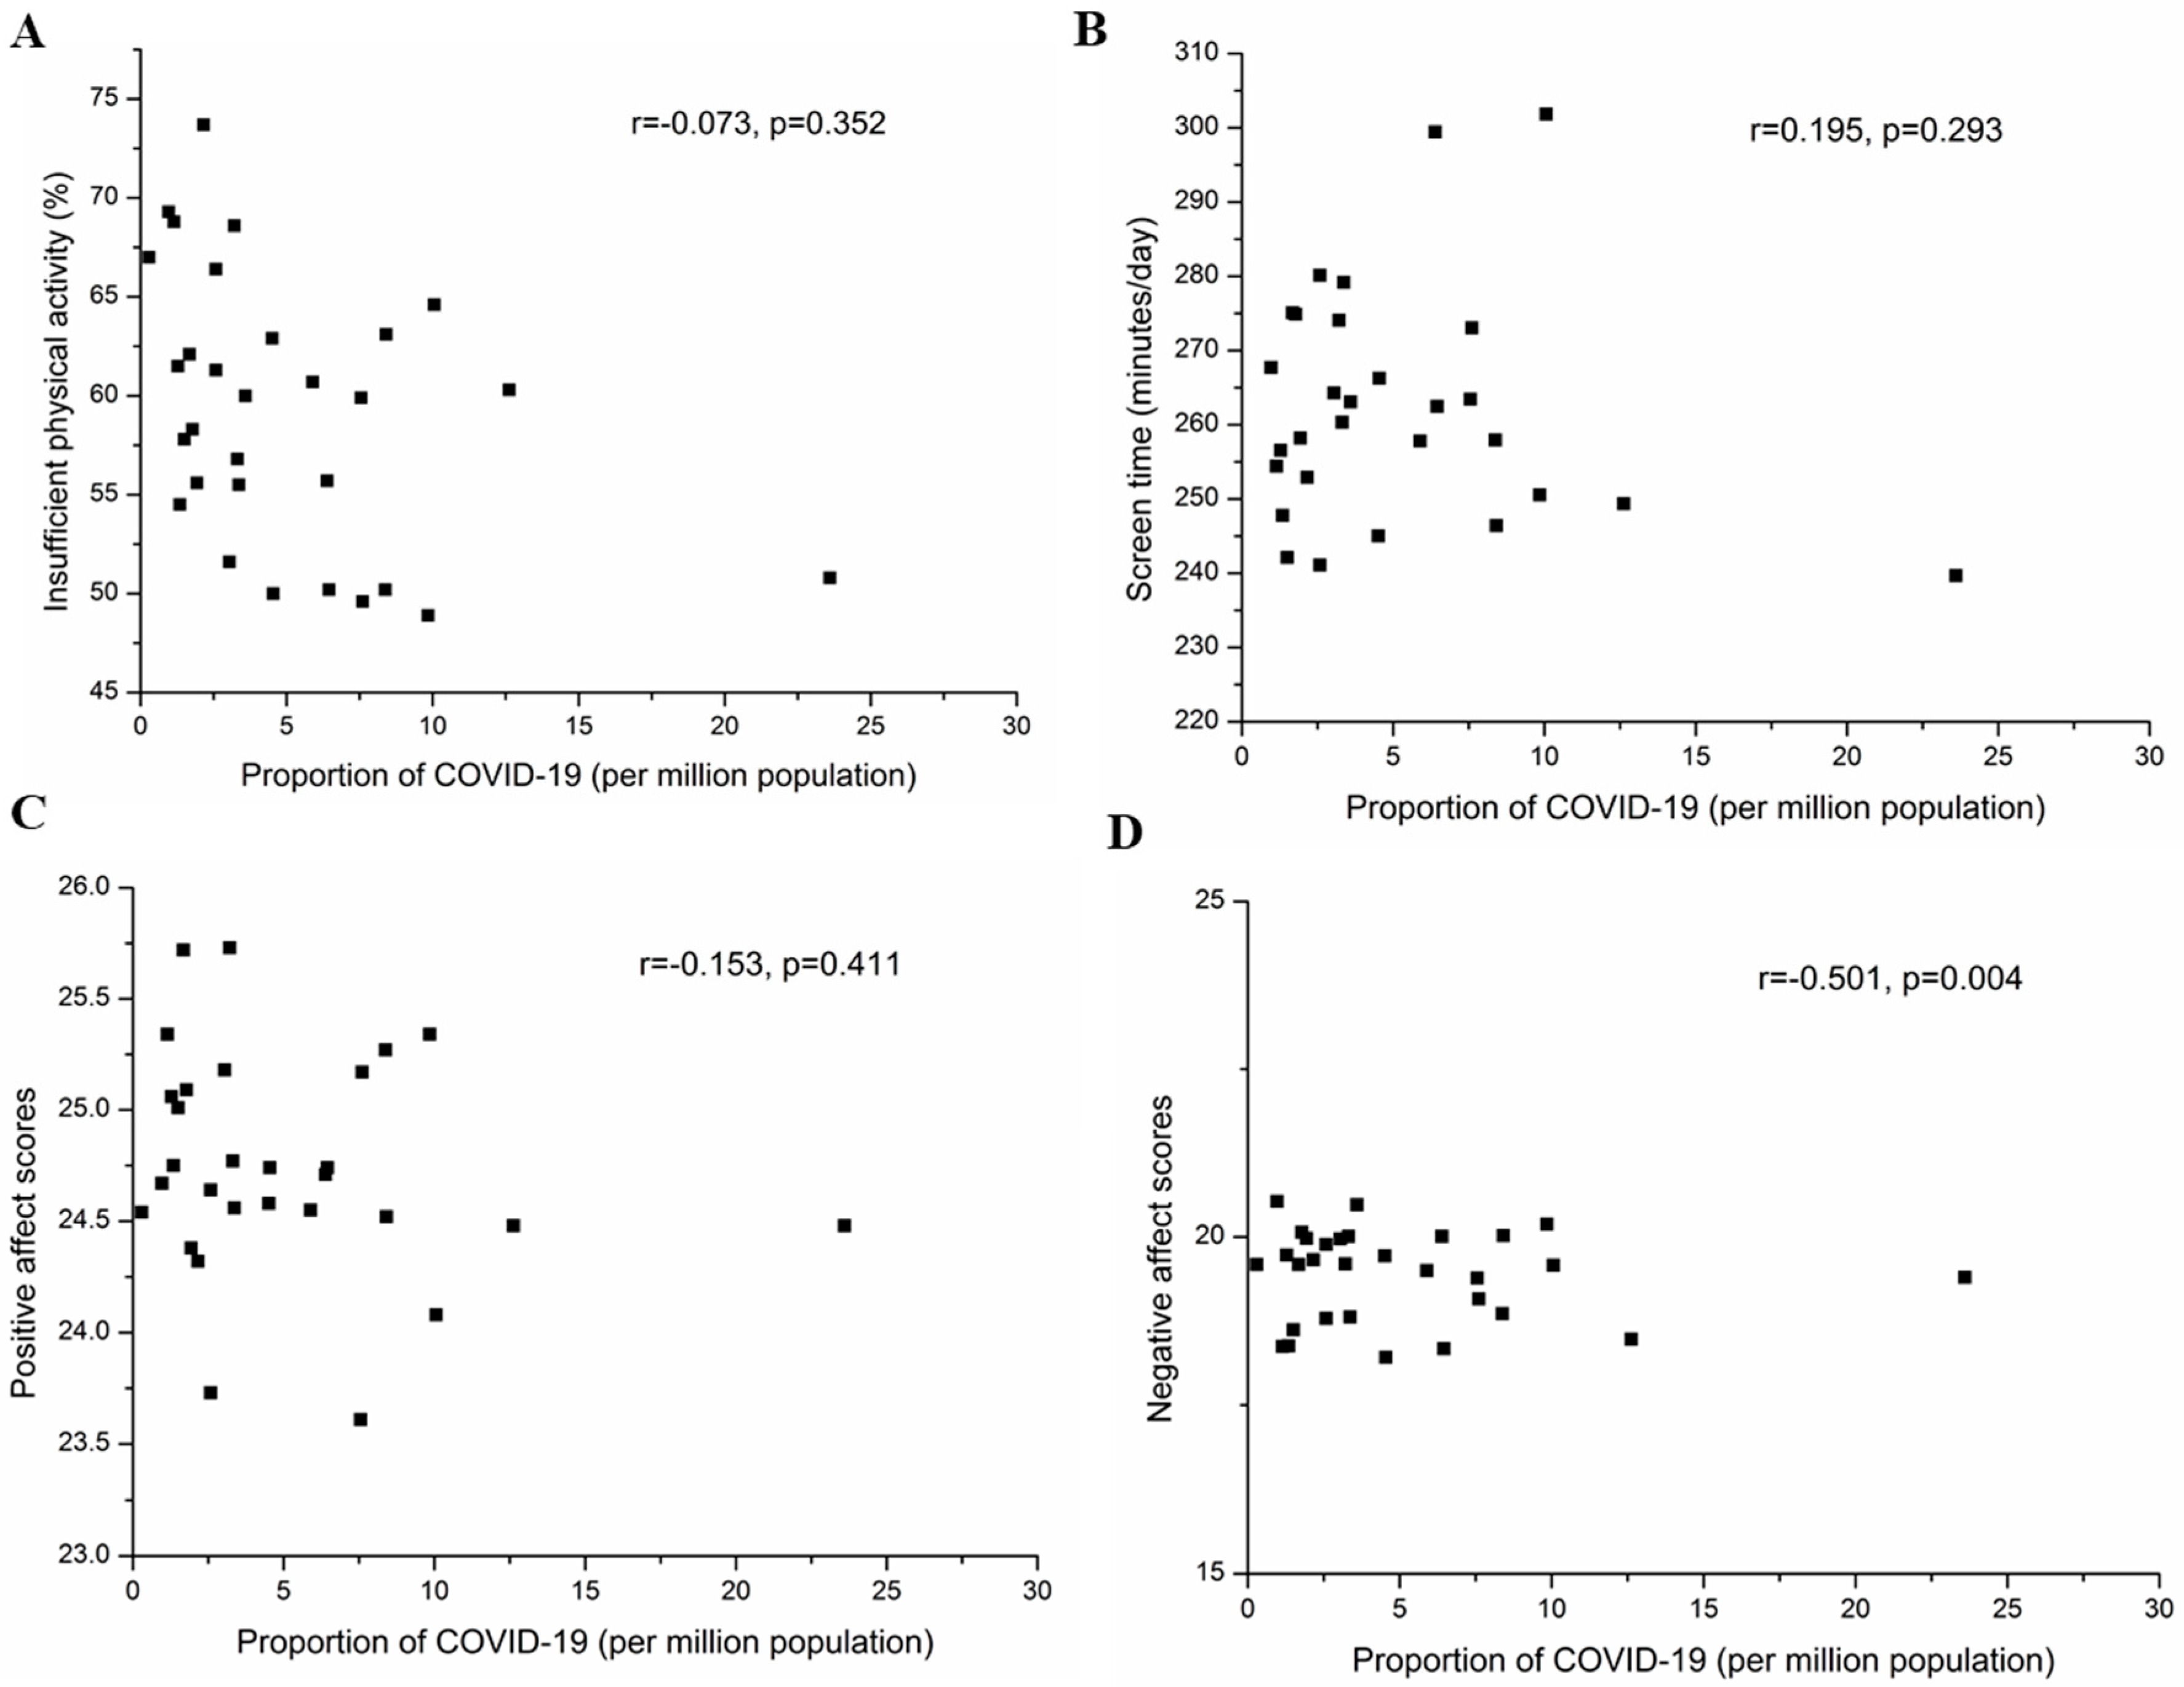
3.5. Correlations of Provincial Levels of Lifestyle and Emotional State with Proportion of Confirmed COVID-19 Cases in 31 Provinces of Mainland China
4. Discussion
5. Conclusions
Author Contributions
Funding
Acknowledgments
Conflicts of Interest
Appendix

| Province | Targeted Survey Sampling Number | Total Population Size |
|---|---|---|
| Guangdong | 600 ± 200 | Large sample |
| Shandong | 600 ± 200 | Large sample |
| Henan | 600 ± 200 | Large sample |
| Sichuan | 600 ± 200 | Large sample |
| Jiangsu | 600 ± 200 | Large sample |
| Hebei | 600 ± 200 | Large sample |
| Hunan | 600 ± 200 | Large sample |
| Anhui | 600 ± 200 | Large sample |
| Hubei | 600 ± 200 | Large sample |
| Zhejiang | 600 ± 200 | Large sample |
| Beijing | 600 ± 200 | Large sample |
| Shanghai | 600 ± 200 | Large sample |
| Guangxi | 350 ± 100 | Medium sample |
| Yunnan | 350 ± 100 | Medium sample |
| Jiangxi | 350 ± 100 | Medium sample |
| Liaoning | 350 ± 100 | Medium sample |
| Heilongjiang | 350 ± 100 | Medium sample |
| Shananxi | 350 ± 100 | Medium sample |
| Fujian | 350 ± 100 | Medium sample |
| Shanxi | 350 ± 100 | Medium sample |
| Guizhou | 350 ± 100 | Medium sample |
| Chongqing | 200 ± 50 | Small sample |
| Jilin | 200 ± 50 | Small sample |
| Gansu | 200 ± 50 | Small sample |
| Inner mongolia | 200 ± 50 | Small sample |
| Xinjiang | 200 ± 50 | Small sample |
| Tianjin | 200 ± 50 | Small sample |
| Hainan | 150 ± 50 | Tiny sample |
| Ningxia | 150 ± 50 | Tiny sample |
| Qinghai | 150 ± 50 | Tiny sample |
| Tibet | 150 ± 50 | Tiny sample |
| Category | Criteria |
|---|---|
| Vigorous | meeting at least one of the following criteria (a) vigorous–intensity activity on at least 3 days achieving a minimum of at least 1500 MET–min/week OR (b) 7 or more days of any combination of walking, moderate–intensity or vigorous intensity activities achieving a minimum of at least 3000 MET–min/week |
| Moderate | (a) 3 or more days of vigorous activity of at least 25 min per day OR (b) 5 or more days of moderate–intensity activity or walking of at least 30 min per day OR (c) 5 or more days of any combination of walking, moderate–intensity or vigorous intensity activities achieving a minimum of at least 600 MET–min/week. |
| Light | Those individuals who not meet criteria for Categories 1 or 2 |
| Men and Women | Men | Women | ||||||||||
|---|---|---|---|---|---|---|---|---|---|---|---|---|
| Total Sample Size | Number of Insufficient Physical Activity | The Prevalence of Insufficient Physical Activity % (95% CI) | Rank | Total Sample Size | Number of Insufficient Physical Activity | The Prevalence of Insufficient Physical Activity % (95% CI) | Rank | Total Sample Size | Number of Insufficient Physical Activity | The Prevalence of Insufficient Physical Activity % (95% CI) | Rank | |
| Qinghai | 133 | 98 | 73.7% (66.2–81.2) | 1 | 60 | 44 | 73.3% (61.7–83.3) | 4 | 73 | 54 | 74.0% (64.4–83.6) | 1 |
| Xinjiang | 137 | 95 | 69.3% (61.3–76.6) | 2 | 48 | 36 | 75.0% (60.4–85.4) | 2 | 89 | 59 | 66.3% (56.2–75.3) | 5 |
| Jilin | 160 | 110 | 68.8% (61.3–75.6) | 3 | 87 | 66 | 75.9% (66.7–85.1) | 1 | 73 | 44 | 60.3% (49.3–71.2) | 17 |
| Heilongjiang | 220 | 151 | 68.6% (62.7–74.5) | 4 | 77 | 52 | 67.5% (57.1–77.9) | 5 | 143 | 99 | 69.2% (61.5–76.2) | 3 |
| Tibet | 91 | 61 | 67.0% (57.1–75.8) | 5 | 39 | 29 | 74.4% (59.0–87.2) | 3 | 52 | 32 | 61.5% (48.1–73.1) | 14 |
| Guangxi | 330 | 219 | 66.4% (61.5–71.2) | 6 | 124 | 73 | 58.9% (50.0–67.7) | 11 | 146 | 206 | 70.9% (64.1–76.2) | 2 |
| Chongqing | 178 | 115 | 64.6% (57.9–71.9) | 7 | 99 | 64 | 64.6% (54.5–73.7) | 6 | 79 | 51 | 64.6% (54.5–74.7) | 8 |
| Jiangxi | 358 | 226 | 63.1% (57.8–68.2) | 8 | 161 | 97 | 60.2% (52.8–67.7) | 10 | 197 | 129 | 65.5% (58.9–72.1) | 7 |
| Ningxia | 240 | 151 | 62.9% (56.3–69.2) | 9 | 119 | 68 | 57.1% (47.9–65.5) | 14 | 121 | 83 | 68.6% (60.3–76.9) | 4 |
| Liaoning | 314 | 195 | 62.1% (56.7–67.2) | 10 | 120 | 67 | 55.8% (46.7–64.2) | 19 | 194 | 128 | 66.0% (59.3–72.7) | 6 |
| Guizhou | 161 | 99 | 61.5% (53.4–68.3) | 11 | 81 | 49 | 60.5% (49.4–71.6) | 9 | 80 | 50 | 62.5% (51.3–72.5) | 12 |
| Shandong | 952 | 584 | 61.3% (58.4–64.4) | 12 | 460 | 266 | 57.8% (53.5–62.2) | 13 | 492 | 318 | 64.6% (60.6–68.9) | 9 |
| Henan | 685 | 416 | 60.7% (57.1–64.5) | 13 | 350 | 203 | 58.0% (52.3–62.9) | 12 | 335 | 213 | 63.6% (58.5–68.7) | 10 |
| Zhejiang | 860 | 519 | 60.3% (57.2–63.7) | 14 | 349 | 195 | 55.9% (50.4–60.7) | 17 | 511 | 324 | 63.4% (59.3–67.7) | 11 |
| Tianjin | 130 | 78 | 60.0% (51.5–68.5) | 15 | 53 | 30 | 56.6% (43.4–69.8) | 16 | 77 | 48 | 62.3% (51.9–74.0) | 13 |
| Hunan | 544 | 326 | 59.9% (55.5–64.0) | 16 | 258 | 158 | 61.2% (55.4–67.1) | 8 | 286 | 168 | 58.7% (53.1–64.3) | 20 |
| Shanxi | 290 | 169 | 58.3% (52.4–64.1) | 17 | 142 | 79 | 55.6 (47.2–64.1) | 20 | 148 | 90 | 60.8% (52.7–68.9) | 15 |
| Hebei | 561 | 324 | 57.8% (53.8–61.5) | 18 | 258 | 140 | 54.3 (48.1–60.5) | 22 | 303 | 184 | 60.7% (55.1–66.3) | 16 |
| Shananxi | 243 | 138 | 56.8% (49.8–63.0) | 19 | 120 | 68 | 56.7% (48.3–65.8) | 15 | 123 | 70 | 56.9% (48.8–65.9) | 21 |
| Guangdong | 672 | 374 | 55.7% (51.9–59.5) | 20 | 314 | 161 | 51.3% (45.5–56.7) | 24 | 358 | 213 | 59.5% (54.7–64.8) | 18 |
| Gansu | 178 | 99 | 55.6% (48.3–62.4) | 21 | 74 | 38 | 51.4% (39.2–62.2) | 23 | 104 | 61 | 58.7% (49.0–67.3) | 19 |
| Jiangsu | 809 | 449 | 55.5% (52.2–58.7) | 22 | 354 | 198 | 55.9% (50.8–60.7) | 18 | 455 | 251 | 55.2% (50.3–59.3) | 23 |
| Hubei | 361 | 198 | 54.8% (49.6–59.8) | 23 | 147 | 81 | 55.1% (46.9–62.6) | 21 | 214 | 117 | 54.7% (48.1–61.7) | 24 |
| Inner Mongolia | 165 | 90 | 54.5% (47.3–61.8) | 24 | 80 | 49 | 61.3% (51.3–72.5) | 7 | 85 | 41 | 48.2% (37.6–58.8) | 31 |
| Sichuan | 461 | 238 | 51.6% (47.1–56.0) | 25 | 219 | 101 | 46.1% (39.7–53.4) | 30 | 242 | 137 | 56.6% (50.4–62.8) | 22 |
| Yunnan | 264 | 134 | 50.8% (45.1–56.4) | 26 | 162 | 82 | 50.6% (42.6–58.6) | 27 | 102 | 52 | 51.0% (41.2–59.8) | 28 |
| Anhui | 629 | 316 | 50.2% (46.3–54.2) | 27 | 337 | 172 | 51.0% (45.4–57.0) | 25 | 292 | 144 | 49.3% (43.5–55.5) | 29 |
| Shanghai | 957 | 480 | 50.2% (47.1–53.5) | 28 | 465 | 225 | 48.4% (44.3–53.5) | 28 | 492 | 255 | 51.8% (47.6–56.1) | 27 |
| Fujian | 268 | 134 | 50.0% (44.0–56.0) | 29 | 123 | 57 | 46.3% (37.4–54.5) | 29 | 145 | 77 | 53.1% (44.8–60.7) | 26 |
| Hainan | 139 | 69 | 49.6% (41.0–57.6) | 30 | 65 | 33 | 50.8% (38.5–63.1) | 26 | 74 | 36 | 48.6% (36.5–59.5) | 30 |
| Beijing | 617 | 302 | 48.9% (45.1–52.7) | 31 | 288 | 125 | 43.4% (37.2–49.0) | 31 | 329 | 177 | 53.8% (48.3–59.3) | 25 |
| China (total) | 12107 | 6957 | 57.5% (56.6–58.3) | 5633 | 3106 | 55.1% (53.9–56.6) | 6474 | 3851 | 59.5% (58.2–60.7) | |||
References
- Wang, C.; Horby, P.W.; Hayden, F.G.; Gao, G.F. A novel coronavirus outbreak of global health concern. Lancet 2020, 395, 470–473. [Google Scholar] [CrossRef]
- Huang, C.; Wang, Y.; Li, X.; Ren, L.; Zhao, J.; Hu, Y.; Zhang, L.; Fan, G.; Xu, J.; Gu, X.; et al. Clinical features of patients infected with 2019 novel coronavirus in Wuhan, China. Lancet 2020, 395, 497–506. [Google Scholar] [CrossRef]
- WHO. Coronavirus Disease (COVID-19) Outbreak Situation. Available online: https://www.who.int/emergencies/diseases/novel-coronavirus-2019 (accessed on 9 June 2020).
- Shih, G.; Denyer, S. Chinese Coronavirus Infections, Death Toll Soar as Fifth Case Is Confirmed in U.S. Available online: https://www.washingtonpost.com/world/asia_pacific/coronavirus-china-latest-updates/2020/2001/2026/4603266c-4603263fa4603268-4603211ea-afe4603262-4603090eb4603237b4603260b4603261_story.html (accessed on 1 March 2020).
- Fifield, A. Travel Ban Goes into Effect in Chinese City of Wuhan as Authorities Try to Stop Coronavirus Spread. Available online: https://www.washingtonpost.com/world/asia_pacific/nine-dead-as-chinese-coronavirus-spreads-despite-efforts-to-contain-it/2020/01/22/1eaade72-3c6d-11ea-afe2-090eb37b60b1_story.html. (accessed on 1 March 2020).
- Khaliq, R. China Prolongs School Closure Amid Coronavirus Outbreak. Available online: https://www.aa.com.tr/en/asia-pacific/china-prolongs-school-closure-amid-coronavirus-outbreak/1716100 (accessed on 1 March 2020).
- Chen, P.; Mao, L.; Nassis, G.P.; Harmer, P.; Ainsworth, B.E.; Li, F. Coronavirus disease (COVID-19): The need to maintain regular physical activity while taking precautions. J. Sport Health Sci. 2020, 9, 103–104. [Google Scholar] [CrossRef] [PubMed]
- Wang, C.; Pan, R.; Wan, X.; Tan, Y.; Xu, L.; Ho, C.S.; Ho, R.C. Immediate psychological responses and associated factors during the initial stage of the 2019 coronavirus disease (COVID-19) epidemic among the general population in China. Int. J. Environ. Res. Public Health 2020, 17, 1729. [Google Scholar] [CrossRef] [PubMed]
- Hamilton, M.T.; Hamilton, D.G.; Zderic, T.W. Sedentary behavior as a mediator of type 2 diabetes. Med. Sport Sci. 2014, 60, 11–26. [Google Scholar] [CrossRef]
- Owen, N.; Sparling, P.B.; Healy, G.N.; Dunstan, D.W.; Matthews, C.E. Sedentary behavior: Emerging evidence for a new health risk. Mayo Clin. Proc. 2010, 85, 1138–1141. [Google Scholar] [CrossRef] [PubMed]
- Wu, J.T.; Leung, K.; Leung, G.M. Nowcasting and forecasting the potential domestic and international spread of the 2019-nCoV outbreak originating in Wuhan, China: A modelling study. Lancet 2020, 395, 689–697. [Google Scholar] [CrossRef]
- Chen, N.; Zhou, M.; Dong, X.; Qu, J.; Gong, F.; Han, Y.; Qiu, Y.; Wang, J.; Liu, Y.; Wei, Y.; et al. Epidemiological and clinical characteristics of 99 cases of 2019 novel coronavirus pneumonia in Wuhan, China: A descriptive study. Lancet 2020, 395, 507–513. [Google Scholar] [CrossRef]
- Lu, R.; Zhao, X.; Li, J.; Niu, P.; Yang, B.; Wu, H.; Wang, W.; Song, H.; Huang, B.; Zhu, N.; et al. Genomic characterisation and epidemiology of 2019 novel coronavirus: Implications for virus origins and receptor binding. Lancet 2020, 395, 565–574. [Google Scholar] [CrossRef]
- Lee, P.H.; Yu, Y.Y.; McDowell, I.; Leung, G.M.; Lam, T.H.; Stewart, S.M. Performance of the international physical activity questionnaire (short form) in subgroups of the Hong Kong chinese population. Int. J. Behav. Nutr. Phys. Act. 2011, 8, 81. [Google Scholar] [CrossRef]
- Sjostrom, M. Guidelines for Data Processing and Analysis of the International Physical Activity Questionnaire–IPAQ (GDPA-IPAQ). Available online: https://www.academia.edu/5346814/Guidelines_for_Data_Processing_and_Analysis_of_the_International_Physical_Activity_Questionnaire_IPAQ_Short_and_Long_Forms_Contents (accessed on 1 March 2020).
- WHO. How Much of Physical Activity Is Recommended? Available online: https://www.who.int/news-room/fact-sheets/detail/physical-activity (accessed on 1 March 2020).
- Watson, D.; Clark, L.A.; Tellegen, A. Development and validation of brief measures of positive and negative affect: The PANAS scales. J. Pers. Soc. Psychol. 1988, 54, 1063–1070. [Google Scholar] [CrossRef]
- Guthold, R.; Stevens, G.A.; Riley, L.M.; Bull, F.C. Worldwide trends in insufficient physical activity from 2001 to 2016: A pooled analysis of 358 population-based surveys with 1·9 million participants. Lancet Glob. Health 2018, 6, e1077–e1086. [Google Scholar] [CrossRef]
- Bey, L.; Hamilton, M.T. Suppression of skeletal muscle lipoprotein lipase activity during physical inactivity: A molecular reason to maintain daily low-intensity activity. J. Physiol. 2003, 551, 673–682. [Google Scholar] [CrossRef] [PubMed]
- Kim, S.Y.; Jeon, S.W.; Lee, M.Y.; Shin, D.W.; Lim, W.J.; Shin, Y.C.; Oh, K.S. The association between physical activity and anxiety symptoms for general adult populations: An analysis of the dose-response relationship. Psychiatry Investig. 2020, 17, 29–36. [Google Scholar] [CrossRef]
- Mielke, G.I.; da Silva, I.C.M.; Kolbe-Alexander, T.L.; Brown, W.J. Shifting the physical inactivity curve worldwide by closing the gender gap. Sports Med. 2018, 48, 481–489. [Google Scholar] [CrossRef] [PubMed]
- Tu, H.; Liao, X.; Schuller, K.; Cook, A.; Fan, S.; Lan, G.; Lu, Y.; Yuan, Z.; Moore, J.B.; Maddock, J.E. Insights from an observational assessment of park-based physical activity in Nanchang, China. Prev. Med. Rep. 2015, 2, 930–934. [Google Scholar] [CrossRef]
- Kari, J.T.; Viinikainen, J.; Böckerman, P.; Tammelin, T.H.; Pitkänen, N.; Lehtimäki, T.; Pahkala, K.; Hirvensalo, M.; Raitakari, O.T.; Pehkonen, J. Education leads to a more physically active lifestyle: Evidence based on Mendelian randomization. Scand. J. Med. Sci. Sports 2020, 30, 1194–1204. [Google Scholar] [CrossRef]
- Ranasinghe, C.D.; Ranasinghe, P.; Jayawardena, R.; Misra, A. Physical activity patterns among South-Asian adults: A systematic review. Int. J. Behav. Nutr. Phys. Act. 2013, 10, 116. [Google Scholar] [CrossRef]
- Hills, A.P.; Farpour-Lambert, N.J.; Byrne, N.M. Precision medicine and healthy living: The importance of the built environment. Prog. Cardiovasc. Dis. 2019, 62, 34–38. [Google Scholar] [CrossRef]
- Kondo, M.C.; Fluehr, J.M.; McKeon, T.; Branas, C.C. Urban green space and its impact on human health. Int. J. Environ. Res. Public Health 2018, 15, 445. [Google Scholar] [CrossRef]
- Lee, A.C.; Maheswaran, R. The health benefits of urban green spaces: A review of the evidence. J. Public Health (Oxf.) 2011, 33, 212–222. [Google Scholar] [CrossRef] [PubMed]
- Varela, A.R.; Pratt, M.; Harris, J.; Lecy, J.; Salvo, D.; Brownson, R.C.; Hallal, P.C. Mapping the historical development of physical activity and health research: A structured literature review and citation network analysis. Prev. Med. 2018, 111, 466–472. [Google Scholar] [CrossRef] [PubMed]
- Yeh, H.P.; Stone, J.A.; Churchill, S.M.; Wheat, J.S.; Brymer, E.; Davids, K. Physical, psychological and emotional benefits of green physical activity: An ecological dynamics perspective. Sports Med. 2016, 46, 947–953. [Google Scholar] [CrossRef] [PubMed]
- Lahart, I.; Darcy, P.; Gidlow, C.; Calogiuri, G. The effects of green exercise on physical and mental wellbeing: A systematic review. Int. J. Environ. Res. Public Health 2019, 16, 1352. [Google Scholar] [CrossRef]
- Fraser, M.; Munoz, S.A.; MacRury, S. What motivates participants to adhere to green exercise? Int. J. Environ. Res. Public Health 2019, 16, 1832. [Google Scholar] [CrossRef]
- Nie, M.J.; Fan, C.Q.; Sun, R.Z.; Wang, J.J.; Feng, Q.; Zhang, Y.F.; Yao, Z.; Wang, M. Accelerometer-measured physical activity in children and adolescents at altitudes over 3500 meters: A cross-sectional study in Tibet. Int. J. Environ. Res. Public Health 2019, 16, 686. [Google Scholar] [CrossRef]
- Stamatakis, E.; Hamer, M.; Dunstan, D.W. Screen-based entertainment time, all-cause mortality, and cardiovascular events: Population-based study with ongoing mortality and hospital events follow-up. J. Am. Coll. Cardiol. 2011, 57, 292–299. [Google Scholar] [CrossRef]
- Wang, X.; Li, Y.; Fan, H. The associations between screen time-based sedentary behavior and depression: A systematic review and meta-analysis. BMC Public Health 2019, 19, 1524. [Google Scholar] [CrossRef]
- Ding, E.L.; Mekary, R.A. Letter by Ding and Mekary regarding article, “television viewing time and mortality: The Australian diabetes, obesity and lifestyle study (AusDiab)”. Circulation 2010, 122, e472. [Google Scholar] [CrossRef]
- Gibbs, B.B.; Reis, J.P.; Schelbert, E.B.; Craft, L.L.; Sidney, S.; Lima, J.; Lewis, C.E. Sedentary screen time and left ventricular structure and function: The CARDIA study. Med. Sci. Sports Exerc. 2014, 46, 276–283. [Google Scholar] [CrossRef] [PubMed]
- Celis-Morales, C.A.; Lyall, D.M.; Steell, L.; Gray, S.R.; Iliodromiti, S.; Anderson, J.; Mackay, D.F.; Welsh, P.; Yates, T.; Pell, J.P.; et al. Associations of discretionary screen time with mortality, cardiovascular disease and cancer are attenuated by strength, fitness and physical activity: Findings from the UK Biobank study. BMC Med. 2018, 16, 77. [Google Scholar] [CrossRef] [PubMed]
- Bruine de Bruin, W. Age differences in COVID-19 risk perceptions and mental health:Evidence from a national US survey conducted in March 2020. J. Gerontol. B Psychol. Sci. Soc. Sci. 2020. [Google Scholar] [CrossRef] [PubMed]
- Stanton, R.; To, Q.G.; Khalesi, S.; Williams, S.L.; Alley, S.J.; Thwaite, T.L.; Fenning, A.S.; Vandelanotte, C. Depression, anxiety and stress during COVID-19: Associations with changes in physical activity, sleep, tobacco and alcohol use in Australian adults. Int. J. Environ. Res. Public Health 2020, 17, 4065. [Google Scholar] [CrossRef] [PubMed]
- Huang, H.M.; Lai, J.H.; Huang, T.W. Mediating effects of depression on anxiety and leisure constraints in patients with breast cancer. BMC Womens Health 2019, 19, 141. [Google Scholar] [CrossRef] [PubMed]
- Cho, D.; Post, J.; Kim, S.K. Comparison of passive and active leisure activities and life satisfaction with aging. Geriatr. Gerontol. Int. 2018, 18, 380–386. [Google Scholar] [CrossRef]
- Asmundson, G.J.; Fetzner, M.G.; Deboer, L.B.; Powers, M.B.; Otto, M.W.; Smits, J.A. Let’s get physical: A contemporary review of the anxiolytic effects of exercise for anxiety and its disorders. Depress. Anxiety 2013, 30, 362–373. [Google Scholar] [CrossRef]
- Stubbs, B.; Vancampfort, D.; Rosenbaum, S.; Firth, J.; Cosco, T.; Veronese, N.; Salum, G.A.; Schuch, F.B. An examination of the anxiolytic effects of exercise for people with anxiety and stress-related disorders: A meta-analysis. Psychiatry Res. 2017, 249, 102–108. [Google Scholar] [CrossRef]


| Men | Women | Total | |
|---|---|---|---|
| Percentage n (%) | 5366 (46.5%) | 6474 (53.5%) | 12,107 (100%) |
| Age (years) | |||
| <20 | 464 (8.2%) | 390 (6.0%) | 854 (7.1%) |
| 20–24 | 1832 (32.5%) | 2064 (31.9%) | 3896 (32.2%) |
| 25–29 | 644 (11.4%) | 817 (12.6%) | 1461 (12.1%) |
| 30–34 | 568 (10.1%) | 860 (13.3%) | 1428 (11.8%) |
| 35–39 | 608 (10.8%) | 777 (12.0%) | 1385 (11.4%) |
| 40–44 | 570 (10.1%) | 658 (10.2%) | 1228 (10.1%) |
| 45–49 | 463 (8.2%) | 447 (6.9%) | 910 (7.5%) |
| 50–54 | 243 (4.3%) | 238 (3.7%) | 481 (4.0%) |
| 55–59 | 148 (2.6%) | 132 (2.0%) | 280 (2.3%) |
| ≥60 | 93 (1.7%) | 91 (1.4%) | 184 (1.5%) |
| Urbanity | |||
| Urban regions | 1751 (31.1%) | 1949 (30.1%) | 3700 (30.6%) |
| Rural regions | 3882 (68.9%) | 4525 (69.9%) | 8407 (69.4%) |
| Education | |||
| Primary school or lower | 187 (3.3%) | 161 (2.5%) | 348 (2.9%) |
| Middle school | 272 (4.8%) | 413 (6.4%) | 685 (5.7%) |
| High school | 504 (8.9%) | 700 (10.8%) | 1204 (9.9%) |
| College | 3260 (57.9%) | 3707 (57.2%) | 6963 (57.5%) |
| Graduate | 1410 (25.0%) | 1497 (23.1%) | 2907 (24.0%) |
| Occupation | |||
| Full-time student | 2211 (39.3%) | 2249 (34.7%) | 4460 (36.8%) |
| Labor | 458 (8.1%) | 504 (7.8%) | 962 (7.9%) |
| Professional | 2280 (40.4%) | 2476 (38.2%) | 4756 (39.3%) |
| Unemployed and freelance | 684 (12.1%) | 1245 (19.2%) | 1929 (15.9%) |
| Vigorous | Moderate | Light | p for Difference * | |
|---|---|---|---|---|
| Sex | <0.0001 | |||
| Men | 23.0% (21.9–24.2) | 21.9% (20.8–23.0) | 55.1% (53.8–56.4) | |
| Women | 19.4% (18.4–20.3) | 21.2% (20.2–22.2) | 59.5% (58.2–60.7) | |
| Age | <0.0001 | |||
| <20 | 28.9% (25.8–32.0) | 20.7% (18.0–23.5) | 50.4% (47.0–53.7) | |
| 20–24 | 17.1% (15.9–18.4) | 18.7% (17.5–19.9) | 64.2% (62.7–65.8) | |
| 25–29 | 17.1% (15.0–19.1) | 19.4% (17.4–21.5) | 63.4% (61.0–65.9) | |
| 30–34 | 17.9% (15.8–19.7) | 22.1% (20.0–24.4) | 60.0% (57.6–62.5) | |
| 35–39 | 23.3% (21.1–25.7) | 22.2% (19.9–24.3) | 54.5% (51.8–57.0) | |
| 40–44 | 24.2% (21.7–26.6) | 23.9% (21.3–26.3) | 51.9% (49.2–54.8) | |
| 45–49 | 24.8% (22.1–27.6) | 27.8% (24.9–30.8) | 47.4% (44.2–50.4) | |
| 50–54 | 28.1% (23.9–32.2) | 24.5% (20.6–28.7) | 47.4% (42.8–52.0) | |
| 55–59 | 33.2% (27.9–38.9) | 25.7% (20.7–30.7) | 41.1% (35.4–46.8) | |
| ≥60 | 30.4% (23.9–37.0) | 28.3% (21.7–34.8) | 41.3% (34.2–48.9) | |
| Urbanity | <0.0001 | |||
| Urban | 20.5% (19.6–21.3) | 22.1% (21.2–23.0) | 57.5% (56.4–58.5) | |
| Rural | 22.4% (21.1–23.8) | 20.1% (18.8–21.4) | 57.5% (55.9–59.1) |
| PANAS Positive Affect | PANAS Negative Affect | |
|---|---|---|
| Total | ||
| n = 12107 | 24.78 ± 6.88 | 19.34 ± 7.05 |
| Sex | ||
| Male (n = 5633) | 25.09 ± 7.06 | 19.04 ± 7.00 |
| Female (n = 6474) | 24.51 ± 6.70 | 19.61 ± 7.08 |
| p for difference | <0.0001 | <0.0001 |
| Urbanity | ||
| Urban (n = 8407) | 24.81 ± 6.85 | 19.46 ± 7.13 |
| Rural (n = 3700) | 24.70 ± 6.95 | 19.08 ± 6.86 |
| p for difference | 0.420 | 0.006 |
| Age | ||
| <20 (n = 854) | 26.26 ± 7.61 ab | 17.35 ± 6.68 ab |
| 20–24 (n = 3896) | 24.14 ± 7.17 | 19.69 ± 7.20 |
| 25–29 (n = 1461) | 24.21 ± 6.86 | 20.43 ± 7.20 |
| 30–34 (n = 1428) | 24.41 ± 6.66 | 19.86 ± 7.15 b |
| 35–39 (n = 1385) | 25.21 ± 6.38 ab | 19.93 ± 6.84 |
| 40–44 (n = 1228) | 25.52 ± 6.46 ab | 19.21 ± 6.98 ab |
| 45–49 (n = 910) | 25.05 ± 6.12 ab | 18.45 ± 6.42 ab |
| 50–54 (n = 481) | 25.35 ± 6.56 ab | 17.48 ± 6.15 ab |
| 55–59 (n = 280) | 25.90 ± 6.93 ab | 17.32 ± 6.47 ab |
| ≥60 (n = 184) | 25.97 ± 7.15 ab | 17.18 ± 7.46 ab |
| p for difference | <0.0001 | <0.0001 |
| Physical activity level | ||
| Vigorous (n = 2548) | 27.54 ± 6.44 | 18.41 ± 6.49 |
| Moderate (n = 2602) | 25.53 ± 6.37 * | 18.93 ± 6.51 * |
| Light (n = 6957) | 23.48 ± 6.88 *# | 19.34 ± 7.39 *# |
| p for difference | <0.0001 | <0.0001 |
© 2020 by the authors. Licensee MDPI, Basel, Switzerland. This article is an open access article distributed under the terms and conditions of the Creative Commons Attribution (CC BY) license (http://creativecommons.org/licenses/by/4.0/).
Share and Cite
Qin, F.; Song, Y.; Nassis, G.P.; Zhao, L.; Dong, Y.; Zhao, C.; Feng, Y.; Zhao, J. Physical Activity, Screen Time, and Emotional Well-Being during the 2019 Novel Coronavirus Outbreak in China. Int. J. Environ. Res. Public Health 2020, 17, 5170. https://doi.org/10.3390/ijerph17145170
Qin F, Song Y, Nassis GP, Zhao L, Dong Y, Zhao C, Feng Y, Zhao J. Physical Activity, Screen Time, and Emotional Well-Being during the 2019 Novel Coronavirus Outbreak in China. International Journal of Environmental Research and Public Health. 2020; 17(14):5170. https://doi.org/10.3390/ijerph17145170
Chicago/Turabian StyleQin, Fei, Yiqing Song, George P Nassis, Lina Zhao, Yanan Dong, Cuicui Zhao, Yiwei Feng, and Jiexiu Zhao. 2020. "Physical Activity, Screen Time, and Emotional Well-Being during the 2019 Novel Coronavirus Outbreak in China" International Journal of Environmental Research and Public Health 17, no. 14: 5170. https://doi.org/10.3390/ijerph17145170
APA StyleQin, F., Song, Y., Nassis, G. P., Zhao, L., Dong, Y., Zhao, C., Feng, Y., & Zhao, J. (2020). Physical Activity, Screen Time, and Emotional Well-Being during the 2019 Novel Coronavirus Outbreak in China. International Journal of Environmental Research and Public Health, 17(14), 5170. https://doi.org/10.3390/ijerph17145170