Article

Prediction of Number of Cases of 2019 Novel Coronavirus (COVID-19) Using Social Media Search Index

1
School of Statistics, University of International Business and Economics, Beijing 100029, China
2
Graduate Institute of Business Administration, College of Management, Fu Jen Catholic University, New Taipei City 242, Taiwan
3
Research Center of Big Data, College of management, Taipei Medical University, Taipei 110, Taiwan
4
College of Management, Taipei Medical University, Taipei 110, Taiwan
5
Executive Master Program of Business Administration in Biotechnology, College of management, Taipei Medical University, Taipei 110, Taiwan
6
Department of Food Nutrition and Health Biotechnology, College of Medical and Health Science, Asia University, Taichung 41354, Taiwan
7
Division of Radiation Oncology, Lo-Hsu Medical Foundation, Lotung Poh-Ai Hospital, Yilan 265, Taiwan
8
Big Data Center, Lo-Hsu Medical Foundation, Lotung Poh-Ai Hospital, Yilan 265, Taiwan
9
Department of Healthcare Administration, College of Medical and Health Science, Asia University, Taichung 41354, Taiwan
10
School of Dentistry, College of Oral Medicine, Taipei Medical University, Taipei 110, Taiwan
*
Author to whom correspondence should be addressed.
These authors have contributed equally to this study (joint primary authors).
Int. J. Environ. Res. Public Health 2020, 17(7), 2365; https://doi.org/10.3390/ijerph17072365
Submission received: 28 February 2020 / Revised: 29 March 2020 / Accepted: 30 March 2020 / Published: 31 March 2020
(This article belongs to the Collection Outbreak of a Novel Coronavirus: A Global Health Threat)

Abstract

:
Predicting the number of new suspected or confirmed cases of novel coronavirus disease 2019 (COVID-19) is crucial in the prevention and control of the COVID-19 outbreak. Social media search indexes (SMSI) for dry cough, fever, chest distress, coronavirus, and pneumonia were collected from 31 December 2019 to 9 February 2020. The new suspected cases of COVID-19 data were collected from 20 January 2020 to 9 February 2020. We used the lagged series of SMSI to predict new suspected COVID-19 case numbers during this period. To avoid overfitting, five methods, namely subset selection, forward selection, lasso regression, ridge regression, and elastic net, were used to estimate coefficients. We selected the optimal method to predict new suspected COVID-19 case numbers from 20 January 2020 to 9 February 2020. We further validated the optimal method for new confirmed cases of COVID-19 from 31 December 2019 to 17 February 2020. The new suspected COVID-19 case numbers correlated significantly with the lagged series of SMSI. SMSI could be detected 6–9 days earlier than new suspected cases of COVID-19. The optimal method was the subset selection method, which had the lowest estimation error and a moderate number of predictors. The subset selection method also significantly correlated with the new confirmed COVID-19 cases after validation. SMSI findings on lag day 10 were significantly correlated with new confirmed COVID-19 cases. SMSI could be a significant predictor of the number of COVID-19 infections. SMSI could be an effective early predictor, which would enable governments’ health departments to locate potential and high-risk outbreak areas.

1. Introduction

A novel coronavirus, COVID-19 (formally known as 2019-nCoV), has emerged over the last few weeks since its outbreak in Wuhan City, China [1,2,3,4,5]. This severe acute respiratory syndrome (SARS)-like virus has infected over 75,000 people and killed over 2000 in China [1,2,3,4,5]. Case diagnoses have been confirmed in 26 countries, and 14 deaths have been reported outside of mainland China [1,2,3,4,5]. Currently, COVID-19 is spreading rapidly in South Korean communities, with almost 200 confirmed cases [1]. Little is known regarding this virus, aside from a possible incubation period of 2 to 14 days and a mortality rate of approximately 2.2% [5]. Increasing numbers of cases have also been reported in other countries across all continents except Antarctica, and the rate of new cases outside of China has outpaced the rate in China. These cases initially occurred mainly among travelers from China and those who have had contact with travelers from China [6,7]. However, ongoing local transmission has driven smaller outbreaks in some locations outside of China, including South Korea, Italy, Iran, and Japan, and infections elsewhere have been identified in travelers from those countries [8]. In the United States, clusters of COVID-19 with local transmission have been identified throughout most of the country [6,7].
COVID-19 is of critical concern for public health [9,10]. Health care providers should be updated regarding public health and COVID-19 outbreaks affecting their communities to promptly make correct decisions [10,11]. This would enable them to offer improved services in an efficient manner, which is crucial in the current situation [10]. Most health care providers depend on the Center of Disease Control and Prevention (CDC) to be informed on disease outbreaks or to be notified of new infectious COVID-19 [10]. However, we still do not have infectious diseases under control, especially novel COVID-19 [12]. Numerous researchers are attempting to gain an improved understanding of the evolution of COVID-19 and the causes of the disease [13,14,15]. This knowledge may help predict COVID-19 infections, which would allow a more targeted prediction of at-risk populations. Recently, social media search indices (SMSIs) have successfully indicated a correlation with the prediction of the transmission of infectious disease [16,17,18]. Studies have demonstrated that specific word searches in social networks may be a predictor of the transmission of influenza [18], SARS [17], dengue fever [19], and Middle East respiratory syndrome [16]. Nevertheless, SMSI was difficult to choose keywords, although they have a considerable effect on the performance of a prediction model. Since people continuously learn new terminology and change the search keywords they use, keywords should be updated regularly to maintain prediction performance [20]. As in the case of Google Flu, this system can fail to predict disease outbreaks correctly [21]. Therefore, the proposed digital surveillance system should be used with caution, or as a complementary method.
This study investigated the correlation between the number of new cases of COVID-19 and the search index for a popular social network in China, Baidu search index (BSI), as the reference SMSI. The aim of this study was to create an effective and affordable model to predict new cases, which would enable prompt and correct decision-making regarding public policies to limit the spread of COVID-19.

2. Individuals and Methods

2.1. Database

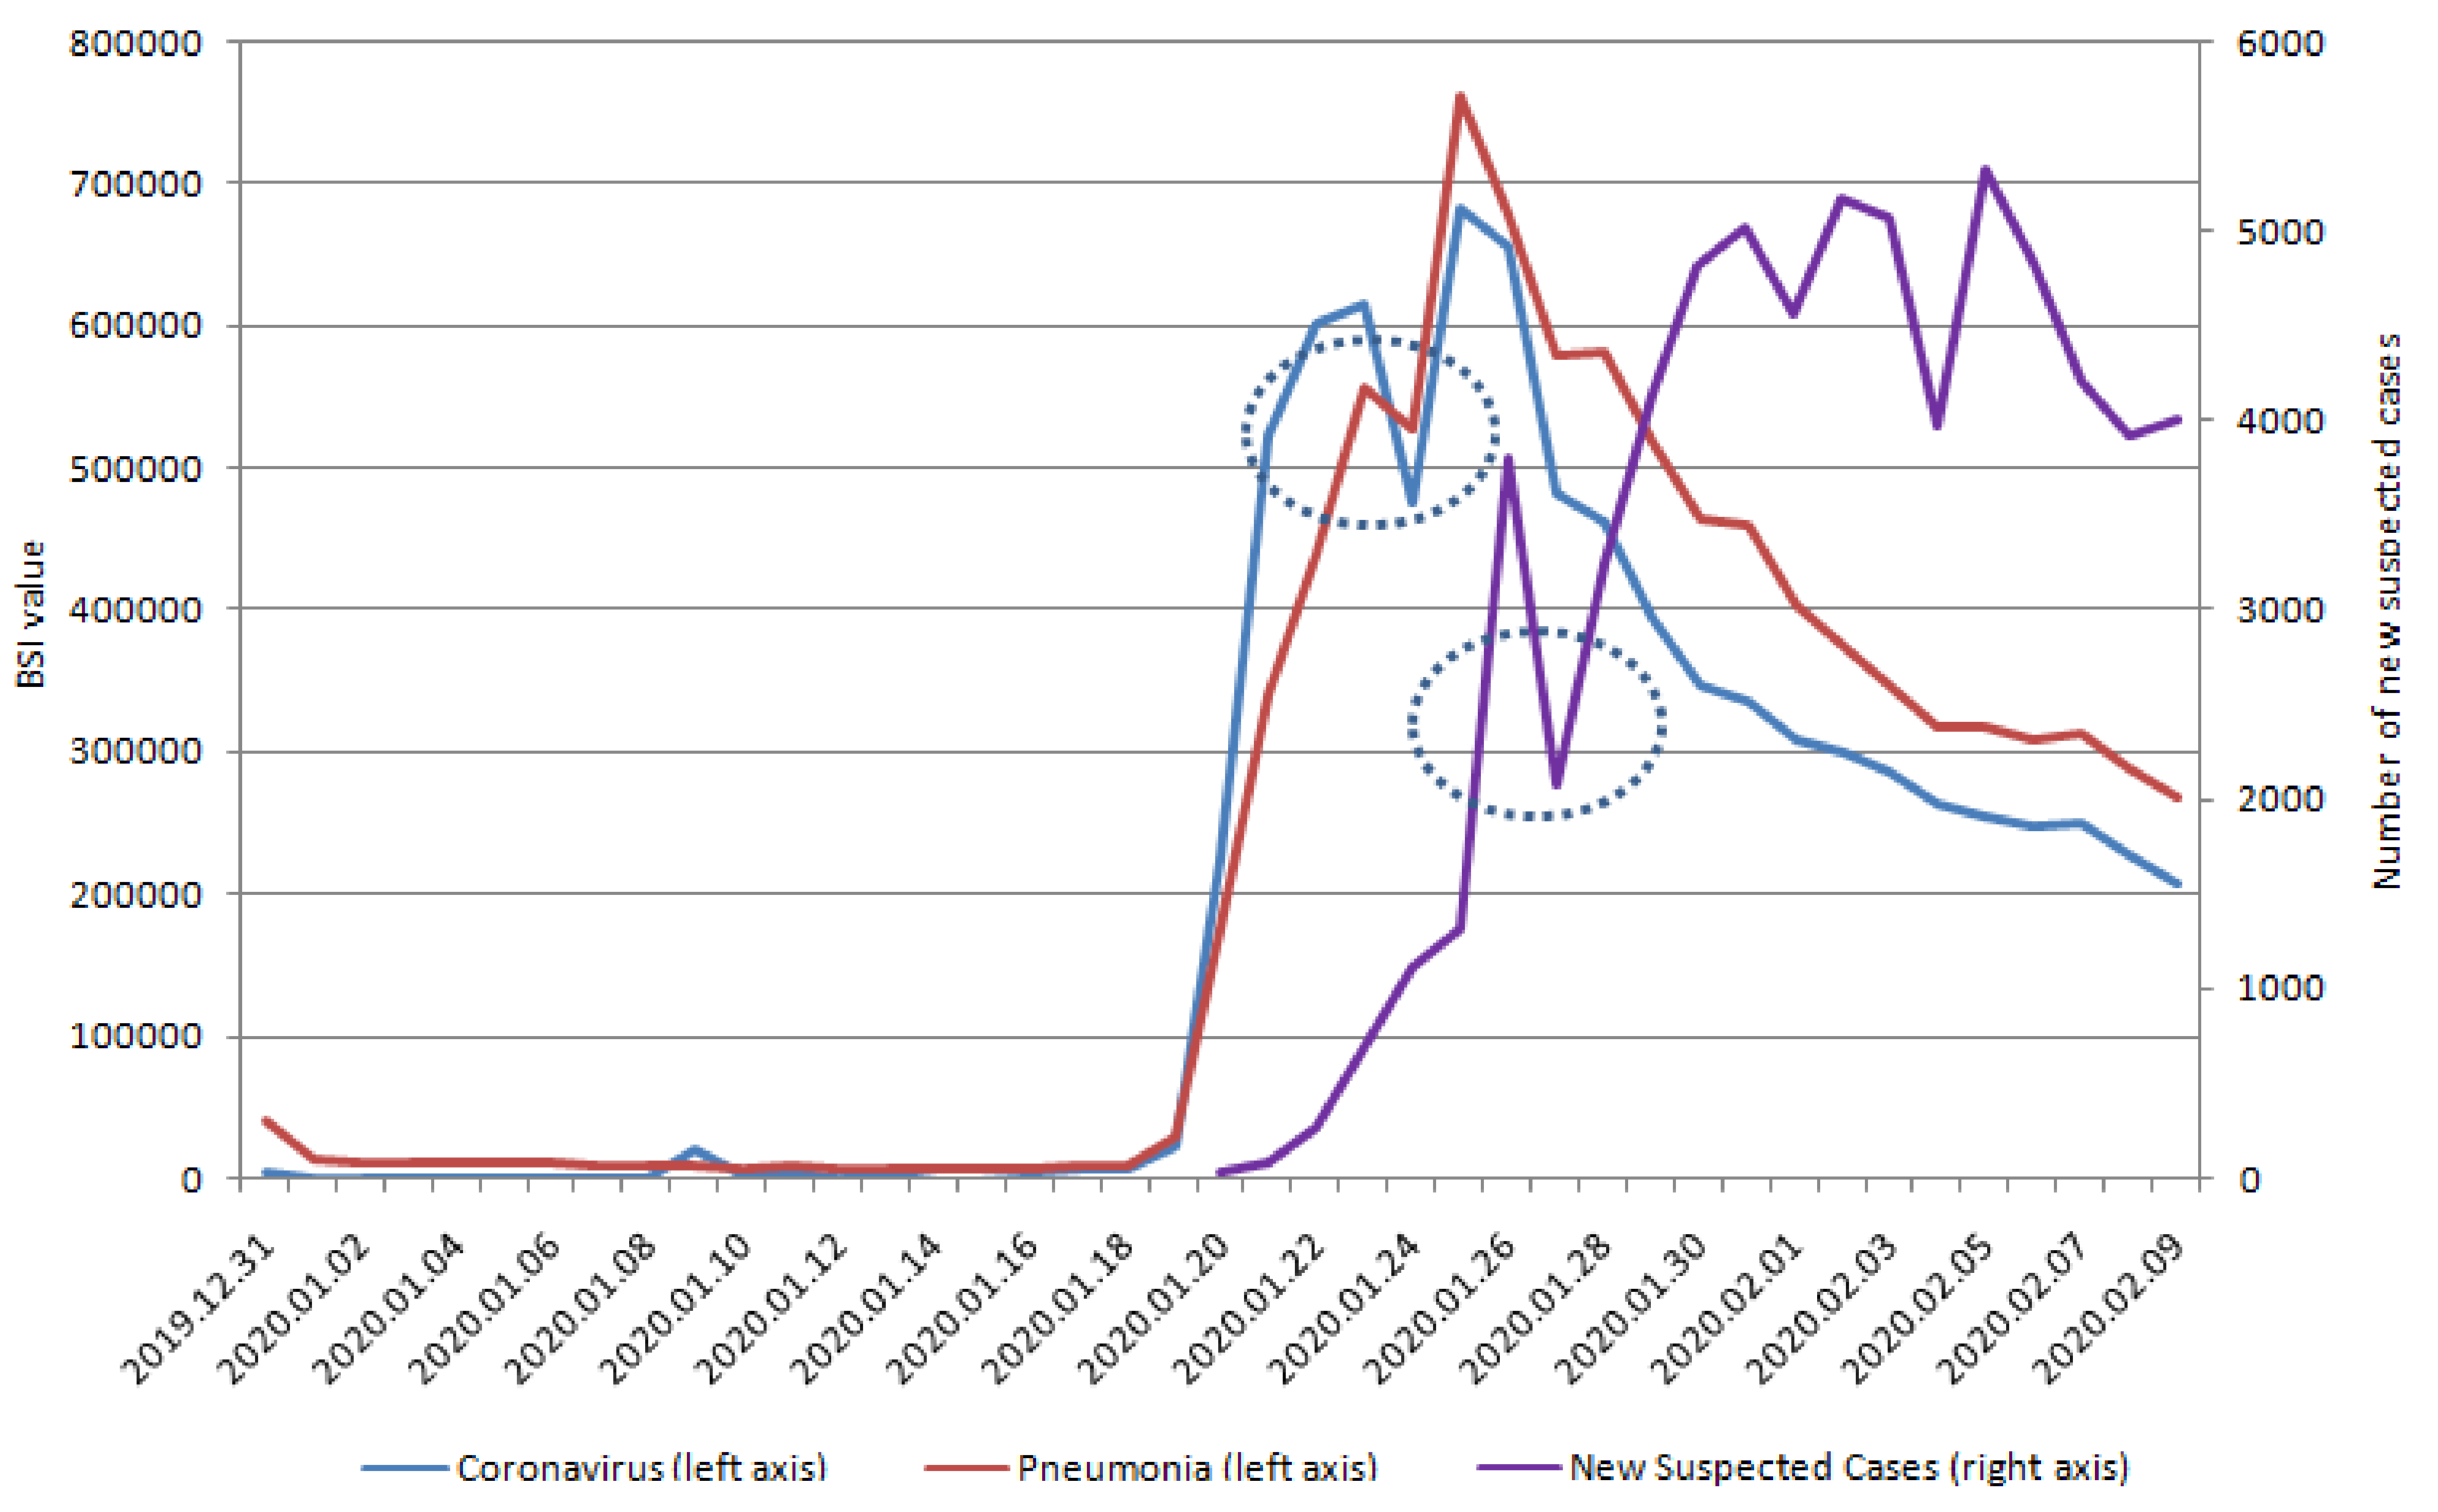
2.1.1. Baidu Search Index in Social Media

Baidu is the most popular search engine in China and has accumulated a large amount of user behavior data since its establishment in 2000 [19,22]. The Baidu Index (http://index.baidu.com) is a data-sharing platform of Baidu’s behavioral data [19,22]. On this platform, users can obtain keyword search trends, gain insights into changes in personal needs, monitor media sentiment trends, locate digital consumer characteristics, and analyze market characteristics from an industry perspective. The BSI published on this platform reveals Internet users’ interest through changes in keyword searches. The index summates personal computer searches and mobile searches [19]. BSI was used as the representative SMSI and five keywords (in Chinese) related to suspected COVID-19 were selected, namely dry cough, fever, chest distress, coronavirus, and pneumonia, from 31 December 2019, to 9 February 2020. The optimal method of verifying the correlation between BSI and new confirmed COVID-19 was also selected and performed.

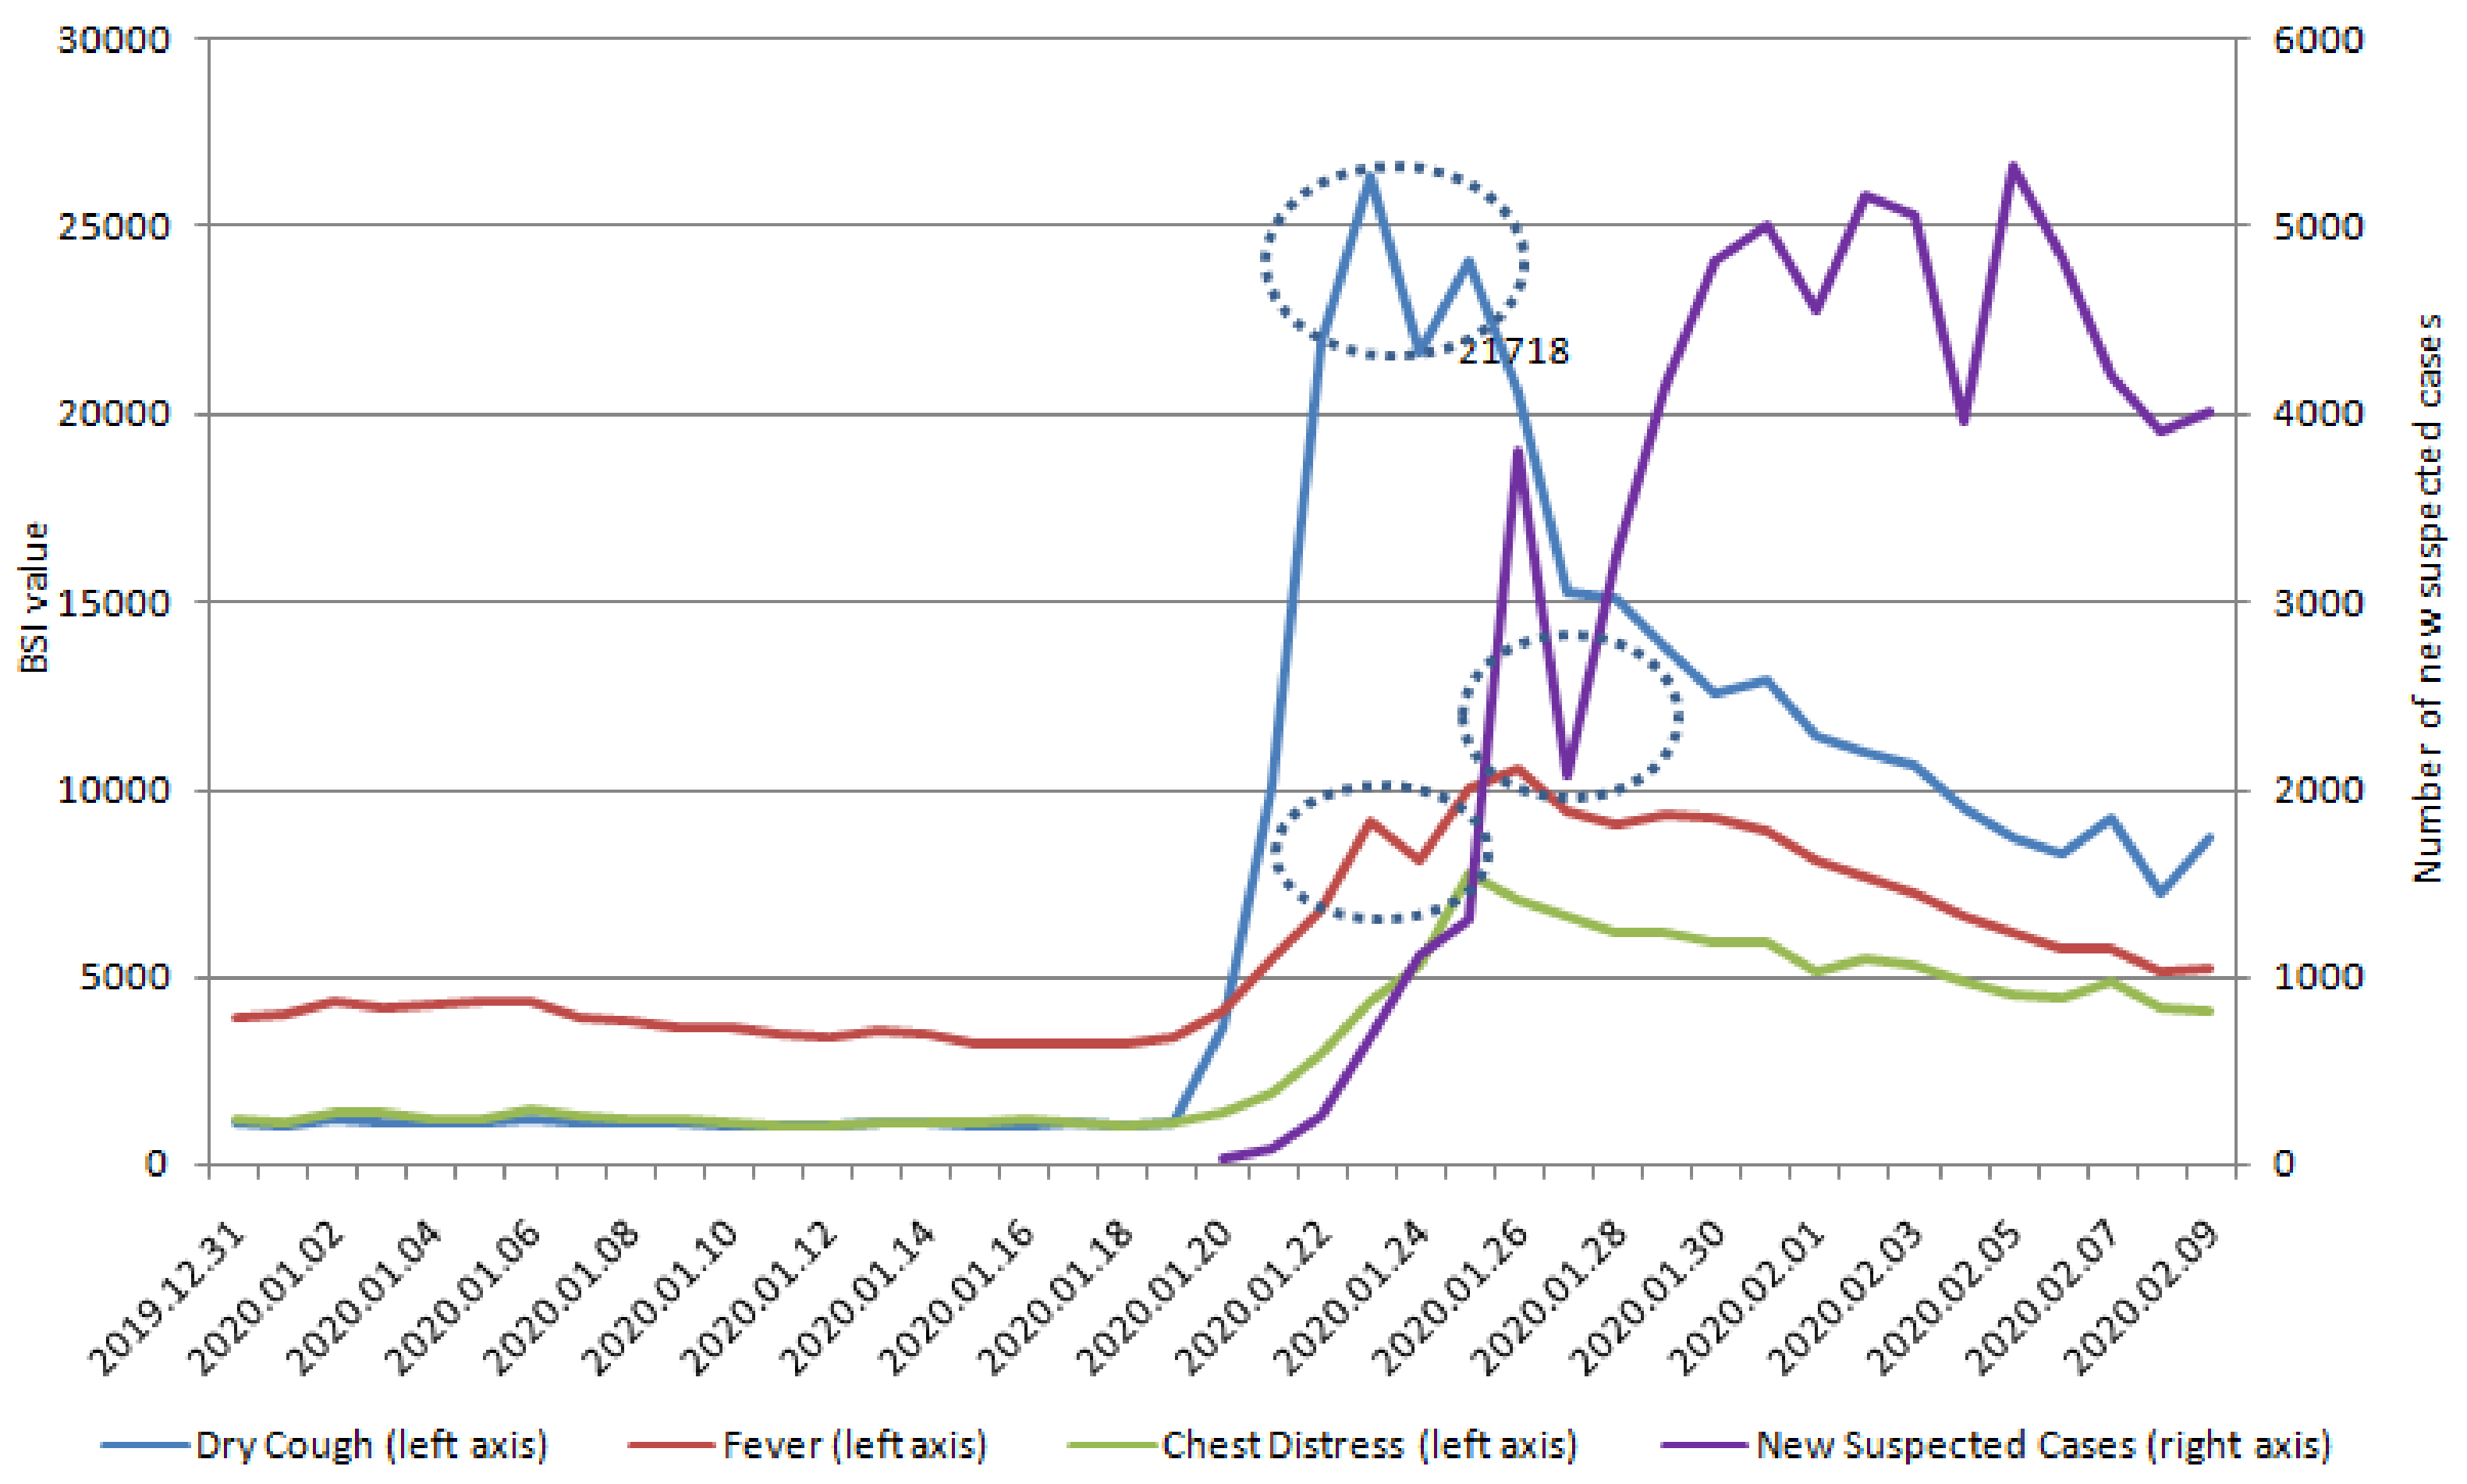
2.1.2. Number of New Suspected Infection Cases

The National Health Commission (NHC) of the People’s Republic of China has been closely monitoring the epidemic situation since the Wuhan Health Commission announced an unexplained viral pneumonia notification. The pathogen of unexplained viral pneumonia was rapidly determined to be a new type of coronavirus [23,24]. The epidemic rapidly spread across the country and then across the world [25]. To ensure the distribution of accurate information, the NHC releases the latest data of COVID-19 cases, which include new and cumulative COVID-19 confirmed cases, suspected cases, serious cases, and death cases [24]. Dependent variables investigated in this study were the number of suspected COVID-19 cases and data from the latest briefing on COVID-19 cases in China released from 20 January 2020, to 9 February 2020, on the official website of the NHC. We also used our SMSI as a predictor to verify the correlation of COVID-19 confirmed cases from 31 December 2019, to 17 February 2020.

2.2. Method

2.2.1. Model Formulation

The model considered in this study was as follows:
l o g ( Y t ) = μ + p = 1 5 s = 1 10 β s , p l o g ( X t s , p ) + ε t
where   Y is the new COVID-19 case number, X 1 , , X 5 are the BSI, μ is the constant, and ε is the error term. X t s , p is the lagged time series (the lag order is s) of pth (p = 1–5) Baidu search indexes. Statistically, we should choose as many keywords as possible, but in our study, five keywords, dry cough, fever, chest distress, coronavirus, and pneumonia, are typical and adequate. The maximal lag order is 10 because the mean of incubation period is 10 days. Therefore, the superior limits of the two summations are 5 and 10, respectively. The COVID-19 case numbers were predicted by the lag series of BSI, and the coefficient β was estimated.

2.2.2. Parameter Estimation

The model contained 50 predictors. However, we only had 21 observations, which led to a typical high-dimensional problem in modern statistics. To select predictors, estimate parameters, and avoid overfitting, five methods were adopted to analyze the data, including subset selection, forward selection, ridge regression, lasso regression, and elastic net.
(1)
Subset selection refers to the task of finding a small subset of available predictors that accurately predict the response. If the model has k predictors, then the subset selection method will choose the optimal model from the possible 2 k models, based on some criteria such as Akaike’s information criteria, Bayesian information criteria, or adjusted R 2 .
(2)
Forward selection is a stepwise selection method. It starts with no variables in the model, tests the addition of each variable using a chosen model fit criterion, adds the variable (if any), whose inclusion causes the most statistically significant improvement of the fit, and repeats this process until the model can no longer be improved to a statistically significant extent.
(3)
Ridge regression is a method to create a parsimonious model when the number of predictor variables exceeds the number of observations, or when the data set has multi-collinearity. Employing the least-squares method is not possible when the number of predictors exceeds the number of observations, which leads to overfitting a model and the failure to find unique solutions. In contrast to the least-squares method, ridge regression shrinks parameters by L2 penalty, to obtain biased but lower variance estimators; thus, the estimates are reasonably reliable approximations of true population values. In this study, ridge regression solves the following problem:
Q = t = 1 T l o g ( Y t ) μ p = 1 5 s = 1 10 β s , p l o g ( X t s , p ) 2 + λ p = 1 5 s = 1 10 β s , p 2 .
(4)
Lasso regression is also a type of linear regression that uses shrinkage. Lasso regression performs both variable selection and parameter shrinkage by using the L1 penalty, which enhances the prediction accuracy and interpretability of the statistical model it produces. The only difference between lasso regression and ridge regression is the penalty function. In this study, lasso regression solves the following problem:
Q = t = 1 T l o g ( Y t ) μ p = 1 5 s = 1 10 β s , p l o g ( X t s , p ) 2 + λ p = 1 5 s = 1 10 β s , p
(5)
Elastic net is a regularized regression method that linearly combines the L1 and L2 penalties of the lasso and ridge methods. The elastic net method often outperforms the lasso but has a similar sparsity of representation. In this study, elastic net solves the following problem:
Q = t = 1 T l o g ( Y t ) μ p = 1 5 s = 1 10 β s , p l o g ( X t s , p ) 2 + λ 1 α p = 1 5 s = 1 10 β s , p 2 / 2 + + λ α p = 1 5 s = 1 10 β s , p

2.2.3. Accuracy Metrics
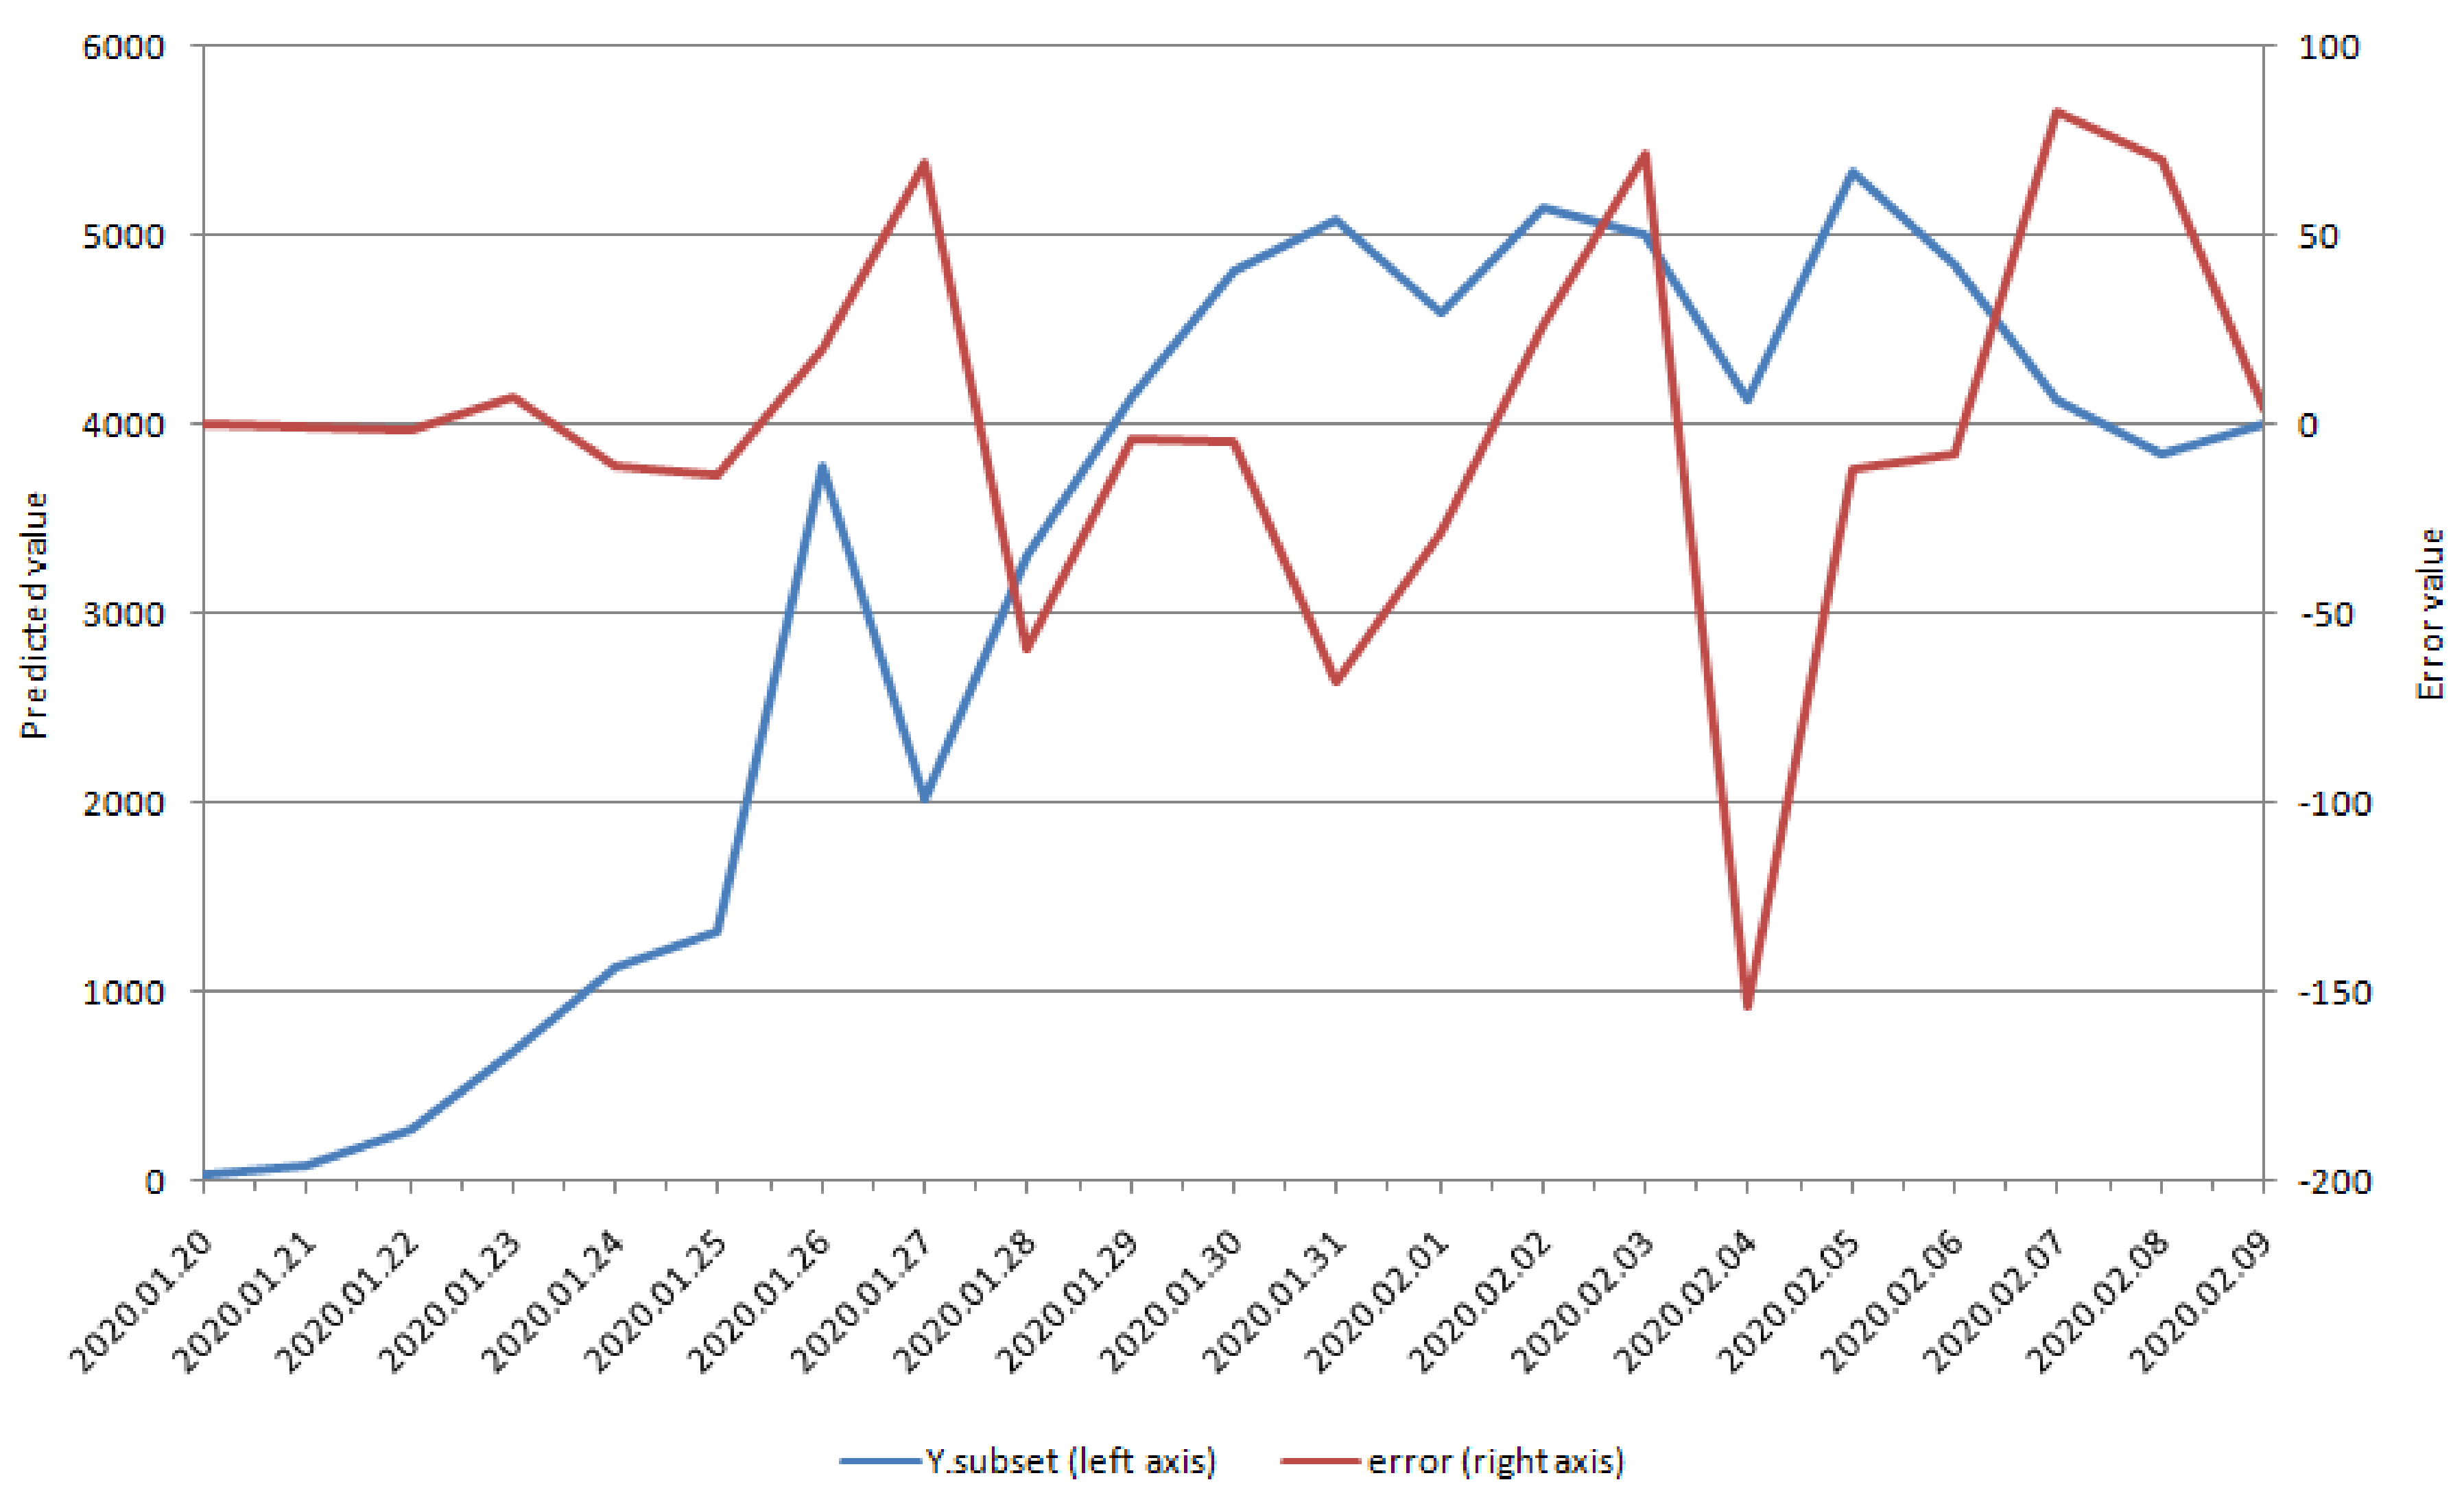
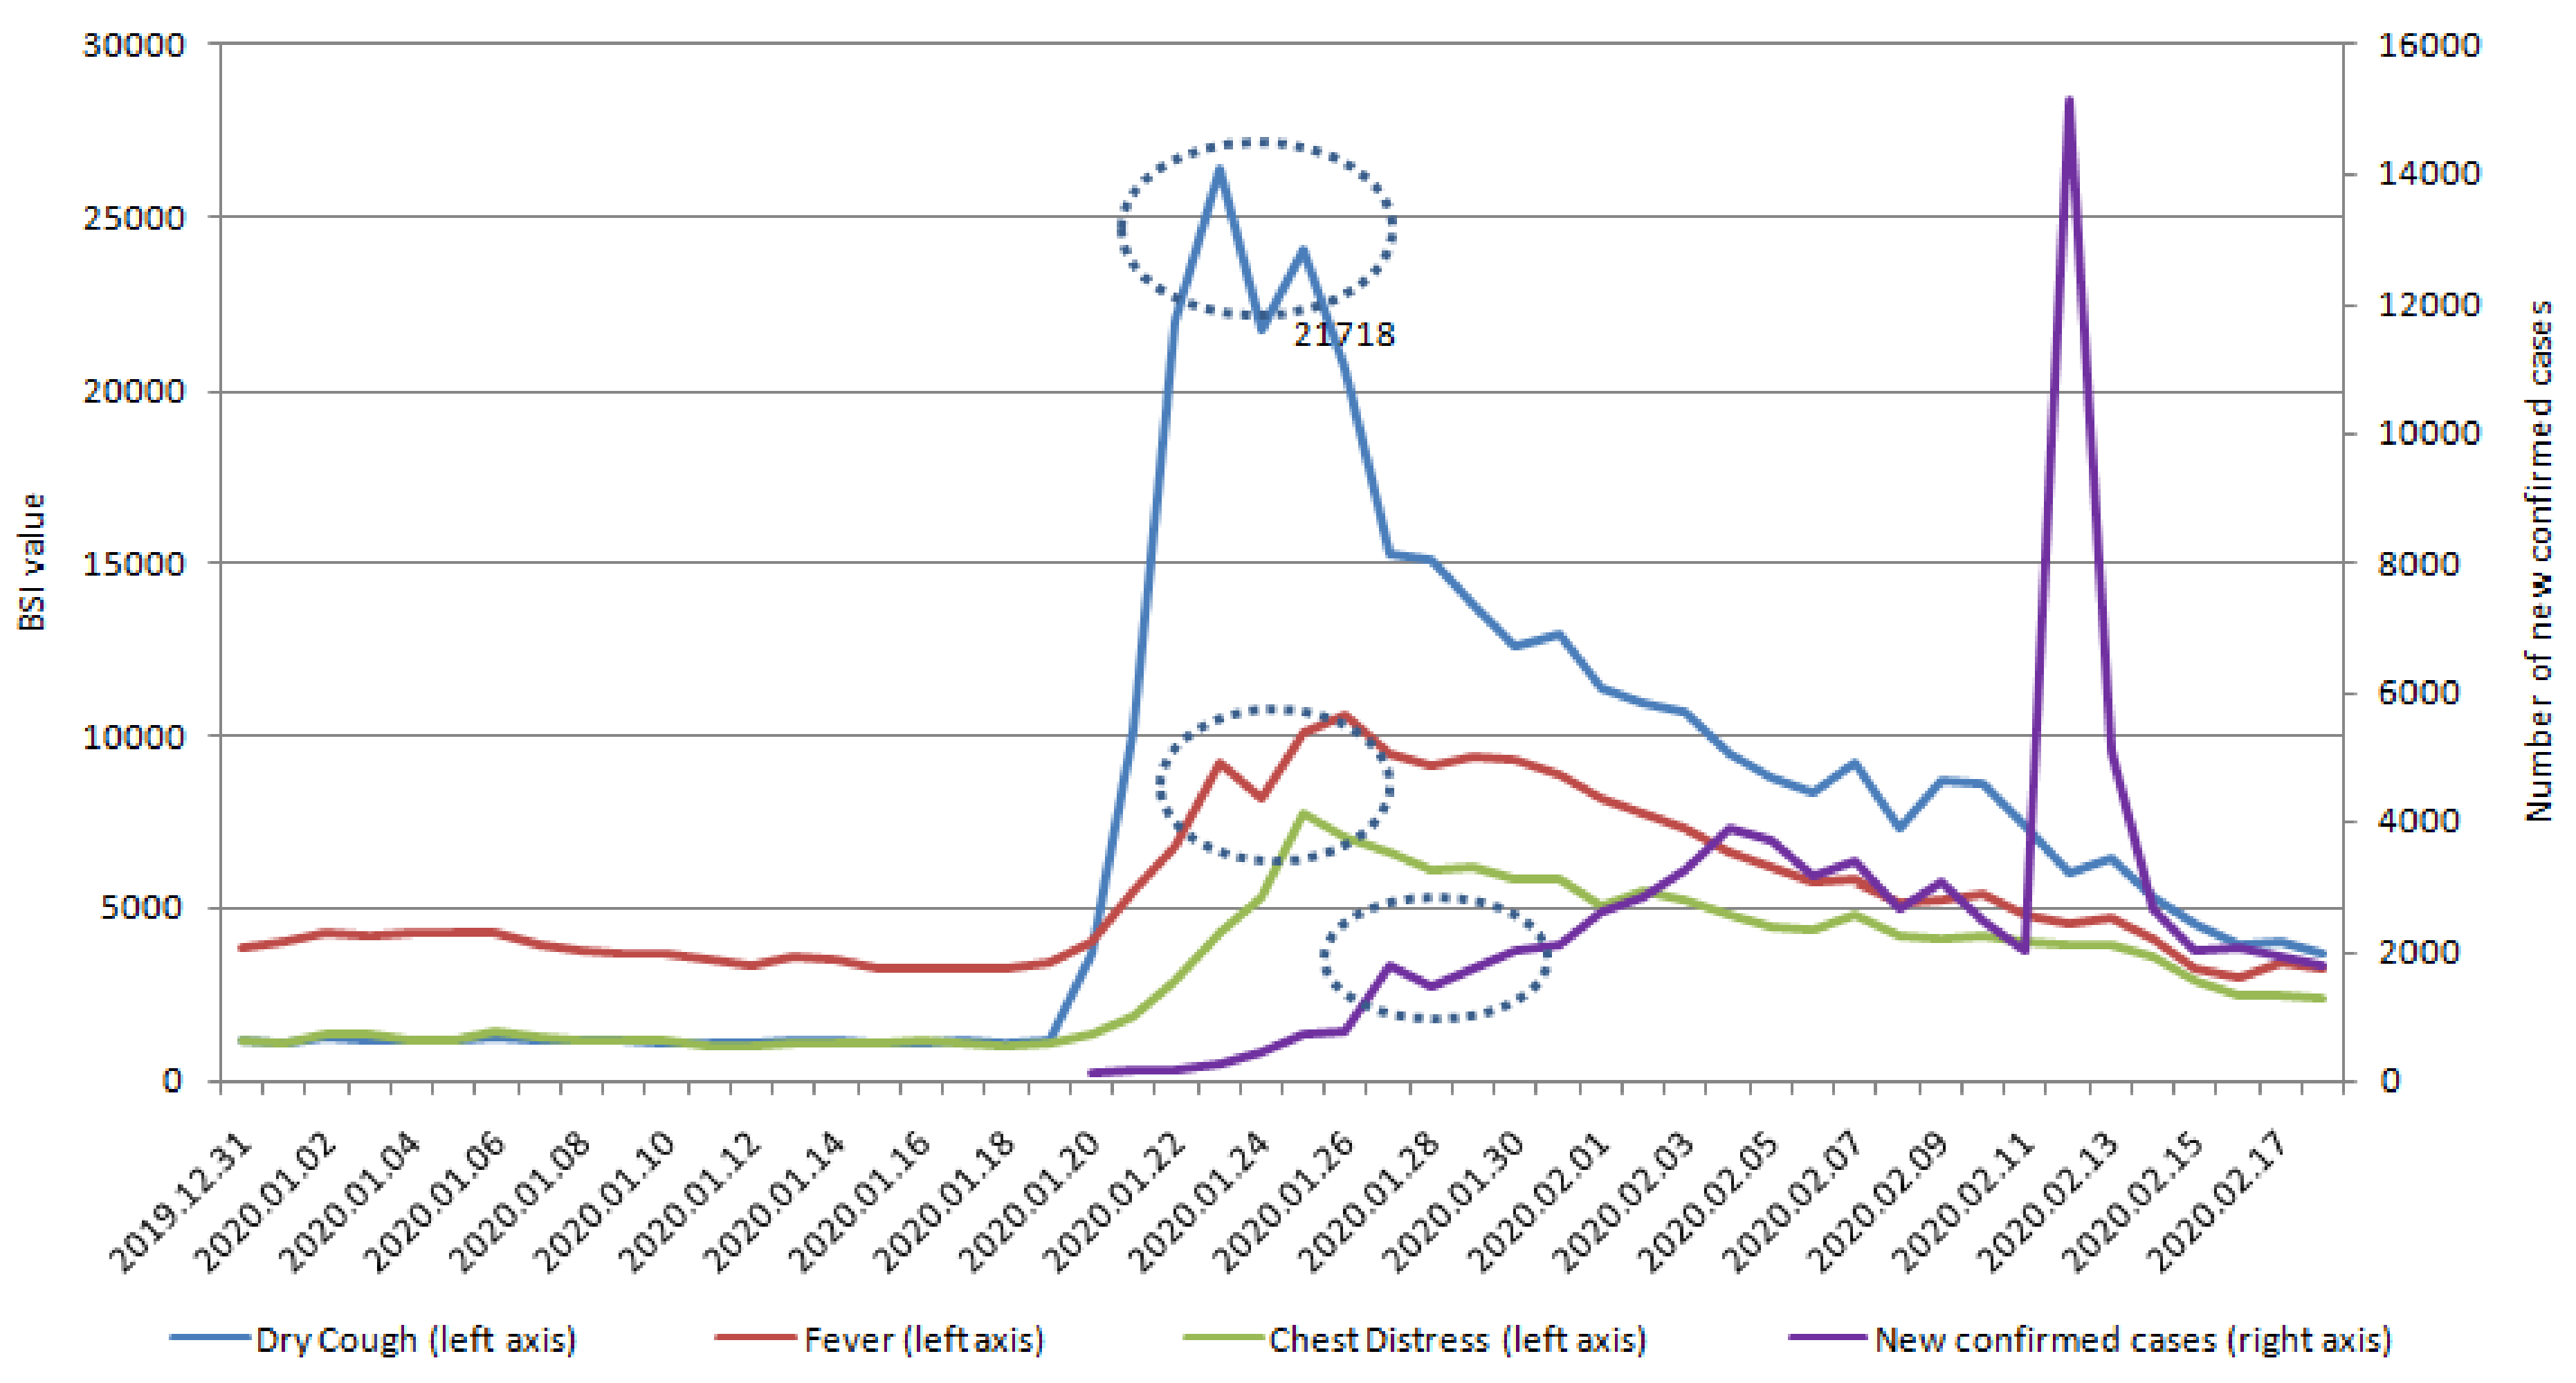
Six accuracy metrics were used to compare the performance of different methods: root mean squared error (RMSE), mean absolute error (MAE), mean absolute percentage error (MAPE), Pearson correlation, and the correlation of increment between Y ^ and Y .
R M S E Y ^ , Y = 1 / T [ t = 1 T ( Y ^ t Y t ) 2 ] 1 / 2 ,
M A E Y ^ , Y = 1 / T t = 1 T Y ^ t Y t ,
M A P E Y ^ , Y = 1 / T t = 1 T Y ^ t Y t / Y t ,
C o r r . o f . i n c r e m e n t = C o r r Y ^ t Y ^ t 1 , Y t Y t 1

3. Results

We display the positive correlation between the series of new suspected COVID-19 cases and the lagged series of five keywords in BSI (Table 1). In addition, we identified a significant positive correlation between the lag days of BSI and new suspected COVID-19 cases, which revealed that changes in SMSI behaviors occurred earlier (6–9 days) than the confirmation of COVID-19 infection cases (Figure 1 and Figure 2). The correlation between new suspected COVID-19 case number and lag value in SMSI was statistically significant (Table 1). In our study, the SMSI was a predictor of new suspected COVID-19 infection confirmed cases and could be detected earlier by 6–9 days before the confirmation of new COVID-19 infection cases.
Moreover, we summarize the accuracy metrics for five methods (Table 2). Among these methods, subset selection had the lowest RMSE, MAE, and MAPE and the highest correlation and correlation of increment, which indicated that it was the optimal method for explaining the data. The subset selection method only selected 10 of the 50 predictors. Figure 3 illustrates the prediction of the number of new COVID-19 cases and the error term. The prediction was close to the true series, and the error term was random and very small along the time axis, which confirmed that the subset selection method captured most of the relationship between search behaviors and the number of new COVID-19 cases.
Furthermore, we verified the optimal method of subset selection between the correlation and new confirmed COVID cases (Table 3). Table 1 reports significant correlations with SMSI on lag day 10 and new confirmed COVID-19 cases. The correlation between SMSI and new confirmed COVID-19 cases (nearly 50%) was lower than the correlation with new suspected COVID-19 cases (>80%; Table 1). The specific five keywords on lag 10 days were significantly correlated with new confirmed COVID-19 cases. The highest significant correlations, in order, were chest distress, fever, pneumonia, coronavirus, and dry cough on lag day 10. We also try to change some features (angina pectoris, difficulty urinating, impotence, urinary incontinence, dizziness) and compare the results with the original model results to illustrate the sensitivity of the model (Table A1). Because early symptoms do not include angina pectoris, difficulty urinating, impotence, urinary incontinence, or dizziness, we see no correlations between the lag time series of Baidu Indexes of these keywords. Based on these non-specific keywords, the overall estimation performance is worse with non-specific keywords. As a result, our prediction result is stable. Figure 1 and Figure 2 also demonstrate that the SMSI could be a predictor and detect COVID-19 cases, 10–12 days before they were confirmed.
We also identified similar patterns in SMSI and the series of new suspected and confirmed COVID-19 cases. Furthermore, the patterns appeared earlier in SMSI than in the series of new suspected and confirmed COVID-19 cases.

4. Discussion

Web and social media platforms have seen a rapid rise in user numbers, across both the developed and developing world [26]. Every day, millions of people self-report their symptoms online through social media, by using terms such as “fever,” “cough,” or “sore throat” [27]. Increasingly, people are using the Internet to search for information regarding their health [28]. An estimated 80% of all Internet users search for health information [29]. For instance, the number of tweets and searches related to an influenza-like illness increases during flu season. These anonymized data can help to track outbreaks across populations, almost instantaneously, and with geographically linked information [30]. Yahoo and Google have demonstrated that searches can detect outbreaks up to two weeks earlier than traditional disease surveillance [31]. The present study is the first to use BSI as the source of SMSI data in relation to COVID-19 epidemiology and investigate potential predictors of new suspected or confirmed COVID infection (Table 1 and Table 3). Tracking web data could allow a larger proportion of the population to be assessed, compared with traditional health surveillance methods [32].
Symptoms are not a diagnosis, and diseases can share common symptoms [33]. Therefore, accurate diagnosis or prediction of the underlying infectious agent remains the cornerstone of early warning systems, because it informs correct interventions [34]. SMSI-based models could serve as earlier, rapid, and affordable advanced sensing systems [35], which detect new suspected or confirmed COVID-19 infectious with specificity (Table 1, Table 3, Figure 1, Figure 2, Figure 4, Figure 5) and in real-time, enabling rapid and effective public health interventions.
Predicting new suspected or confirmed COVID-19 cases is crucial for developing targeted antiviral drugs, vaccines, or effective public health interventions, to prevent a future outbreak of COVID-19 [36]. In Table 1, the correlation between new suspected COVID-19 case numbers and lag value in SMSI was statistically significant. Changes in the SMSI could predict new suspected COVID-19 cases 6–9 days earlier. Moreover, our predictive method in SMSI was also significantly correlated with new confirmed COVID-19 10–12 days earlier (Table 3 and Figure 4 and Figure 5). The correlation was more than 80% between Lag value in SMSI and new suspected COVID-19 and nearly 50% with new confirmed COVID-19 cases. In Table 1, the correlations of coronavirus and pneumonia searches in social media were 0.8325 and 0.8130 (p value < 0.0001 and < 0.0001), respectively, nine days prior to the reporting of new suspected COVID-19 cases. Furthermore, dry cough, fever, coronavirus, and pneumonia searches were positively correlated with new suspected COVID-19 infections eight days earlier (Lag day 8; Table 1). The five keywords were all significantly correlated with new suspected COVID-19 cases, with correlation coefficients of 0.8288, 0.8896, 0.8396, 0.8301, and 0.8886 for dry cough, fever, chest distress, coronavirus, and pneumonia, respectively. The SMSI keyword search patterns occurred seven days before new suspected COVID-19 infection. The keyword search for fever and pneumonia was six days earlier than the new suspected COVID-19 cases, with over 90% correlation (Table 1). This SMSI could potentially be used to predict the areas and populations at risk of an outbreak of COVID-19. The SMSI in our study could be a predictor of COVID-19 infection, which would allow government health departments to formulate public health policies earlier and limit the spread of COVID-19 infection.
SMSI could be an effective and affordable tool for predicting emerging infectious diseases, and our findings in COVID-19 are compatible with studies on other emerging infectious diseases [35,37]. In Figure 1 and Figure 2, and Figure 4 and Figure 5, SMSI appeared to predict COVID-19 diagnosis a week early. Early prediction of COVID-19 infection benefits public health policies, by revealing specific infectious outbreak areas and at-risk populations, allowing governments to implement health policies to prevent the epidemic from expanding, as was the case with SARS [38]. Health authorities can educate highly susceptible populations in suspected infectious outbreak areas [38]. Public health policies may include the following: ensuring triage, early recognition, and source control (isolating patients with suspected COVID-19 infection); applying standard precautions for all patients; implementing empiric additional precautions (droplet, contact, and, airborne precautions, when necessary) for suspected cases of COVID-19 infection; implementing administrative controls; using environmental and engineering controls; and instructing the population not to eat raw eggs and to wash their hands with soap. The government should apply standard precautions for people who mention the five keywords (discomfort within 14 days) in SMSI. Standard precautions include hand and respiratory hygiene, the use of appropriate personal protective equipment, risk assessments, injection safety practices, safe waste management, proper linens, environmental cleaning, and sterilization of patient-care equipment [39]. Respiratory hygiene measures include ensuring that all patients cover their nose and mouth with a tissue or elbow when coughing or sneezing, offering medical masks to patients with suspected COVID-19 infection while they are in waiting in public areas or in cohort rooms, and exercising proper hand hygiene after contact with respiratory secretions [39]. If people have a history of long-term contact with birds, we suggest that they receive an influenza vaccine. We also recommend certain precautions for people who are highly susceptible to COVID-19 infection: consuming a balanced diet and exercising; not eating poultry eggs or products; never smuggling or purchasing meat from unknown birds; never touching or feeding migratory birds; never releasing or discarding birds; not mixing breeding birds with other poultry; and avoiding places with no air circulation or crowded places (such as traditional markets or hospitals, unless necessary). Moreover, SMSI may be more accurate in COVID-19 virus screening in highly suspected areas and populations; thus, government departments do not need to scramble for screening without specific targets, saving time, labor, and money for government health departments.
Table 2 summarizes different methods for the estimation of accuracy metrics in the highest correlation and incremental correlation. The last column of Table 2 presents the number of predictors after the application of the selection method. The number presented for the Ridge Regression is 50. We included the constant as a variable by mistake when calculating the number of variables, and corrected it in our manuscript. It does not mean that for each predictor the method relies on only two observations. Although the numbers of observation is less than the number of predictors, the application of these methods is correct, as they can handle the classical high-dimensional case. In our predictive model, subset selection was the optimal method for explaining the data. The subset selection method only selected 10 of the 50 possible predictors. Furthermore, the subset selection prediction of new suspected COVID-19 cases and the error term are displayed in Figure 3. The prediction in Figure 3 is close to the true series; the error term is random and very small along the time axis, which suggests that the subset selection method can capture most of the relationship between people’s search behavior and the new suspected COVID-19 case number. In our study, the highest correlation and incremental correlation in the subset selection model were 0.9996 and 0.9963, respectively. The intra-class correlation coefficient (ICC) is a robust correlation measure on section data, but our study is based on time series, so ICC may not be applicable. The highest correlation and incremental correlation were high enough to explain our model. Therefore, the subset selection method was optimal in our current predictor model, and our findings are compatible with those of previous studies [40,41].
Figure 1, Figure 2, Figure 4, Figure 5 display the outcomes of descriptive statistics. Figure 1 and Figure 2 illustrate that the keywords of fever and pneumonia were searched on social networks, six days before new suspected COVID-19 confirmed cases. The earliest keyword searches with a positive correlation over 80% were coronavirus and pneumonia, which was searched for nine days before new suspected COVID-19 cases. Using an SMSI to predict the outbreak of COVID-19 is affordable and effective and could be used to prevent people from hiding symptoms because they are afraid to seek medical attention, which may, in turn, lead to outbreaks.
This study is the first to investigate the possibility of using SMSI to predict outbreaks of COVID-19 in people in affected areas. The SMSI employed exhibited a high association with new suspected and confirmed COVID-19 cases. SMSI could be an effective early predictor, which would enable health government departments to locate potential and high-risk outbreak areas. Therefore, health government departments could prepare in advance for epidemic prevention and formulate new public health policies earlier.
This study has some limitations. First, people attempted to improve the accuracy of big data methods by, for instance, developing tools to overcome some of the problems that Google Flu Trends has recently encountered, including surges in media interest, which distorts the reported numbers of self-reported symptoms. COVID-19 is a novel infectious disease; thus, distorted reported numbers of self-reported symptoms may be unavoidable. Second, BSI is more popular than Google or Twitter use in China; thus, we have no other social network to validate our data. Therefore, the high usage rate of BSI in China is the principal corroborator of our conclusions. Third, statistically, early symptoms of COVID-19 are related to suspected patients, but not determining factors for new confirmed COVID-19 patients. New confirmed COVID-19 patients have been determined by the nucleic acid test. In addition, other respiratory diseases with similar symptoms might be the bias in the predictor model. Thus, the correlations between SMSI and new confirmed COVID-19 cases were lower than the correlation between SMSI and new suspected COVID-19 cases. Therefore, although the association between SMSI and new confirmed COVID-19 cases was strong, SMSI might be a good reference of potential outbreak of COVID-19, not a definitive tool for new confirmed COVID-19 cases.

5. Conclusions

Using SMSI to predict the outbreak of COVID-19 in populations in affected areas could be effective, and demonstrated a high correlation with new suspected and confirmed COVID-19 infection cases. SMSI could be an effective early predictor, which would enable health government departments to locate potential and high-risk outbreak areas. Therefore, health government departments could prepare in advance for epidemic prevention and formulate new public health policies earlier.

Author Contributions

Conceptualization, L.Q., B.-C.S. and S.-Y.W.; methodology, L.Q., B.-C.S. and S.-Y.W.; software, L.Q., B.-C.S. and S.-Y.W.; validation, S.-Y.W.; formal analysis, L.Q.; investigation, L.Q., B.-C.S. and S.-Y.W.; resources, B.-C.S. and S.-Y.W.; data curation, L.Q., B.-C.S. and S.-Y.W.; writing—original draft preparation, L.Q., Q.S., Y.W., K.-F.W., M.C., B.-C.S. and S.-Y.W.; funding acquisition, L.Q., B.-C.S. and S.-Y.W. All authors have read and agreed to the published version of the manuscript.

Funding

This research was funded by Lo-Hsu Medical Foundation, Lotung Poh-Ai Hospital, grant number 10908 and 10909” by Szu-Yuan Wu and Lei Qin was funded by University of International Business and Economics Huiyuan outstanding young scholars research funding (17YQ15)” and he Fundamental Research Funds for the central Universities" in UIBE (CXTD10-10). Ben-Chang Shia was funded by an institutional grant from Taipei Medical University (Taipei, Taiwan) for New Faculty Research (TMU103-AE1-B22).

Acknowledgments

Lo-Hsu Medical Foundation, Lotung Poh-Ai Hospital, supports Szu-Yuan Wu’s work (Funding Number: 10908 and 10909). Lei Qin’s work is supported by University of International Business and Economics Huiyuan outstanding young scholars research funding (17YQ15), "the Fundamental Research Funds for the central Universities" in UIBE (CXTD10-10).

Conflicts of Interest

The authors have no potential conflicts of interest to declare. The data sets supporting the study conclusions are included within the manuscript.

Appendix A

Table A1. Correlation between new-confirmed cases number and lag time series of five non-specific COVID-19 features.
VariablesAngina PectorisDifficulty UrinatingImpotenceUrinary IncontinenceDizziness
Lag 1 Day
(p Value)
0.32430.71970.73270.26460.8089
(0.1515)(0.2382)(0.1137)(0.2464)(0.4781)
Lag 2 Day
(p Value)
0.14280.63230.63090.03590.8702
(0.5368)(0.7821)(0.4522)(0.8772)(0.1603)
Lag 3 Day
(p Value)
0.00860.56990.6210−0.04790.9599
(0.9705)(0.6870)(0.1927)(0.8367)(0.9775)
Lag 4 Day
(p Value)
−0.25840.39130.5375−0.31960.9445
(0.2581)(0.0794)(0.1120)(0.1578)(0.8720)
Lag 5 Day
(p Value)
−0.48840.23440.3950−0.48540.9082
(0.0747)(0.3065)(0.5764)(0.4257)(0.0861)
Lag 6 Day
(p Value)
−0.58260.12150.3021−0.60540.8637
(0.1156)(0.5998)(0.1833)(0.1136)(0.1561)
Lag 7 Day
(p Value)
−0.6768−0.07970.2362−0.71900.8054
(0.7438)(0.7313)(0.3026)(0.9922)(0.4460)
Lag 8 Day
(p Value)
−0.7272−0.11960.1444−0.73580.7309
(0.0965)(0.6055)(0.5322)(0.3351)(0.1172)
Lag 9 Day
(p Value)
−0.6612−0.3142−0.0412−0.77230.6429
(0.9211)(0.1654)(0.8594)(0.9945)(0.1779)
Lag 10 Day
(p Value)
−0.6386−0.2417−0.0971−0.69620.5584
(0.6418)(0.2912)(0.6754)(0.6625)(0.2485)
Table A1 shows the correlation between the current series of new confirmed cases number and the lagged series of five Baidu Indexes (ie. C o r r ( N t , I n d e x t s ) , where N t is the new confirmed cases number, I n d e x t s is the lag and s is the days/time series of the Baidu Index).

References

  1. Novel Coronavirus COVID-19 in China—Statistics & Facts; Health & Pharmaceuticals: Statistics and Facts on Health and Pharmaceuticals: New York, NY, USA, 2020.
  2. Liem, A.; Wang, C.; Wariyanti, Y.; Latkin, C.A.; Hall, B.J. The neglected health of international migrant workers in the COVID-19 epidemic. Lancet Psychiatry 2020, 7, 20. [Google Scholar] [CrossRef]
  3. Duan, L.; Zhu, G. Psychological interventions for people affected by the COVID-19 epidemic. Lancet Psychiatry 2020, 7. [Google Scholar] [CrossRef]
  4. Lai, C.C.; Shih, T.P.; Ko, W.C.; Tang, H.J.; Hsueh, P.R. Severe acute respiratory syndrome coronavirus 2 (SARS-CoV-2) and corona virus disease-2019 (COVID-19): The epidemic and the challenges. Int. J. Antimicrob. Agents 2020, 105924. [Google Scholar] [CrossRef] [PubMed]
  5. Velavan, T.P.; Meyer, C.G. The COVID-19 epidemic. Trop. Med. Int. Health 2020, 25, 278–280. [Google Scholar] [CrossRef] [PubMed] [Green Version]
  6. World Health Organization. Infection Prevention and Control during Health Care When Novel Coronavirus (nCoV) Infection Is Suspected. Available online: https://www.who.int/publications-detail/infection-prevention-and-control-during-health-care-when-novel-coronavirus-(ncov)-infection-is-suspected-20200125 (accessed on 4 February 2020).
  7. Robert, R.R.; Interim U.S. Guidance for Risk Assessment and Public Health Management of Healthcare Personnel with Potential Exposure in a Healthcare Setting to Patients with Coronavirus Disease (COVID-19). Available online: https://www.cdc.gov/coronavirus/2019-ncov/hcp/guidance-risk-assesment-hcp.html (accessed on 7 March 2020).
  8. World Health Organization. Coronavirus Disease 2019 (COVID-19) Situation Report—36. Available online: https://www.who.int/docs/default-source/coronaviruse/situation-reports/20200225-sitrep-36-covid-19.pdf?sfvrsn=2791b4e0_2 (accessed on 26 February 2020).
  9. Heymann, D.L.; Shindo, N. WHO Scientific and Technical Advisory Group for Infectious Hazards COVID-19: What is next for public health? Lancet 2020, 395. [Google Scholar] [CrossRef] [Green Version]
  10. Gostin, L.O.; Hodge, J.G., Jr. US emergency legal responses to novel coronavirus: Balancing public health and civil liberties. JAMA 2020, 323, 1131–1132. [Google Scholar] [CrossRef]
  11. Smith, N.; Fraser, M. Straining the system: Novel coronavirus (COVID-19) and preparedness for concomitant disasters. Am. J. Public Health 2020, e1–e2. [Google Scholar] [CrossRef]
  12. Wang, C.; Horby, P.W.; Hayden, F.G.; Gao, G.F. A novel coronavirus outbreak of global health concern. Lancet 2020, 395, 470–473. [Google Scholar] [CrossRef] [Green Version]
  13. Shi, H.; Han, X.; Zheng, C. Evolution of CT manifestations in a patient recovered from 2019 novel coronavirus (2019-nCoV) pneumonia in Wuhan, China. Radiology 2020, 200269. [Google Scholar] [CrossRef]
  14. Xu, X.; Chen, P.; Wang, J.; Feng, J.; Zhou, H.; Li, X.; Zhong, W.; Hao, P. Evolution of the novel coronavirus from the ongoing Wuhan outbreak and modeling of its spike protein for risk of human transmission. Sci. China Life Sci. 2020, 63, 457–460. [Google Scholar] [CrossRef] [Green Version]
  15. Lau, S.K.; Lee, P.; Tsang, A.K.; Yip, C.C.; Tse, H.; Lee, R.A.; So, L.Y.; Lau, Y.L.; Chan, K.H.; Woo, P.C.; et al. Molecular epidemiology of human coronavirus OC43 reveals evolution of different genotypes over time and recent emergence of a novel genotype due to natural recombination. J. Virol. 2011, 85, 11325–11337. [Google Scholar] [CrossRef] [PubMed] [Green Version]
  16. Seo, D.W.; Shin, S.Y. Methods using social media and search queries to predict infectious disease outbreaks. Healthc. Inform. Res. 2017, 23, 343–348. [Google Scholar] [CrossRef] [PubMed] [Green Version]
  17. Meyers, L.A.; Pourbohloul, B.; Newman, M.E.; Skowronski, D.M.; Brunham, R.C. Network theory and SARS: Predicting outbreak diversity. J. Theory Biol. 2005, 232, 71–81. [Google Scholar] [CrossRef] [PubMed]
  18. Alessa, A.; Faezipour, M. A review of influenza detection and prediction through social networking sites. Theor. Biol. Med. Model. 2018, 15, 2. [Google Scholar] [CrossRef] [Green Version]
  19. Liu, D.; Guo, S.; Zou, M.; Chen, C.; Deng, F.; Xie, Z.; Hu, S.; Wu, L. A dengue fever predicting model based on Baidu search index data and climate data in South China. PLoS ONE 2019, 14, e0226841. [Google Scholar] [CrossRef] [Green Version]
  20. Seo, D.W.; Jo, M.W.; Sohn, C.H.; Shin, S.Y.; Lee, J.; Yu, M.; Kim, W.Y.; Lim, K.S.; Lee, S.I. Cumulative query method for influenza surveillance using search engine data. J. Med. Internet Res. 2014, 16, e289. [Google Scholar] [CrossRef] [Green Version]
  21. Lazer, D.; Kennedy, R.; King, G.; Vespignani, A. Big data. The parable of Google Flu: Traps in big data analysis. Science 2014, 343, 1203–1205. [Google Scholar] [CrossRef]
  22. Search Engines in China —Statistics & Facts. Available online: https://www.statista.com/topics/1337/search-engines-in-china/ (accessed on 7 November 2019).
  23. Zhao, S.; Lin, Q.; Ran, J.; Musa, S.S.; Yang, G.; Wang, W.; Lou, Y.; Gao, D.; Yang, L.; He, D.; et al. Preliminary estimation of the basic reproduction number of novel coronavirus (2019-nCoV) in China, from 2019 to 2020: A data-driven analysis in the early phase of the outbreak. Int. J. Infect. Dis. 2020, 92, 214–217. [Google Scholar] [CrossRef] [Green Version]
  24. Gao, J.; Tian, Z.; Yang, X. Breakthrough: Chloroquine phosphate has shown apparent efficacy in treatment of COVID-19 associated pneumonia in clinical studies. Biosci. Trends 2020, 14. [Google Scholar] [CrossRef] [Green Version]
  25. Calisher, C.; Carroll, D.; Colwell, R.; Corley, R.B.; Daszak, P.; Drosten, C.; Enjuanes, L.; Farrar, J.; Field, H.; Golding, J.; et al. Statement in support of the scientists, public health professionals, and medical professionals of China combatting COVID-19. Lancet 2020, 395. [Google Scholar] [CrossRef] [Green Version]
  26. Oh, H.J.; Lee, H. When do people verify and share health rumors on social media? The effects of message importance, health anxiety, and health literacy. J. Health Commun. 2019, 24, 837–847. [Google Scholar] [CrossRef] [PubMed]
  27. Schmidt, C.W. Trending now: Using social media to predict and track disease outbreaks. Environ. Health Perspect. 2012, 120, A30–A33. [Google Scholar] [CrossRef] [PubMed]
  28. Zhao, Y.; Zhang, J. Consumer health information seeking in social media: A literature review. Health Inf. Libr. J. 2017, 34, 268–283. [Google Scholar] [CrossRef] [PubMed] [Green Version]
  29. Chen, Y.Y.; Li, C.M.; Liang, J.C.; Tsai, C.C. Health information obtained from the internet and changes in medical decision making: Questionnaire development and cross-sectional survey. J. Med. Internet Res. 2018, 20, e47. [Google Scholar] [CrossRef] [PubMed] [Green Version]
  30. Eysenbach, G. Infodemiology: Tracking flu-related searches on the web for syndromic surveillance. AMIA Annu. Symp. Proc. 2006, 244, 244–248. [Google Scholar]
  31. Polgreen, P.M.; Chen, Y.; Pennock, D.M.; Nelson, F.D. Using internet searches for influenza surveillance. Clin. Infect. Dis. 2008, 47, 1443–1448. [Google Scholar] [CrossRef] [Green Version]
  32. Nsubuga, P.; White, M.E.; Thacker, S.B.; Anderson, M.A.; Blount, S.B.; Broome, C.V.; Chiller, T.M.; Espitia, V.; Imtiaz, R.; Sosin, D.; et al. Public health surveillance: A tool for targeting and monitoring interventions. In Disease Control Priorities in Developing Countries; Jamison, D.T., Breman, J.G., Measham, A.R., Alleyne, G., Claeson, M., Evans, D.B., Jha, P., Mills, A., Musgrove, P., Eds.; Europe PMC: Washington, DC, USA, 2006. [Google Scholar]
  33. Aiarzaguena, J.M.; Grandes, G.; Salazar, A.; Gaminde, I.; Sanchez, A. The diagnostic challenges presented by patients with medically unexplained symptoms in general practice. Scand. J. Prim. Health Care 2008, 26, 99–105. [Google Scholar] [CrossRef]
  34. Mack, A.; Choffnes, E.R.; Sparling, P.F.; Hamburg, M.A.; Lemon, S.M. Global Infectious Disease Surveillance and Detection: Assessing the Challenges-Finding Solutions, Workshop Summary; The National Academy of Science Engineering and Medicine: Washington, DC, USA, 2007. [Google Scholar] [CrossRef]
  35. Welch, V.; Petkovic, J.; Pardo Pardo, J.; Rader, T.; Tugwell, P. Interactive social media interventions to promote health equity: An overview of reviews. Health Promot. Chronic Dis. Prev. Can. 2016, 36, 63–75. [Google Scholar] [CrossRef]
  36. Feng, Z.; Li, Q.; Zhang, Y. Novel Coronavirus Pneumonia Emergency Response Epidemiology, The epidemiological characteristics of an outbreak of 2019 novel coronavirus diseases (COVID-19) in China. Zhonghua Liu Xing Bing Xue Za Zhi 2020, 41, 145–151. [Google Scholar] [CrossRef]
  37. Christaki, E. New technologies in predicting, preventing and controlling emerging infectious diseases. Virulence 2015, 6, 558–565. [Google Scholar] [CrossRef] [Green Version]
  38. Madhav, N.; Oppenheim, B.; Gallivan, M.; Mulembakani, P.; Rubin, E.; Wolfe, N. Pandemics: Risks, impacts, and mitigation. In Disease Control Priorities: Improving Health and Reducing Poverty; Jamison, D.T., Gelband, H., Horton, S., Jha, P., Laxminarayan, R., Mock, C.N., Nugent, R., Eds.; World Bank: Washington, DC, USA, 2017. [Google Scholar] [CrossRef]
  39. Coronavirus Disease (COVID-19) Technical Guidance. Available online: https://www.who.int/emergencies/diseases/novel-coronavirus-2019/technical-guidance (accessed on 1 February 2020).
  40. Farkas, O.; Heberger, K. Comparison of ridge regression, partial least-squares, pairwise correlation, forward- and best subset selection methods for prediction of retention indices for aliphatic alcohols. J. Chem. Inf. Model. 2005, 45, 339–346. [Google Scholar] [CrossRef] [PubMed]
  41. Degroeve, S.; De Baets, B.; Van de Peer, Y.; Rouze, P. Feature subset selection for splice site prediction. Bioinformatics 2002, 18, S75–S83. [Google Scholar] [CrossRef] [PubMed] [Green Version]
Figure 1. New suspected cases of COVID-19 and lag days of dry cough, fever, and chest distress.
Ijerph 17 02365 g001
Figure 2. New suspected cases of COVID-19 and lag days of coronavirus and pneumonia.
Ijerph 17 02365 g002
Figure 3. The prediction by subset selection and the error term.
Ijerph 17 02365 g003
Figure 4. New confirmed COVID-19 cases and lag days of dry cough, fever, and chest distress.
Ijerph 17 02365 g004
Figure 5. New confirmed COVID-19 and lag days of coronavirus and pneumonia.
Ijerph 17 02365 g005
Table 1. Correlation between new suspected Coronavirus disease 2019 (COVID-19) case number and lag value of five keywords in Baidu search index (BSI).
VariablesDry CoughFeverChest DistressCoronavirusPneumonia
Lag 1 Day
(p Value)
−0.10700.35860.6493−0.20940.1922
(0.6445)(0.1105)(0.0014)(0.3623)(0.4039)
Lag 2 Day
(p Value)
0.14880.56500.74680.06260.4111
(0.5198)(0.0076)(0.0001)(0.7876)(0.0641)
Lag 3 Day
(p Value)
0.41830.78560.85900.38280.6517
(0.0591)(<0.0001)(<0.0001)(0.0868)(0.0014)
Lag 4 Day
(p Value)
0.58680.85960.90070.58470.7824
(0.0052)(<0.0001)(<0.0001)(0.0054)(<0.0001)
Lag 5 Day
(p Value)
0.69200.91470.91750.73520.8813
(0.0005)(<0.0001)(<0.0001)(0.0001)(<0.0001)
Lag 6 Day
(p Value)
0.77790.91240.89200.78310.9030
(<0.0001)(<0.0001)(<0.0001)(<0.0001)(<0.0001)
Lag 7 Day
(p Value)
0.82880.88960.83960.83010.8886
(<0.0001)(<0.0001)(<0.0001)(<0.0001)(<0.0001)
Lag 8 Day
(p Value)
0.84180.83610.77660.87950.8832
(<0.0001)(<0.0001)(<0.0001)(<0.0001)(<0.0001
Lag 9 Day
(p Value)
0.77580.73810.69350.83250.8130
(<0.0001)(0.0001)(0.0005)(<0.0001)(<0.0001)
Lag 10 Day
(p Value)
0.70770.66470.60440.77320.7306
(0.0003)(0.0010)(0.0037)(<0.0001)(0.0002)
Table 1 reports the correlation between the current series of new confirmed case number and the lagged series of five Baidu indices (i.e., C o r r ( N t , I n d e x t s ) , where N t is the new confirmed cases number, I n d e x t s where N t is the new confirmed case number, I n d e x t s is the lag, and s is the days/time series of the Baidu Index).
Table 2. Comparison of five methods for the estimation.
VariablesRMSEMAEMAPECorrelationCorrelation of IncrementNumber of Predictor
Subset Selection51.667134.07390.01070.99960.996310
Forward Selection70.016839.97900.01130.99930.991315
Ridge Regression415.2922279.67880.08270.97410.693751
Lasso Regression519.7440358.09790.10320.95970.48589
Elastic Net(alpha = 0.2)527.4250360.95630.10850.95850.483124
Elastic Net(alpha = 0.4)516.1075347.59390.10410.96020.503718
Elastic Net(alpha = 0.6)514.7714347.72900.10360.96040.490614
Elastic Net(alpha = 0.8)510.1201348.58590.10330.96110.502311
Table 3. Correlation between new confirmed cases number and lag time series of five Baidu Indexes.
VariablesDry CoughFeverChest DistressCoronavirusPneumonia
Lag 1 Day
(p Value)
−0.2444−0.15880.0852−0.3125−0.2046
(0.1930)(0.4020)(0.6544)(0.0927)(0.2781)
Lag 2 Day
(p Value)
−0.1130−0.01860.1971−0.1861−0.0720
(0.5523)(0.9221)(0.2964)(0.3248)(0.7055)
Lag 3 Day
(p Value)
−0.02350.04790.2392−0.09680.0276
(0.9017)(0.8014)(0.2030)(0.6108)(0.8849)
Lag 4 Day
(p Value)
0.02570.11690.29540.01440.1360
(0.8929)(0.5386)(0.1130)(0.9397)(0.4737)
Lag 5 Day
(p Value)
0.12990.21690.39000.11340.2269
(0.4938)(0.2496)(0.0331)(0.5506)(0.2279)
Lag 6 Day
(p Value)
0.16590.26630.38950.18630.2861
(0.3809)(0.1549)(0.0334)(0.3243)(0.1253)
Lag 7 Day
(p Value)
0.21900.32710.41280.24420.3368
(0.2449)(0.0776)(0.0234)(0.1934)(0.0688)
Lag 8 Day
(p Value)
0.27290.37570.44400.28910.3621
(0.1446)(0.0407)(0.0140)(0.1213)(0.0493)
Lag 9 Day
(p Value)
0.34220.43810.48790.34610.4061
(0.0641)(0.0155)(0.0062)(0.0610)(0.0260)
Lag 10 Day
(p Value)
0.38230.46660.49980.38430.4363
(0.0371)(0.0093)(0.0049)(0.0360)(0.0159)
Table 3 shows the correlation between the current series of new confirmed cases number and the lagged series of five Baidu Indexes (i.e., C o r r ( N t , I n d e x t s ) , where N t is the new confirmed cases number, I n d e x t s is the lag, and s is the days/time series of the Baidu Index).

