Empirical Evidence for Professional Practice and Public Policies: An Exploratory Study on Social Exclusion in Users of Primary Care Social Services in Spain

 , and
, and
Abstract
:1. Introduction
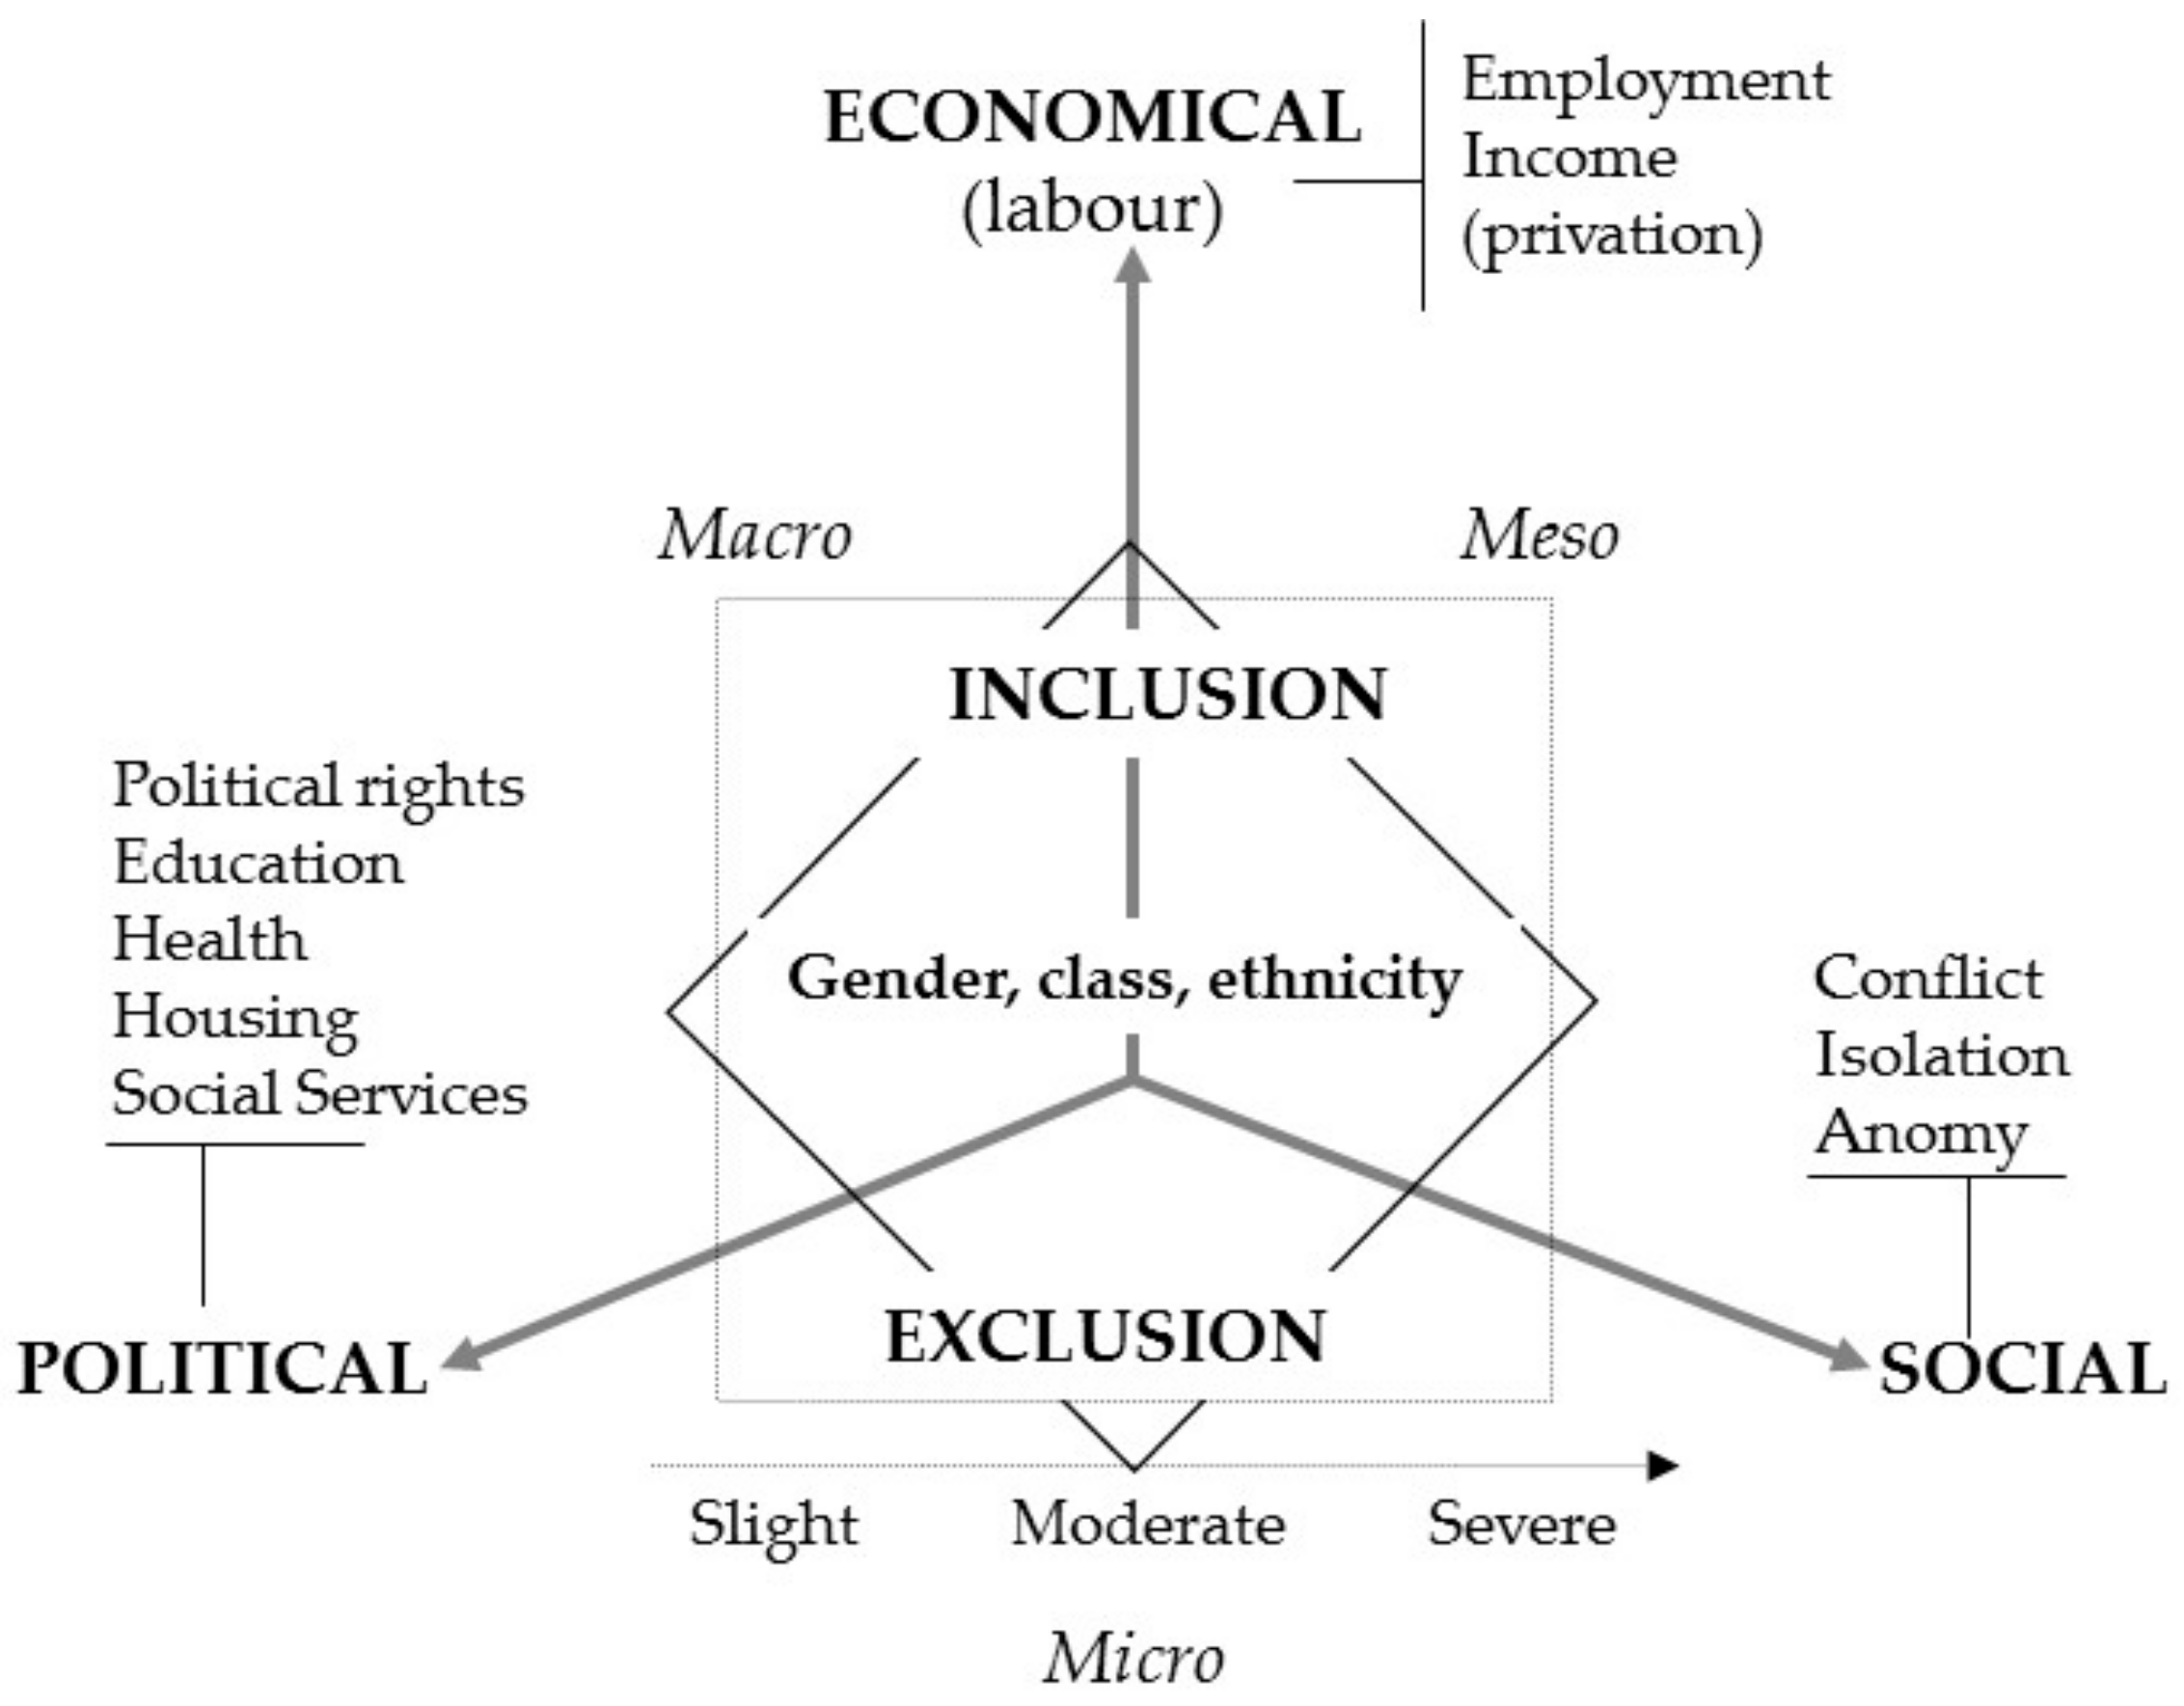
1.1. Social Exclusion
- Structural origin: The causes are structural, derived from inequalities generated by the socioeconomic, political and cultural model.
- Multidimensional character: Social exclusion affects multiple dimensions or facets of people’s lives over time.
- The dynamic nature of the process: Social exclusion is not static, rather the intensity and scope vary with the life cycle of people over time.
1.2. Social Services and Social Exclusion
2. Materials and Methods
2.1. Participants
- People served by professionals (with direct interaction and not through a third party) in the first care services during the data collection period.
- People between 18 and 65 years old and emancipated minors (16 years or older).
- If data from all cases could be collected in a single day, they followed the order of appointment.
- If the above could not be done, they collected select cases cited on different days and in different time slots.
2.2. Instrument
2.3. Procedure
2.4. Ethical Issues
2.5. Data Analysis
3. Results
3.1. Sociodemographic Profile
- Women made up 15% more of the sample than the general inhabitant population (50.1%).
- The study population was over-represented in terms of those aged 25 to 29 (with differences between 0.5% and 6%), while for the rest of the intervals (minors under age 25 and those over age 59) it was under-represented (with differences of 2.4% and 5.8%).
- The family units with five or more members were over-represented in the study population with respect to the Census (with differences between 0.1% and 8.4%), and especially units with five and six members. The family units with one to four people were under-represented (with differences between 0.6% and 10.9%).
- In the sample, there was 29% greater foreign population than the resident population.
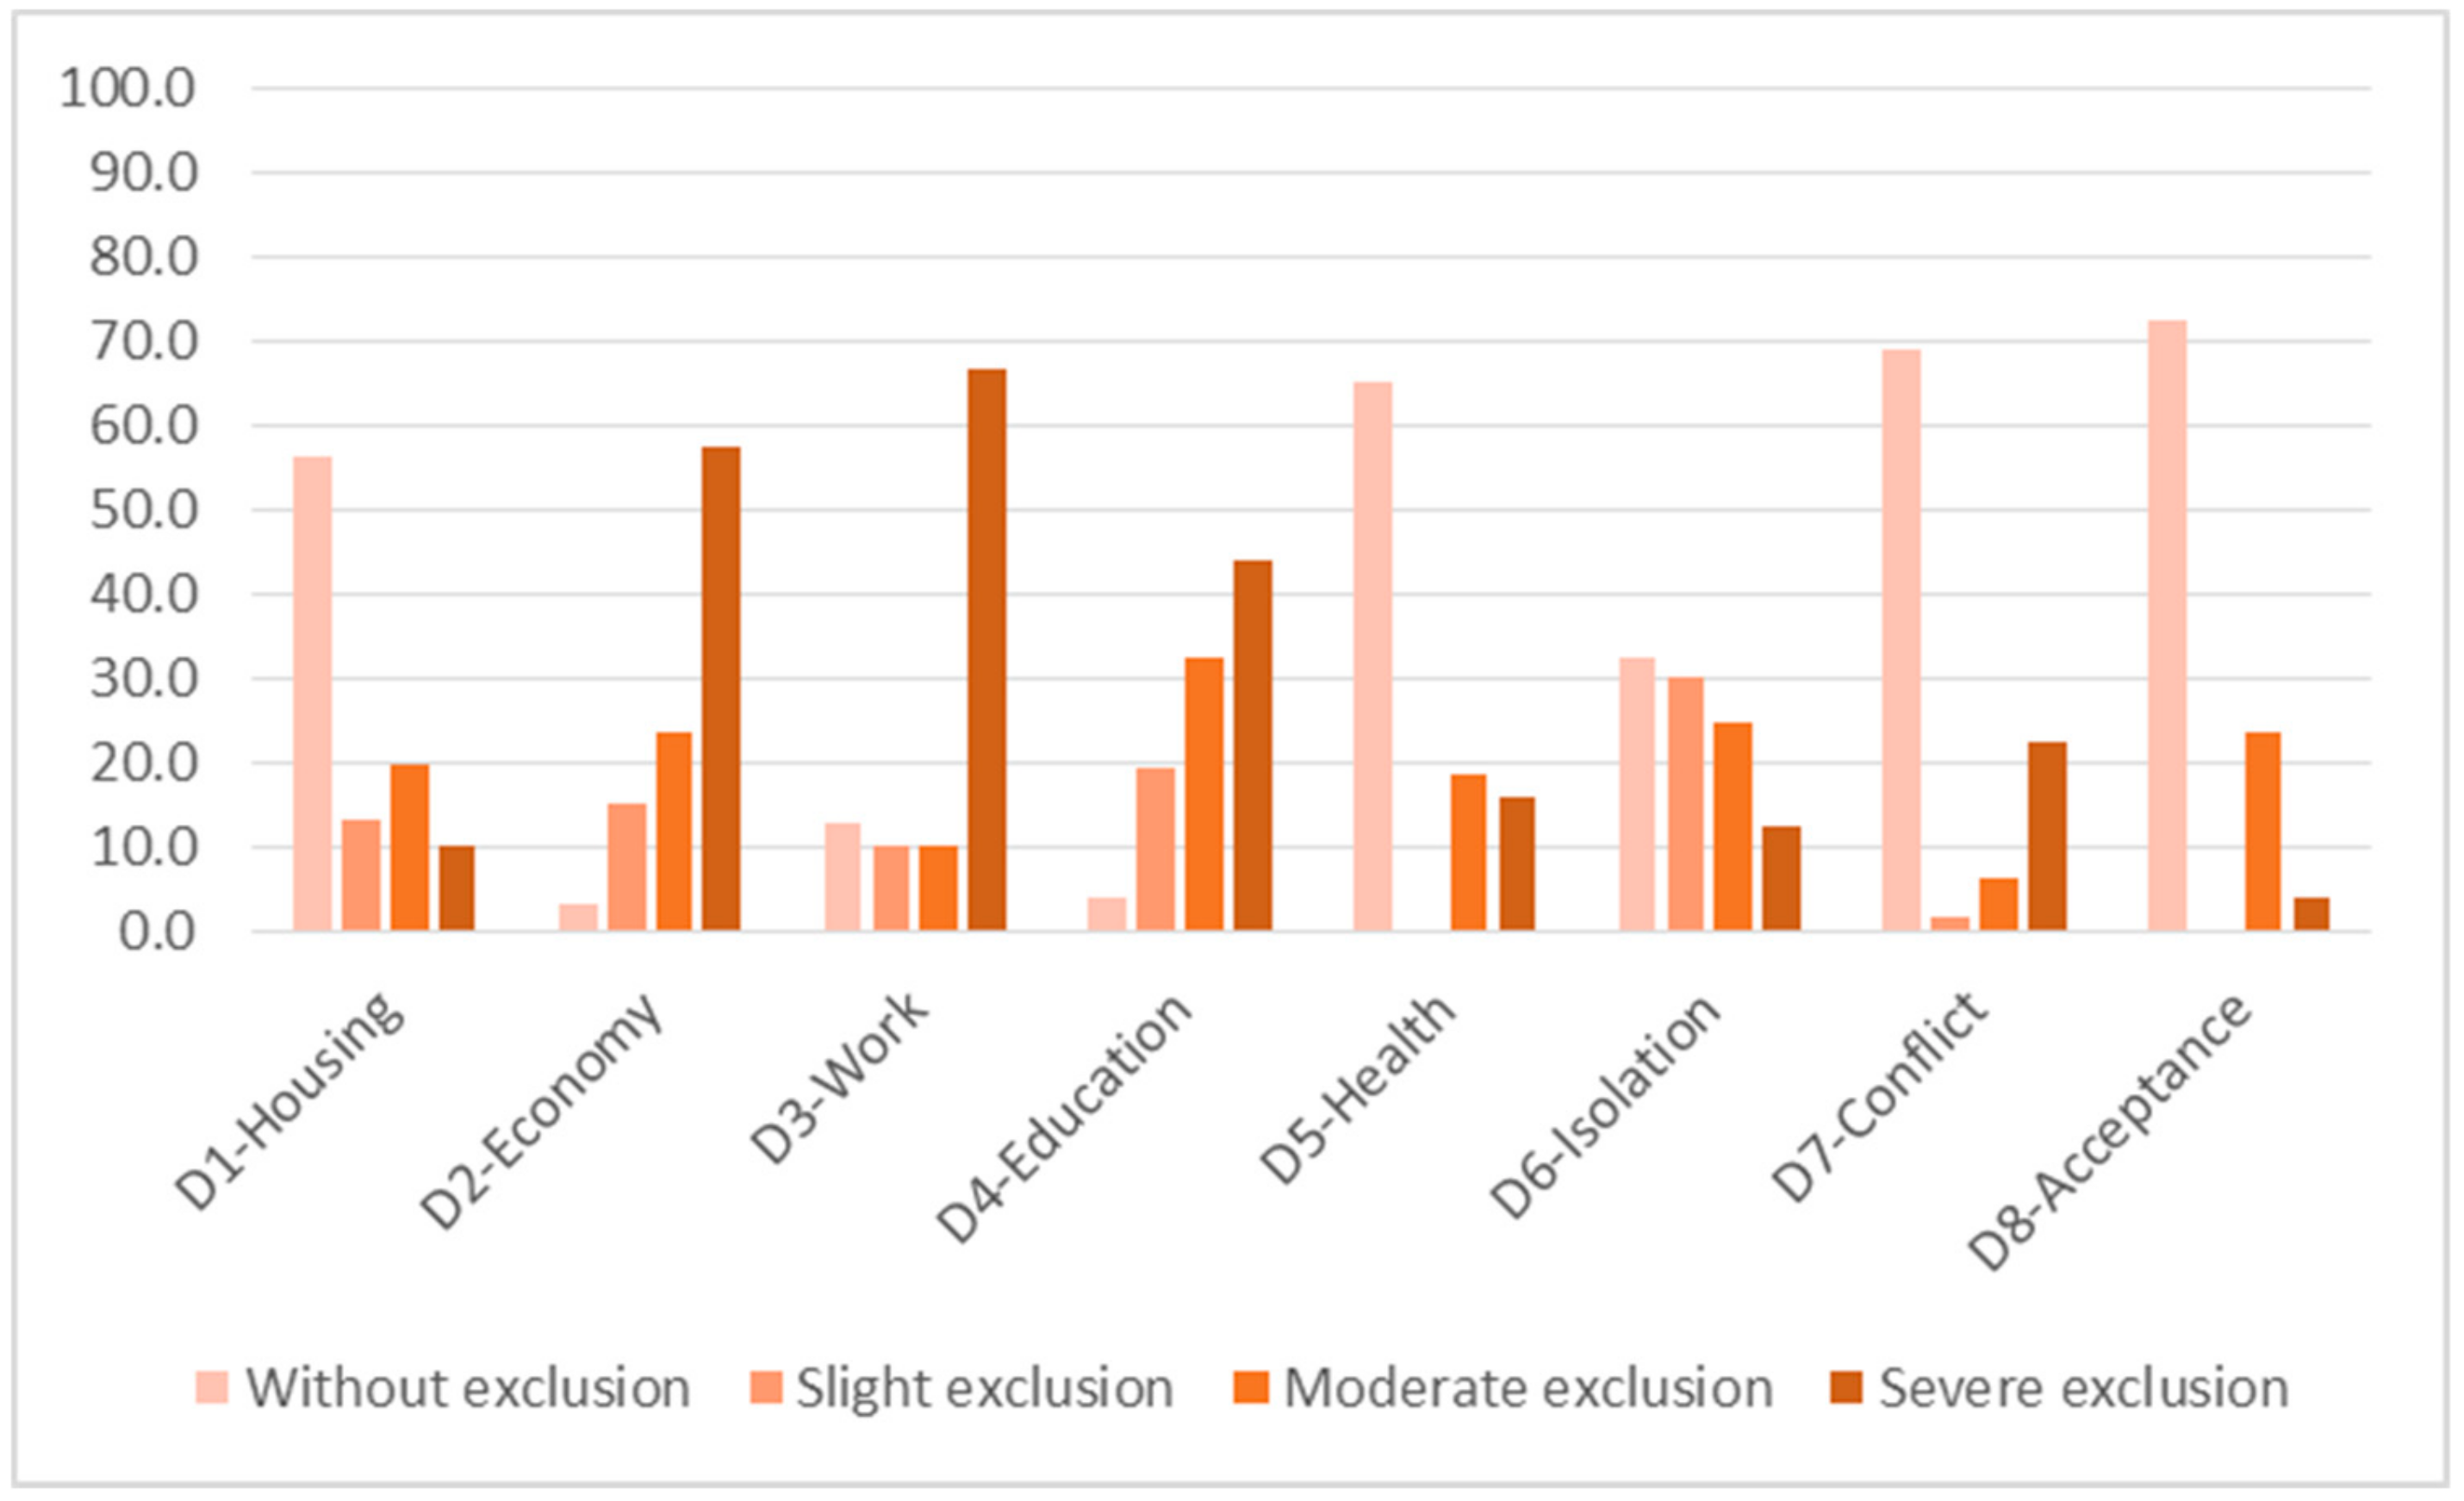
3.2. Scope and Intensity of Social Exclusion
- 1.
- Dimensions with greatest levels of exclusion are:
- D3—Work. Severe exclusion affects 67%, and moderate exclusion affects 10%. Both are present in 77% of the total.
- D2—In terms of the economic situation/income level, severe exclusion affects 58% of people and moderate exclusion affects 24%. Together they make up 81% of the total.
- D4—In terms of education and training, severe exclusion affects 44% and moderate exclusion affects 33%. Both are present in 77% of the total.
- 2.
- The dimensions in which the majority of people do not present social exclusion or present slight exclusion are, in the following order:
- D1—Housing. About 56% of people do not present social exclusion in this dimension. Moderate exclusion affects 20% and severe exclusion affects 10%. Together they represent 30% of the total. Fourteen percent find themselves with slight exclusion. Those affected by some level of social exclusion make up 44% of the total.
- D6—Isolation. Although 32% of people do not present exclusion in this dimension, one in four presents moderate exclusion (25%), and severe exclusion affects 13%. Together they make up 38% of the total. Slight exclusion is around 30%. Thus, people affected by some level of exclusion represent 68% of the total.
- 3.
- The dimensions with the least level of exclusion, or those in which the majority of the population does not present exclusion (with percentages over 65% of the total are (from lower to higher levels)):
- D8—Social acceptance. Severe and moderate exclusion affected 28% of the population. There were no situations of slight exclusion.
- D7—Family and social conflict: Severe and moderate exclusion affected 29% of the population, and slight exclusion affected 2%.
- D5—Health. Severe exclusion and moderate exclusion affected 35% of the population. There were no observed situations of slight exclusion.
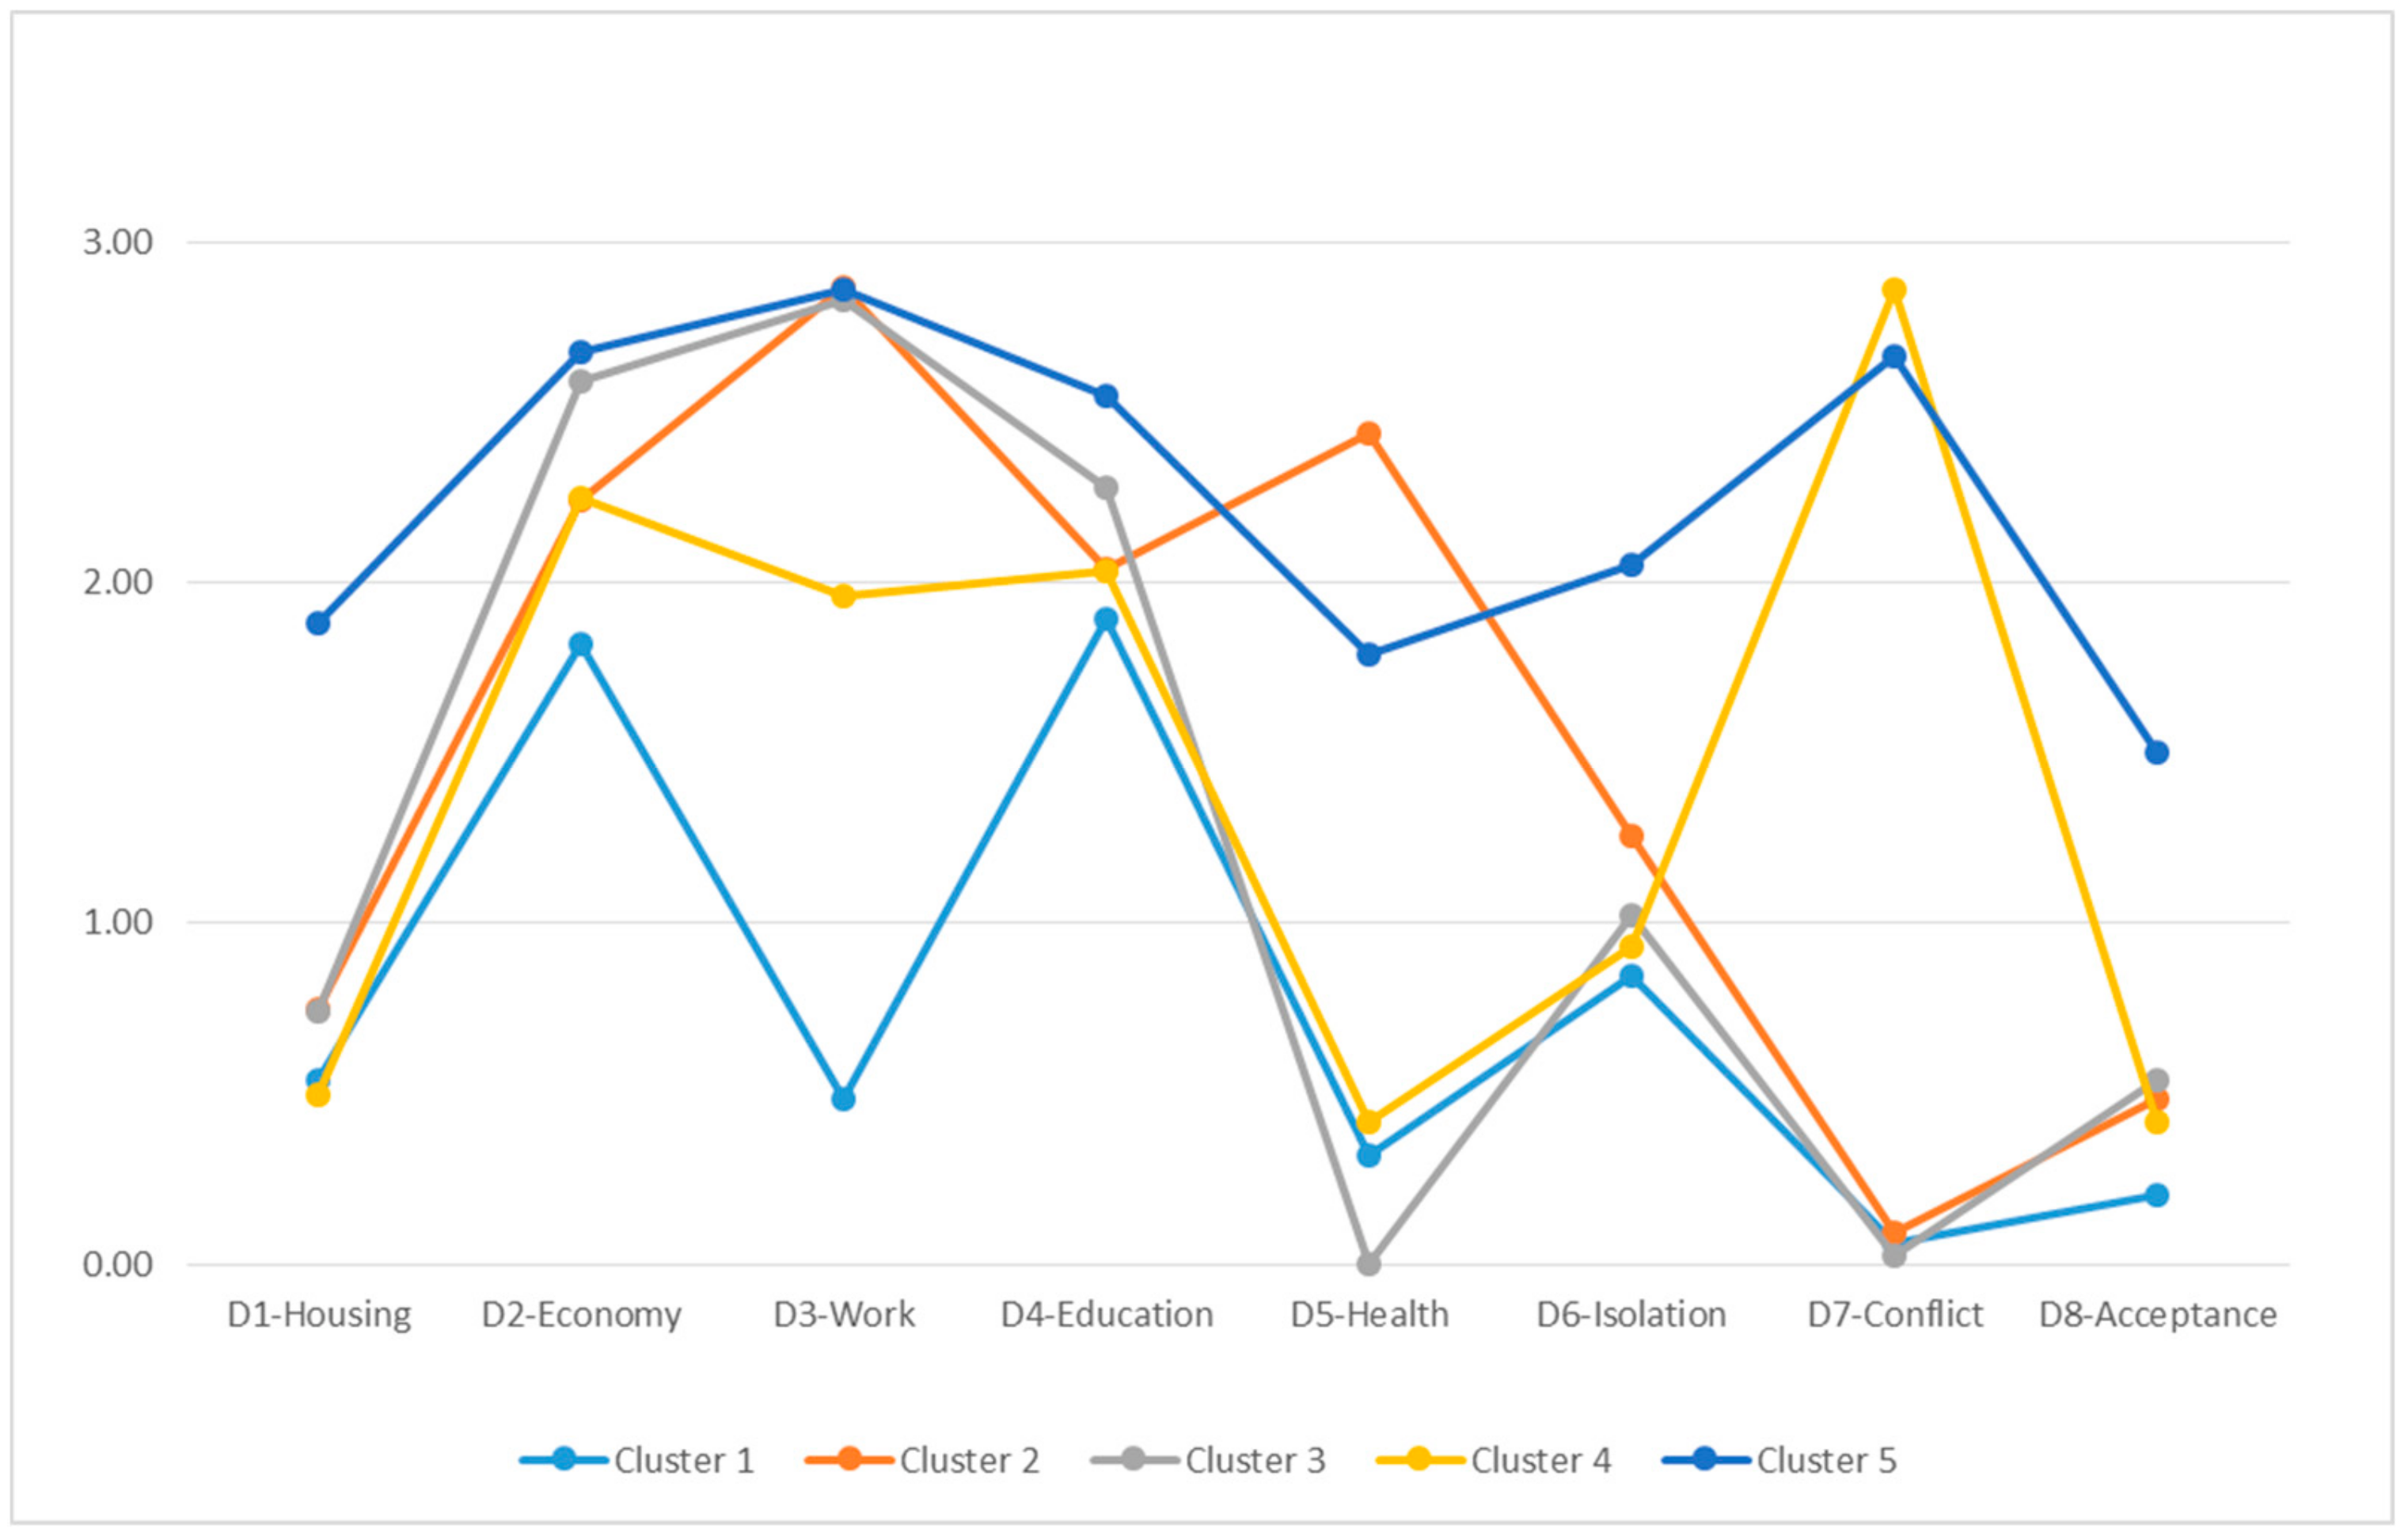
3.3. Classification of the Population: Trajectories
- No cluster coincides in terms of the intensity and exclusion in a single dimension.
- Dimensions D2—Economy and D4—Education present similar behavior in all of the clusters and range between a moderate and severe intensity.
- In the majority of the clusters, there is an absence of exclusion or a slight exclusion for the dimensions D1—Housing, D6—Isolation and D8—Social acceptance.
- The principal differences among the groups are situated in dimensions D3—Work (in which severe exclusion is predominant), D5—Health (with observed absence of exclusion or moderate exclusion, by cluster), D7—Conflict (in which there is severe exclusion or absence of exclusion, by group).
- Cluster 5 is that which shows greatest global intensity of social exclusion, followed by cluster 2 and cluster 3. The cluster that presents less intensity of exclusion is cluster 1.
- Cluster 1. Moderate exclusion in terms of economy-education/training, with slight intensity in social relationships (isolation).
- Cluster 2. Severe exclusion in terms of work with moderate intensity in economy-education/training-health and slight exclusion in terms of housing–social relationships (isolation).
- Cluster 3: Severe exclusion in economy-work with moderate intensity in training and slight intensity in housing and in the social relationships area (isolation/social acceptance).
- Cluster 4: Severe exclusion in the area of social relationships (family and social conflict) with moderate intensity in economy-work–education/training and with slight intensity in social relationships (isolation).
- Cluster 5: Severe exclusion in economy-work-training with severe intensity or moderate in terms of housing and in the social relationships area (isolation/family or social conflict/social acceptance).
4. Discussion
- Trajectory 1 “From integration to vulnerability”. This corresponds to cluster 1, characterized by moderate social exclusion in economy-education/training, with slight intensity in terms of social relationships (isolation). From the perspective of sociodemographics, the primary difference observed with respect to the rest of the clusters is that it is the group with the lowest percentage of people with Roma ethnicity (0.6%) and with the greatest percentage of people who finished their mandatory schooling (56%).
- Trajectory 2 “In permanent vulnerability”. This corresponds to cluster 4, with the following characteristics: severe exclusion in the area of social relationships (family and social conflict) with moderate intensity in terms of economy-work-education/training and with slight intensity in terms of social relationships (isolation). In comparison with the rest of the clusters, it is the second group with the lowest percentage of members of the Roma ethnicity (0.7%) and of people in an irregular legal situation or in the process of regularization (1%).
- Trajectory 3 “From integration to exclusion”. This corresponds to group 2, which is characterized by severe exclusion in terms of work with moderate intensity in economy-education/training-health and slight intensity in housing and in the social relationship area (isolation). In terms of sociodemographics, the most relevant characteristics compared to the other clusters are the following: it is the group of families with the lowest number of minors age 0 to 16 and the group that presents the greatest relative percentage of people with illness and disability (75%), with ability limitations (62%) and with the need for health care and health follow-up (81%).
- Trajectory 4 “From vulnerability to exclusion”. This corresponds to group 3, characterized by severe exclusion in economy-work with moderate intensity in education/training and slight intensity in housing and in the social relationship area (isolation/social acceptance). The primary sociodemographic difference with respect to all of the clusters is that it is the group with the greatest percentage of foreigners (50%).
- Trajectory 5 “In permanent exclusion”. This corresponds to cluster 5, characterized by severe exclusion in economy-work-education/training with severe intensity or moderate intensity in housing and in the area of social relationships (isolation, family or social conflict, social acceptance. It should be noted in terms of sociodemograhics that this group includes the greatest percentage of people with Roma ethnicity (8%), of people with an irregular legal status in the country (12%) and without completion of mandatory schooling (75%). Also, there is a relatively high percentage of people with illness and/or disability (57%) and with needs for health care and health follow-up (63%).
5. Conclusions
- In terms of professional practice, it supports the design of intervention protocols based on evidence that can help to lay out objectives, priority action area, the typology and intensity of actions, their duration and the needed resources, etc.
- In terms of uses for organizations and policy makers, this evidence allows for the design of public policies tailored to the needs of people and the places they reside, considering the priority area of public policy, the typologies and intensity and needed resources, etc.
- The scope of the interventions, when orienting on the areas that are the competence of the social services in which it is necessary to act (material support, autonomy, family and social relations, etc.), and on the areas in which is necessary to connect people with other social protection systems (housing, work, education-training, health, etc.) and establish coordination systems between their professionals and organizations.
- The intensity of the necessary interventions with each group, in terms of urgency, number and periodicity of actions, considering the intensity of the exclusion according to the vital area/dimension affected.
- The type of actions required with each group: information, advice-support, educational-training, material or institutional support, advocacy, supervision-monitoring, evaluation, organizational and professional networking, internal and external coordination, etc.
- The typology of resources needed, both human and benefits, programs and services, and its priority.
Author Contributions
Funding
Conflicts of Interest
References
- Van Bergen, A.P.L.; Hoff, S.J.M.; van Ameijden, E.J.C.; van Hemert, A.M. Measuring social exclusion in routine public health surveys: Construction of a multidimensional instrument. PLoS ONE 2014, 9, e98680. [Google Scholar] [CrossRef] [PubMed]
- SEKN. Understanding and Tackling Social Exclusion. Final Report to the WHO Commission on Social Determinants of Health from the Social Exclusion Knowledge Network; World Health Organization: Geneva, Switzerland, 2008; Available online: https://www.who.int/social_determinants/knowledge_networks/final_reports/sekn_final%20report_042008.pdf (accessed on 18 October 2019).
- Laparra, M.; Pérez, B. La Exclusión Social en España: Un Espacio Diverso Y Disperso en Intensa Transformación [Social Exclusion in Spain: A Diverse and Dispersed Space in Intense Transformation]. In VI Informe Sobre Exclusión y Desarrollo Social en España [VI Report on Exclusion and Social Development in Spain]; Fundación para el Fomento de Estudios Sociales y de Sociología Aplicada (FOESSA): Madrid, Spain, 2008; pp. 173–297. Available online: http://sirio.ua.es/cat/foessa_VI.pdf (accessed on 18 October 2019). (In Spanish)
- Observatorio de la Exclusión Social y los Procesos de Inclusión en la Comunidad de Madrid. De La Exclusión a La CiudadaníA. análisis DE Los Factores, Barreras Y Oportunidades [From Exclusion to Citizenship. Analysis of the Factors, Barriers and Opportunities]; Asociación Madrileña de Entidades y Empresas de Inserción (AMEI): Madrid, Spain, 2009; Available online: https://observatorioinclusion.files.wordpress.com/2013/07/informe-de-la-exclusion-a-la-ciudadania.pdf (accessed on 18 October 2019). (In Spanish)
- Subirats, J. Análisis DE Los Factores DE Exclusión Social [Analysis of Factors of Social Exclusion]; Fundación BBVA: Bilbao, Spain, 2005; Available online: http://www.fbbva.es/TLFU/dat/exclusion_social.pdf (accessed on 18 October 2019). (In Spanish)
- Renes, V. VI Informe Sobre Exclusión Y Desarrollo Social en España [VI Report on Exclusion and Social Development in Spain]; Fundación para el Fomento de Estudios Sociales y de Sociología Aplicada (FOESSA): Madrid, Spain, 2008; Available online: http://sirio.ua.es/cat/foessa_VI.pdf (accessed on 18 October 2019). (In Spanish)
- World Health Organization. Poverty, Social Exclusion and Health Systems in the Who European Region; WHO Regional Office for Europe: Copenhagen, Denmark, 2010; Available online: http://www.euro.who.int/en/publications/abstracts/poverty,-social-exclusion-and-health-systems-in-the-who-european-region (accessed on 18 October 2019).
- Fundación FOESSA. Exclusión Y Desarrollo Social en EspañA. análisis Y Perspectivas 2012 [Exclusion and Social Development in Spain. Analysis and Perspectives 2012]; Fundación para el Fomento de Estudios Sociales y de Sociología Aplicada (FOESSA): Madrid, Spain, 2012; Available online: http://www.caritasvitoria.org/datos/documentos/EXCLUSION%20Y%20DESARROLLO%20SOCIAL.pdf (accessed on 18 October 2019). (In Spanish)
- Atkinson, R.; Davoudi, S. The Concept of Social Exclusion in the European Union: Context, Development and Possibilities. J. Common Mark. Stud. 2000, 38, 427–448. [Google Scholar] [CrossRef]
- Backman, O.; Nilsson, A. Pathways to social exclusion—A life-course study. Eur. Sociol. Rev. 2011, 27, 107–123. [Google Scholar] [CrossRef]
- Dewilde, C. A life-course perspective on social exclusion and poverty. Brit. J. Sociol. 2003, 54, 109–128. [Google Scholar] [CrossRef] [PubMed]
- Dewilde, C. Lifecourse determinants and incomes in retirement: Belgium and the UK compared. Ageing Soc. 2012, 32, 587–615. [Google Scholar] [CrossRef]
- Ezquerra, S. Famílies, Exclusió Social I Disrupcions en Els Cicles DE Vida. Una Mirada a Les Polítiques Socials Des DE Baix [Families, Social Exclusion and Disruptions in Life Cycles. a Look at Social Policies from Below]; Diputació de Barcelona: Barcelona, Spain, 2011; Available online: https://www.diba.cat/c/document_library/get_file?uuid=17cb66c9-13d9-4e94-b2c7-42d89df1518b&groupId=14465 (accessed on 18 October 2019). (In Spanish)
- Giménez-Bertomeu, V.M.; Domenech López, Y.; Mateo Pérez, M.A. Exclusión social y trabajo social: Diseño de un instrumento de medición para su uso en los servicios sociales de atención primaria en España [Social exclusion and social work: Design of a measuring tool for use in social services of primary care in Spain]. In Políticas E Intervenciones Ante Los Procesos DE Vulnerabilidad Y Exclusión DE Personas Y Territorios. análisis Comparado México-España [Policies and Interventions in the Processes of Vulnerability and Exclusion of People and Territories. Comparative Analysis Mexico-Spain]; Pastor Seller, E., Cano Soriano, L., Eds.; Dykinson: Madrid, Spain, 2016; pp. 189–207. (In Spanish) [Google Scholar]
- Sen, A. Social Exclusion: Concept, Application and Scrutiny; Asian Development Bank: Manila, Philippines, 2000; Available online: https://www.adb.org/publications/social-exclusion-concept-application-and-scrutiny (accessed on 18 October 2019).
- Poggi, A. Social Exclusion in Spain: Measurement Theory and Application. Ph.D. Thesis, Universitat Autònoma de Barcelona, Barcelona, Spain, 3 December 2014. Available online: http://hdl.handle.net/10803/4002 (accessed on 18 October 2019).
- Hick, R. The capability approach: Insights for a new poverty focus. J. Soc. Policy 2012, 41, 291–308. [Google Scholar] [CrossRef]
- Gomez, L.E.; Arias, B.; Verdugo, M.A.; Navas, P. An outcomes-based assessment of quality of life in social services. Soc. Indic. Res. 2012, 106, 81–93. [Google Scholar] [CrossRef]
- van Hecke, N.; Claes, C.; Vanderplasschen, W.; De Maeyer, J.; De Witte, N.; Vandevelde, S. Conceptualisation and measurement of quality of life based on schalock and verdugo’s model: A cross-disciplinary review of the literature. Soc. Indic. Res. 2018, 137, 335–351. [Google Scholar] [CrossRef]
- Hernández, M. El estudio de la pobreza y la exclusión social. Aproximación cuantitativa y cualitativa [The study of poverty and social exclusion. Quantitative and qualitative approach]. Rev. Interuniv. Form. Prof. 2010, 69, 25–46. Available online: https://www.aufop.com/aufop/uploaded_files/revistas/131558145510.pdf (accessed on 18 October 2019). (In Spanish).
- Subirats, J.; Gomà, R. Un Paso Más Hacia La Inclusión Social. Generación DE Conocimiento, Políticas Y Prácticas Para La Inclusión Social [One More Step Towards Social Inclusion. Generation of Knowledge, Policies and Practices for Social Inclusion]; Plataforma de ONGs de Acción Social: Madrid, Spain, 2003; Available online: https://www.plataformaong.org/ARCHIVO/documentos/biblioteca/1366207686_072.pdf (accessed on 18 October 2019). (In Spanish)
- Sánchez Alías, A.; Jiménez Sánchez, M. Exclusión social: Fundamentos teóricos y de la intervención [Social exclusion: Theoretical and intervention foundations]. Trab. Soc. Glob. 2013, 3, 133–156. Available online: http://revistaseug.ugr.es/index.php/tsg/article/view/952/1070 (accessed on 18 October 2019). (In Spanish).
- Pawson, R.; Boaz, A.; Grayson, L.; Long, A.; Barnes, C. SCIE Knowledge Review 03: Types and Quality of Knowledge in Social Care; Social Care Institute for Excellence: London, UK, 2003. [Google Scholar]
- Aguilar, M.; Llobet, M.; Pérez Eransus, B. Los servicios sociales frente a la exclusión. Zerbitzuan 2012, 51, 9–26. (In Spanish) [Google Scholar] [CrossRef]
- Marcuello, C.; Gómez-Quintero, J.D. Nuevas formas de exclusión por impacto de la crisis [New forms of exclusion due to the impact of the crisis]. In Guía DE Recomendaciones Y Líneas DE Actuación en Inclusión Social [Guide of Recommendations and Lines of Action on Social Inclusion]; Fundación Luis Vives: Madrid, Spain, 2011; pp. 3–25. Available online: http://www.compostelaintegra.org/media.local.com/multimedia/imxd/albumes/docs/1310975543Guia_Inclusion.pdf (accessed on 18 October 2019). (In Spanish)
- Raya, E. Exclusión social: Indicadores para su estudio y aplicación para el trabajo social [Social exclusion: Indicators for study and application for social work]. Rev. Minist. Trab. Asuntos. Soc. 2007, 70, 155–172. Available online: http://www.mitramiss.gob.es/es/publica/pub_electronicas/destacadas/revista/numeros/70/Inf01.pdf (accessed on 18 October 2019). (In Spanish).
- Raya, E. Aplicaciones de una herramienta para el diagnóstico y la investigación en exclusión social [Applications of a tool for diagnosis and research on social exclusion]. Doc. Trab. Soc. 2010, 48, 136–177. Available online: https://dialnet.unirioja.es/descarga/articulo/3655851.pdf (accessed on 18 October 2019). (In Spanish).
- Federación Sartu. Estrategias Profesionales Para La Inclusión Social [Professional Strategies for Social Inclusion]. 2011. Available online: http://www.ipbscordoba.es/uploads/Documentos/EstrategiasProfesionalesInclusionSocial.pdf (accessed on 18 October 2019). (In Spanish).
- Decreto por el que se aprueba el Instrumento de Valoración de la Exclusión Social (Decreto 385/2013, 16 de julio). Boletín Oficial Del PAís Vasco, Nº 149, 2013, 7 de agosto. Available online: http://www.euskadi.eus/eli/es-pv/d/2013/07/16/385/dof/spa/html/web01-a2libzer/es/ (accessed on 18 November 2019). (In Spanish).
- Lorenzo, F. VII Informe Sobre Exclusión Y Desarrollo Social en España [VII Report on Exclusion and Social Development in Spain]; Fundación para el Fomento de Estudios Sociales y de Sociología Aplicada (FOESSA): Madrid, Spain, 2014; Available online: http://www.foessa2014.es/informe/ (accessed on 18 October 2019). (In Spanish)
- FEANTSA. European Typology of Homelessness and Housing Exclusion. Available online: https://www.feantsa.org/en/toolkit/2005/04/01/ethos-typology-on-homelessness-and-housing-exclusion?bcParent=27 (accessed on 18 October 2019).
- Fortune, A.E.; Reid, W.J. Research in Social Work, 3rd ed.; Columbia University Press: New York, NY, USA, 1999. [Google Scholar]
- Grinnell, R.M. Social Work Research and Evaluation: Quantitative and Qualitative Approaches; Grinnell, R.M., Unrau, Y.A., Eds.; Oxford University Press: New York, NY, USA, 2005. [Google Scholar]
- Rubin, A.; Babbie, E.R. Research Methods for Social Work; Wadsworth: Belmont, CA, USA, 1989. [Google Scholar]
- Thyer, B. The Handbook of Social Work Research Methods, 2nd ed.; Sage: Thousand Oaks, CA, USA, 2010. [Google Scholar]
- Pérez, M.; Rodríguez, G.; Trujillo, M. Pobreza Y Exclusión Social en El Principado DE Asturias [Poverty and Social Exclusion in the Principality of Asturias]; CSIC-IESA: Córdoba, Spain, 2004; Available online: http://www.asturias.es/Asturias/descargas/PDF_TEMAS/Asuntos%20Sociales/Calidad/publicaciones/pobreza_y_exclusion_en_el_principado_de_asturias.pdf (accessed on 18 October 2019). (In Spanish)


| Level of Exclusion (Intensity) | ||||||||||
|---|---|---|---|---|---|---|---|---|---|---|
| Dimensions (Scope) | Without Exclusion | Slight Exclusion | Moderate Exclusion | Severe Exclusion | Total | |||||
| n | % | N | % | n | % | n | % | n | % | |
| D1—Housing | 569 | 56.4 | 136 | 13.5 | 201 | 19.9 | 103 | 10.2 | 1009 | 100.0 |
| D2—Economy | 35 | 3.5 | 155 | 15.4 | 239 | 23.7 | 580 | 57.5 | 1009 | 100.0 |
| D3—Work | 130 | 12.9 | 104 | 10.3 | 104 | 10.3 | 671 | 66.5 | 1009 | 100.0 |
| D4—Education | 40 | 4.0 | 195 | 19.3 | 329 | 32.6 | 445 | 44.1 | 1009 | 100.0 |
| D5—Health | 658 | 65.2 | 0 | 0.0 | 190 | 18.8 | 161 | 16.0 | 1009 | 100.0 |
| D6—Isolation | 327 | 32.4 | 305 | 30.2 | 250 | 24.8 | 127 | 12.6 | 1009 | 100.0 |
| D7—Conflict | 697 | 69.1 | 19 | 1.9 | 64 | 6.3 | 229 | 22.7 | 1009 | 100.0 |
| D8—Acceptance | 730 | 72.3 | 0 | 0.0 | 239 | 23.7 | 40 | 4.0 | 1009 | 100.0 |
| Dimensions | Cluster | Error | F | Sig. | ||
|---|---|---|---|---|---|---|
| Quadratic Mean | df | Quadratic Mean | df | |||
| D1—Housing | 49.340 | 4 | 0.955 | 1004 | 51.675 | 0.000 |
| D2—Economy | 22.430 | 4 | 0.658 | 1004 | 34.101 | 0.000 |
| D3—Work | 202.295 | 4 | 0.391 | 1004 | 517.576 | 0.000 |
| D4—Education | 11.113 | 4 | 0.724 | 1004 | 15.350 | 0.000 |
| D5—Health | 238.165 | 4 | 0.516 | 1004 | 461.429 | 0.000 |
| D6—Isolation | 37.867 | 4 | 0.899 | 1004 | 42.126 | 0.000 |
| D7—Conflict | 378.470 | 4 | 0.132 | 1004 | 2861.990 | 0.000 |
| D8—Acceptance | 39.148 | 4 | 0.802 | 1004 | 48.826 | 0.000 |
| Cluster Number | N | % |
|---|---|---|
| 1 | 178 | 17.6 |
| 2 | 198 | 19.6 |
| 3 | 344 | 34.1 |
| 4 | 141 | 14.0 |
| 5 | 148 | 14.7 |
| Total | 1009 | 100.0 |
| Dimensions | Cluster | ||||
|---|---|---|---|---|---|
| 1 | 2 | 3 | 4 | 5 | |
| D1—Housing | S | S | S | ∅ | M |
| D2—Economy | M | M | SE | M | SE |
| D3—Work | ∅ | SE | SE | M | SE |
| D4—Education | M | M | M | M | SE |
| D5—Health | ∅ | M | ∅ | ∅ | M |
| D6—Isolation | S | S | S | S | M |
| D7—Conflict | ∅ | ∅ | ∅ | SE | SE |
| D8—Acceptance | ∅ | ∅ | S | ∅ | M |
| Sociodemographic Variables | Cluster 1 | Cluster 2 | Cluster 3 | Cluster 4 | Cluster 5 | Total |
|---|---|---|---|---|---|---|
| Gender | ||||||
| Woman | 63.5 | 62.1 | 65.4 | 73.0 | 64.2 | 65.3 |
| Man | 36.5 | 37.9 | 34.6 | 27.0 | 35.8 | 34.7 |
| Total | 100.0 | 100.0 | 100.0 | 100.0 | 100.0 | 100.0 |
| Age | ||||||
| Mean (SD) | 40.8 (9.4) | 47.1 (11.1) | 40.7 (11.0) | 39.8 (10.3) | 40.0 (9.0) | 41.7 (10.8) |
| Number of members in family unit | ||||||
| Mean (SD) | 3.3 (1.5) | 2.7 (1.4) | 3.4 (1.7) | 3.3 (1.5) | 2.7 (1.316) | 3.1 (1.6) |
| Number of minors age 0–16 in the family unit | ||||||
| Mean (SD) | 1.3 (1.2) | 0.70 (1.1) | 1.4 (1.2) | 1.5 (1.1) | 1.1 (1.4) | 1.9 (1.0) |
| Nationality | ||||||
| Spanish | 63.5 | 73.7 | 49.7 | 65.2 | 62.8 | 61.0 |
| Foreign | 36.5 | 26.3 | 50.3 | 34.8 | 37.2 | 39.0 |
| Total | 100.0 | 100.0 | 100.0 | 100.0 | 100.0 | 100.0 |
| Roma ethnicity | ||||||
| Yes | 0.6 | 1.5 | 1.8 | 0.7 | 8.1 | 2.3 |
| No | 99.4 | 98.5 | 98.2 | 99.3 | 91.9 | 97.7 |
| Total | 100.0 | 100.0 | 100.0 | 100.0 | 100.0 | 100.0 |
| Legal status situation in the country | ||||||
| Irregular or in the process of regularization | 2.8 | 3.0 | 3.8 | 1.4 | 12.2 | 4.4 |
| Regular | 97.2 | 97.0 | 96.2 | 98.6 | 87.8 | 95.6 |
| Total | 100.0 | 100.0 | 100.0 | 100.0 | 100.0 | 100.0 |
| Education level | ||||||
| Has not completed mandatory schooling | 43.7 | 57.5 | 59.6 | 59.0 | 75.0 | 58.7 |
| Completed mandatory schooling | 56.3 | 42.5 | 40.4 | 41.0 | 25.0 | 41.3 |
| Total | 100.0 | 100.0 | 100.0 | 100.0 | 100.0 | 100.0 |
| Illness/disability | ||||||
| Without illness/disability | 82.1 | 24.7 | 87.1 | 77.1 | 43.2 | 66.2 |
| With illness /disability | 17.9 | 75.3 | 12.9 | 22.9 | 56.8 | 33.8 |
| Total | 100.0 | 100.0 | 100.0 | 100.0 | 100.0 | 100.0 |
| Ability limitations | ||||||
| Does not present | 86.8 | 38.0 | 91.9 | 84.4 | 61.4 | 75.2 |
| Presents (diagnosed or not) | 13.2 | 62.0 | 8.1 | 15.6 | 38.6 | 24.8 |
| Total | 100.0 | 100.0 | 100.0 | 100.0 | 100.0 | 100.0 |
| Attention and/or health follow-up | ||||||
| Does not need | 78.4 | 19.0 | 79.8 | 75.0 | 37.4 | 60.8 |
| Needs (punctual or continuous) | 21.6 | 81.0 | 20.2 | 25.0 | 62.6 | 39.2 |
| Total | 100.0 | 100.0 | 100.0 | 100.0 | 100.0 | 100.0 |
© 2019 by the authors. Licensee MDPI, Basel, Switzerland. This article is an open access article distributed under the terms and conditions of the Creative Commons Attribution (CC BY) license (http://creativecommons.org/licenses/by/4.0/).
Share and Cite
Giménez-Bertomeu, V.M.; Domenech-López, Y.; Mateo-Pérez, M.A.; de-Alfonseti-Hartmann, N. Empirical Evidence for Professional Practice and Public Policies: An Exploratory Study on Social Exclusion in Users of Primary Care Social Services in Spain. Int. J. Environ. Res. Public Health 2019, 16, 4600. https://doi.org/10.3390/ijerph16234600
Giménez-Bertomeu VM, Domenech-López Y, Mateo-Pérez MA, de-Alfonseti-Hartmann N. Empirical Evidence for Professional Practice and Public Policies: An Exploratory Study on Social Exclusion in Users of Primary Care Social Services in Spain. International Journal of Environmental Research and Public Health. 2019; 16(23):4600. https://doi.org/10.3390/ijerph16234600
Chicago/Turabian StyleGiménez-Bertomeu, Víctor M., Yolanda Domenech-López, Miguel A. Mateo-Pérez, and Nicolás de-Alfonseti-Hartmann. 2019. "Empirical Evidence for Professional Practice and Public Policies: An Exploratory Study on Social Exclusion in Users of Primary Care Social Services in Spain" International Journal of Environmental Research and Public Health 16, no. 23: 4600. https://doi.org/10.3390/ijerph16234600
APA StyleGiménez-Bertomeu, V. M., Domenech-López, Y., Mateo-Pérez, M. A., & de-Alfonseti-Hartmann, N. (2019). Empirical Evidence for Professional Practice and Public Policies: An Exploratory Study on Social Exclusion in Users of Primary Care Social Services in Spain. International Journal of Environmental Research and Public Health, 16(23), 4600. https://doi.org/10.3390/ijerph16234600