
Does Exposure to Ambient Air Pollution Affect Gestational Age and Newborn Weight?—A Systematic Review

 ,
,  , , ,
, , ,  ,
,
Abstract
1. Introduction
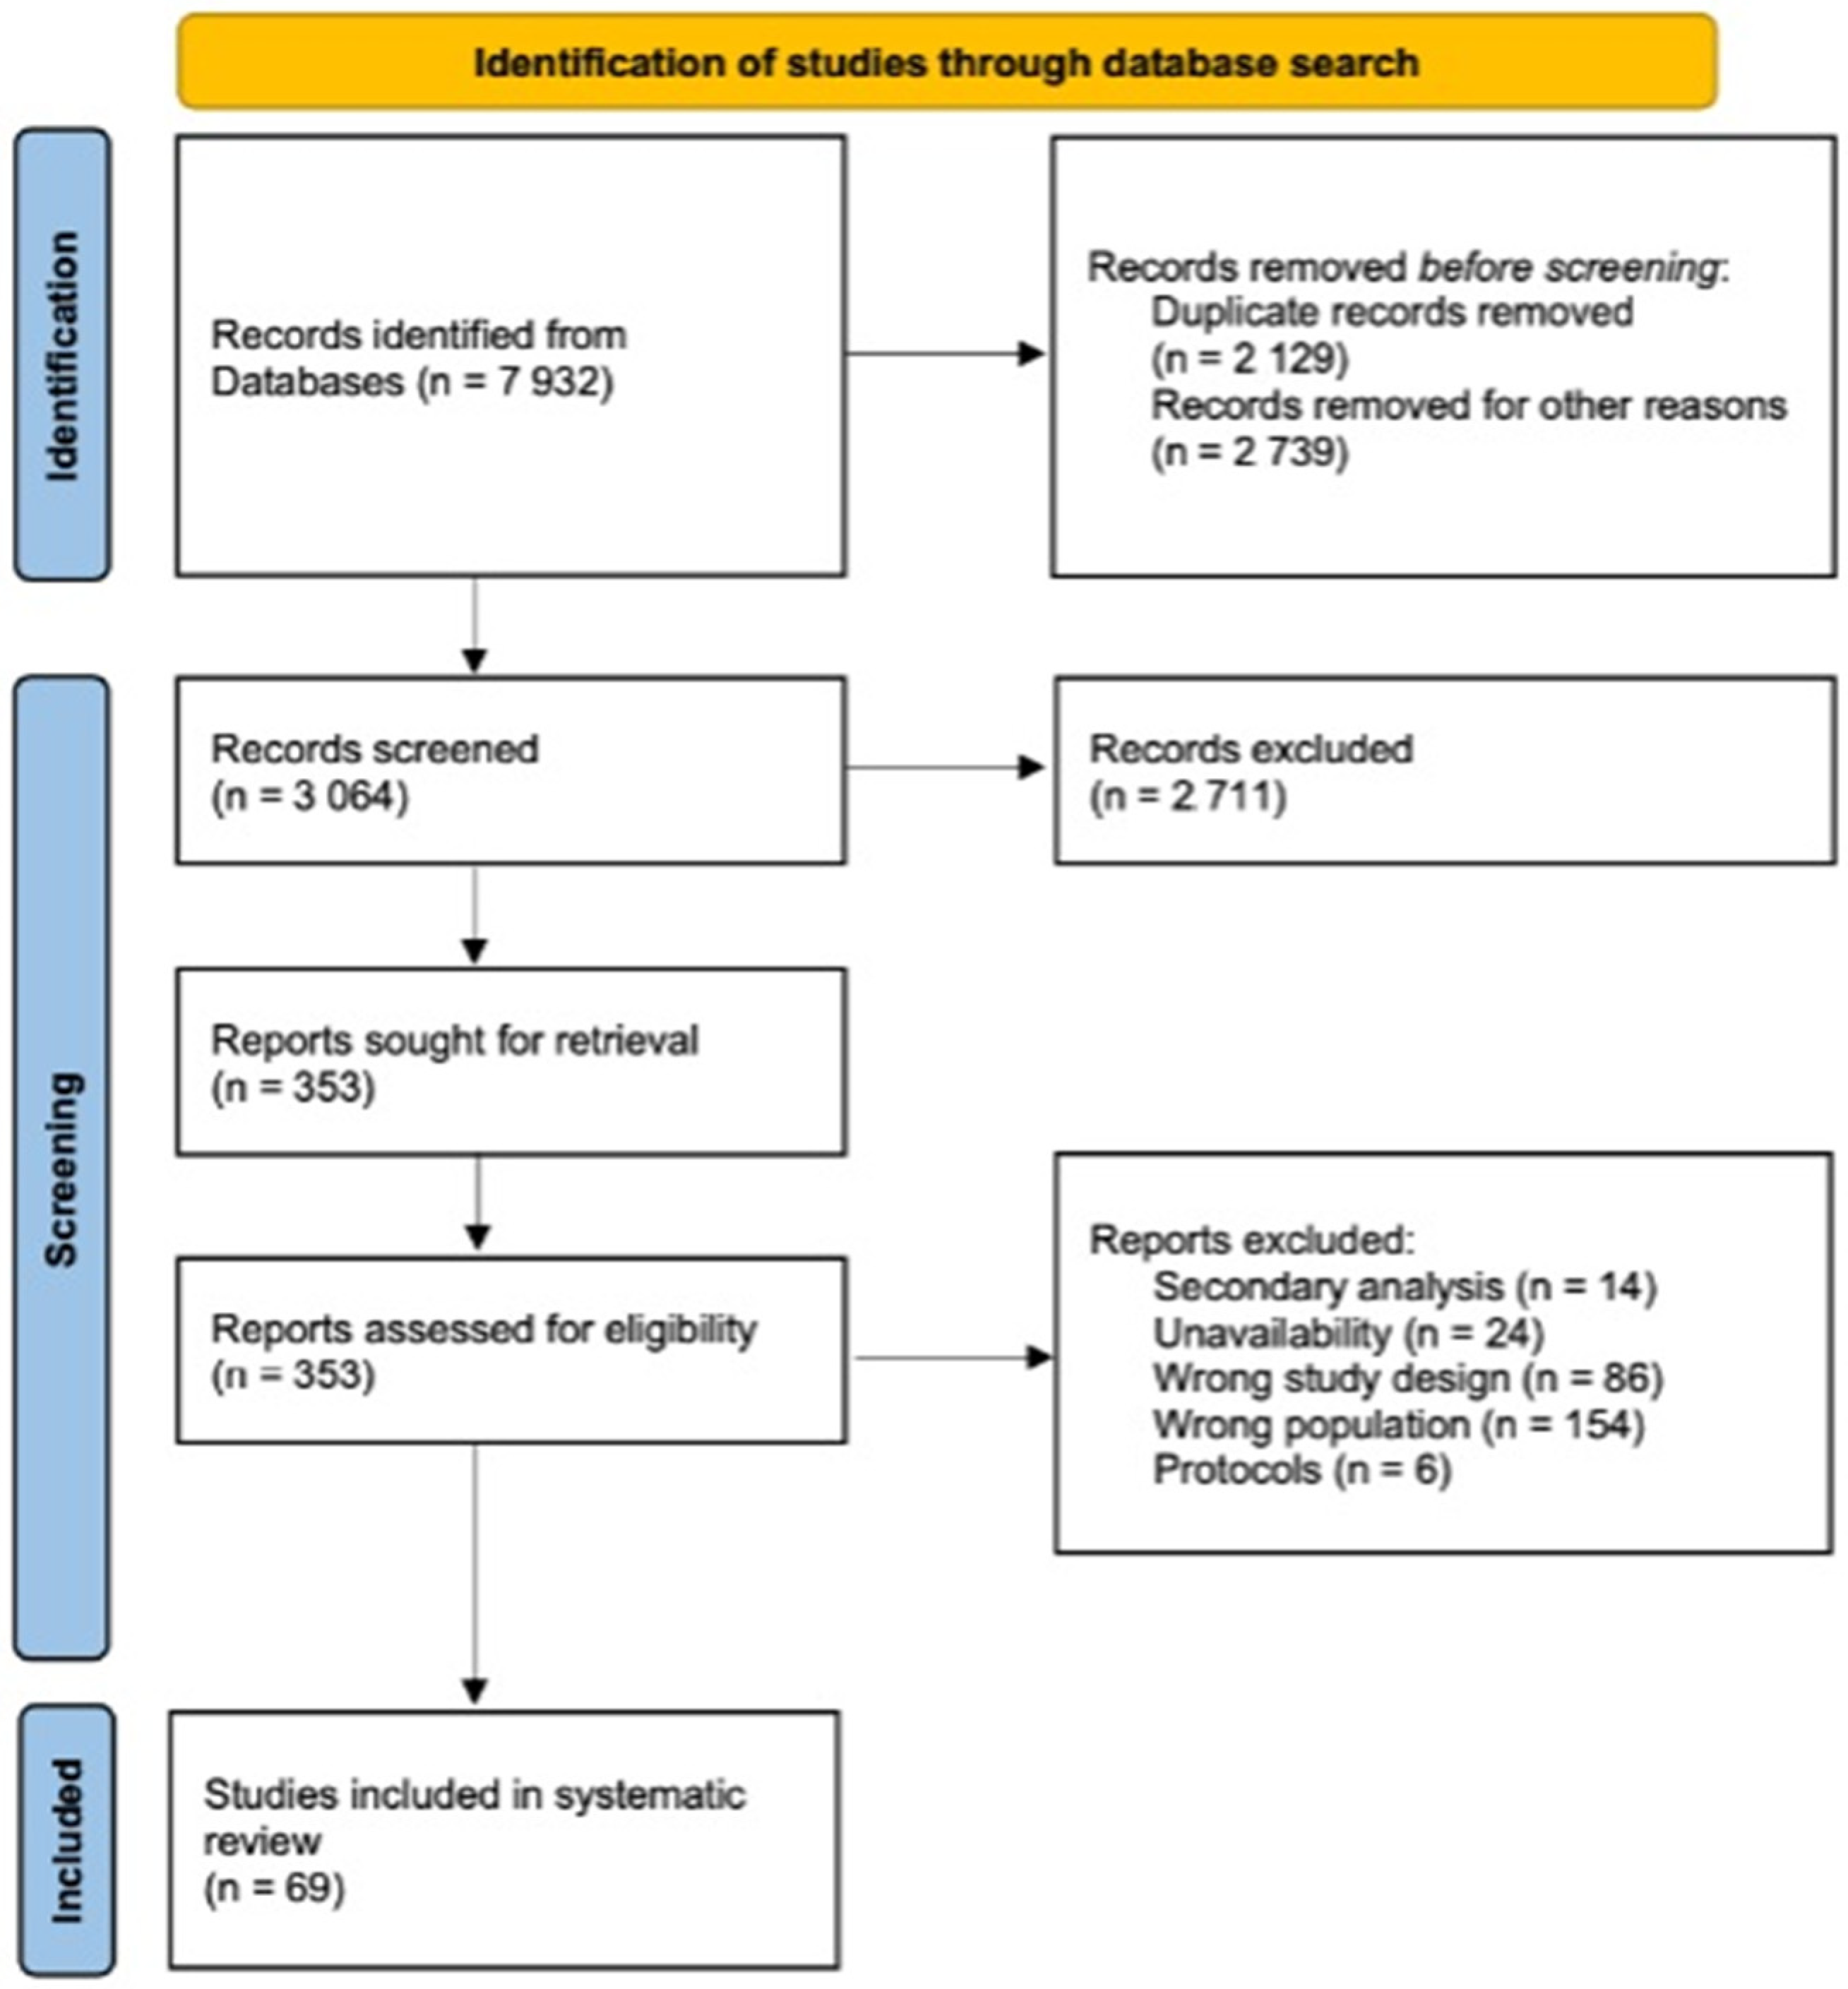
2. Materials and Methods
3. Results
4. Discussion
4.1. PM2.5 and PM10 Exposure
4.2. O3 Exposure
4.3. Exposure to Traffic-Related Air Pollutants (TRAPs)
4.4. NOx Exposure
4.5. SO2 Exposure
4.6. CO Exposure
4.7. VOC Exposure
4.8. Exposure at a Particular Time of Pregnancy
4.9. Clinical Implementation and Further Research Directions
4.10. Strength and Limitations
5. Conclusions
Supplementary Materials
Author Contributions
Funding
Institutional Review Board Statement
Informed Consent Statement
Data Availability Statement
Conflicts of Interest
References
- Kajdy, A.; Feduniw, S.; Modzelewski, J.; Sys, D.; Filipecka-Tyczka, D.; Muzyka-Placzyńska, K.; Kiczmer, P.; Grabowski, B.; Rabijewski, M. Growth Abnormalities as a Risk Factor of Adverse Neonatal Outcome in Hypertensive Pregnancies—A Single-Center Retrospective Cohort Study. Children 2021, 8, 522. [Google Scholar] [CrossRef] [PubMed]
- Beune, I.M.; Bloomfield, F.H.; Ganzevoort, W.; Embleton, N.D.; Rozance, P.J.; van Wassenaer-Leemhuis, A.G.; Wynia, K.; Gordijn, S.J. Consensus Based Definition of Growth Restriction in the Newborn. J. Pediatr. 2018, 196, 71–76.e1. [Google Scholar] [CrossRef] [PubMed]
- Kajdy, A.; Sys, D.; Modzelewski, J.; Bogusławska, J.; Cymbaluk-Płoska, A.; Kwiatkowska, E.; Bednarek-Jędrzejek, M.; Borowski, D.; Stefańska, K.; Rabijewski, M.; et al. Evidence of Placental Aging in Late SGA, Fetal Growth Restriction and Stillbirth—A Systematic Review. Biomedicines 2023, 11, 1785. [Google Scholar] [CrossRef] [PubMed]
- Figueras, F.; Gratacós, E. Update on the Diagnosis and Classification of Fetal Growth Restriction and Proposal of a Stage-Based Management Protocol. Fetal Diagn. Ther. 2014, 36, 86–98. [Google Scholar] [CrossRef] [PubMed]
- Kajdy, A.; Modzelewski, J.; Jakubiak, M.; Pokropek, A.; Rabijewski, M. Effect of Antenatal Detection of Small-for-Gestational-Age Newborns in a Risk Stratified Retrospective Cohort. PLoS ONE 2019, 14, e0224553. [Google Scholar] [CrossRef] [PubMed]
- American College of Obstetricians and Gynecologists. Practice Bulletin No. 134. Obstet. Gynecol. 2013, 121, 1122–1133. [Google Scholar] [CrossRef]
- Lausman, A.; Kingdom, J.; Gagnon, R.; Basso, M.; Bos, H.; Crane, J.; Davies, G.; Delisle, M.F.; Hudon, L.; Menticoglou, S.; et al. Intrauterine Growth Restriction: Screening, Diagnosis, And Management. J. Obstet. Gynaecol. Can. 2013, 35, 741–748. [Google Scholar] [CrossRef]
- Kajdy, A.; Modzelewski, J.; Cymbaluk-Płoska, A.; Kwiatkowska, E.; Bednarek-Jędrzejek, M.; Borowski, D.; Stefańska, K.; Rabijewski, M.; Torbé, A.; Kwiatkowski, S. Molecular Pathways of Cellular Senescence and Placental Aging in Late Fetal Growth Restriction and Stillbirth. Int. J. Mol. Sci. 2021, 22, 4186. [Google Scholar] [CrossRef]
- Zhang, Q.; Zhang, Z.C.; He, X.Y.; Liu, Z.M.; Wei, G.H.; Liu, X. Maternal Smoking during Pregnancy and the Risk of Congenital Urogenital Malformations: A Systematic Review and Meta-Analysis. Front. Pediatr. 2022, 10, 973016. [Google Scholar] [CrossRef]
- Akter, S.; Islam, M.R.; Rahman, M.M.; Rouyard, T.; Nsashiyi, R.S.; Hossain, F.; Nakamura, R. Evaluation of Population-Level Tobacco Control Interventions and Health Outcomes: A Systematic Review and Meta-Analysis. JAMA Netw. Open 2023, 6, e2322341. [Google Scholar] [CrossRef]
- Athanasiadou, K.I.; Paschou, S.A.; Papakonstantinou, E.; Vasileiou, V.; Kanouta, F.; Kazakou, P.; Stefanaki, K.; Kassi, G.N.; Psaltopoulou, T.; Goulis, D.G.; et al. Smoking during Pregnancy and Gestational Diabetes Mellitus: A Systematic Review and Meta-Analysis. Endocrine 2023, 82, 250–262. [Google Scholar] [CrossRef] [PubMed]
- Health Effects Institute. Institute for Health Metrics and Evaluation’s Global Burden of Desease Project State of Global Air 2020. Available online: https://www.stateofglobalair.org/resources (accessed on 14 June 2023).
- WHO. WHO Global Air Quality Guidelines: Particulate Matter (PM2.5 and PM10), Ozone, Nitrogen Dioxide, Sulfur Dioxide and Carbon Monoxide; WHO: Geneva, Switzerland, 2021; ISBN 9789812837134. [Google Scholar]
- Rehman, A.; Liu, G.; Yousaf, B.; Ijaz, S.; Irshad, S.; Cheema, A.I.; Riaz, M.U.; Ashraf, A. Spectroscopic Fingerprinting, Pollution Characterization, and Health Risk Assessment of Potentially Toxic Metals from Urban Particulate Matter. Environ. Sci. Pollut. Res. Int. 2023, 30, 92842–92858. [Google Scholar] [CrossRef] [PubMed]
- Nyadanu, S.D.; Dunne, J.; Tessema, G.A.; Mullins, B.; Kumi-Boateng, B.; Lee Bell, M.; Duko, B.; Pereira, G. Prenatal Exposure to Ambient Air Pollution and Adverse Birth Outcomes: An Umbrella Review of 36 Systematic Reviews and Meta-Analyses. Environ. Pollut. 2022, 306, 119465. [Google Scholar] [CrossRef] [PubMed]
- Song, S.; Gao, Z.; Zhang, X.; Zhao, X.; Chang, H.; Zhang, J.; Yu, Z.; Huang, C.; Zhang, H. Ambient Fine Particulate Matter and Pregnancy Outcomes: An Umbrella Review. Environ. Res. 2023, 235, 116652. [Google Scholar] [CrossRef] [PubMed]
- Shah, P.S.; Balkhair, T.; Knowledge Synthesis Group on Determinants of Preterm/LBW Births. Air Pollution and Birth Outcomes: A Systematic Review. Environ. Int. 2011, 37, 498–516. [Google Scholar] [CrossRef] [PubMed]
- Simoncic, V.; Enaux, C.; Deguen, S.; Kihal-Talantikite, W. Adverse Birth Outcomes Related to NO2 and PM Exposure: European Systematic Review and Meta-Analysis. Int. J. Environ. Res. Public Health 2020, 17, 8116. [Google Scholar] [CrossRef]
- Luo, M.; Liu, T.; Ma, C.; Fang, J.; Zhao, Z.; Wen, Y.; Xia, Y.; Zhao, Y.; Ji, C. Household Polluting Cooking Fuels and Adverse Birth Outcomes: An Updated Systematic Review and Meta-Analysis. Front. Public Health 2023, 11, 978556. [Google Scholar] [CrossRef] [PubMed]
- Page, M.J.; McKenzie, J.E.; Bossuyt, P.M.; Boutron, I.; Hoffmann, T.C.; Mulrow, C.D.; Shamseer, L.; Tetzlaff, J.M.; Akl, E.A.; Brennan, S.E.; et al. The PRISMA 2020 Statement: An Updated Guideline for Reporting Systematic Reviews. BMJ 2021, 372, n71. [Google Scholar] [CrossRef] [PubMed]
- Wells, G.; Shea, B.; O’Connell, D.; Peterson, J.; Welch, V.; Losos, M.; Tugwell, P. The Newcastle-Ottawa Scale (NOS) for Assessing the Quality of Nonrandomised Studies in Meta-Analyses. Available online: https://www.ohri.ca/programs/clinical_epidemiology/oxford.asp (accessed on 28 May 2024).
- Canto, M.V.; Guxens, M.; García-Altés, A.; López, M.J.; Marí-Dell’Olmo, M.; García-Pérez, J.; Ramis, R. Air Pollution and Birth Outcomes: Health Impact and Economic Value Assessment in Spain. Int. J. Environ. Res. Public Health 2023, 20, 2290. [Google Scholar] [CrossRef]
- Chen, X.; Chen, S.; Zhu, Z.; Luo, J.; Wang, H.; Wulayin, M.; Huang, C.; Zhao, W.; Wang, Q. Identifying the Critical Windows and Joint Effects of Temperature and PM2.5 Exposure on Small for Gestational Age. Environ. Int. 2023, 173, 107832. [Google Scholar] [CrossRef]
- Mitku, A.A.; Zewotir, T.; North, D.; Jeena, P.; Asharam, K.; Muttoo, S.; Tularam, H.; Naidoo, R.N. Impact of Ambient Air Pollution Exposure during Pregnancy on Adverse Birth Outcomes: Generalized Structural Equation Modeling Approach. BMC Public Health 2023, 23, 45. [Google Scholar] [CrossRef] [PubMed]
- Zhang, F.; Zhang, X.X.; Zhong, Y.; Zhu, S.; Zhao, G.; Zhang, X.X.; Li, T.; Zhang, Y.; Zhu, W. Joint Exposure to Ambient Air Pollutants Might Elevate the Risk of Small for Gestational Age (SGA) Infants in Wuhan: Evidence From a Cross-Sectional Study. Int. J. Public Health 2023, 67, 1605391. [Google Scholar] [CrossRef] [PubMed]
- Zhou, W.; Ming, X.; Yang, Y.; Hu, Y.; He, Z.; Chen, H.; Li, Y.; Cheng, J.; Zhou, X. Associations between Maternal Exposure to Ambient Air Pollution and Very Low Birth Weight: A Birth Cohort Study in Chongqing, China. Front. Public Health 2023, 11, 1123594. [Google Scholar] [CrossRef] [PubMed]
- Ahmad, W.A.; Nirel, R.; Golan, R.; Jolles, M.; Kloog, I.; Rotem, R.; Negev, M.; Koren, G.; Levine, H. Mother-Level Random Effect in the Association between PM2.5 and Fetal Growth: A Population-Based Pregnancy Cohort. Environ. Res. 2022, 210, 112974. [Google Scholar] [CrossRef] [PubMed]
- Gan, Q.; Ye, W.; Zhao, X.; Teng, Y.; Mei, S.; Long, Y.; Ma, J.; Rehemutula, R.; Zhang, X.; Zeng, F.; et al. Mediating Effects of Gut Microbiota in the Associations of Air Pollutants Exposure with Adverse Pregnancy Outcomes. Ecotoxicol. Environ. Saf. 2022, 234, 113371. [Google Scholar] [CrossRef] [PubMed]
- Gong, X.; Zhan, F.B. A Method for Identifying Critical Time Windows of Maternal Air Pollution Exposures Associated with Low Birth Weight in Offspring Using Massive Geographic Data. Environ. Sci. Pollut. Res. 2022, 29, 33345–33360. [Google Scholar] [CrossRef] [PubMed]
- Huang, H.J.; Yu, Q.Y.; Zheng, T.; Wang, S.S.; Yang, X.J. Associations between Seasonal Ambient Air Pollution and Adverse Perinatal Outcomes: A Retrospective Cohort Study in Wenzhou, China. Environ. Sci. Pollut. Res. 2022, 29, 59903–59914. [Google Scholar] [CrossRef] [PubMed]
- Rodríguez-Fernández, A.; Ramos-Castillo, N.; Ruiz-De la Fuente, M.; Parra-Flores, J.; Maury-Sintjago, E. Association of Prematurity and Low Birth Weight with Gestational Exposure to PM2.5 and PM10 Particulate Matter in Chileans Newborns. Int. J. Environ. Res. Public Health 2022, 19, 6133. [Google Scholar] [CrossRef] [PubMed]
- Shen, Y.; Wang, C.; Yu, G.; Meng, X.; Wang, W.; Kan, H.; Zhang, J.; Cai, J. Associations of Ambient Fine Particulate Matter and Its Chemical Constituents with Birth Weight for Gestational Age in China: A Nationwide Survey. Environ. Sci. Technol. 2022, 56, 8406–8415. [Google Scholar] [CrossRef]
- Zhu, Z.; Hu, H.; Benmarhnia, T.; Ren, Z.; Luo, J.; Zhao, W.; Chen, S.; Wu, K.; Zhang, X.; Wang, L.; et al. Gestational PM2.5 Exposure May Increase the Risk of Small for Gestational Age through Maternal Blood Pressure and Hemoglobin: A Mediation Analysis Based on a Prospective Cohort in China, 2014–2018. Ecotoxicol. Environ. Saf. 2022, 242, 113836. [Google Scholar] [CrossRef]
- Chen, J.; Li, P.H.; Fan, H.; Li, C.; Zhang, Y.; Ju, D.; Deng, F.; Guo, X.; Guo, L.; Wu, S. Weekly-Specific Ambient Fine Particular Matter Exposures before and during Pregnancy Were Associated with Risks of Small for Gestational Age and Large for Gestational Age: Results from Project ELEFANT. Int. J. Epidemiol. 2022, 51, 202–212. [Google Scholar] [CrossRef] [PubMed]
- Chen, Y.; Hodgson, S.; Gulliver, J.; Granell, R.; Henderson, A.J.; Cai, Y.; Hansell, A.L. Trimester Effects of Source-Specific PM10 on Birth Weight Outcomes in the Avon Longitudinal Study of Parents and Children (ALSPAC). Environ. Health Glob. Access Sci. Source 2021, 20, 4. [Google Scholar] [CrossRef] [PubMed]
- Shang, L.; Huang, L.; Yang, L.; Leng, L.; Qi, C.; Xie, G.; Wang, R.; Guo, L.; Yang, W.; Chung, M.C. Impact of Air Pollution Exposure during Various Periods of Pregnancy on Term Birth Weight: A Large-Sample, Retrospective Population-Based Cohort Study. Environ. Sci. Pollut. Res. 2021, 28, 3296–3306. [Google Scholar] [CrossRef] [PubMed]
- Wang, Q.; Miao, H.; Warren, J.L.; Ren, M.; Benmarhnia, T.; Knibbs, L.D.; Zhang, H.; Zhao, Q.; Huang, C. Association of Maternal Ozone Exposure with Term Low Birth Weight and Susceptible Window Identification. Environ. Int. 2021, 146, 106208. [Google Scholar] [CrossRef] [PubMed]
- Bergstra, A.D.; Brunekreef, B.; Burdorf, A. The Influence of Industry-Related Air Pollution on Birth Outcomes in an Industrialized Area. Environ. Pollut. 2021, 269, 115741. [Google Scholar] [CrossRef] [PubMed]
- Wojtyla, C.; Zielinska, K.; Wojtyla-Buciora, P.; Panek, G. Prenatal Fine Particulate Matter (PM2.5) Exposure and Pregnancy Outcomes—Analysis of Term Pregnancies in Poland. Int. J. Environ. Res. Public Health 2020, 17, 5820. [Google Scholar] [CrossRef] [PubMed]
- Tapia, V.L.; Vasquez, B.V.; Vu, B.; Liu, Y.; Steenland, K.; Gonzales, G.F. Association between Maternal Exposure to Particulate Matter (PM2.5) and Adverse Pregnancy Outcomes in Lima, Peru. J. Expo. Sci. Environ. Epidemiol. 2020, 30, 689–697. [Google Scholar] [CrossRef] [PubMed]
- Enders, C.; Pearson, D.; Harley, K.; Ebisu, K. Exposure to Coarse Particulate Matter during Gestation and Term Low Birthweight in California: Variation in Exposure and Risk across Region and Socioeconomic Subgroup. Sci. Total Environ. 2019, 653, 1435–1444. [Google Scholar] [CrossRef] [PubMed]
- Kim, Y.J.; Song, I.G.; Kim, K.N.; Kim, M.S.; Chung, S.H.; Choi, Y.S.; Bae, C.W. Maternal Exposure to Particulate Matter during Pregnancy and Adverse Birth Outcomes in the Republic of Korea. Int. J. Environ. Res. Public Health 2019, 16, 633. [Google Scholar] [CrossRef]
- Nobles, C.J.; Grantz, K.L.; Liu, D.; Williams, A.; Ouidir, M.; Seeni, I.; Sherman, S.; Mendola, P. Ambient Air Pollution and Fetal Growth Restriction: Physician Diagnosis of Fetal Growth Restriction versus Population-Based Small-for-Gestational Age. Sci. Total Environ. 2019, 650, 2641–2647. [Google Scholar] [CrossRef]
- Percy, Z.; DeFranco, E.; Xu, F.; Hall, E.S.; Haynes, E.N.; Jones, D.; Muglia, L.J.; Chen, A. Trimester Specific PM2.5 Exposure and Fetal Growth in Ohio, 2007–2010. Environ. Res. 2019, 171, 111–118. [Google Scholar] [CrossRef] [PubMed]
- Gong, X.; Lin, Y.; Bell, M.L.; Zhan, F.B. Associations between Maternal Residential Proximity to Air Emissions from Industrial Facilities and Low Birth Weight in Texas, USA. Environ. Int. 2018, 120, 181–198. [Google Scholar] [CrossRef]
- Wu, H.; Jiang, B.; Geng, X.; Zhu, P.; Liu, Z.; Cui, L.; Yang, L. Exposure to Fine Particulate Matter during Pregnancy and Risk of Term Low Birth Weight in Jinan, China, 2014–2016. Int. J. Hyg. Environ. Health 2018, 221, 183–190. [Google Scholar] [CrossRef] [PubMed]
- Fernando Costa Nascimento, L.; Blanco Machin, A.; Antonio Almeida Dos Santos, D. Existem Diferenças No Peso Ao Nascer de Acordo Com Sexo e Associações Com Exposição Materna a Poluentes Do Ar? Estudo de Coorte. Sao Paulo Med. J. 2017, 135, 347–354. [Google Scholar] [CrossRef]
- Dedele, A.; Grazuleviciene, R.; Miskinyte, A. Individual Exposure to Nitrogen Dioxide and Adverse Pregnancy Outcomes in Kaunas Study. Int. J. Environ. Health Res. 2017, 27, 230–240. [Google Scholar] [CrossRef]
- Capobussi, M.; Tettamanti, R.; Marcolin, L.; Piovesan, L.; Bronzin, S.; Gattoni, M.E.; Polloni, I.; Sabatino, G.; Tersalvi, C.A.; Auxilia, F.; et al. Air Pollution Impact on Pregnancy Outcomes in Como, Italy. J. Occup. Environ. Med. 2016, 58, 47–52. [Google Scholar] [CrossRef]
- Stieb, D.M.; Chen, L.; Hystad, P.; Beckerman, B.S.; Jerrett, M.; Tjepkema, M.; Crouse, D.L.; Omariba, D.W.; Peters, P.A.; van Donkelaar, A.; et al. A National Study of the Association between Traffic-Related Air Pollution and Adverse Pregnancy Outcomes in Canada, 1999–2008. Environ. Res. 2016, 148, 513–526. [Google Scholar] [CrossRef]
- Stieb, D.M.; Chen, L.; Beckerman, B.S.; Jerrett, M.; Crouse, D.L.; Omariba, D.W.R.; Peters, P.A.; Van Donkelaar, A.; Martin, R.V.; Burnett, R.T.; et al. Associations of Pregnancy Outcomes and PM2.5 in a National Canadian Study. Environ. Health Perspect. 2016, 124, 243–249. [Google Scholar] [CrossRef] [PubMed]
- Lavigne, E.; Yasseen, A.S.; Stieb, D.M.; Hystad, P.; van Donkelaar, A.; Martin, R.V.; Brook, J.R.; Crouse, D.L.; Burnett, R.T.; Chen, H.; et al. Ambient Air Pollution and Adverse Birth Outcomes: Differences by Maternal Comorbidities. Environ. Res. 2016, 148, 457–466. [Google Scholar] [CrossRef]
- Brown, J.M.; Harris, G.; Pantea, C.; Hwang, S.A.; Talbot, T.O. Linking Air Pollution Data and Adverse Birth Outcomes: Environmental Public Health Tracking in New York State. J. Public Health Manag. Pract. 2015, 21, S68–S74. [Google Scholar] [CrossRef]
- Poirier, A.; Dodds, L.; Dummer, T.; Rainham, D.; Maguire, B.; Johnson, M. Maternal Exposure to Air Pollution and Adverse Birth Outcomes in Halifax, Nova Scotia. J. Occup. Environ. Med. 2015, 57, 1291–1298. [Google Scholar] [CrossRef] [PubMed]
- Twum, C.; Zhu, J.; Wei, Y. Maternal Exposure to Ambient PM2.5 and Term Low Birthweight in the State of Georgia. Int. J. Environ. Health Res. 2015, 26, 92–100. [Google Scholar] [CrossRef] [PubMed]
- Habermann, M.; Gouveia, N. Socioeconomic Position and Low Birth Weight among Mothers Exposed to Traffic-Related Air Pollution. PLoS ONE 2014, 9, e113900. [Google Scholar] [CrossRef] [PubMed]
- Hannam, K.; McNamee, R.; Baker, P.; Sibley, C.; Agius, R. Air Pollution Exposure and Adverse Pregnancy Outcomes in a Large UK Birth Cohort: Use of a Novel Spatio-Temporal Modelling Technique. Scand. J. Work Environ. Health 2014, 40, 518–530. [Google Scholar] [CrossRef] [PubMed]
- Vinikoor-Imler, L.C.; Davis, J.A.; Meyer, R.E.; Messer, L.C.; Luben, T.J. Associations between Prenatal Exposure to Air Pollution, Small for Gestational Age, and Term Low Birthweight in a State-Wide Birth Cohort. Environ. Res. 2014, 132, 132–139. [Google Scholar] [CrossRef] [PubMed]
- da Silva, A.M.C.; Moi, G.P.; Mattos, I.E.; de Souza Hacon, S. Low Birth Weight at Term and the Presence of Fine Particulate Matter and Carbon Monoxide in the Brazilian Amazon: A Population-Based Retrospective Cohort Study. BMC Pregnancy Childbirth 2014, 14, 309. [Google Scholar] [CrossRef]
- Hyder, A.; Lee, H.J.; Ebisu, K.; Koutrakis, P.; Belanger, K.; Bell, M.L. PM2.5 Exposure and Birth Outcomes. Use of Satellite- and Monitor-Based Data. Epidemiology 2014, 25, 58–67. [Google Scholar] [CrossRef] [PubMed]
- Candela, S.; Ranzi, A.; Bonvicini, L.; Baldacchini, F.; Marzaroli, P.; Evangelista, A.; Luberto, F.; Carretta, E.; Angelini, P.; Sterrantino, A.F.; et al. Air Pollution from Incinerators and Reproductive Outcomes: A Multisite Study. Epidemiology 2013, 24, 863–870. [Google Scholar] [CrossRef] [PubMed]
- Olsson, D.; Mogren, I.; Forsberg, B. Air Pollution Exposure in Early Pregnancy and Adverse Pregnancy Outcomes: A Register-Based Cohort Study. BMJ. Open 2013, 3, e001955. [Google Scholar] [CrossRef]
- Sathyanarayana, S.; Zhou, C.; Rudra, C.B.; Gould, T.; Larson, T.; Koenig, J.; Karr, C.J. Prenatal Ambient Air Pollution Exposure and Small for Gestational Age Birth in the Puget Sound Air Basin. Air Qual. Atmos. Health 2013, 6, 455–463. [Google Scholar] [CrossRef]
- Le, H.Q.; Batterman, S.A.; Wirth, J.J.; Wahl, R.L.; Hoggatt, K.J.; Sadeghnejad, A.; Hultin, M.L.; Depa, M. Air Pollutant Exposure and Preterm and Term Small-for-Gestational-Age Births in Detroit, Michigan: Long-Term Trends and Associations. Environ. Int. 2012, 44, 7–17. [Google Scholar] [CrossRef] [PubMed]
- van den Hooven, E.H.; Pierik, F.H.; de Kluizenaar, Y.; Willemsen, S.P.; Hofman, A.; van Ratingen, S.W.; Zandveld, P.Y.J.; Mackenbach, J.P.; Steegers, E.A.P.; Miedema, H.M.E.; et al. Air Pollution Exposure during Pregnancy, Ultrasound Measures of Fetal Growth, and Adverse Birth Outcomes: A Prospective Cohort Study. Environ. Health Perspect. 2012, 120, 150–156. [Google Scholar] [CrossRef] [PubMed]
- Salihu, H.M.; August, E.M.; Mbah, A.K.; Alio, A.P.; De Cuba, R.; Jaward, F.M.; Berry, E. Lo Effectiveness of a Federal Healthy Start Program in Reducing the Impact of Particulate Air Pollutants on Feto-Infant Morbidity Outcomes. Matern. Child Health J. 2012, 16, 1602–1611. [Google Scholar] [CrossRef] [PubMed]
- Salihu, H.M.; Ghaji, N.; Mbah, A.K.; Alio, A.P.; August, E.M.; Boubakari, I. Particulate Pollutants and Racial/Ethnic Disparity in Feto-Infant Morbidity Outcomes. Matern. Child Health J. 2012, 16, 1679–1687. [Google Scholar] [CrossRef] [PubMed]
- Malmqvist, E.; Rignell-Hydbom, A.; Tinnerberg, H.; Björk, J.; Stroh, E.; Jakobsson, K.; Rittner, R.; Rylander, L. Maternal Exposure to Air Pollution and Birth Outcomes. Environ. Health Perspect. 2011, 119, 553–558. [Google Scholar] [CrossRef] [PubMed]
- Kashima, S.; Naruse, H.; Yorifuji, T.; Ohki, S.; Murakoshi, T.; Takao, S.; Tsuda, T.; Doi, H. Residential Proximity to Heavy Traffic and Birth Weight in Shizuoka, Japan. Environ. Res. 2011, 111, 377–387. [Google Scholar] [CrossRef] [PubMed]
- Gehring, U.; Van Eijsden, M.; Dijkema, M.B.A.; Van Der Wal, M.F.; Fischer, P.; Brunekreef, B. Traffic-Related Air Pollution and Pregnancy Outcomes in the Dutch ABCD Birth Cohort Study. Occup. Environ. Med. 2011, 68, 36–43. [Google Scholar] [CrossRef]
- Madsen, C.; Gehring, U.; Erik Walker, S.; Brunekreef, B.; Stigum, H.; Næss, Ø.; Nafstad, P. Ambient Air Pollution Exposure, Residential Mobility and Term Birth Weight in Oslo, Norway. Environ. Res. 2010, 110, 363–371. [Google Scholar] [CrossRef]
- Ballester, F.; Estarlich, M.; Iñiguez, C.; Llop, S.; Ramón, R.; Esplugues, A.; Lacasaña, M.; Rebagliato, M. Air Pollution Exposure during Pregnancy and Reduced Birth Size: A Prospective Birth Cohort Study in Valencia, Spain. Environ. Health A Glob. Access Sci. Source 2010, 9, 14–16. [Google Scholar] [CrossRef]
- Nascimento, L.F.C.; Moreira, D.A. Are Environmental Pollutants Risk Factors for Low Birth Weight? TT—Os Poluentes Ambientais São Fatores de Risco Para o Baixo Peso Ao Nascer? Cad. Saude Publica 2009, 25, 1791–1796. [Google Scholar] [CrossRef]
- Brauer, M.; Lencar, C.; Tamburic, L.; Koehoorn, M.; Demers, P.; Karr, C. A Cohort Study of Traffic-Related Air Pollution Impacts on Birth Outcomes. Environ. Health Perspect. 2008, 116, 680–686. [Google Scholar] [CrossRef] [PubMed]
- Hansen, C.; Neller, A.; Williams, G.; Simpson, R. Low Levels of Ambient Air Pollution during Pregnancy and Fetal Growth among Term Neonates in Brisbane, Australia. Environ. Res. 2007, 103, 383–389. [Google Scholar] [CrossRef] [PubMed]
- Kim, O.J.; Ha, E.H.; Kim, B.M.; Seo, J.H.; Park, H.S.; Jung, W.J.; Lee, B.E.; Suh, Y.J.; Kim, Y.J.; Lee, J.T.; et al. PM10 and Pregnancy Outcomes: A Hospital-Based Cohort Study of Pregnant Women in Seoul. J. Occup. Environ. Med. 2007, 49, 1394–1402. [Google Scholar] [CrossRef] [PubMed]
- Dugandzic, R.; Dodds, L.; Stieb, D.; Smith-Doiron, M. The Association between Low Level Exposures to Ambient Air Pollution and Term Low Birth Weight: A Retrospective Cohort Study. Environ. Health A Glob. Access Sci. Source 2006, 5, 1–8. [Google Scholar] [CrossRef] [PubMed]
- Wilhelm, M.; Ritz, B. Local Variations in CO and Particulate Air Pollution and Adverse Birth Outcomes in Los Angeles County, California, USA. Environ. Health Perspect. 2005, 113, 1212–1221. [Google Scholar] [CrossRef] [PubMed]
- Lin, C.M.; Li, C.Y.; Mao, I.F. Increased Risks of Term Low-Birth-Weight Infants in a Petrochemical Industrial City with High Air Pollution Levels. Arch. Environ. Health 2004, 59, 663–668. [Google Scholar] [CrossRef] [PubMed]
- Lin, C.M.; Li, C.Y.; Yang, G.Y.; Mao, I.F. Association between Maternal Exposure to Elevated Ambient Sulfur Dioxide during Pregnancy and Term Low Birth Weight. Environ. Res. 2004, 96, 41–50. [Google Scholar] [CrossRef] [PubMed]
- Lee, B.E.; Ha, E.H.; Park, H.S.; Kim, Y.J.; Hong, Y.C.; Kim, H.; Lee, J.T. Exposure to Air Pollution during Different Gestational Phases Contributes to Risks of Low Birth Weight. Human Reprod. 2003, 18, 638–643. [Google Scholar] [CrossRef] [PubMed]
- Yang, C.Y.; Tseng, Y.T.; Chang, C.C. Effects of Air Pollution on Birth Weight among Children Born between 1995 and 1997 in Kaohsiung, Taiwan. J. Toxicol. Environ. Health Part A 2003, 66, 807–816. [Google Scholar] [CrossRef]
- Maroziene, L.; Grazuleviciene, R. Maternal Exposure to Low-Level Air Pollution and Pregnancy Outcomes: A Population-Based Study. Environ. Health 2002, 1, 6. [Google Scholar] [CrossRef]
- Chen, L.; Yang, W.; Jennison, B.L.; Goodrich, A.; Omaye, S.T. Air Pollution and Birth Weight in Northern Nevada, 1991–1999. Inhal. Toxicol. 2002, 14, 141–157. [Google Scholar] [CrossRef] [PubMed]
- Vassilev, Z.P.; Robson, M.G.; Klotz, J.B. Outdoor Exposure to Airborne Polycyclic Organic Matter and Adverse Reproductive Outcomes: A Pilot Study. Am. J. Ind. Med. 2001, 40, 255–262. [Google Scholar] [CrossRef] [PubMed]
- Lin, M.C.; Yu, H.S.; Tsai, S.S.; Cheng, B.H.; Hsu, T.Y.; Wu, T.N.; Yang, C.Y. Adverse Pregnancy Outcome in a Petrochemical Polluted Area in Taiwan. J. Toxicol. Environ. Health Part A 2001, 63, 565–574. [Google Scholar] [CrossRef] [PubMed]
- Maisonet, M.; Bush, T.J.; Correa, A.; Jaakkola, J.J.K. Relation between Ambient Air Pollution and Low Birth Weight in the Northeastern United States. Environ. Health Perspect. 2001, 109, 351–356. [Google Scholar] [CrossRef] [PubMed]
- Ritz, B.; Yu, F. The Effect of Ambient Carbon Monoxide on Low Birth Weight among Children Born in Southern California between 1989 and 1993. Environ. Health Perspect. 1999, 107, 17–25. [Google Scholar] [CrossRef] [PubMed]
- Gražulevičiené, R.; Dulskiené, V.; Vencloviené, J. Formaldehyde Exposure and Low Birth Weight Incidence. J. Occup. Health 1998, 40, 61–67. [Google Scholar] [CrossRef]
- Alderman, B.W.; Baron, A.E.; Savitz, D.A. Maternal Exposure to Neighborhood Carbon Monoxide and Risk of Low Infant Birth Weight. Public Health Rep. 1987, 102, 410–414. [Google Scholar] [PubMed]
- Ghio, A.J.; Kim, C.; Devlin, R.B. Concentrated Ambient Air Particles Induce Mild Pulmonary Inflammation in Healthy Human Volunteers. Am. J. Respir. Crit. Care Med. 1999, 162, 981–988. [Google Scholar] [CrossRef] [PubMed]
- Jiang, Y.; Van Nguyen, T.; Jin, J.; Yu, Z.N.; Song, C.H.; Chai, O.H. Bergapten Ameliorates Combined Allergic Rhinitis and Asthma Syndrome after PM2.5 Exposure by Balancing Treg/Th17 Expression and Suppressing STAT3 and MAPK Activation in a Mouse Model. Biomed. Pharmacother. 2023, 164, 114959. [Google Scholar] [CrossRef]
- Liu, J.; Chen, Y.; Liu, D.; Ye, F.; Sun, Q.; Huang, Q.; Dong, J.; Pei, T.; He, Y.; Zhang, Q. Prenatal Exposure to Particulate Matter and Term Low Birth Weight: Systematic Review and Meta-Analysis. Environ. Sci. Pollut. Res. Int. 2023, 30, 63335–63346. [Google Scholar] [CrossRef]
- Gangwar, R.S.; Bevan, G.H.; Palanivel, R.; Das, L.; Rajagopalan, S. Oxidative Stress Pathways of Air Pollution Mediated Toxicity: Recent Insights. Redox Biol. 2020, 34, 101545. [Google Scholar] [CrossRef] [PubMed]
- Checa, J.; Aran, J.M. Reactive Oxygen Species: Drivers of Physiological and Pathological Processes. J. Inflamm. Res. 2020, 13, 1057–1073. [Google Scholar] [CrossRef] [PubMed]
- Dick, C.A.J.; Singh, P.; Daniels, M.; Evansky, P.; Becker, S.; Gilmour, M.I. Murine Pulmonary Inflammatory Responses Following Instillation of Size-Fractionated Ambient Particulate Matter. J. Toxicol. Environ. Health A 2003, 66, 2193–2207. [Google Scholar] [CrossRef] [PubMed]
- Simkhovich, B.; Kleinman, M.T.; Kloner, R.A. Air Pollution and Cardiovascular Injury. Am. Coll. Cardiol. Found. 2008, 52, 719–726. [Google Scholar] [CrossRef]
- Bearblock, E.; Aiken, C.E.; Burton, G.J. Air Pollution and Pre-Eclampsia; Associations and Potential Mechanisms. Placenta 2021, 104, 188–194. [Google Scholar] [CrossRef] [PubMed]
- Kosinska-Kaczynska, K.; Malicka, E.; Szymusik, I.; Dera, N.; Pruc, M.; Feduniw, S.; Rafique, Z.; Szarpak, L. The sFlt-1/PlGF Ratio in Pregnant Patients Affected by COVID-19. J. Clin. Med. 2023, 12, 1059. [Google Scholar] [CrossRef]
- Hettfleisch, K.; Carvalho, M.A.; Hoshida, M.S.; Pastro, L.D.M.; Saldiva, S.R.D.M.; Vieira, S.E.; Francisco, R.P.V.; Saldiva, P.H.N.; Bernardes, L.S. Individual Exposure to Urban Air Pollution and Its Correlation with Placental Angiogenic Markers in the First Trimester of Pregnancy, in São Paulo, Brazil. Environ. Sci. Pollut. Res. Int. 2021, 28, 28658–28665. [Google Scholar] [CrossRef]
- Arsalane, K.; Gosset, P.; Vanhee, D.; Voisin, C.; Hamid, Q.; Tonnel, A.B.; Wallaert, B. Ozone Stimulates Synthesis of Inflammatory Cytokines by Alveolar Macrophages in Vitro. Am. J. Respir. Cell Mol. Biol. 1995, 13, 60–68. [Google Scholar] [CrossRef]
- Beckerman, B.; Jerrett, M.; Brook, J.R.; Verma, D.K.; Arain, M.A.; Finkelstein, M.M. Correlation of Nitrogen Dioxide with Other Traffic Pollutants near a Major Expressway. Atmos. Environ. 2008, 42, 275–290. [Google Scholar] [CrossRef]
- Gentner, D.R.; Jathar, S.H.; Gordon, T.D.; Bahreini, R.; Day, D.A.; El Haddad, I.; Hayes, P.L.; Pieber, S.M.; Platt, S.M.; De Gouw, J.; et al. Review of Urban Secondary Organic Aerosol Formation from Gasoline and Diesel Motor Vehicle Emissions. Environ. Sci. Technol. 2017, 51, 1074–1093. [Google Scholar] [CrossRef]
- Peitzmeier, C.; Loschke, C.; Wiedenhaus, H.; Klemm, O. Real-World Vehicle Emissions as Measured by in Situ Analysis of Exhaust Plumes. Environ. Sci. Pollut. Res. 2017, 24, 23279–23289. [Google Scholar] [CrossRef] [PubMed]
- Hata, H.; Okada, M.; Yanai, K.; Kugata, M.; Hoshi, J. Exhaust Emissions from Gasoline Vehicles after Parking Events Evaluated by Chassis Dynamometer Experiment and Chemical Kinetic Model of Three-Way Catalytic Converter. Sci. Total Environ. 2022, 848, 157578. [Google Scholar] [CrossRef] [PubMed]
- Mendoza-Ramirez, J.; Barraza-Villarreal, A.; Hernandez-Cadena, L.; de la Garza, O.H.; Sangrador, J.L.T.; Torres-Sanchez, L.E.; Cortez-Lugo, M.; Escamilla-Nuñez, C.; Sanin-Aguirre, L.H.; Romieu, I. Prenatal Exposure to Nitrogen Oxides and Its Association with Birth Weight in a Cohort of Mexican Newborns from Morelos, Mexico. Ann. Glob. Health 2018, 84, 274–280. [Google Scholar] [CrossRef] [PubMed]
- Cyr, A.R.; Huckaby, L.V.; Shiva, S.S.; Zuckerbraun, B.S. Nitric Oxide and Endothelial Dysfunction. Crit. Care Clin. 2020, 36, 307–321. [Google Scholar] [CrossRef] [PubMed]
- Choi, Y.-J.; Cho, J.; Hong, Y.-C.; Lee, D.; Moon, S.; Park, S.J.; Lee, K.; Shin, C.H.; Lee, Y.A.; Kim, B.-N.; et al. DNA Methylation Is Associated with Prenatal Exposure to Sulfur Dioxide and Childhood Attention-Deficit Hyperactivity Disorder Symptoms. Sci. Rep. 2023, 13, 3501. [Google Scholar] [CrossRef]
- Gozubuyuk, A.A.; Dag, H.; Kacar, A.; Karakurt, Y.; Arica, V. Epidemiology, Pathophysiology, Clinical Evaluation, and Treatment of Carbon Monoxide Poisoning in Child, Infant, and Fetus. North Clin. Istanb. 2017, 4, 100–107. [Google Scholar] [CrossRef] [PubMed]
- Chou, K.J.; Fisher, J.L.; Silver, E.J. Characteristics and Outcome of Children with Carbon Monoxide Poisoning with and without Smoke Exposure Referred for Hyperbaric Oxygen Therapy. Pediatr. Emerg. Care 2000, 16, 151–155. [Google Scholar] [CrossRef] [PubMed]
- Perera, F.P.; Jedrychowski, W.; Rauh, V.; Whyatt, R.M. Molecular Epidemiologic Research on the Effects of Environmental Pollutants on the Fetus. Environ. Health Perspect. 1999, 107, 451–460. [Google Scholar] [CrossRef]
- Liu, J.; Dai, Y.; Yuan, J.; Li, R.; Hu, Y.; Su, Y. Does Exposure to Air Pollution during Different Time Windows Affect Pregnancy Outcomes of in Vitro Fertilization Treatment? A Systematic Review and Meta-Analysis. Chemosphere 2023, 335, 139076. [Google Scholar] [CrossRef]
- Bai, W.; Li, Y.; Niu, Y.; Ding, Y.; Yu, X.; Zhu, B.; Duan, R.; Duan, H.; Kou, C.; Li, Y.; et al. Association between Ambient Air Pollution and Pregnancy Complications: A Systematic Review and Meta-Analysis of Cohort Studies. Environ. Res. 2020, 185, 109471. [Google Scholar] [CrossRef]
- Issah, I.; Duah, M.S.; Arko-Mensah, J.; Bawua, S.A.; Agyekum, T.P.; Fobil, J.N. Assessing the Combined Effect of Multiple Metal Exposures on Pregnancy and Birth Outcomes: Methodological Insights in Systematic Review Research. MethodsX 2024, 12, 102558. [Google Scholar] [CrossRef]

| (pregnant OR pregnancy OR fetus OR foetus OR foetal OR fetal) AND (“air pollution” OR “air pollutants” OR PM10 OR PM2.5 OR ozone OR CO OR NO2 OR NOx OR SO2 OR VOC OR “particulate matter” OR particulates OR “ground ozone” OR “carbon monoxide” OR “volatile organic compounds” OR “nitrogen dioxide” OR “sulfur dioxide” OR “sulphur dioxide”) AND (“birth weight” OR “hypotrophy” OR “small for gestational age” OR SGA OR “intrauterine growth restriction” OR “fetal growth restriction” OR “term low birth weight” OR “low birth weight” OR TLBW OR LBW AND (Infant, Low Birth Weight [MeSH])) |
| Study | Time and Place of Exposure Type of Pollutant | Character of the Study and Number of Included Patients | Outcomes | ||
|---|---|---|---|---|---|
| Study Group | Control Group | ||||
| Canto et al. (2023) [22] | 2009–2010 Spain Pollutant: PM10 | Retrospective study n = 288,229 | Exposure cut-offs of PM10 15–19 μg/m3 (n = 50,967) 20–24 μg/m3 (n = 123,601) 25–29 μg/m3 (n = 90,474) 30–34 μg/m3 (n = 15,388) 35–39 μg/m3 (n = 2276) 40–44 μg/m3 (n = 323) 45–49 μg/m3 (n = 100) 50–54 μg/m3 (n = 54) 55–59 μg/m3 (n = 37) 60–64 μg/m3 (n = 1) | Exposure cut-off of PM10: ≤15 μg/m3 (n = 5008) and ≤40 μg/m3 (n = 287,714) | PM10 exposure is related to SGA (adjusted odds ratio (aOR) 1.05, 95 % confidence interval (CI): 1.0–1.09). Reduction of 10 μg/m3 of PM10 was associated with an increase of 22 g, 95 % CI: 17.2–28.0). 15 % and 50 % reduction of PM10 exposure reduces risk of term low birth weight (TLBW) and small for gestational age (SGA) occurrence. |
| Zhou et al. (2023) [26] | 2015–2020 Chongqing, China Pollutants: PM2.5, PM10, NO2, CO and O3 | Retrospective study n = 572,106 | Number of exposed were not specified. Exposure cut-off of PM10 in II–IV Quartile (Q): 59.1–121.5 μg/m3 | Number of nonexposed were not specified. Exposure cut-off of PM10 in I Q: 28.8–59.1 μg/m3 | 10 μg/m3 increase in PM10 exposure is related to VTLBW occurrence (RR 1.13, 95%CI: 1.06–1.21). |
| Gan et al. (2022) [28] | 2017–2018 Guangzhou, China Pollutants: PM2.5, NO2, SO2, O3, and PM10 | Prospective study n = 916 | Number of exposed were not specified. Exposure cut-off of PM10 in II–IV Q: Cut-off point of exposure not specified in study. | Number of nonexposed were not specified. Exposure cut-off of PM10 in I Q: Cut-off point of exposure not specified in study. | TLBW is associated with maternal exposure to: SO2 and PM10 (OR 1.23, 95%CI: 1.03–1.46) |
| Huang et al. (2022) [30] | 2015–2016 Wen Zhou, China Pollutants: PM2.5, PM10, SO2, NO2, and O3 | Retrospective study n = 213,959 | Number of exposed were not specified. Exposure cut-off of PM10 in II–IV Q: 66.2–86.0 μg/m3 | Number of nonexposed were not specified. Exposure cut-off of PM10 in I Q: <66.2 μg/m3 | TLBW is associated with maternal exposure to PM10 (aOR 1.14, 95%CI: 1.06–1.23) during the entire pregnancy. The significant influence was shown especially in the 2nd trimester. |
| Rodríguez-Fernández et al. (2022) [31] | 2014–2016 Chile Pollutants: PM2.5 and PM10 | Cross sectional study n = 595,369 | Number of exposed were not specified. Exposure cut-off of PM10 in II–IV Q: Cut-off point of exposure not specified in study. | Number of nonexposed were not specified. Exposure cut-off of PM10 in I Q: Cut-off point of exposure not specified in study. | Second trimester exposure of PM10 (aOR 1.14, 95%CI: 1.11–1.18) is associated with an increased the risk of TLBW |
| Shang et al. (2021) [36] | 2015–2018 Xi’an city of Shaanxi, China Pollutants: high level of air quality index (AQI), PM2.5, PM10, SO2, CO, O3, NO2 | Retrospective study n = 321,521 | Number of exposed were not specified. Exposure cut-off of PM10 in II–IV Q: >73.9 μg/m3. | Number of nonexposed were not specified. Exposure cut-off of PM10 in I Q: <73.9 μg/m3. | TLBW is associated with maternal exposure to PM10 (OR 1.02, 95%CI: 1.009–1.03) |
| Enders et al. (2019) [41] | 2002–2013 California, USA Pollutants: PM10 and PM2.5 | Retrospective study n = 2,719,596 | Number of exposed were not specified. Exposure cut-off of PM10 in II–IV Q: II Q of PM10 (11.4–14.3 μg/m3) III Q of PM10 (14.3–18.5 μg/m3) IV Q of PM10 (>18.5 μg/m3) | Number of nonexposed were not specified. Exposure cut-off of PM10 in I Q: <11.4 μg/m3. | TLBW is associated with maternal exposure to PM2.5-10 in II Q (aOR 1.00, 95%CI: 0.98–1.03), III Q (aOR 1.03, 95%CI: 1.00–1.06). |
| Kim et al. (2019) [42] | 2010–2013 Korea Pollutant: PM10 | Retrospective study n = 1,742,183 | Number of exposed were not specified. Exposure cut-off of PM10 in IV Q: >70 μg/m3) | Number of nonexposed were not specified. Exposure cut-off of PM10 in I–II Q: <70 μg/m3. | The rate of low birth weight in term infants increased when women were exposed to > 70 µg/m3 PM10 (aOR 1.060, 95%CI: 0.953–1.178) |
| Nobles et al. (2019) [43] | 2002–2010 20 hospitals in USA Pollutants: SO2, O3, NOx, NO2, CO, PM10 and PM2.5 | Retrospective study n = 109,126 births | Number of exposed were not specified. Exposure with SO2, O3, NOx, NO2, CO, PM10, PM2.5 from II–IV Q Quartiles of exposure cut-offs not specified in study. | Number of nonexposed were not specified. Exposure with SO2, O3, NOx, NO2, CO, PM10, PM2.5 in I Q Quartiles of exposure cut-offs not specified in study. | Risk of SGA increases in the third trimester every 10th percentile per interquartile increase in exposure of PM10 (RR 1.03, 95%CI: 1.00–1.06). |
| Costa Nascimento et al. (2017) [47] | 2012–2013 São José do Rio Preto, Brazil Pollutants: NO2, PM10 and O3 | Retrospective longitudinal study n = 8948 | Number of exposed were not specified. Exposure cut-off of PM10 in II–IV Q: 33.47–65.66 μg/m3. | Number of nonexposed were not specified. Exposure cut-off of PM10 in I Q: <33.47 μg/m3. | Exposure to PM10 had a paradoxical protective effect (aOR 0.72, 95%CI: 0.56–0.92) on TLBW occurrence. |
| Habermann and Gouveia (2014) [56] | 2006 Sao Paulo, Brazil Pollutant: PM10 | Retrospective study n = 11,586 | 8613 pregnant women exposed with traffic related air pollution of PM10 from second to fourth quartile. Exposure cut-off of PM10 in: II Q (35.3–37.0 μg/m3) III Q (37.0–40.4 μg/m3) IV Q (40.4–108.2 μg/m3). | 2952 pregnant women exposed with traffic related PM10 from first quartile. Exposure cut-off of PM10 in I Q: < 35.3 μg/m3. | PM10 exposure measured with LUR-PM10 is not related to TLBW. |
| Hannam et al. (2014) [57] | 2004–2008 Northwest England, UK Pollutants: NOx, NO2, CO, PM2.5 and PM10 | Retrospective study n = 203,562 | Number of exposed were not specified. Exposure cut-off of PM10 in II–IV Q: 46.3 ≥ 69.8 μg/m3. | Number of nonexposed were not specified. Exposure cut-off of PM10 in I Q: 18.3–35.4 μg/m3. | NOx, NO2, CO, PM2.5, PM10 is related with increased risk of SGA infant. Small statistically significant association was observed for PM10 and SGA, particularly with exposure in the first and third trimesters. Similar effects on SGA were also found for NO2, PM2.5, and CO in later pregnancy, but no overall increased risk was observed. NO2 (aOR 1.66, 95%CI: 1.47–1.87), PM10 (aOR 1.57, 95%CI: 1.43–1.71). |
| Candela et al. (2013) [61] | 2003–2010 Emilia-romagna region, UK Pollutants: PM10 | Retrospective study n = 21,517 | 16,731 pregnant women exposed with PM10 and NOx form second quintile to fifth quintile. Exposure cut-off of PM10 in: II Q: 0.08–0.2 ng/m3 III Q: 0.2–0.3 ng/m3 IV Q: >0.3–0.8 ng/m3. | 4433 pregnant women exposed with PM10 in first quintile. Exposure cut-off of PM10 in I Q: <0.07 ng/m3. | No associations were observed between PM10 exposure and SGA or TLBW occurrence. |
| Le et al. (2012) [64] | 1990–2001 Detroit, Michigan, USA Pollutants: CO, NO2, PM10 and O3 | Retrospective study n = 164,905 | Number of exposed were not specified. Exposure cut-off of PM10 in II–IV Q: >35 μg/m3. | Number of nonexposed were not specified. Exposure cut-off of PM10 in I Q: <35 μg/m3. | SGA was associated with PM10 (aOR 1.22, 95%CI: 1.03–1.46). Third trimester top-quartile PM10 exposure (>35.8 μg m3) gave the highest risk of a term SGA birth (aOR 1.22, 95%CI: 1.04–1.44) |
| van den Hooven et al. (2012) [65] | 2001–2005 Rotterdam, Netherlands Pollutants: PM10 and NO2 | Prospective study n = 7772 | 6928 pregnant women exposed with PM10, NO2 in II–IV Q. Exposure cut-off of PM10 in II–IV Q: 27.8–40.9 μg/m3. | 844 pregnant women exposed with PM10, NO2 in I Q. Exposure cut-off of PM10 in I Q: <27.8 μg/m3 | III Q of PM10 exposure is related with SGA (aOR 1.38, 95%CI: 1.00–1.90). |
| Salihu et al. (2012) [66] | 2000–2007 Tampa, Florida, USA Pollutants: PM2.5 and PM10 | Retrospective study n = 12,356 | 8791 pregnant women exposed with PM2.5, PM10 above the median. Exposure above the median: >25.04 μg/m3 PM10 | 3565 pregnant women exposed with PM2.5, PM10 below the median. Exposure below the median: <25.04 μg/m3 PM10 | Women exposed to air particulate pollutants were at elevated risk for TLBW (aOR 1.24, 95%CI: 1.07–1.43), VLBW (aOR 1.58, 95%CI: 1.09–2.29) SGA was related to PM10 exposure (aOR 1.14, 95%CI: 1.03–1.27). |
| Salihu et al. (2012) [67] | 2000–2007 Tampa, Florida, USA Pollutants: PM2.5 and PM10 | Retrospective study n = 103,961 | 24,090 pregnant women exposed with PM2.5, PM10 above the median. Exposure above the median: >24.35 μg/m3 PM10 | 79,871 pregnant women exposed with PM2.5, PM10 below the median. Exposure below the median: <24.35 μg/m3 PM10 | Exposed women had increased odds for low birth weight and very low birth weight, with the greatest risk being for very low birth weight (aOR 1.27, 95%CI 1.08–1.49). TLBW was related to PM10 exposure (aOR 1.13, 95%CI: 1.07–1.19). |
| Madsen et al. (2010) [71] | 1999–2002 Oslo, Norway Pollutants: NO2, PM10 and PM2.5 | Retrospective study n = 25,229 | 18,921 pregnant women exposed with NO2, PM10, PM2.5 II–IV Q. Exposure cut-off of PM10 in II–IV Q PM10: >10.8 μg/m3. | 6308 pregnant women exposed with NO2, PM10, PM2.5 in I Q. Exposure cut-off of PM10 in I Q: <10.7 μg/m3. | No associations were observed between NO2, PM10 exposure and SGA or TLBW occurrence. |
| Hansen et al. (2007) [75] | 2000–2003 Brisbane, Australia Pollutants: PM10, NO2 and O3 | Retrospective study n = 26,617 | Number of exposed were not specified. Exposure cut-off of PM10 in II–IV Q: 14.6–171.7 μg/m3. | Number of nonexposed were not specified. Exposure cut-off of PM10 in I Q: <14.6 μg/m3. | No associations were observed between PM10, NO2, or O3 exposure and SGA or TLBW occurrence. |
| Kim et al. (2007) [76] | 2001–2004 Seul, Korea Pollutant: PM10 | Multicenter prospective study n = 1514 | Number of exposed were not specified. Exposure with PM10 from II to IV Q. Cut-off points of exposure not specified in study. | Number of nonexposed were not specified. Exposure with PM10 in I Q. Cut-off points of exposure not specified in study. | IUGR was affected by the first trimester’s PM10 exposure. TLBW was affected by the PM10 level during the whole pregnancy. TLBW was affected by a 10 g/m3 increase in the average ambient PM10 concentration during the first (aOR 1.1, 95%CI: 1.0–1.2), second (aOR 1.1, 95%CI: 0.9–1.2), and third (aOR 1.1, 95%CI: 1.0–1.2) trimesters. |
| Dugandzic et al. (2006) [77] | 1988–2000 Nova Scotia Atlee, Canada Pollutants: PM10, SO2 and O3 | Retrospective study n = 74,284 | Number of exposed were not specified. Exposure cut-off of PM10 in II–IV Q: 14–53 µg/m3. | Number of nonexposed were not specified. Exposure cut-off of PM10 in I Q PM10: < 14 µg/m3. | SO2 exposure during the I trimester is related with TLBW (RR 1.36, 95%CI: 1.04–1.78) PM10 exposure during the I trimester is related with TLBW (RR 1.33, 95%CI: 1.02–1.74). |
| Lin et al. (2004) [79] | 1995–1997 Taipei and Kaohsiung, Taiwan Pollutants: SO2, PM10, CO, O3 and NO2 | Retrospective study n = 31,530 (Kaohsiung) n = 60,758 (Taipei) | 31,530 pregnant women from Kaohsiung exposed with mean concentration of: PM10 (65.8–83.6 μg/m3) | 60,758 pregnant women from Taipei exposed with mean concentration of: PM10 (46.4–51.9 μg/m3). | Higher exposure of SO2, PM10, CO, O3, and NO2 in Kaohsiung leads to 13% higher TLBW occurrence than lower exposure in Taipei (OR 1.13, 95%CI: 1.03–1.24). |
| Lin et al. (2004) [80] | 1995–1997 Taipei and Kaohsiung, Taiwan Pollutants: SO2, PM10, CO, O3 and NO2 | Retrospective study n = 92,288 | Number of exposed were not specified. Exposure cut-off of PM10 in II–IV Q PM10: >46.4 μg/m3 | Number of nonexposed were not specified. Exposure cut-off of PM10 in I Q: <46.4 μg/m3. | No associations were observed between PM10 exposure and TLBW occurrence. |
| Lee et al. (2003) [81] | 1996–1998 Seoul, Korea Pollutants: CO, PM10, SO2 and NO2 | Retrospective study n = 388,105 | Number of exposed were not specified. Exposure cut-off of PM10 in II–IV Q PM10: 47.4–236.9 μg/m3. | Number of nonexposed were not specified. Exposure cut-off of PM10 in I Q PM10: 18.4–47.4 μg/m3. | Second-trimester PM10 exposure increased the risk for TLBW (aOR 1.04, 95%CI: 1.00–1.08). |
| Chen et al. (2002) [84] | 1991–1999 Nevada State, USA Pollutants: PM10, CO and O3 | Retrospective study n = 39,338 | 32,676 pregnant women exposed with PM10 at the third trimester (>19.72 µg/m3). | 3629 pregnant women with low exposure to PM10 at the third trimester (<19.72 µg/m3). | A 10 µg/m3 increase in PM10 level in the third trimester can be associated with a birth weight reduction of 11 g (95%CI: 2.3–19.8 g) |
| Lin et al. (2001) [86] | 1993–1996 Lin-Yuan and Taicei, Taiwan Pollutants: SO2, NO2, PM10, SO42−, NH4+ and NO3− | Retrospective study n = 2545 | 1677 pregnant women from Lin-Yuan municipality. Exposure cut-off of PM10 in II–IV Q: 85.9 ± 1.7 μg/m3. | 868 pregnant women from Taicei municipality. Exposure cut-off of PM10 in I Q PM10: 59.2 ± 1.4 μg/m3. | Higher exposure of SO2, NO2, PM10, SO42−, and NO3− in a petrochemical municipality in Lin-Yuan leads to 3.22% TLBW occurrence in comparison to lower exposure in a control municipality Taicei which led to 1.84% TLBW occurrence. |
| Study | Time and Place of Exposure Type of Pollutant | Character of the Study and Number of Included Patients | Outcomes | ||
|---|---|---|---|---|---|
| Study Group | Control Group | ||||
| Chen et al. (2023) [23] | 2014–2018 8 provinces in China Pollutant: PM2.5 | Prospective study n = 179,761 | Number of exposed were not specified. Exposure with PM2.5 in II–IV Q. Cut-off point of exposure not specified in study. | Number of nonexposed were not specified. Exposure with PM2.5 in I Q. Cut-off point of exposure not specified in study. | PM2.5 exposure is related with SGA occurrence (aOR 1.02, 95 % CI: 1.01–1.04) |
| Mitku et al. (2023) [24] | 2013–2017 Durban, South Africa Pollutants: PM2.5, SO2, NOx (NO and NO2) | Retrospective study n = 656 from low socioeconomic neighbourhoods | Number of exposed were not specified. Exposure cut-off of PM2.5 in II–IV Q: Cut-off point of exposure not specified in study. | Number of nonexposed were not specified. Exposure cut-off of PM2.5 in I Q: Cut-off point of exposure not specified in study. | Increased SGA occurrence risk is associated with exposure to PM2.5 (aOR 1.2, 95%CI: 1.21–1.28) and SO2 (aOR 1.1, 95%CI: 1.01–1.13). |
| Zhou et al. (2023) [26] | 2015–2020 Chongqing, China Pollutants: PM2.5, PM10, NO2, CO and O3 | Retrospective study n = 572,106 | Number of exposed were not specified. Exposure cut-off of PM2.5 in II–IV Q PM2.5: 34.4–83.7 μg/m3. | Number of nonexposed were not specified. Exposure cut-off of PM2.5 in I Q: 17.8–34.4 μg/m3. | 10 μg/m3 increase in PM2.5 exposure is related to very low birth weight (VLBW) occurrence (relative risk (RR) 1.1, 95%CI: 1.01–1.2). |
| Ahmad et al. (2022) [27] | 2004–2015 Israel Pollutant: PM2.5 | Retrospective study n = 381,265 | Number of exposed were not specified. Exposure cut-off of PM2.5 in II–IV Q: Cut-off point of exposure not specified in study. | Number of nonexposed were not specified. Exposure cut-off of PM2.5 in I Q: Cut-off point of exposure not specified in study. | 10 μg/m3 increase in PM2.5 led to increased risk of TLBW (OR 1.25, 95%CI: 1.09–1.43) and SGA (OR 1.15, 95%CI: 1.06–1.26). |
| Gan et al. (2022) [28] | 2017–2018 Guangzhou, China Pollutants: PM2.5, NO2, SO2, O3, and PM10 | Prospective study n = 916 | Number of exposed were not specified. Exposure cut-off of PM2.5 in II–IV Q: Cut-off point of exposure not specified in study. | Number of nonexposed were not specified. Exposure cut-off of PM2.5 in I Q: Cut-off point of exposure not specified in study. | TLBW is associated with maternal exposure to SO2 and PM2.5 (OR 1.28, 95%CI: 1.07–1.52). |
| Huang et al. (2022) [30] | 2015–2016 Wen Zhou, China Pollutants: PM2.5, PM10, SO2, NO2, and O3 | Retrospective study n = 213,959 | Number of exposed were not specified. Exposure cut-off of PM2.5 in II–IV Q: 39.1–52.7 μg/m3. | Number of nonexposed were not specified. Exposure cut-off of PM2.5 in I Q: <39.1 μg/m3. | TLBW is associated with maternal exposure to PM2.5 (aOR 1.12, 95%CI: 1.02–1.24) during the entire pregnancy. A significant influence was shown, especially in the 2nd trimester. |
| Rodríguez-Fernández et al. (2022) [31] | 2014–2016 Chile Pollutants: PM2.5 and PM10 | Cross sectional study n = 595,369 | Number of exposed were not specified. Exposure cut-off of PM2.5 in II–IV Q: Cut-off point of exposure not specified in study. | Number of nonexposed were not specified. Exposure cut-off of PM2.5 in I Q: Cut-off point of exposure not specified in study. | Second trimester exposure to PM2.5 (aOR 1.03, 95%CI: 1.004–1.06) is associated with an increased the risk of TLBW. |
| Shen et al. (2022) [32] | 2015–2016 24 provinces in China Pollutants: PM2.5, CO, NH4+ (ammonium), SO42− (sulphate) | Retrospective study n = 70,206 | Number of exposed were not specified. Exposure cut-off of PM2.5 in II–IV Q PM2.5: 41–110 μg/m3. | Number of nonexposed were not specified. Exposure cut-off of PM2.5 in I Q: <41 μg/m3. | PM2.5 exposure during pregnancy is associated with 16%, 95%CI: 3–30% higher risk of SGA. |
| Zhu et al. (2022) [33] | 2014–2018 China Pollutant: PM2.5 | Prospective study n = 117,162 | Number of exposed were not specified. Exposure cut-off of PM2.5 in II–IV Q: >28 μg/m3. | Number of nonexposed were not specified. Exposure cut-off of PM2.5 in I Q: <28 μg/m3. | 10 μg/m3 increase in PM2.5 exposure is correlated with increased SGA occurrence in the second trimester (OR 1.023, 95%CI: 1.008–1.037) and during the whole pregnancy (OR 1.025, 95%CI: 1.002–1.048) |
| Chen et al. (2022) [34] | 2014–2016 most air-polluted cities in China Pollutant: PM2.5 | Retrospective study n = 10,916 | Number of exposed were not specified. Exposure cut-off of PM2.5 in II–IV Q: Cut-off point of exposure not specified in study. | Number of nonexposed were not specified. Exposure cut-off of PM2.5 in I Q: Cut-off point of exposure not specified in study. | 10 μg/m3 increase in PM2.5 positively correlates to SGA occurrence in preconceptional time and in the first trimester. The strongest correlation is in the 5th week before conception (HR 1.06, 95%CI: 1.03–1.09). |
| Chen et al. (2021) [35] | 1993–2005 UK Pollutant: PM2.5 | Retrospective study n = 12,020 | Number of exposed were not specified. Exposure cut-off of PM2.5 in II–IV Q: Cut-off point of exposure not specified in study. | Number of nonexposed were not specified. Exposure cut-off of PM2.5 in I Q: Cut-off point of exposure not specified in study. | PM2.5 exposure increased TLBW occurrence by 40% (OR 1.40, 95%CI: 1.12–1.75) and SGA occurrence by 18% (OR 1.18, 95%CI: 1.05–1.32) |
| Shang et al. (2021) [36] | 2015–2018 Xi’an city of Shaanxi, China, Pollutants: high level of air quality index (AQI), PM2.5, PM10, SO2, CO, O3, NO2 | Retrospective study n = 321,521 | Number of exposed were not specified. Exposure cut-off of PM2.5 in II–IV Q PM2.5: >33.4 μg/m3. | Number of nonexposed were not specified. Exposure cut-off of PM2.5 in I Q: <33.4 μg/m3. | TLBW is associated with maternal exposure to PM2.5 (OR 1.02, 95%CI: 1.006–1.03). |
| Wojtyla et al. (2020) [39] | 2016–2017 Poland Pollutant: PM2.5 | Retrospective study n = 1095 | 634 pregnant women exposed with PM2.5 cut-off > 25 μg/m3. | 432 pregnant women exposed with PM2.5 cut-off < 25 μg/m3. | Exposure to PM2.5 is related to SGA. It is 4 times more likely to lead to TLBW (aOR 4.3, 95%CI: 1.5–2.3) |
| Tapia et al. (2020) [40] | 2012–2016 Lima, Peru Pollutant: PM2.5 | Retrospective study n = 123,034 | Number of exposed were not specified. Exposure cut-off of PM2.5 in II–IV Q: 16.84–41.6 μg/m3. | Number of nonexposed were not specified. Exposure cut-off of PM2.5 in I Q: 12.7–16.83 μg/m3. | SGA was associated with exposure to PM2.5 exposure overall (aOR 1.04, 95%CI: 1.01–1.08) and in the first (aOR 1.07, 95%CI: 1.03–1.10) and third trimesters (aOR 1.04, 95%CI: 1.00–1.07). |
| Enders et al. (2019) [41] | 2002–2013 California, USAPollutants: PM10 and PM2.5 | Retrospective study n = 2,719,596 | Number of exposed were not specified. Exposure cut-off of PM2.5 in: II Q PM2.5 (10.2–12.6 μg/m3) III Q PM2.5 (12.6–16.1 μg/m3) IV Q PM2.5 (>16.1 μg/m3) | Number of nonexposed were not specified. Exposure cut-off of PM2.5 in I Q: <10.2 μg/m3. | TLBW is associated with maternal exposure to PM2.5-10 in II Q (aOR 1.00, 95%CI: 0.98–1.03) and III Q (aOR 1.03, 95%CI: 1.00–1.06). PM2.5 exposure correlates with TLBW in IV Q (aOR 1.04, 95%CI: 1.01–1.07). |
| Nobles et al. (2019) [43] | 2002–2010 20 hospitals in USA Pollutants: SO2, O3, NOx, NO2, CO, PM10, PM2.5 | Retrospective study n = 109,126 births | Number of exposed were not specified. Exposure cut-off of PM2.5 in II–IV Q: Cut-off point of exposure not specified in study. | Number of nonexposed were not specified. Exposure cut-off of PM2.5 in I Q: Cut-off point of exposure not specified in study. | Risk of SGA increases in the third trimester every 10th percentile per interquartile increase in exposure of PM2.5 (RR 1.02, 95%CI 1.00, 1.05). |
| Percy et al. (2019) [44] | 2007–2010 Ohio, USA Pollutant: PM2.5 | Retrospective study n = 224,921 | 181,665 pregnant women exposed with ≥15 μg/m3 PM2.5 | 43,256 pregnant women exposed with <15 μg/m3 PM2.5 | III trimester exposure of PM2.5 increases SGA occurrence (aOR 1.09, 95%CI: 1.02–1.17) |
| Wu (2018) [46] | 2013–2016 Jinan, China Pollutants: PM2.5, NO2, SO2 | Retrospective study n = 43,855 | Number of exposed were not specified. Exposure cut-off of PM2.5 in II–IV Q: 80.5–119.3 μg/m3. | Number of nonexposed were not specified. Exposure cut-off of PM2.5 in I Q: <80.4 μg/m3. | PM2.5 was positively associated with TLBW in II Q (aOR 1.77, 95%CI: 1.09–2.88), III Q (aOR 1.77, 95%CI: 1.03–3.04), and IV Q (aOR 1.92, 95%CI: 1.04–3.55) |
| Stieb et al. (2016) [50] | 1999–2008 Canada Pollutants: PM2.5 | Retrospective study n = 2,965,440 | Number of exposed were not specified. Exposure cut-off of PM2.5 II–IV Q: Cut-off point of exposure not specified in study. | Number of nonexposed were not specified. Exposure cut-off of PM2.5 in I Q: Cut-off point of exposure not specified in study. | 10 μg/m3 increase in PM2.5 exposure is related to 4% increase in SGA (OR 1.04, 95%CI: 1.01–1.07) |
| Lavigne et al. (2016) [52] | 2005–2012 Ontario, Canada Pollutants: PM2.5, NO2, and O3 | Retrospective study n = 818,400 | Number of exposed were not specified. Exposure cut-offs of >5 percentile of PM2.5 (>6 μg/m3). | Number of nonexposed were not specified. Exposure cut-offs of ≤5 percentile of PM2.5 (≤6 μg/m3). | No associations were observed between PM2.5, NO2, or O3 exposure and SGA or TLBW occurrence. |
| Brown et al. (2015) [53] | 2001–2006 New York, USAPollutants: O3 and PM2.5 | Retrospective study n = 480,430 | Number of nonexposed were not specified. Exposure cut-off of PM2.5 in II–IV Q: 9.75–18.07 μg/m3. | Number of nonexposed were not specified. Exposure cut-off of PM2.5 in I Q: 3.66–9.49 μg/m3. | There was paradoxical effect of decreased SGA occurrence after exposure to II Q PM2.5 (aOR 0.87, 95%CI: 0.79–0.96), and to the III Q of O3 (aOR 0.86, 95%CI: 0.81–0.92). |
| Twum et al. (2015) [55] | 2004 9 counties of Georgia, USA Pollutant: PM2.5 | Retrospective study n = 48,172 | 36,129 pregnant women exposed with PM2.5. Exposure cut-off of PM2.5 in II–IV Q: Cut-off point of exposure not specified in study. | 12,043 pregnant women exposed with PM2.5. Exposure cut-off of PM2.5 in I Q: Cut-off point of exposure not specified in study. | 75–95th percentile exposure of PM2.5 was related to TLBW (aOR 1.36, 95%CI: 1.03–1.79) |
| Hannam et al. (2014) [57] | 2004–2008 Northwest England, UK Pollutants: NOx, NO2, CO, PM2.5, PM10 | Retrospective study n = 203,562 | Number of exposed were not specified. Exposure cut-off of PM2.5 in II–IV Q: 24.3 ≥ 41.0 μg/m3. | Number of nonexposed were not specified. Exposure cut-off of PM2.5 in I Q: 10.3–19.7 μg/m3. | NOx, NO2, CO, PM2.5, PM10 is related with increased risk of SGA infant. Small statistically significant association was observed for PM10 and SGA, particularly with exposure in the first and third trimesters. Similar effects on SGA were also found for NO2, PM2.5, and CO in later pregnancy, but no overall increased risk was observed. |
| Vinikoor-Imler et al. (2014) [58] | 2003–2005 North Carolina, USA Pollutants: PM2.5 and O3 | Retrospective study n = 312,638 | Number of exposed were not specified. Exposure cut-off of PM2.5 in II–IV Q: Cut-off point of exposure not specified in study. | Number of nonexposed were not specified. Exposure cut-off of PM2.5 in I Q: Cut-off point of exposure not specified in study. | No associations were observed between PM2.5 exposure and SGA occurrence. |
| da Silva et al. (2014) [59] | 2004–2005 Mato Grosso, Brazil Pollutants: PM2.5 and CO | Retrospective study n = 6642 | Number of exposed were not specified. Exposure cut-off of PM2.5 in II–IV Q: Cut-off point of exposure not specified in study. | Number of nonexposed were not specified. Exposure cut-off of PM2.5 in I Q: Cut-off point of exposure not specified in study. | Second trimester exposure (IV Q) to PM2.5 (aOR 1.51, 95%CI: 1.04–2.17) is related to increased risk of TLBW. |
| Hyder et al. (2014) [60] | 2000–2006 Massachusetts, USA Pollutants: PM2.5 | Retrospective study n = 834,332 | Number of exposed were not specified. Exposure cut-off of PM2.5 in II–IV Q: 10.2–31.6 μg/m3. | Number of nonexposed were not specified. Exposure cut-off of PM2.5 in I Q: <10.2 μg/m3. | Exposure to PM2.5 is correlated with TLBW (aOR 1.08, 95%CI: 1.01–1.16) and SGA (aOR 1.08, 95%CI: 1.04–1.11). |
| Sathyanarayana et al. (2013) [63] | 1997–2005 Washington State, USA Pollutants: NO2, PM2.5 and proximity to major roads | Retrospective study n = 367,046 | Number of exposed were not specified. Exposure cut-off of PM2.5 in II–IV Q: 9.0–30.4 μg/m3. | Number of nonexposed were not specified. Exposure cut-off of PM2.5 in I Q: <9.0 μg/m3. | No associations were observed between PM2.5 exposure and SGA occurrence. |
| Salihu et al. (2012) [66] | 2000–2007 Tampa, Florida, USA Pollutants: PM2.5 and PM10, | Retrospective study n = 12,356 | 8791 pregnant women exposed with PM2.5, PM10 above the median. Exposure above the median: >10.97 μg/m3 PM2.5. | 3565 pregnant women exposed with PM2.5, PM10 below the median. Exposure below the median: <10.97 μg/m3 PM2.5. | Women exposed to air particulate pollutants were at elevated risk for TLBW (aOR 1.24, 95%CI: 1.07–1.43) and VLBW (aOR 1.58, 95%CI: 1.09–2.29). Exposure to PM2.5 was related to TLBW occurrence (aOR 1.15, 95%CI: 1.01–1.31). |
| Salihu et al. (2012) [67] | 2000–2007 Tampa, Florida, USA Pollutants: PM2.5 and PM10 | Retrospective study n = 103,961 | 24,090 pregnant women exposed with PM2.5, PM10 above the median. Exposure above the median: >11.28 μg/m3 PM2.5 | 79,871 pregnant women exposed with PM2.5, PM10 below the median. Exposure below the median: <11.28 μg/m3 PM2.5 | Exposed women had increased odds for low birth weight and very low birth weight, with the greatest risk being that for very low birth weight (aOR 1.27, 95%CI 1.08–1.49). Exposure to PM2.5 was related to TLBW occurrence (aOR 1.07, 95%CI: 1.01–1.12). Exposure to PM2.5 was related to SGA occurrence (aOR 1.06, 95%CI: 1.01–1.11). |
| Madsen et al. (2010) [71] | 1999–2002 Oslo, Norway Pollutants: NO2, PM10 and PM2.5 | Retrospective study n = 25,229 | 18,921 pregnant women exposed with NO2, PM10, PM2.5 II–IV Q. Exposure cut-off of PM2.5 in II–IV Q: >9.8 μg/m3. | 6308 pregnant women exposed with NO2, PM10, PM2.5 in I Q. Exposure cut-off of PM2.5 in I Q PM2.5: <9.7μg/m3. | No associations were observed between NO2, PM10, or PM2.5 exposure and SGA or TLBW occurrence. |
| Brauer et al. (2008) [74] | 1999–2002 Vancouver, Canada Pollutants: NO, NO2, PM2.5, O3, proximity to major roads | Retrospective study n = 70,249 | Number of exposed were not specified. Exposure cut-off of PM2.5 in II–IV Q: Cut-off point of exposure not specified in study. | Number of nonexposed were not specified. Exposure cut-off of PM2.5 in I Q PM2.5: Cut-off point of exposure not specified in study. | 50 m distance to highways is related to increased SGA occurrence (OR 1.26, 95%CI: 1.07–1.49) and TLBW (OR 1.11, 95%CI: 1.01–1.23). Exposure to NO, NO2, PM2.5 is correlated with SGA. |
| Study | Time and Place of Exposure Type of Pollutant | Character of the Study and Number of Included Patients | Outcomes | ||
|---|---|---|---|---|---|
| Study Group | Control Group | ||||
| Mitku et al. (2023) [24] | 2013–2017 Durban, South Africa Pollutants: PM2.5, SO2 and NOx (NO and NO2) | Retrospective study n = 656 from low socioeconomic neighbourhoods | Number of exposed were not specified. Exposure cut-offs of NOx in II–IV Q: Cut-off point of exposure not specified in study. | Number of nonexposed were not specified. Exposure cut-offs of NOx in I Q: Cut-off point of exposure not specified in study. | Paradoxically decreased level of SGA after NOx exposure was shown (aOR 0.9, 95%CI: 0.93–0.95). |
| Zhou et al. (2023) [26] | 2015–2020 Chongqing, China Pollutants: PM2.5, PM10, NO2, CO and O3 | Retrospective study n = 572,106 | Number of exposed were not specified. Exposure cut-offs of NOx in II–IV Q NO2: 35.5–68.2 μg/m3 | Number of nonexposed were not specified. Exposure cut-offs of NO2 in I Q: 10.8–35.5 μg/m3 | NO2 exposure is related to VLBW occurrence in the first (RR 1.11, 95%CI: 1.02–1.22), and second trimesters (RR 1.15, 95%CI: 1.04–1.27). |
| Gan et al. (2022) [28] | 2017–2018 Guangzhou, China Pollutants: PM2.5, NO2, SO2, O3, and PM10 | Prospective study n = 916 | Number of exposed were not specified. Exposure cut-offs of NO2 in II–IV Q: Cut-off point of exposure not specified in study. | Number of nonexposed were not specified. Exposure cut-offs of NO2 in I Q: Cut-off point of exposure not specified in study. | TLBW is associated with maternal exposure to SO2 and NO2 (OR1.26, 95%CI: 1.05–1.51). |
| Huang et al. (2022) [30] | 2015–2016 Wen Zhou, China Pollutants: PM2.5, PM10, SO2, NO2, and O3 | Retrospective study n = 213,959 | Number of exposed were not specified. Exposure cut-offs of NOx in II–IV Q: 40.1–52.9 μg/m3 | Number of nonexposed were not specified. Exposure cut-offs of NOx in I Q: <40.1 μg/m3 | TLBW is associated with maternal exposure to NO2 (aOR 1.13, 95%CI: 1.01–1.26) during the entire pregnancy. A significant influence was shown, especially in the 2nd trimester. |
| Shang et al. (2021) [36] | 2015–2018 Xi’an city of Shaanxi, China Pollutants: high level of air quality index (AQI), PM2.5, PM10, SO2, CO, O3, NO2 | Retrospective study n = 321,521 | Number of exposed were not specified. Exposure cut-offs of NO2 in II–IV Q: >45.9 μg/m3 | Number of nonexposed were not specified. Exposure cut-offs of NO2 in I Q: <45.9 μg/m3 | No associations were observed between NO2 exposure and TLBW occurrence. |
| Bergstra et al. (2021) [38] | 2012–2017 Netherlands Pollutants: PM10, NOx, SO2, and volatile organic compounds (VOC) | Cross-sectional study n = 4488 | Number of exposed were not specified. Exposure cut-offs of NOx in II–IV Q: 1.65–9.50 μg/m3 | Number of nonexposed were not specified. Exposure cut-offs of NOx in I Q: 0.49–1.65 μg/m3 | TLBW is associated with maternal exposure to NOx (OR 1.20, 95%CI: 1.06–1.35). |
| Nobles et al. (2019) [43] | 2002–2010 20 hospitals in USA Pollutants: SO2, O3, NOx, NO2, CO, PM10 and PM2.5 | Retrospective study n = 109,126 births | Number of exposed were not specified. Exposure cut-offs of NO2, and NOx in II–IV Q:Cut-off point of exposure not specified in study. | Number of nonexposed were not specified. Exposure cut-offs of NO2, and NOx in I Q: Cut-off point of exposure not specified in study. | Risk of SGA increases in the third trimester every 10th percentile per interquartile increase in exposure of: NOx (RR 1.08, 95%CI:1.03–1.14) NO2 (RR 1.05, 95%CI: 1.01–1.10). |
| Dedele et al. (2017) [48] | 2008 Kaunas, Lithuania Pollutant: NO2 | Retrospective study n = 3292 | 2146 pregnant women exposed with NO2. Exposure cut-offs of NO2 in II–III Tertiles (T) II T 20–24 μg/m3 III T >24 μg/m3 | 1146 pregnant women nonexposed with NO2. Exposure cut-off of NO2 in I T <19 μg/m3 | Increased maternal exposure (III T) to NO2 tended to increase the risk for TLBW (aOR 1.89, 95%CI: 1.05–3.43). |
| Capobussi et al. (2016) [49] | 2005–2012 Como, Italy Pollutants: NOx, NO2, SO2, O3, CO and PM10 | Retrospective study n = 27,128 | Number of exposed were not specified. Exposure cut-offs of NO2, and NOx in II–IV Q: Cut-off point of exposure not specified in study. | Number of nonexposed were not specified. Exposure cut-offs of NO2, and NOx in I Q: Cut-off point of exposure not specified in study. | Women exposed to NOx in the third trimester had a higher risk having a SGA baby (aOR 1.12, 95%CI 1.01–1.27) |
| Stieb et al. (2016) [50] | 1999–2008 Canada Pollutants: PM2.5 and NO2 | Retrospective study n = 2,928,515 | Number of exposed were not specified. Exposure cut-offs of NO2 II–IV Q: 7.00 ≥ 18.52 μg/m3. | Number of nonexposed were not specified. Exposure cut-offs of NO2 in I Q: <7.00 μg/m3. | SGA occurrence is related to every 20 ppb NO2 exposure (OR 1.04, 95%CI: 1.02–1.06) and TLBW related to every 20 ppb NO2 exposure in 16.2 g reduction, 95%CI: 13.6–18.8 g. |
| Lavigne et al. (2016) [52] | 2005–2012 Ontario, Canada Pollutants: PM2.5, NO2, and O3 | Retrospective study n = 818,400 | Number of exposed were not specified. Exposure cut-offs of >5 percentile of NO2 (>6 ppb) | Number of nonexposed were not specified. Exposure cut-offs of ≤5 percentile of NO2 (≤6 ppb) | No associations were observed between PM2.5, NO2, or O3 exposure and SGA or TLBW occurrence. |
| Hannam et al. (2014) [57] | 2004–2008 Northwest England, UK Pollutants: NOx, NO2, CO, PM2.5 and PM10 | Retrospective study n = 203,562 | Number of exposed were not specified. Exposure cut-offs of NO2, and NOx in II–IV Q: II–IV Q NOx (96.0 ≥ 225.9 μg/m3) II–IV Q NO2 (63.6 ≥ 169.7 μg/m3) | Number of nonexposed were not specified. Exposure cut-offs of NO2, and NOx in I Q: I Q NOx (13.0–55.4 μg/m3) I Q NO2 (8.6–42.9 μg/m3) | NOx, NO2, CO, PM2.5, PM10 is related with increased risk of SGA infant. Small statistically significant association was observed for PM10 and SGA, particularly with exposure in the first and third trimesters. Similar effects on SGA were also found for NO2 (aOR 1.66, 95%CI: 1.47–1.87) in later pregnancy, but no overall increased risk was observed. |
| Olsson et al. (2013) [62] | 1997–2006 Stockholm, Sweden Pollutants: O3 and NOx | Retrospective study n = 120,755 | Number of nonexposed were not specified. Exposure cut-offs of NOx in II–IV Q: Cut-off point of exposure not specified in study. | Number of nonexposed were not specified. Exposure cut-offs of NOx in I Q: Cut-off point of exposure not specified in study. | No associations were observed between O3 or NOx exposure and SGA or TLBW occurrence. |
| Sathyanarayana et al. (2013) [63] | 1997–2005 Washington State, USA Pollutants: NO2, PM2.5 and proximity to major roads | Retrospective study n = 367,046 | Number of exposed were not specified. Exposure cut-offs of NO2 in II–IV Q: 12.4–36.8 μg/m3 | Number of nonexposed were not specified. Exposure cut-offs of NO2 in I Q: <12.4 μg/m3 | SGA births with increasing quartile of first trimester NO2 exposure in: II Q (OR 1.01, 95%CI: 0.97–1.04), III Q (OR 1.06, 95%CI: 1.03–1.10), and IV Q (OR 1.08, 95%CI: 1.04–1.12). No associations were observed between PM2.5 exposure and SGA occurrence. |
| Le et al. (2012) [64] | 1990–2001 Detroit, Michigan, USA Pollutants: CO, NO2, PM10 and O3 | Retrospective study n = 164,905 | Number of exposed were not specified. Exposure cut-offs of NOx in II–IV Q: >6.8 ppb | Number of nonexposed were not specified. Exposure cut-offs of NOx in I Q: <6.8 ppb | SGA was associated with exposure of NO2 (aOR 1.11, 95%CI: 1.03–1.21) in first month. |
| van den Hooven et al. (2012) [65] | 2001–2005 Rotterdam, Netherlands Pollutants: PM10 and NO2 | Prospective study n = 7772 | 6928 pregnant women exposed with NO2. Quartiles of exposure cut-offs in II–IV Q: II–IV Q NO2 (37.2–56.9 μg/m3) | 844 pregnant women exposed with NO2. Quartiles of exposure cut-offs in I Q: I Q NO2 (<37.2 μg/m3) | No associations were observed between NO2 exposure and SGA or TLBW occurrence. |
| Malmqvist et al. (2011) [68] | 1999–2005 Scania (Skåne), Sweden Pollutant: NOx | Retrospective study n = 81,110 | 60,530 pregnant women exposed with NOx in II–IV Q. Exposure cut-offs of NOx in: II Q (9.0–14.1 μg/m3) III Q (14.2–22.6 μg/m3) IV Q (>22.7 μg/m3) | 20,580 pregnant women exposed with NOx in I Q. Exposure cut-offs of NOx in I Q: 2.5–8.9 μg/m3 | NOx exposure is related with SGA (I vs. IV) (OR 1.12, 95%CI: 1.01–1.24) |
| Kashima et al. (2011) [69] | 1997–2008 Shizuoka, Japan Pollutants: distance to a major road, distance-weighted traffic density (DWTD) and NO2 | Retrospective study n = 14,204 | Number of exposed were not specified. Exposure to a distance to a major road (<200 m), DWTD and mean NO2 concentration across roadside stations 51.8 ± 7.5 μg/m3 Exposure cut-offs in NO2 in II–IV Q: First 3 months (12.2–34.7 μg/m3) Last 3 months (12.0–35.7 μg/m3) | Number of nonexposed were not specified. Exposure to a distance to a major road (≥200 m), DWTD and mean NO2 concentration across general stations 30.09 ± 6.2 μg/m3 Exposure cut-off in I Q NO2: First 3 months (8.7–12.2 μg/m3) Last 3 months (6.3–12.0 μg/m3) | 0.6 g (95%CI: −1.8–0.6 g) birth weight reduction is following to every 500 m decrease of the distance to a major road with breakpoint at 2200 m distance and the higher SGA occurrence by distance ≤ 624 m. No associations were observed between NO2 exposure and SGA or TLBW occurrence. |
| Gehring et al. (2011) [70] | 2003–2004 Amsterdam, Netherlands Pollutants: NO2, proximity to major roads (<50 m) | Prospective study n = 7762 | Number of exposed were not specified. Exposure cut-offs of NOx in: II Q NO2 (34.6–37.4 μg/m3) III Q NO2 (37.4–40.2 μg/m3) IV Q NO2 (>40.2 μg/m3) | Number of nonexposed were not specified. Exposure cut-offs of NOx in I Q: <34.6 μg/m3 | No associations were observed between NO2 exposure and SGA or TLBW occurrence. |
| Madsen et al. (2010) [71] | 1999–2002 Oslo, NorwayPollutants: NO2, PM10, and PM2.5 | Retrospective study n = 25,229 | 18,921 pregnant women exposed with NO2, PM10, PM2.5 II–IV Q. Exposure cut-offs of NO2 in II–IV Q: >20.4 μg/m3 | 6308 pregnant women exposed with NO2, PM10, PM2.5 in I Q. Exposure cut-offs of NO2 in I O: <20.3 μg/m3 | No associations were observed between NO2, PM10, or PM2.5 exposure and SGA or TLBW occurrence. |
| Ballester et al. (2010) [72] | 2003–2005 Valencia, Spain Pollutants: NO2 | Retrospective study n = 785 | Number of exposed were not specified. Exposure cut-offs of NO2 in II–IV Q: >27.3 μg/m3 | Number of nonexposed were not specified. Exposure cut-offs of NO2 in I O: <27.3 μg/m3 | 10 μg/m3 increase in NO2 exposure in the second trimester is related with SGA (OR 1.37, 95%CI: 1.01–1.85). >40 μg/m3 NO2 exposure in the first trimester was associated with a change in birth weight of −40.3 g, 95%CI: −96.3–15.6 g). |
| Brauer et al. (2008) [74] | 1999–2002 Vancouver, Canada Pollutants: NO, NO2, PM2.5, O3 and proximity to major roads | Retrospective study n = 70,249 | Number of exposed were not specified. Exposure cut-offs of NO, and NO2, in II–IV Q:Cut-off point of exposure not specified in study. | Number of nonexposed were not specified. Exposure cut-offs of NO, and NO2, in I Q: Cut-off point of exposure not specified in study. | 50 m distance to highways is related to increased SGA occurrence (OR 1.26, 95%CI: 1.07–1.49) and TLBW (OR 1.11, 95%CI: 1.01–1.23). Exposure to NO, NO2, PM2.5 is correlated with SGA. 10 μg/m3 increase of NO exposure is related with 5 % increased SGA occurrence (OR 1.05, 95%CI: 1.03–1.08). |
| Hansen et al. (2007) [75] | 2000–2003 Brisbane, Australia Pollutants: PM10, NO2 and O3 | Retrospective study n = 26,617 | Number of exposed were not specified. Exposure cut-offs of NO2 in II–IV Q: 5.5–24.2 ppb | Number of nonexposed were not specified. Exposure cut-offs of NO2 in I Q: <5.5 ppb | No associations were observed between PM10, NO2, or O3 exposure and SGA or TLBW occurrence. |
| Lin et al. (2004) [79] | 1995–1997 Taipei and Kaohsiung, Taiwan Pollutants: SO2, PM10, CO, O3 and NO2 | Retrospective study n = 31,530 (Kaohsiung) n = 60,758 (Taipei) | 31,530 pregnant women from Kaohsiung exposed with mean concentration of NO2 was similar in both groups. | 60,758 pregnant women from Taipei exposed with mean concentration of NO2 was similar in both groups. | Exposure with NO2 was similar in both groups. |
| Lin et al. (2004) [80] | 1995–1997 Taipei and Kaohsiung, Taiwan Pollutants: SO2, PM10, CO, O3 and NO2 | Retrospective study n = 92,288 | Number of exposed were not specified. Exposure cut-offs of NO2 in II–IV Q: >26.1 ppm | Number of nonexposed were not specified. Exposure cut-offs of NO2 in I Q: <26.1 ppm | No associations were observed between PM10, CO, O3, or NO2 exposure and TLBW occurrence. |
| Lee et al. (2003) [81] | 1996–1998 Seoul, Korea Pollutants: CO, PM10, SO2 and NO2 | Retrospective study n = 388,105 | Number of exposed were not specified. Exposure cut-offs of NO2 in II–IV Q: 25.0–65.1 ppb | Number of nonexposed were not specified. Exposure cut-offs of NO2 in I Q: 10.2–25.0 ppb | Second-trimester exposure to NO2 increased the risk for TLBW (aOR 1.03, 95%CI: 1.01–1.06). CO, PM10, SO2 and NO2 during 1–2 trimesters is related with TLBW. |
| Lin et al. (2001) [86] | 1993–1996 Lin-Yuan and Taicei, Taiwan Pollutants: SO2, NO2, PM10, SO42−, NH4+ and NO3− | Retrospective study n = 2545 | 1677 pregnant women from Lin-Yuan municipality. Exposure cut-offs in II–IV Q: NO2 (12.1 ± 2.2 ppb), NO3− (124.7 ± 1.9 nmol/m3) | 868 pregnant women from Taicei municipality. Exposure cut-offs in I Q: NO2 (8.6 ± 1.4 ppb), NO3− (103.9 ± 2.0 nmol/m3) | Higher exposure of SO2, NO2, PM10, SO42−, NO3−, petrochemical municipality in Lin-Yuan leads to 3.22% TLBW occurrence in comparison to lower exposure in control municipality Taicei which lead to 1.84% TLBW occurrence. |
| Study | Time and Place of Exposure Type of Pollutant | Character of the Study and Number of Included Patients | Outcomes | ||
|---|---|---|---|---|---|
| Study Group | Control Group | ||||
| Zhou et al. (2023) [26] | 2015–2020 Chongqing, China Pollutants: PM2.5, PM10, NO2, CO and O3 | Retrospective study n = 572,106 | Number of exposed were not specified. Ex Exposure cut-offs of O3 in II–IV Q: 30.2–105.7 μg/m3 | Number of nonexposed were not specified. Exposure cut-offs of O3 in I Q: 8.3–30.2 μg/m3 | O3 exposure is related with VLBW occurrence in the entire pregnancy (RR 1.08, 95%CI: 1.01–1.15), and in the second trimester (RR 1.08, 95%CI: 1:02–1.14). |
| Gan et al. (2022) [28] | 2017–2018 Guangzhou, China Pollutants: PM2.5, NO2, SO2, O3, and PM10 | Prospective study n = 916 | Number of exposed were not specified. Exposure cut-offs of O3 in II–IV Q: Cut-off point of exposure not specified in study. | Number of nonexposed were not specified. Exposure cut-offs of O3 in I Q: Cut-off point of exposure not specified in study. | TLBW is associated with maternal exposure to SO2 and O3 (OR 1.24, 95%CI: 1.05–1.48). |
| Huang et al. (2022) [30] | 2015–2016 Wen Zhou, China Pollutants: PM2.5, PM10, SO2, NO2, and O3 | Retrospective study n = 213,959 | Number of exposed were not specified. Exposure cut-offs of O3 in II–IV Q: 83.6–102.4 μg/m3 | Number of nonexposed were not specified. Exposure cut-offs of O3 in I Q: <83.6 μg/m3 | No associations were observed between O3 exposure and TLBW occurrence. Moreover, O3 seems to have positive impact on Macrosomia occurrence. |
| Shang et al. (2021) [36] | 2015–2018 Xi’an city of Shaanxi, China Pollutants: high level of air quality index (AQI), PM2.5, PM10, SO2, CO, O3 and NO2 | Retrospective study n = 321,521 | Number of exposed were not specified. Exposure cut-offs of O3 in II–IV Q: >43.6 μg/m3 | Number of nonexposed were not specified. Exposure cut-offs of O3 in I Q: <43.6 μg/m3 | Exposure of O3 is associated with increased term birth weight (β 4.15, 95%CI: 3.49–4.81) and macrosomia (OR 1.02, 95%CI: 1.017–1.03). |
| Wang et al. (2021) [37] | 2015–2017 Guangzhou, China Pollutant: O3 | Retrospective study n = 444,096 | Number of exposed were not specified. Exposure with 1-h maximum O3 lever within a day 84.5–112.9 μg/m3 | Number of nonexposed were not specified. Exposure with 8-h maximum O3 lever within a 73–90 μg/m3 | Maximal 1 h exposure to higher level of during O3 the whole pregnancy (aOR 1.3, 95%CI: 1.06–1.58), especially in second trimester (aOR 1.21, 95%CI: 1.07–1.36) and maximal 8 h exposure to slightly lower level of O3 (aOR 1.24, 95%CI: 1.01–1.52), and in second trimester (aOR 1.17, 95%CI: 1.03–1.33) are associated with higher risk of TLBW. |
| Nobles et al. (2019) [43] | 2002–2010 20 hospitals in USA Pollutants: SO2, O3, NOx, NO2, CO, PM10 and PM2.5 | Retrospective study n = 109,126 births | Number of exposed were not specified. Exposure cut-offs of O3 in II–IV Q: Cut-off point of exposure not specified in study. | Number of nonexposed were not specified. Exposure cut-offs of O3 in I Q: Cut-off point of exposure not specified in study. | O3 exposure in the third trimester is associated with a lower risk of SGA (RR 0.95, 95%CI: 0.92–0.97). |
| Costa Nascimento et al. (2017) [47] | 2012–2013 São José do Rio Preto, Brazil Pollutants: NO2, PM10 and O3 | Retrospective longitudinal study n = 8948 | Number of exposed were not specified. Exposure cut-offs of O3 in II–IV Q: 52.36–81.98 μg/m3 | Number of nonexposed were not specified. Exposure cut-offs of O3 in I Q: <52.36 μg/m3 | Exposure to O3 was significantly associated with TLBW after 90 days of exposure (aOR = 1.48, 95%CI: 1.10–2.0) and after 30 days of exposure (aOR 1.38, 95%CI: 1.03–1.84). |
| Lavigne et al. (2016) [52] | 2005–2012 Ontario, Canada Pollutants: PM2.5, NO2, and O3 | Retrospective study n = 818,400 | Number of exposed were not specified. Exposure cut-offs of >5 percentile of O3 (>23 ppb) | Number of nonexposed were not specified. Exposure cut-offs of ≤5 percentile of O3 (≤23 ppb) | No associations were observed between PM2.5, NO2, or O3 exposure and SGA or TLBW occurrence. |
| Brown et al. (2015) [53] | 2001–2006 New York, USA Pollutants: O3 and PM2.5 | Retrospective study n = 480,430 | Number of exposed were not specified. Exposure cut-offs of O3 in II–IV Q: 35.62–60.35 ppb | Number of exposed were not specified. Exposure cut-offs of O3 in I Q: 15.52–35.61 ppb | There was paradoxical effect of decreased SGA occurrence after exposure of III Q of O3 (aOR 0.86, 95%CI: 0.81–0.92). |
| Vinikoor-Imler et al. (2014) [58] | 2003–2005 North Carolina, USA Pollutants: PM2.5 and O3 | Retrospective study n = 312,638 | Number of exposed were not specified. Exposure cut-offs of O3 in II–IV Q: Cut-off point of exposure not specified in study. | Number of nonexposed were not specified. Exposure cut-offs of O3 in I Q: Cut-off point of exposure not specified in study. | Exposure to O3 is correlated with SGA (aOR 1.16, 95%CI: 1.11–1.22) and TLBW (aOR 2.03, 95%CI: 1.80–2.30). |
| Olsson et al. (2013) [62] | 1997–2006 Stockholm, Sweden Pollutants: O3 and NOx | Retrospective study n = 120,755 | Number of exposed were not specified. Exposure cut-offs of O3 in II–IV Q: Cut-off point of exposure not specified in study. | Number of nonexposed were not specified. Exposure cut-offs of O3 in I Q: Cut-off point of exposure not specified in study. | No associations were observed between O3 or NOx exposure and SGA or TLBW occurrence. |
| Le et al. (2012) [64] | 1990–2001 Detroit, Michigan, USA Pollutants: CO, NO2, PM10 and O3 | Retrospective study n = 164,905 | Number of exposed were not specified. Exposure cut-offs of O3 in II–IV Q: >92 ppb O3 | Number of nonexposed were not specified. Exposure cut-offs of O3 in I Q: <92 ppb | SGA was associated with exposure to O3 in third trimester (aOR 1.11, 95%CI: 1.02–1.20). |
| Nascimento and Moreira (2009) [73] | 2001 São José dos Campos, Brazil Pollutants: SO2, O3 and PM10 | Retrospective study n = 2529 | Number of exposed were not specified. Exposure cut-offs of O3 in II–IV Q: Cut-off point of exposure not specified in study. | Number of nonexposed were not specified. Exposure cut-offs of O3 in I Q: Cut-off point of exposure not specified in study. | O3 showed borderline statistical significance in third quartile, with an increase of nearly 100% in the odds of TLBW (aOR 1.26, 95%CI: 1.00–1.58). |
| Brauer et al. (2008) [74] | 1999–2002 Vancouver, Canada Pollutants: NO, NO2, PM2.5, O3 and proximity to major roads | Retrospective study n = 70,249 | Number of exposed were not specified. Exposure cut-offs of O3 in II–IV Q: Cut-off point of exposure not specified in study. | Number of nonexposed were not specified. Exposure cut-offs of O3 in I Q: Cut-off point of exposure not specified in study. | 50 m distance to highways is related to increased SGA occurrence (OR 1.26, 95%CI: 1.07–1.49) and TLBW (OR 1.11, 95%CI: 1.01–1.23). No associations were observed between O3 exposure and SGA occurrence was shown. |
| Hansen et al. (2007) [75] | 2000–2003 Brisbane, Australia Pollutants: PM10, NO2 and O3 | Retrospective study n = 26,617 | Number of exposed were not specified. Exposure cut-offs of O3 in II–IV Q: 21.0–61.1 ppb | Number of nonexposed were not specified. Exposure cut-offs of O3 in I Q: <21.0 ppb | No associations were observed between O3 exposure and SGA or TLBW occurrence. |
| Lin et al. (2004) [79] | 1995–1997 Taipei and Kaohsiung, Taiwan Pollutants: SO2, PM10, CO, O3 and NO2 | Retrospective study n = 31,530 (Kaohsiung) n = 60,758 (Taipei) | 31,530 pregnant women from Kaohsiung exposed with mean concentration of O3 (29.4–49.5 ppm) | 60,758 pregnant women from Taipei exposed with mean concentration of O3 (14.1–20.4 ppm) | Higher exposure of SO2, PM10, CO, O3, NO2 in Kaohsiung leads to 13% higher TLBW occurrence than lower exposure in Taipei (OR 1.13, 95%CI: 1.03–1.24). |
| Lin et al. (2004) [80] | 1995–1997 Taipei and Kaohsiung, Taiwan Pollutants: SO2, PM10, CO, O3 and NO2 | Retrospective study n = 92,288 | Number of exposed were not specified. Exposure cut-offs of O3 in II–IV Q: >19.6 ppm | Number of nonexposed were not specified. Exposure cut-offs of O3 in I Q: <19.6 ppm | No associations were observed between PM10, CO, O3, or NO2 exposure and TLBW occurrence. |
| Chen et al. (2002) [84] | 1991–1999 Nevada State, USA Pollutants: PM10, CO and O3 | Retrospective study n = 39,338 | 32,682 pregnant women exposed with O3 at the third trimester (>17.93 ppb) | 3623 pregnant women with low exposure to O3 at the third trimester (<17.93 ppb) | O3 exposure was found not to be related to birth weight. |
| Study | Time and Place of Exposure Type of Pollutant | Character of the Study and Number of Included Patients | Outcomes | ||
|---|---|---|---|---|---|
| Study Group | Control Group | ||||
| Mitku et al. (2023) [24] | 2013–2017 Durban, South Africa Pollutants: PM2.5, SO2 and NOx (NO and NO2) | Retrospective study n = 656 from low socioeconomic neighbourhoods | Number of exposed were not specified. Exposure with SO2 in II–IV Q: Cut-off point of exposure not specified in study. | Number of nonexposed were not specified. Exposure with PM2.5, SO2 and NOx in I Q: Cut-off point of exposure not specified in study. | Increased SGA occurrence risk is associated with exposure to SO2 (aOR 1.1, 95%CI: 1.01–1.13). |
| Zhang et al. (2023) [25] | 2017–2021 Wuhan, China Pollutants: Air Pollution Score (APS)–6 pollutants assessed simultaneously (PM2.5, PM10, NO2, CO, O3 and SO2) | Retrospective study n = 31,283 | Number of exposed were not specified. Exposure with APS in II-V Quintile. Cut-off point of exposure not specified in study. | Number of nonexposed were not specified. Exposure with APS in I Quintile. Cut-off point of exposure not specified in study. | APS exposure in second trimester is related to SGA (OR 1.43, 95%CI: 1.23–1.65) and during the entire pregnancy (OR 1.35, 95%CI: 1.16–1.56). APS exposure increased 2.5% risk of SGA for each 10 μg/m3 elevated (aOR 1.025, 95%CI: 1.005–1.046). |
| Zhou et al. (2023) [26] | 2015–2020 Chongqing, China Pollutants: PM2.5, PM10, NO2, CO, SO2 and O3 | Retrospective study n = 572,106 | Number of exposed were not specified. Exposure with CO and SO2 in II–IV Q: II–IV Q CO (0.89–1.52 mg/m3) II–IV Q SO2 (7.3–22.1 μg/m3) | Number of nonexposed were not specified. Exposure with CO and SO2 in I Q: I Q CO (0.54–0.89 mg/m3) I Q SO2 (3.2–7.3 μg/m3) | No association between CO and SO2 and SGA or LBTW was shown. |
| Gan et al. (2022) [28] | 2017–2018 Guangzhou, China Pollutants: PM2.5, NO2, SO2, O3, and PM10 | Prospective study n = 916 | Number of exposed were not specified. Exposure with SO2 in II–IV Q: Cut-off point of exposure not specified in study. | Number of nonexposed were not specified. Exposure with SO2 in I Q: Cut-off point of exposure not specified in study. | TLBW is associated with maternal exposure to: SO2 and NO2 (OR1.26, 95%CI: 1.05–1.51) SO2 and O3 (OR 1.24, 95%CI: 1.05–1.48) SO2 and PM2.5 (OR 1.28, 95%CI: 1.07–1.52) SO2 and PM10 (OR 1.23, 95%CI: 1.03–1.46) |
| Gong and Zhan (2022) [29] | 1996–2008 Texas, USA Pollutants: benzaldehyde, sum of Photochemical Assessment Monitoring Stations (PAMS) target compounds, n-undecane, m-tolualdehyde, organic carbon fraction 2 (OC2), ethylene dibromide, valeraldehyde, propionaldehyde, 4-methyl-1-pentene, and zirconium | Retrospective study n = 470,684 | Exposure cut-offs of: Benzaldehyde > 0.04 ppbv (n = 187) Sum of PAMS target compounds > 151.11 ppbC (n = 155) n-Undecane > 0.01 ppbv (n = 250) m-Tolualdehyde > 0.01 ppbv (n = 181) OC2 >0.83 μg/m3 (n = 235) Ethylene dibromide > 0.00 ppbv (n = 84) Valeraldehyde > 0.03 ppbv (n = 206) Propionaldehyde > 0.17 ppbv (n = 173) 4-Methyl-1-Pentene > 0.00 ppbv (n = 400) Zirconium PM2.5 LC > 0.00 µg/m3 (n= 220) | Exposure cut-offs of: Benzaldehyde 0.04 < ppbv (n = 162) Sum of PAMS target compounds < 151.11 ppbC (n = 134) n-Undecane < 0.01 ppbv (n = 240) m-Tolualdehyde < 0.01 ppbv (n = 161) OC2 0.83 μg/m3 (n = 208) Ethylene dibromide = 0.00 ppbv (n = 1684) Valeraldehyde < 0.03 ppbv (n = 191) Propionaldehyde < 0.17 ppbv (n = 159) 4-Methyl-1-Pentene = 0.00 ppbv (n = 2027) Zirconium PM2.5 LC = 0.00 µg/m3 (n = 203) | TLBW is associated with maternal exposure to: Benzaldehyde (aOR 2.66, 95%CI: 1.38–5.12) Sum of PAMS target compounds (aOR 2.02, 95%CI: 1.08–3.78) n-Undecane (aOR 2.04, 95%CI: 1.22–3.40) m-Tolualdehyde (aOR 2.02, 95%CI: 1.05–3.89) OC2 (aOR 1.98, 95%CI: 1.21–3.26) Valeraldehyde (aOR 1.96, 95%CI: 1.14–3.38) Propionaldehyde (aOR 1.92, 95%CI: 1.01–3.65) Ethylene dibromide (aOR 1.97, 95%CI: 1.24–3.15) 4-Methyl-1-Pentene (aOR 1.44, 95%CI: 1.14–1.82) Zirconium PM2.5 LC (aOR 1.88, 95%CI: 1.02–3.45) |
| Huang et al. (2022) [30] | 2015–2016 Wen Zhou, China Pollutants: PM2.5, PM10, SO2, NO2, and O3 | Retrospective study n = 213,959 | Number of exposed were not specified. Exposure with SO2 in II–IV Q: 13.3–19.3 μg/m3 | Number of nonexposed were not specified. Exposure with SO2 in I Q: <13.3 μg/m3 | TLBW is associated with maternal exposure to SO2 during the entire pregnancy (aOR 1.32, 95%CI: 1.07–1.64). The significant influence was shown especially in the 2nd trimester. |
| Shen et al. (2022) [32] | 2015–2016 24 provinces in China Pollutants: PM2.5, CO, NH4+ (ammonium), and SO42− (sulphate) | Retrospective study n = 70,206 | Number of exposed were not specified. Exposure cut-offs of II–IV Q: CO (8–31 μg/m3) NH4+ (7–16 μg/m3) SO42− (12–24 μg/m3) | Number of nonexposed were not specified. Exposure cut-offs of I Q: CO (<8 μg/m3) NH4+ (<7 μg/m3) SO42− (<12 μg/m3) | PM2.5 exposure during pregnancy is associated with 16%, 95%CI: 3–30% higher risk of SGA. SGA is also associated with maternal exposure to: CO (OR 1.15, 95%CI: 1.00–1.32), NH4+ (OR 1.12, 95%CI: 1.01–1.25), and SO42− (OR 1.12, 95%CI: 1.04–1.21) |
| Shang et al. (2021) [36] | 2015–2018 Xi’an city of Shaanxi, China, Pollutants: high level of air quality index (AQI), PM2.5, PM10, SO2, CO, O3 and NO2 | Retrospective study n = 321,521 | Number of exposed were not specified. Exposure cut-offs of II–IV Q: II–IV Q AQI (>66.2) II–IV Q SO2 (>11.1 μg/m3) II–IV Q CO (>1.3 μg/m3) | Number of nonexposed were not specified. Exposure cut-offs of I Q: I Q AQI (<66.2) I Q SO2 (<11.1 μg/m3) I Q CO (<1.3 μg/m3) | TLBW is associated with maternal exposure to: AQI (OR 1.02, 95%CI: 1.006–1.03) SO2 (OR 1.03, 95%CI: 1.01–1.06) CO (OR 1.007, 95%CI: 1.001–1.014). |
| Bergstra et al. (2021) [38] | 2012–2017 Netherlands Pollutants: PM10, NOx, SO2, and volatile organic compounds (VOC) | Cross-sectional study n = 4488 | Number of exposed were not specified. Exposure cut-offs of II–IV Q: SO2 (0.63–2.33 μg/m3) VOC (1.31–9.04 μg/m3) | Number of nonexposed were not specified. Exposure cut-offs of I Q: SO2 (0.21–0.63 μg/m3) VOC (0.34–1.31 μg/m3) | TLBW is associated with maternal exposure to SO2 (OR 1.20, 95%CI: 1.0–1.43) and VOC (OR 1.21, 95%CI: 1.08–1.35). |
| Nobles et al. (2019) [43] | 2002–2010 20 hospitals in USA Pollutants: SO2, O3, NOx, NO2, CO, PM10 and PM2.5 | Retrospective study n = 109,126 births | Number of exposed were not specified. Exposure with CO and SO2 in II–IV Q: Cut-off point of exposure not specified in study. | Number of nonexposed were not specified. Exposure with CO and SO2 in I Q: Cut-off point of exposure not specified in study. | Risk of SGA increases in the third trimester every 10th percentile per interquartile increase in exposure of CO (RR 1.05, 95%CI 1.00, 1.10). |
| Gong et al. (2018) [45] | 1996–2008 Texas, USA Pollutants: Multiple VOC (benzene, benzo(g,h,i)perylene, cumene, cyclohexane, dichloromethane, ethylbenzene, ethylene, naphthalene, n-hexane, propylene, styrene, toluene), zinc and mercury | Retrospective study n = 470,530 | Number of exposed were not specified. Pregnant women in “low”, “medium” and “high” exposure group to pollution—defined by authors. | Number of nonexposed were not specified. Pregnant women in “zero” exposure group to pollution—defined by authors. | TLBW is associated with maternal exposure to: benzene (aOR 1.06, 95%CI: 1.04–1.08), benzo(g,h,i)perylene (aOR 1.04, 95%CI: 1.02–1.07), cumene (aOR 1.05, 95%CI: 1.03–1.07), cyclohexane (aOR 1.04, 95%CI: 1.02–1.07), dichloromethane (aOR 1.04, 95%CI: 1.03–1.07), ethylbenzene (aOR 1.05, 95%CI: 1.03–1.06), ethylene (aOR 1.06, 95%CI: 1.03–1.09), naphthalene (aOR 1.03, 95%CI: 1.01–1.05), n-hexane (aOR 1.06, 95%CI: 1.04–1.08), propylene (aOR 1.06, 95%CI: 1.03–1.10), styrene (aOR 1.06, 95%CI: 1.04–1.08), toluene (aOR 1.05, 95%CI: 1.03–1.07), mercury (aOR 1.04, 95%CI: 1.02–1.07), zinc (fume or dust) (aOR 1.10, 95%CI: 1.06–1.13) |
| Wu (2018) [46] | 2013–2016 Jinan, China Pollutants: PM2.5, NO2 and SO2 | Retrospective study n = 43,855 | Number of exposed were not specified. Exposure cut-offs of SO2 in II–IV Q: 42.6–148.0 μg/m3 | Number of nonexposed were not specified. Exposure cut-offs of SO2 in I Q: <42.5 μg/m3 | No association of SO2 exposure and SGA or TLBW was shown. |
| Capobussi et al. (2016) [49] | 2005–2012 Como, Italy Pollutants: NOx, NO2, SO2, O3, CO and PM10 | Retrospective study n = 27,128 | Number of exposed were not specified. Exposure cut-offs of CO and SO2 in II–IV Q: Cut-off point of exposure not specified in study. | Number of nonexposed were not specified. Exposure cut-offs of CO and SO2 in I Q: Cut-off point of exposure not specified in study. | No association of CO or SO2 exposure and SGA or TLBW was shown. |
| Poirier et al. (2015) [54] | 2008–2012 Nova Scotia, Canada Pollutants: NO2, SO2, PM2.5 and PM10 | Retrospective study n = 13,400 births in NO2, PM2.5 PM10, benzene, toluene group n = 12,834 births in SO2 group | Number of exposed were not specified. Exposure cut-offs of SO2 in II–IV Q: Cut-off point of exposure not specified in study. | Number of nonexposed were not specified. Exposure cut-offs of SO2 in I Q: Cut-off point of exposure not specified in study. | Compared with women in the I quartile of exposure to SO2, those in the IV quartile of exposure were positively associated with TLBW (aOR 1.52, 95%CI: 1.03, 2.26). |
| Hannam et al. (2014) [57] | 2004–2008 Northwest England, UK Pollutants: NOx, NO2, CO, PM2.5 and PM10 | Retrospective study n = 203,562 | Number of exposed were not specified. Exposure cut-offs of CO in II–IV Q: 0.8–1.3 μg/m3 | Number of nonexposed were not specified. Exposure cut-offs of CO in I Q: 0.2–0.4μg/m3 | NOx, NO2, CO, PM2.5, PM10 is related with increased risk of SGA infant. Small statistically significant association was observed for PM10 and SGA, particularly with exposure in the first and third trimesters. Similar effects on SGA were also found for NO2, PM2.5, and CO in later pregnancy, but no overall increased risk was observed. |
| da Silva et al. (2014) [59] | 2004–2005 Mato Grosso, Brazil Pollutants: PM2.5 and CO | Retrospective study n = 6642 | Number of exposed were not specified. Exposure with CO in II–IV Q: Cut-off point of exposure not specified in study. | Number of nonexposed were not specified. Exposure with CO in I Q: Cut-off point of exposure not specified in study. | Second trimester exposure (IV Q) to CO (aOR 1.49, 95%CI: 1.03–2.14) is related to increased risk of TLBW. |
| Le et al. (2012) [64] | 1990–2001 Detroit, Michigan, USA Pollutants: CO, NO2, PM10 and O3 | Retrospective study n = 164,905 | Number of exposed were not specified. Exposure cut-offs of CO in II–IV Q: >0.75 ppm | Number of nonexposed were not specified. Exposure cut-offs of CO in I Q: <0.75 ppm | SGA was associated with CO exposure (aOR 1.14, 95%CI 1.02–1.27). |
| Nascimento and Moreira (2009) [73] | 2001 São José dos Campos, Brazil Pollutants: SO2, O3 and PM10 | Retrospective study n = 2529 | Number of exposed were not specified. Exposure cut-offs of SO2 in II–IV Q: Cut-off point of exposure not specified in study. | Number of nonexposed were not specified. Exposure cut-offs of SO2 in I Q: Cut-off point of exposure not specified in study. | LBW was significantly associated with SO2 exposure in the II and III Q (aOR 1.30, 95%CI: 1.02–1.65). |
| Dugandzic et al. (2006) [77] | 1988–2000 Nova Scotia Atlee, Canada Pollutants: PM10, SO2 and O3 | Retrospective study n = 74,284 | Number of exposed were not specified. Exposure cut-offs of SO2 in II–IV Q: 7–38 ppb | Number of nonexposed were not specified. Exposure cut-offs of SO2 in I Q: < 7 ppb | SO2 exposure during the I trimester is related with TLBW (RR 1.36, 95%CI: 1.04–1.78). |
| Wilhelm and Ritz (2005) [78] | 1994–2000 South Coast Air Basin, Los Angeles, USA Pollutants: CO, PM10, PM2.5, O3 and NO2 | Retrospective study n = 136,134 | Number of exposed were not specified. Exposure cut-offs of SO2 in II–IV Q: II–III Q (0,91–1.82 pphm), IV Q CO (>1.82 pphm) | Number of nonexposed were not specified. Exposure cut-offs of SO2 in I Q: <0.91 pphm | IV Q CO exposures increase 36% in risk for in third-trimester pregnancy of developing TLBW. |
| Lin et al. (2004) [79] | 1995–1997 Taipei and Kaohsiung, Taiwan Pollutants: SO2, PM10, CO, O3 and NO2 | Retrospective study n = 31,530 (Kaohsiung) n = 60,758 (Taipei) | 31,530 pregnant women from Kaohsiung exposed with mean concentration of CO (4.8–11.7 ppm) | 60,758 pregnant women from Taipei exposed with mean concentration of CO (0.7–1.4 ppm) | Higher exposure of SO2, PM10, CO, O3, NO2 in Kaohsiung leads to 13% higher TLBW occurrence than lower exposure in Taipei (OR 1.13, 95%CI: 1.03–1.24). |
| Lin et al. (2004) [80] | 1995–1997 Taipei and Kaohsiung, Taiwan Pollutants: SO2, PM10, CO, O3 and NO2 | Retrospective study n = 92,288 | Number of exposed were not specified. Exposure cut-offs of CO SO2 in II–IV Q: SO2 (>7.1 ppb) CO (>1.3 ppm) | Number of nonexposed were not specified. Exposure cut-offs of CO SO2 in I Q: SO2 (<7.1 ppb) CO (<1.3 ppm) | Exposure to >12.4 ppb of SO2 in the third trimester related to 20% higher risk (OR 1.2, 95%CI: 1.01–1.41) of TLBW then exposure to <6.8 ppb (OR 1.20, 95%CI: 1.01–1.41). No associations were observed between PM10, CO, O3, or NO2 exposure and TLBW occurrence. |
| Lee et al. (2003) [81] | 1996–1998 Seoul, Korea Pollutants: CO, PM10, SO2 and NO2 | Retrospective study n = 388,105 | Number of exposed were not specified. Exposure cut-offs of CO SO2 in II–IV Q: CO (0.9–3.4 ppm) SO2 (6.8–46.0 ppb) | Number of nonexposed were not specified. Exposure cut-offs of CO SO2 in I Q: CO (0.4–0.9 ppm) SO2 (3.0–6.8 ppb) | First-trimester CO exposure increased the risk for TLBW (aOR 1.04, 95%CI: 1.01–1.07), as did second-trimester exposure to SO2 (aOR 1.06, 95%CI: 1.02–1.11). CO, PM10, SO2 and NO2 during 1–2 trimesters were related with TLBW. |
| Yang et al. (2003) [82] | 1995–1997 Kaohsiung, Taiwan Pollutants: SO2 and PM10 | Retrospective study n = 13,396 | Number of exposed were not specified. Exposure cut-offs of SO2 in II–III T: II T (26.02–36.07 μg/m3) III T (>36.07 μg/m3) | Number of nonexposed were not specified. Exposure cut-offs of SO2 in I T < 26.02 μg/m3 | I trimester exposure of SO2 lead to reduced TBW (OR 18.1, 95%CI: 1.88–34.34). |
| Maroziene and Grazuleviciene (2002) [83] | 1998 Kaunas, Lithuania Pollutants: Formaldehyde | Epidemiological study n = 3988 | Number of exposed were not specified. Exposure with formaldehyde from II–III T. Tertiles of exposure cut-offs not specified in study. | Number of nonexposed were not specified. Exposure with formaldehyde in I T. Tertiles of exposure cut-offs not specified in study. | Formaldehyde exposure is related with TLBW in II T (aOR 1.86, 95%CI: 1.10–3.16) and in III T (aOR 1.84, 95%CI: 1.12–3.03). Most meaningful impact was observed in I trimester. |
| Chen et al. (2002) [84] | 1991–1999 Nevada, USA Pollutants: PM10, CO and O3 | Retrospective study n = 39,338 | 32,683 pregnant women exposed with CO at the third trimester (>0.62 ppm) | 3622 pregnant women with low exposure to CO at the third trimester (<0.62 ppm) | CO and O3 were found not to be related to birth weight. |
| Vassilev et al. (2001) [85] | 1990–1991 New Jersey, USA Pollutants: POM–polycyclic organic matter | Retrospective study n =199,474 | 132,484 pregnant women exposed with II–III T POM. Tertiles of exposure cut-offs: II T POM (0.27–0.61 μg/m3) III T POM (0.61–2.8 μg/m3) | 66,990 pregnant women exposed with I T POM. Tertiles of exposure cut-offs: I T POM (0.04–0.27 μg/m3) | III T POM exposure is related with SGA (aOR 1.22, 95%CI: 1.17–1.27). |
| Lin et al. (2001) [86] | 1993–1996 Lin-Yuan and Taicei, Taiwan Pollutants: SO2, NO2, PM10, SO42−, NH4+ and NO3− | Retrospective study n = 2545 | 1677 pregnant women from Lin-Yuan municipality exposed with SO2, NO2, PM10, SO42−, NH4+, NO3− in II–IV Q: SO2 (6.0 ± 2.9 ppb) SO42− (120.2 ± 1.2 nmol/m3) NH4+ (136.1 ± 4.0 nmol/m3) | 868 pregnant women from Taicei municipality exposed with SO2, NO2, PM10, SO42−, NH4+, NO3− in I Q: SO2 (1.9 ± 2.3 ppb) SO42− (91.4 ± 1.4 nmol/m3) NH4 (69.0 ± 3.1 nmol/m3) | Higher exposure of SO2, NO2, PM10, SO42−, NO3−, petrochemical municipality in Lin-Yuan leads to 3.22% TLBW occurrence in comparison to lower exposure in control municipality Taicei which lead to 1.84% TLBW occurrence. Exposure to NH4+ influenced TLBW (aOR 1.77, 95%CI: 1.002–3.12). |
| Maisonet et al. (2001) [87] | 1994–1996 Boston, Hartford, Philadelphia, Pittsburgh; Springfield, and Washington, USA Pollutants: CO, PM10 and SO2 | Retrospective study n = 89,557 | Number of exposed were not specified. Exposure cut-offs of CO and SO2 in II–IV Q: CO (0.93–1.5 ppm) SO2 (7.1–18.5 µg/m3) | Number of nonexposed were not specified. Exposure cut-offs of CO and SO2 in I Q: CO (<0.93 ppm) SO2 (<7.1 µg/m3) | SO2 and CO are related with TLBW. CO in third trimester (aOR 1.31, 95%CI: 1.06–1.62) and SO2 in second trimester within: II Q (aOR 1.21, 95%CI: 1.07–1.37), III Q (aOR 1.20, 95%CI: 1.08–1.35) IV Q (aOR 1.21, 95%CI: 1.03–1.43) |
| Ritz and Yu (1999) [88] | 1989–1993 Los Angeles, USA Pollutant: CO | Retrospective study n = 125,573 | 62,787 pregnant women exposed with CO above the median. Exposure above median of 2.2–6.7 ppm CO | 62,786 pregnant women exposed with CO below the median. Exposure blow median of 0.65–2.1 ppm CO | Exposure to (>5.5 ppm CO) during the third trimester is associated with TLBW (OR 1.22, 95%CI: 1.03–1.44) |
| Gražulevičienė et al. (1998) [89] | 1994 Kaunas, Lithuania Pollutant: Formaldehyde | Retrospective study n = 4290 | 934 pregnant women exposed with formaldehyde >3.5 μg/m3 and 442 pregnant women exposed with O3 >30 μg/m3 | 3356 pregnant women exposed with formaldehyde <3.5 μg/m3 and 3848 pregnant women exposed with O3 <30 μg/m3 | No associations were observed between formaldehyde and O3 exposure and SGA or TLBW occurrence. |
| Alderman et al. (1987) [90] | 1975–1983 Colorado Department of Health, USA Pollutant: CO | Retrospective study, n = 2800 | 800 pregnant women exposed with CO form second quintile to fifth quintile. Number of women in each quintile is not specified. Quintiles exposure cut-offs of CO: II Q (1–2 ppm) III Q (2–3 ppm) IV Q (3–4 ppm) V Q (>4 ppm) | 198 pregnant women exposed with CO in first quintile. I Quintile exposure cut-off of CO: <1 ppm | No significant association was observed between CO exposure and SGA or TLBW occurrence (OR 1.3, 95%CI: 1.0–1.7) for 2–4 ppm CO. |
Disclaimer/Publisher’s Note: The statements, opinions and data contained in all publications are solely those of the individual author(s) and contributor(s) and not of MDPI and/or the editor(s). MDPI and/or the editor(s) disclaim responsibility for any injury to people or property resulting from any ideas, methods, instructions or products referred to in the content. |
© 2024 by the authors. Licensee MDPI, Basel, Switzerland. This article is an open access article distributed under the terms and conditions of the Creative Commons Attribution (CC BY) license (https://creativecommons.org/licenses/by/4.0/).
Share and Cite
Grabowski, B.; Feduniw, S.; Orzel, A.; Drab, M.; Modzelewski, J.; Pruc, M.; Gaca, Z.; Szarpak, L.; Rabijewski, M.; Baran, A.; et al. Does Exposure to Ambient Air Pollution Affect Gestational Age and Newborn Weight?—A Systematic Review. Healthcare 2024, 12, 1176. https://doi.org/10.3390/healthcare12121176
Grabowski B, Feduniw S, Orzel A, Drab M, Modzelewski J, Pruc M, Gaca Z, Szarpak L, Rabijewski M, Baran A, et al. Does Exposure to Ambient Air Pollution Affect Gestational Age and Newborn Weight?—A Systematic Review. Healthcare. 2024; 12(12):1176. https://doi.org/10.3390/healthcare12121176
Chicago/Turabian StyleGrabowski, Bartlomiej, Stepan Feduniw, Anna Orzel, Marcin Drab, Jan Modzelewski, Michal Pruc, Zuzanna Gaca, Lukasz Szarpak, Michal Rabijewski, Arkadiusz Baran, and et al. 2024. "Does Exposure to Ambient Air Pollution Affect Gestational Age and Newborn Weight?—A Systematic Review" Healthcare 12, no. 12: 1176. https://doi.org/10.3390/healthcare12121176
APA StyleGrabowski, B., Feduniw, S., Orzel, A., Drab, M., Modzelewski, J., Pruc, M., Gaca, Z., Szarpak, L., Rabijewski, M., Baran, A., & Scholz, A. (2024). Does Exposure to Ambient Air Pollution Affect Gestational Age and Newborn Weight?—A Systematic Review. Healthcare, 12(12), 1176. https://doi.org/10.3390/healthcare12121176