

10-Year Fracture Risk Assessment with Novel Adjustment (FRAXplus): Type 2 Diabetic Sample-Focused Analysis

 ,
,  and
and 
Abstract
1. Introduction
Objective
2. Material and Methods
3. Results
3.1. DXA and BTM Analysis
3.2. Multiple Linear Regression Models for BMD at Central DXA
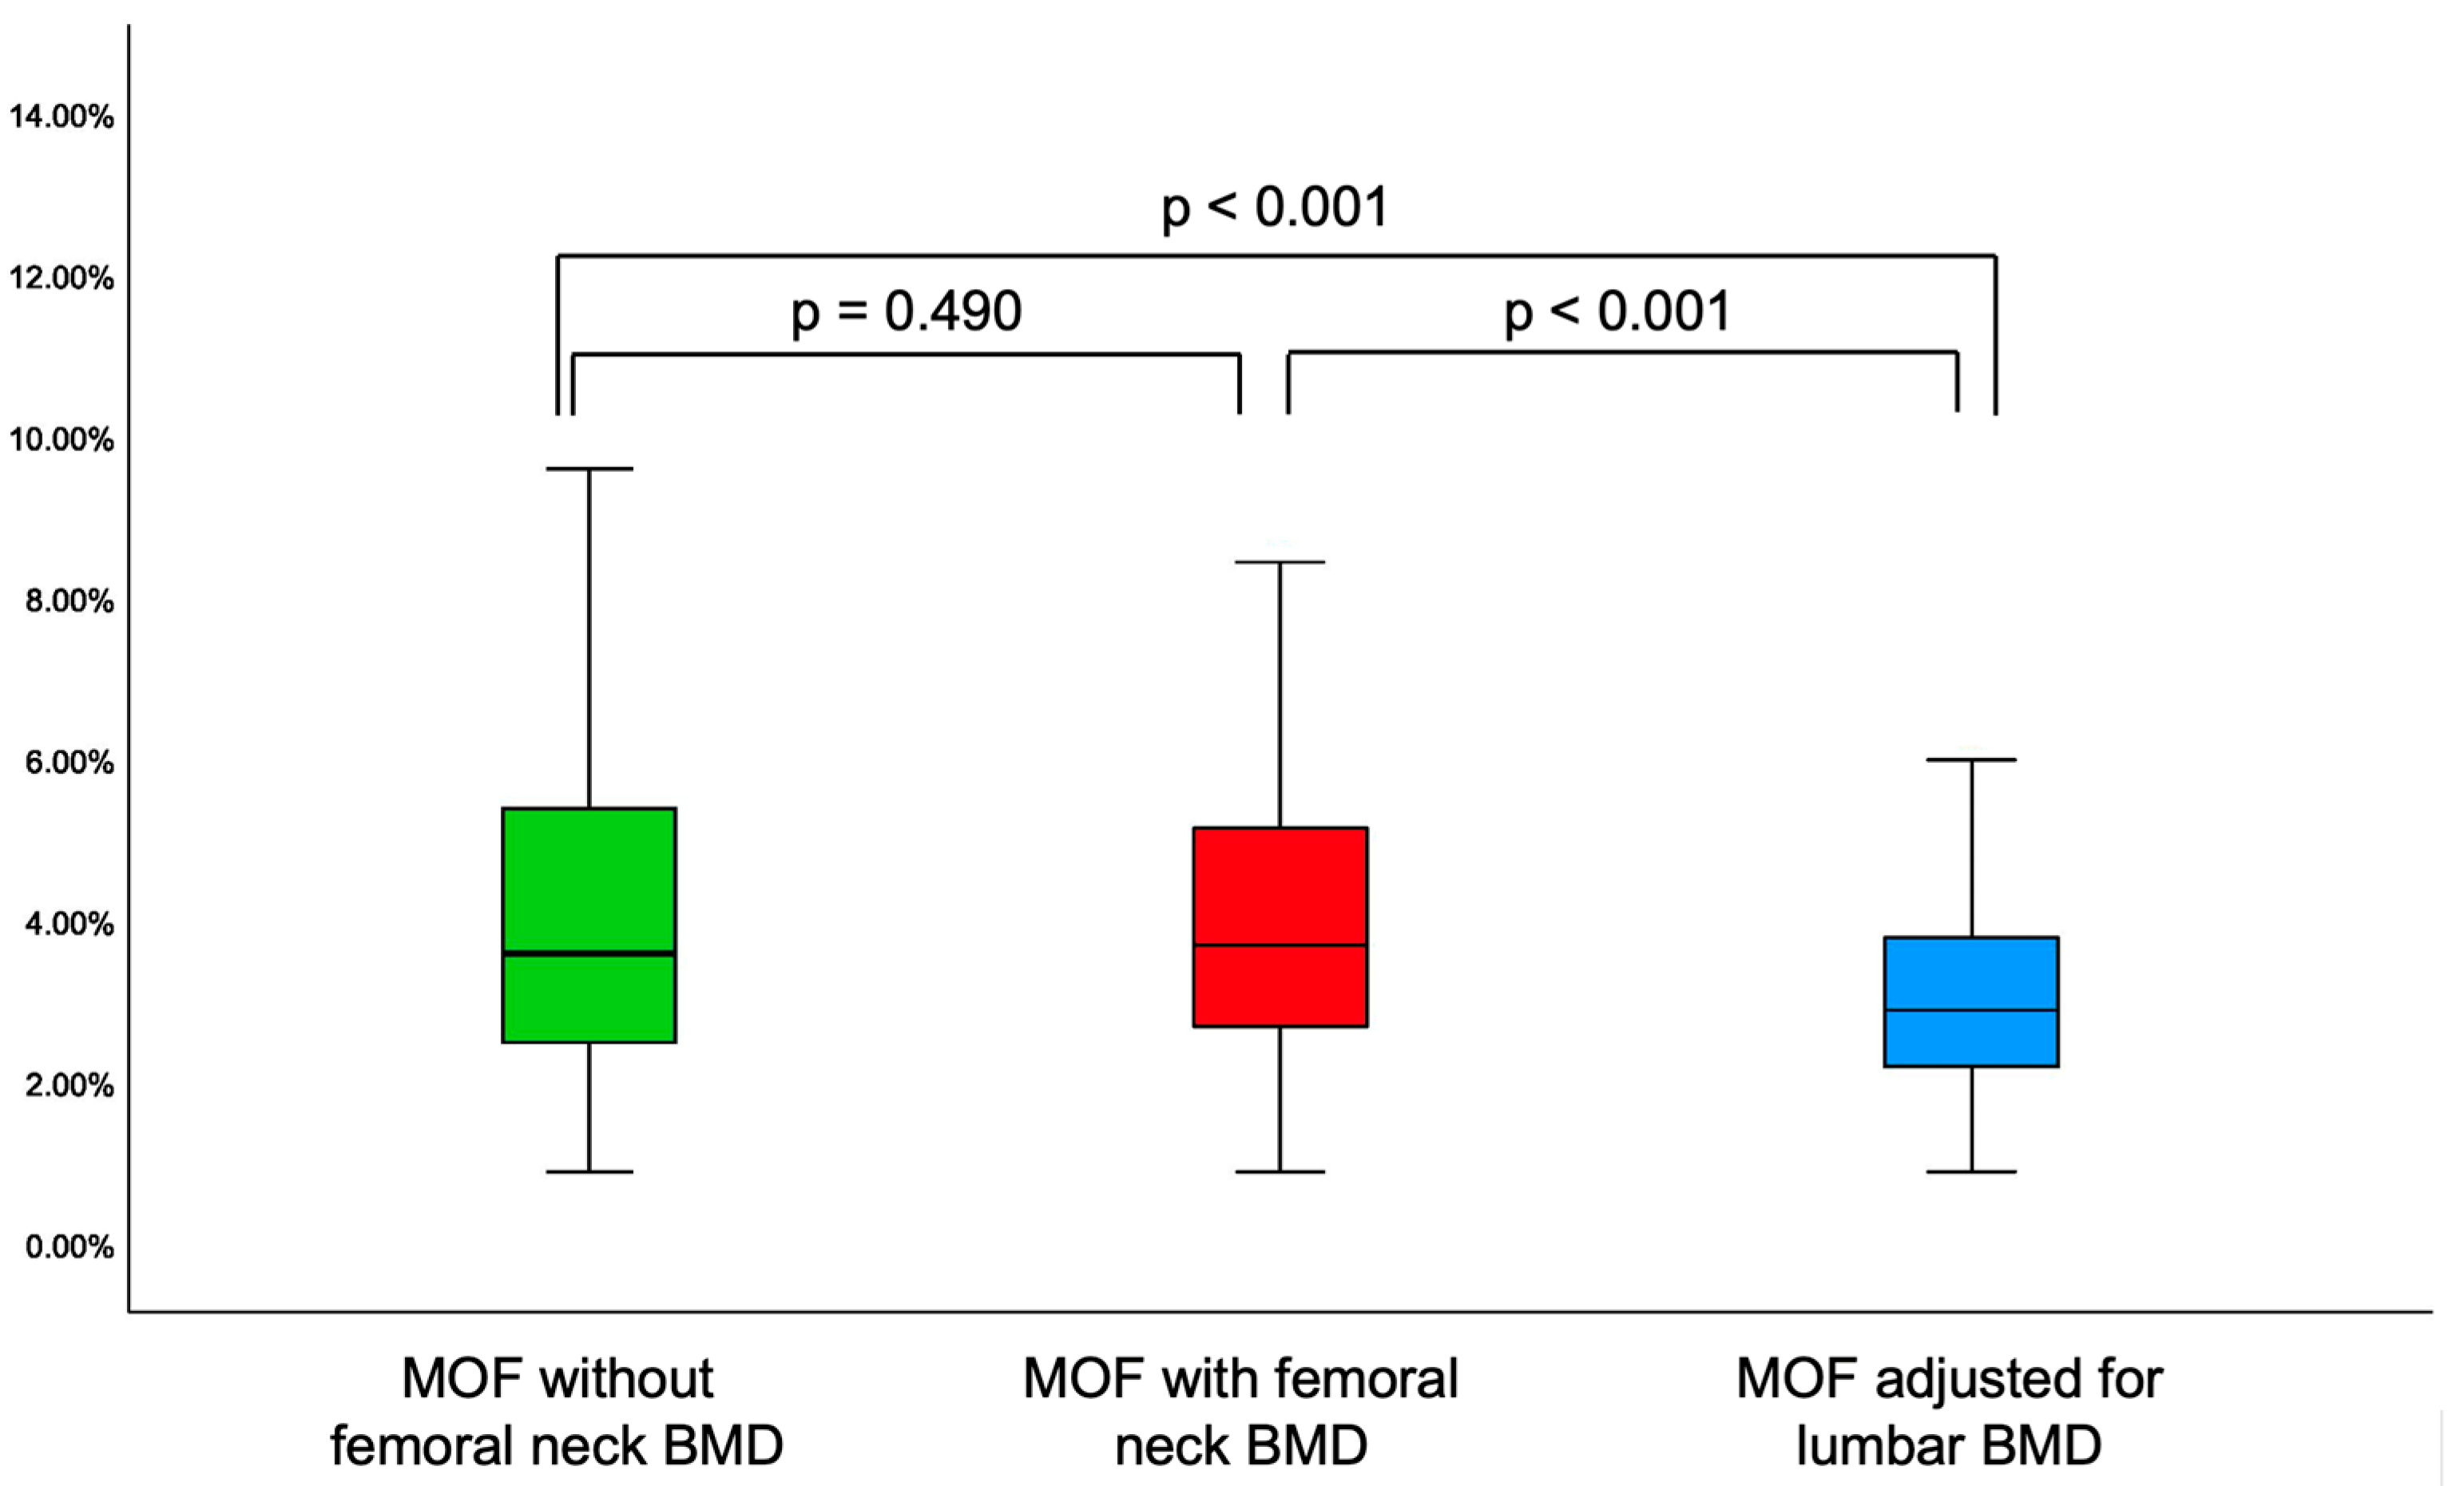
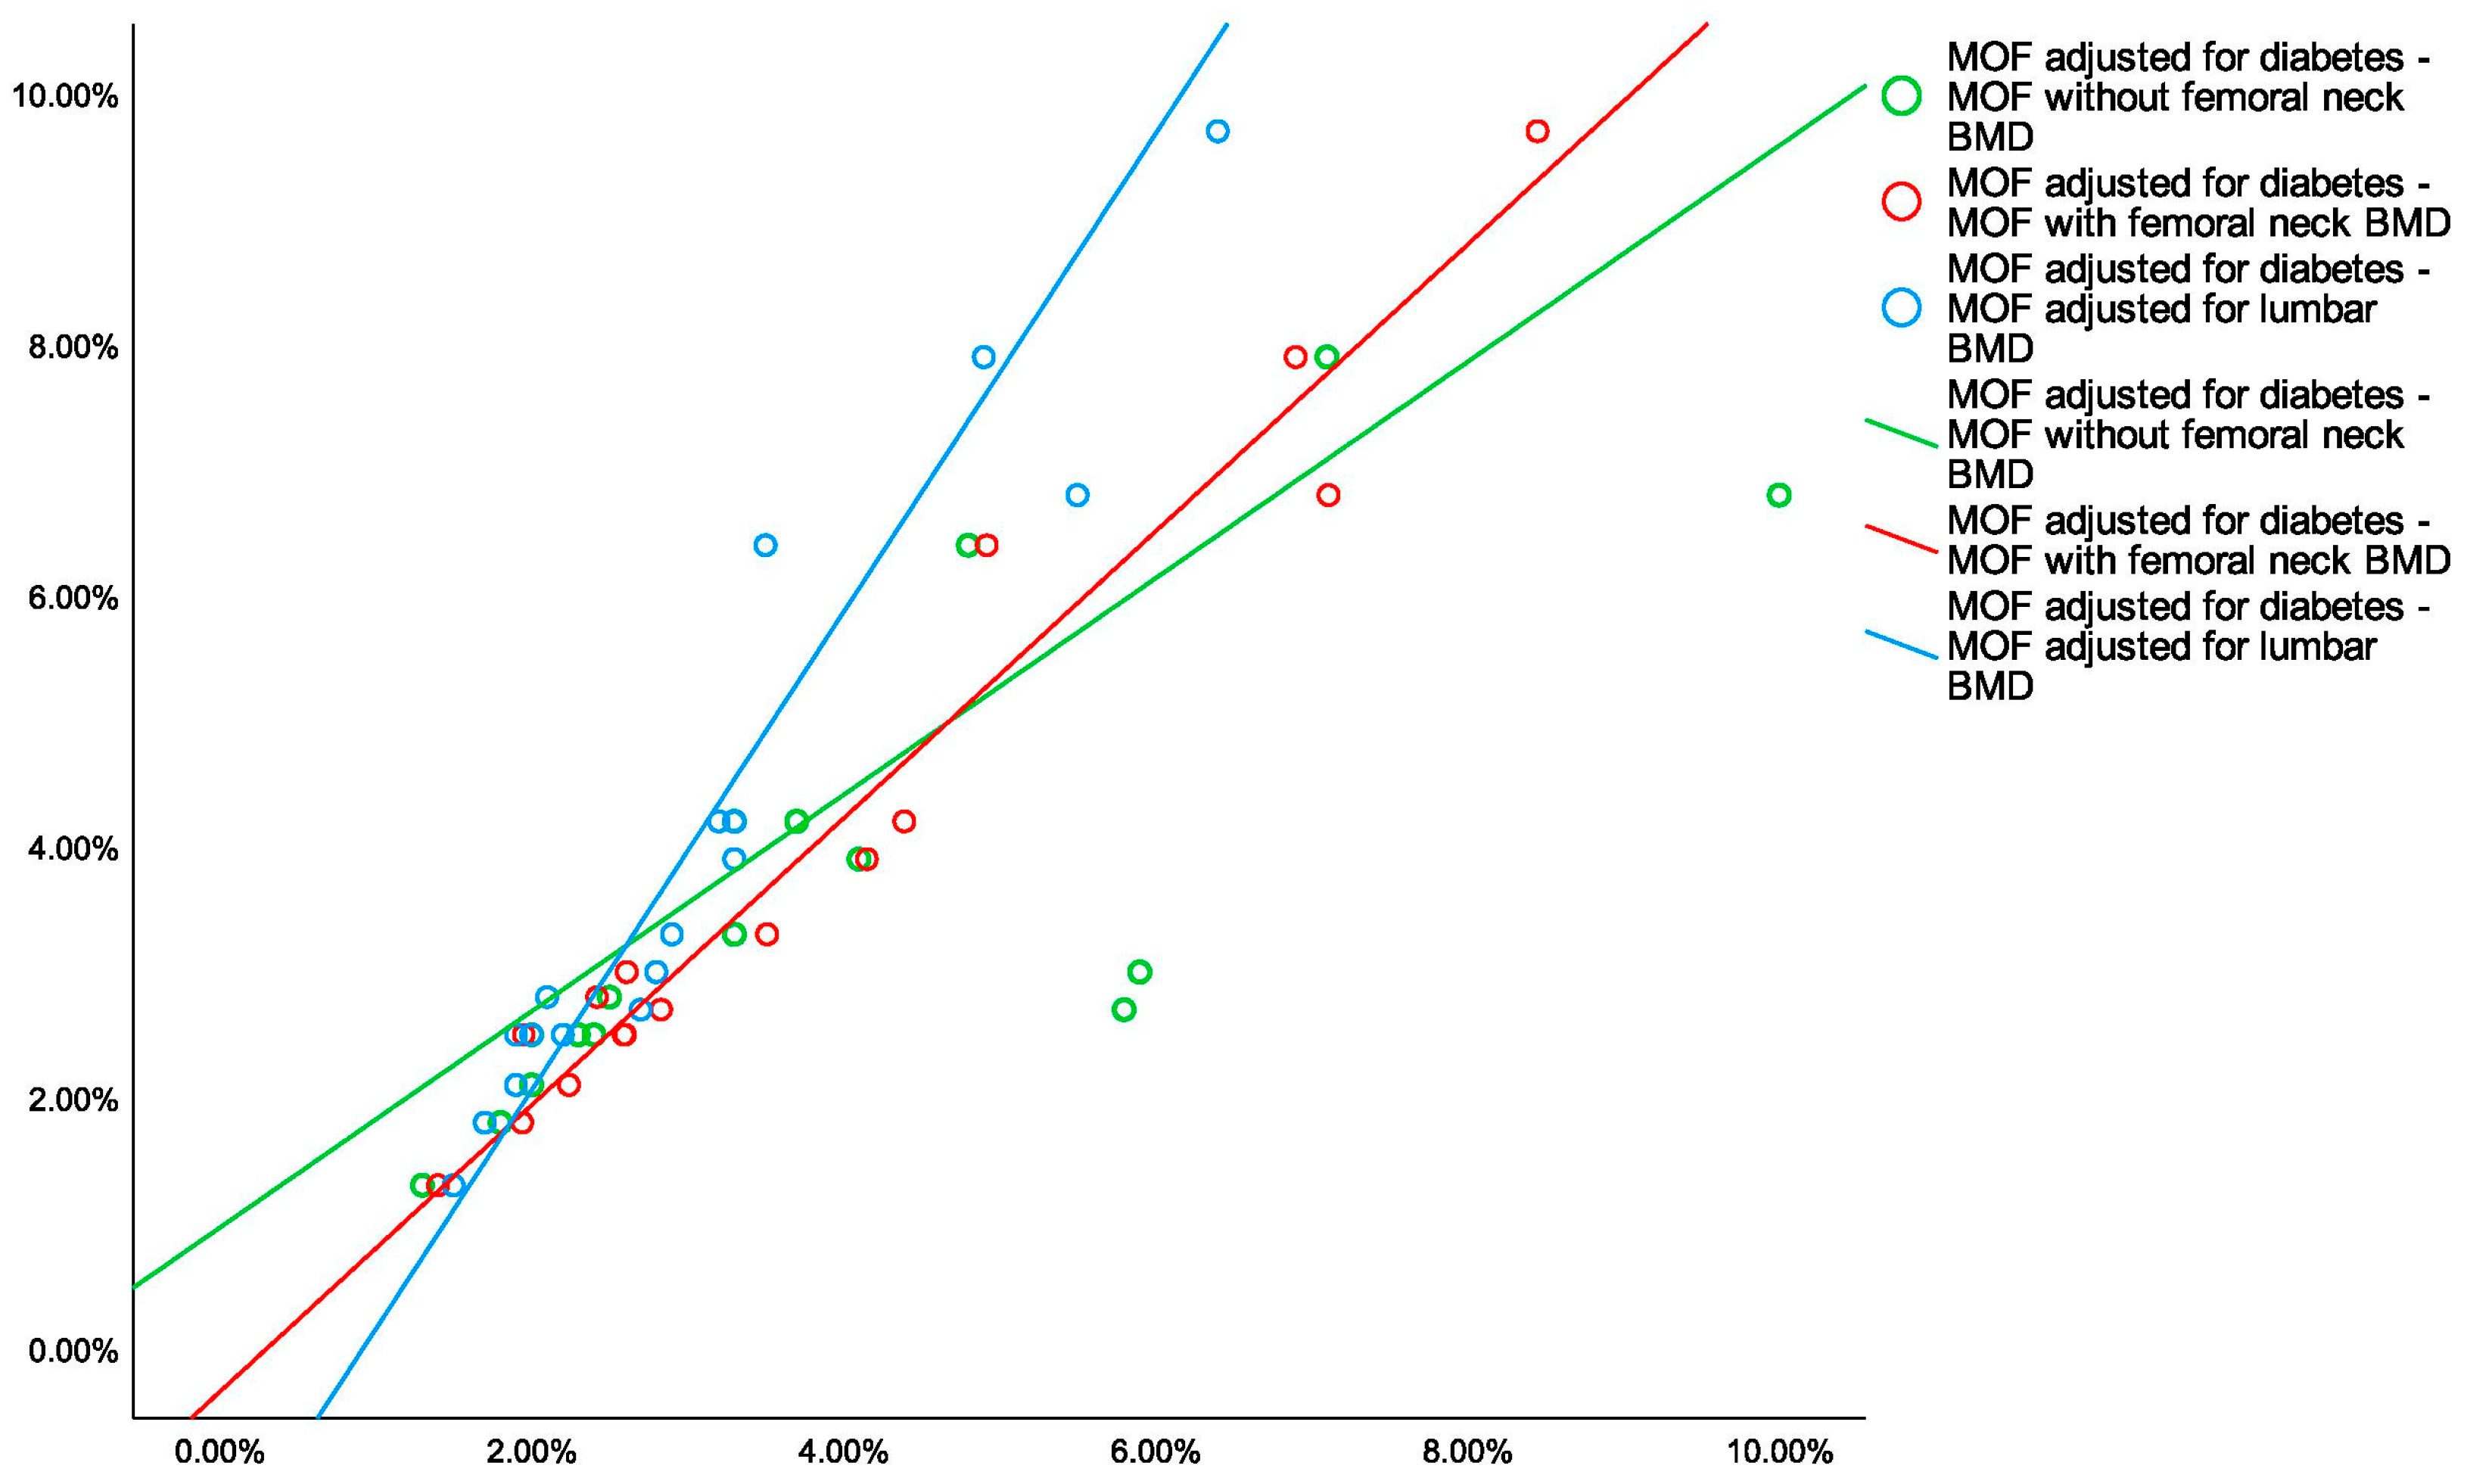
3.3. The Analysis of 10-Year Fracture Probability
4. Discussion
5. Conclusions
- 🟩
- Noting the epidemiologic impact of type 2 diabetes, and the importance of the diabetic bone disease, particularly, from a practical perspective, the osteoporotic fracture risk estimation might help the overall disease burden. New algorithms such as FRAXplus are in progress to help this distinct matter.
- 🟩
- In this study, type 2 diabetic menopausal women when compared to age- and years since menopause-match controls had a lower 25-hydroxyvitamin D and BTMs (osteocalcin, CrossLaps), an increased total hip BMD and femoral neck BMD (with loss of significance upon BMI adjustment).
- 🟩
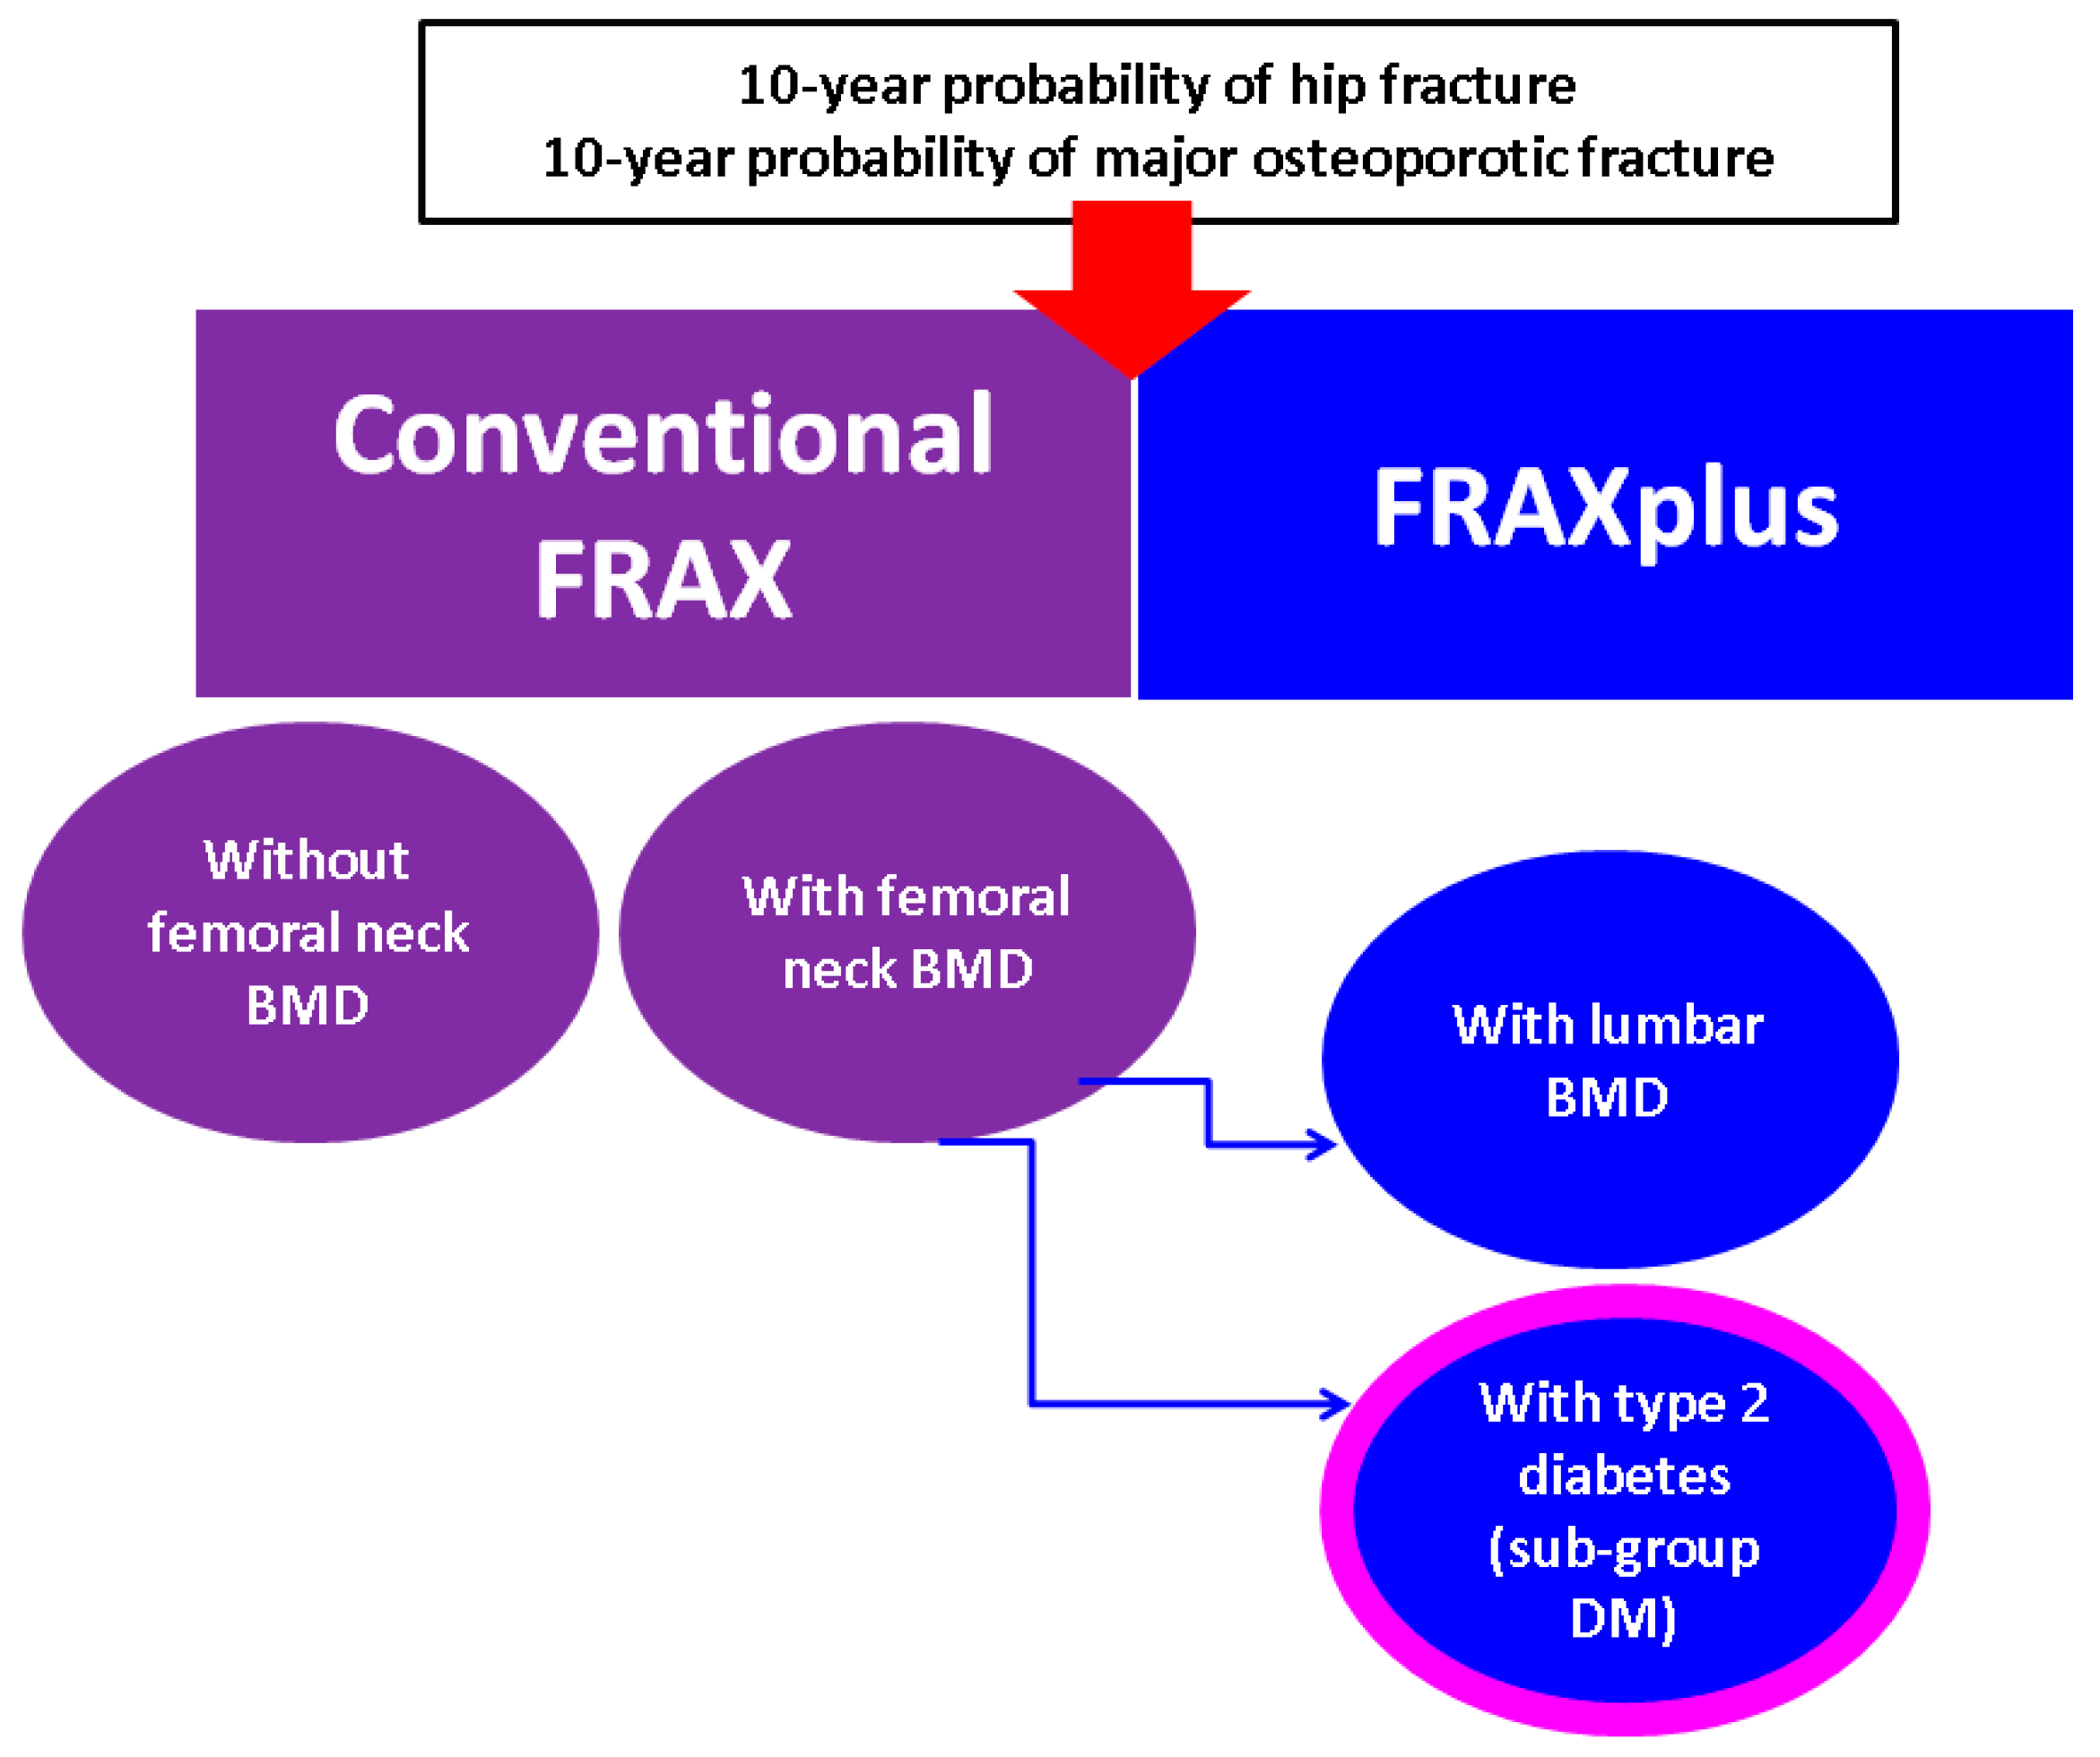
- When applying novel FRAX model, lumbar spine BMD adjustment showed lower MOF and HF as estimated by the conventional FRAX (in either subgroup or entire cohort) or as found by diabetes adjustment using FRAXplus (in diabetic subgroup).
- 🟩
- To date, all four types of 10-year fracture probabilities displayed a strong correlation, but taking into consideration the presence of the diabetic disease, statistically significant higher risks than calculated by the traditional FRAX were found, hence, the current model might underestimate the condition-related fracture risk.
- 🟩
- Addressing the practical aspects of fracture risk assessment in diabetic menopausal women might improve the bone health and further offers a prompt tailored strategy to reduce the fracture risk.
Author Contributions
Funding
Institutional Review Board Statement
Informed Consent Statement
Data Availability Statement
Acknowledgments
Conflicts of Interest
Abbreviations
| BMD | bone mineral density |
| BMI | body mass index |
| BTM | bone turnover markers |
| DM | type 2 diabetes mellitus |
| DXA | Dual-Energy X-Ray Absorptiometry |
| FRAX | Fracture Risk Assessment Tool |
| HF | 10-year probability of hip fracture |
| MOF | 10-year probability of major osteoporotic fractures |
| N/A | not applicable |
| N | number of patients |
| OGTT | oral glucose tolerance test |
| PTH | parathormone |
| REMS | Radiofrequency Echographic Multi Spectometry |
| Q | quartile |
| SD | standard deviation |
| SE | standard error |
Appendix A

Appendix B

| 10-Year Probability of Fracture (%) | Value |
|---|---|
| MOF without femoral neck BMD, median (Q1, Q3) | 3.80 (2.70, 5.50) |
| MOF with femoral neck BMD, median (Q1, Q3) | 3.90 (2.90, 5.63) |
| MOF adjusted for lumbar BMD, median (Q1, Q3) | 3.00 (2.30, 4.30) |
| HF without femoral neck BMD, median (Q1, Q3) | 0.60 (0.40, 1.70) |
| HF with femoral neck BMD, median (Q1, Q3) | 0.59 (0.30, 1.53) |
| HF adjusted for lumbar BMD, median (Q1, Q3) | 0.40 (0.20, 1.10) |
References
- Su, W.; Jia, H.; Yang, L.; Zhang, J.; Wei, Z.; Tsikwa, P.; Wang, Y. Risk factors for osteoporosis in elderly patients with type 2 diabetes: A protocol for systematic review and meta-analysis. PLoS ONE 2025, 20, e0319602. [Google Scholar] [CrossRef]
- Chen, F.; Wang, P.; Dai, F.; Zhang, Q.; Ying, R.; Ai, L.; Chen, Y. Correlation Between Blood Glucose Fluctuations and Osteoporosis in Type 2 Diabetes Mellitus. Int. J. Endocrinol. 2025, 2025, 8889420. [Google Scholar] [CrossRef]
- Cao, Y.; Dong, B.; Li, Y.; Liu, Y.; Shen, L. Association of type 2 diabetes with osteoporosis and fracture risk: A systematic review and meta-analysis. Medicine 2025, 104, e41444. [Google Scholar] [CrossRef]
- Jiang, L.; Song, X.; Yan, L.; Liu, Y.; Qiao, X.; Zhang, W. Molecular insights into the interplay between type 2 diabetes mellitus and osteoporosis: Implications for endocrine health. Front. Endocrinol. 2025, 15, 1483512. [Google Scholar] [CrossRef]
- Lu, Y.; Yang, J.; Wu, Q.; Wang, X. The Role and Molecular Pathways of SIRT6 in Senescence and Age-related Diseases. Adv. Biol. 2025, 9, e2400469. [Google Scholar] [CrossRef]
- Sharma, P.; Sharma, R.K.; Gaur, K. Understanding the impact of diabetes on bone health: A clinical review. Metabol. Open 2024, 24, 100330. [Google Scholar] [CrossRef] [PubMed]
- Cairoli, E.; Grassi, G.; Gaudio, A.; Palermo, A.; Vescini, F.; Falchetti, A.; Merlotti, D.; Eller-Vainicher, C.; Carnevale, V.; Scillitani, A.; et al. Validation of the clinical consensus recommendations on the management of fracture risk in postmenopausal women with type 2 diabetes. Nutr. Metab. Cardiovasc. Dis. 2023, 33, 158–167. [Google Scholar] [CrossRef] [PubMed]
- Popa, F.L.; Diaconu, C.; Canciu, A.; Ciortea, V.M.; Iliescu, M.G.; Stanciu, M. Medical management and rehabilitation in posttraumatic common peroneal nerve palsy. Balneo PRM Res. J. 2022, 13, 1. [Google Scholar] [CrossRef]
- Dumitru, N.; Carsote, M.; Cocolos, A.; Petrova, E.; Olaru, M.; Dumitrache, C.; Ghemigian, A. The Link Between Bone Osteocalcin and Energy Metabolism in a Group of Postmenopausal Women. Curr. Health Sci. J. 2019, 45, 47–51. [Google Scholar] [CrossRef]
- Kanis, J.A.; Cooper, C.; Rizzoli, R.; Reginster, J.Y. Scientific Advisory Board of the European Society for Clinical and Economic Aspects of Osteoporosis and Osteoarthritis (ESCEO) and the Committees of Scientific Advisors and National Societies of the International Osteoporosis Foundation (IOF). Executive summary of the European guidance for the diagnosis and management of osteoporosis in postmenopausal women. Calcif. Tissue Int. 2019, 104, 235–238. [Google Scholar] [CrossRef]
- Kanis, J.A.; Cooper, C.; Rizzoli, R.; Reginster, J.Y. Scientific Advisory Board of the European Society for Clinical and Economic Aspects of Osteoporosis (ESCEO) and the Committees of Scientific Advisors and National Societies of the International Osteoporosis Foundation (IOF). European guidance for the diagnosis and management of osteoporosis in postmenopausal women. Osteoporos. Int. 2019, 30, 3–44. [Google Scholar] [CrossRef] [PubMed]
- Kanis, J.A.; Harvey, N.C.; Johansson, H.; Odén, A.; Leslie, W.D.; McCloskey, E.V. FRAX Update. J. Clin. Densitom. 2017, 20, 360–367. [Google Scholar] [CrossRef]
- FRAX. Calculator de Risc. Available online: https://frax.shef.ac.uk/FRAX/tool.aspx?lang=ro (accessed on 2 February 2025).
- Kanis, J.A.; Harvey, N.C.; Johansson, H.; Odén, A.; McCloskey, E.V.; Leslie, W.D. Overview of Fracture Prediction Tools. J. Clin. Densitom. 2017, 20, 444–450. [Google Scholar] [CrossRef]
- Kanis, J.A.; Hans, D.; Cooper, C.; Baim, S.; Bilezikian, J.P.; Binkley, N.; Cauley, J.A.; Compston, J.E.; Dawson-Hughes, B.; El-Hajj Fuleihan, G.; et al. Task Force of the FRAX Initiative. Interpretation and use of FRAX in clinical practice. Osteoporos. Int. 2011, 22, 2395–2411. [Google Scholar] [CrossRef]
- FRAX. Discover the Advantages of FRAXplus®. Available online: https://www.fraxplus.org/frax-plus (accessed on 12 December 2024).
- American Diabetes Association Professional Practice Committee. Summary of Revisions: Standards of Care in Diabetes—2025. Diabetes Care 2025, 48 (Suppl. 1), S6–S13. [Google Scholar] [CrossRef] [PubMed]
- The WHO Study Group. Assessment of Fracture Risk and Its Application to Screening for Postmenopausal Osteoporosis; World Health Organization: Geneva, Switzerland, 1994; Available online: https://iris.who.int/bitstream/handle/10665/39142/WHO_TRS_843_eng.pdf;jsessionid=B8CBB01F2506AEC7730BFA31F6956BEA?sequence=1 (accessed on 2 February 2025).
- Kanis, J.A. Assessment of fracture risk and its application to screening for postmenopausal osteoporosis: Synopsis of a WHO report. WHO Study Group. Osteoporos. Int. 1994, 4, 368–381. [Google Scholar] [CrossRef]
- Carsote, M.; Valea, A.; Dumitru, N.; Terzea, D.; Petrova, E.; Albu, S.; Buruiana, A.; Ghemigian, A. Metastases in daily endocrine practice. Arch. Balk. Med. Union 2016, 51, 476–480. [Google Scholar]
- Chiodini, I.; Gaudio, A.; Palermo, A.; Napoli, N.; Vescini, F.; Falchetti, A.; Merlotti, D.; Eller-Vainicher, C.; Carnevale, V.; Scillitani, A.; et al. Management of bone fragility in type 2 diabetes: Perspective from an interdisciplinary expert panel. Nutr. Metab. Cardiovasc. Dis. 2021, 31, 2210–2233. [Google Scholar] [CrossRef]
- Vasiliu, O. Impact of SGLT2 inhibitors on metabolic status in patients with psychiatric disorders undergoing treatment with second-generation antipsychotics (Review). Exp. Ther. Med. 2023, 25, 125. [Google Scholar] [CrossRef]
- Kanazawa, I.; Inaba, M.; Inoue, D.; Uenishi, K.; Saito, M.; Shiraki, M.; Suzuki, A.; Takeuchi, Y.; Hagino, H.; Fujiwara, S.; et al. Executive summary of clinical practice guide on fracture risk in lifestyle diseases. J. Bone Miner. Metab. 2020, 38, 746–758. [Google Scholar] [CrossRef] [PubMed]
- Paschou, S.A.; Dede, A.D.; Anagnostis, P.G.; Vryonidou, A.; Morganstein, D.; Goulis, D.G. Type 2 Diabetes and Osteoporosis: A Guide to Optimal Management. J. Clin. Endocrinol. Metab. 2017, 102, 3621–3634. [Google Scholar] [CrossRef]
- Valea, A.; Carsote, M.; Moldovan, C.; Georgescu, C. Chronic autoimmune thyroiditis and obesity. Arch. Balk. Med. Union 2018, 53, 64–69. [Google Scholar]
- Armutcu, F.; McCloskey, E. Fracture Risk Assessment in Metabolic Syndrome in Terms of Secondary Osteoporosis Potential. A Narrative Review. Calcif. Tissue Int. 2025, 116, 41. [Google Scholar] [CrossRef] [PubMed]
- Górczyńska-Kosiorz, S.; Kosiorz, M.; Dzięgielewska-Gęsiak, S. Exploring the Interplay of Genetics and Nutrition in the Rising Epidemic of Obesity and Metabolic Diseases. Nutrients 2024, 16, 3562. [Google Scholar] [CrossRef]
- Martiniakova, M.; Mondockova, V.; Kovacova, V.; Babikova, M.; Zemanova, N.; Biro, R.; Penzes, N.; Omelka, R. Interrelationships among metabolic syndrome, bone-derived cytokines, and the most common metabolic syndrome-related diseases negatively affecting bone quality. Diabetol. Metab. Syndr. 2024, 16, 217. [Google Scholar] [CrossRef]
- Tao, J.; Li, H.; Wang, H.; Tan, J.; Yang, X. Metabolic dysfunction-associated fatty liver disease and osteoporosis: The mechanisms and roles of adiposity. Osteoporos. Int. 2024, 35, 2087–2098. [Google Scholar] [CrossRef]
- Carter, J.; Husain, F.; Papasavas, P.; Docimo, S.; Albaugh, V.; Aylward, L.; Blalock, C.; Benson-Davies, S.; Clinical Issues Committee of the American Society of Metabolic and Bariatric Surgeons. American Society for Metabolic and Bariatric Surgery review of the body mass index. Surg. Obes. Relat. Dis. 2025, 21, 199–206. [Google Scholar] [CrossRef] [PubMed]
- Leeyaphan, J.; Rojjananukulpong, K.; Intarasompun, P.; Peerakul, Y. Simple clinical predictors for making directive decisions in osteoporosis screening for women: A cross-sectional study. J. Orthop. Surg. Res. 2024, 19, 789. [Google Scholar] [CrossRef]
- Ji, W.; Pan, B.; Chen, X.; Lao, Z.; Yang, W.; Qian, Y. Mendelian randomization studies of risk and protective factors for osteoporosis: A systematic review and meta-analysis. Front. Endocrinol. 2025, 15, 1486188. [Google Scholar] [CrossRef] [PubMed]
- Tiftik, T.; Kara, M.; Mülkoğlu, C.; Çiftçi, İ.; Çelik, Ö.F.; Durmuş, M.E.; Kara, Ö.; Kuşkonmaz, Ş.M.; Genç, H.; Kaymak, B.; et al. The Paradoxical Relationship Among Diabetes Mellitus, Osteoporosis and Sarcopenia: The PARADOS Study. Clin. Nutr. ESPEN 2025, 65, 258–263. [Google Scholar] [CrossRef]
- Turcotte, A.F.; O’Connor, S.; Morin, S.N.; Gibbs, J.C.; Willie, B.M.; Jean, S.; Gagnon, C. Association between obesity and risk of fracture, bone mineral density and bone quality in adults: A systematic review and meta-analysis. PLoS ONE 2021, 16, e0252487. [Google Scholar] [CrossRef] [PubMed]
- Liu, X.; Chen, F.; Liu, L.; Zhang, Q. Prevalence of osteoporosis in patients with diabetes mellitus: A systematic review and meta-analysis of observational studies. BMC Endocr. Disord. 2023, 23, 1. [Google Scholar] [CrossRef]
- Aleksova, J.; Ebeling, P.; Elder, G. The effects of type 1 and type 2 diabetes mellitus on bone health in chronic kidney disease. Nat. Rev. Endocrinol. 2025, 21, 301–313. [Google Scholar] [CrossRef]
- Paoletti, I.; Coccurello, R. Irisin: A Multifaceted Hormone Bridging Exercise and Disease Pathophysiology. Int. J. Mol. Sci. 2024, 25, 13480. [Google Scholar] [CrossRef]
- Ullah, A.; Chen, Y.; Singla, R.K.; Cao, D.; Shen, B. Exploring cytokines dynamics: Uncovering therapeutic concepts for metabolic disorders in postmenopausal women—Diabetes, metabolic bone diseases, and non-alcohol fatty liver disease. Ageing Res. Rev. 2024, 101, 102505. [Google Scholar] [CrossRef]
- Hamamura, K.; Nagao, M.; Furukawa, K. Regulation of Glycosylation in Bone Metabolism. Int. J. Mol. Sci. 2024, 25, 3568. [Google Scholar] [CrossRef] [PubMed]
- Huang, D.; He, Q.; Pan, J.; Zhai, Z.; Sun, J.; Wang, Q.; Chu, W.; Huang, J.; Yu, J.; Qiu, X.; et al. Systemic immune-inflammatory index predicts fragility fracture risk in postmenopausal anemic females with type 2 diabetes mellitus: Evidence from a longitudinal cohort study. BMC Endocr. Disord. 2024, 24, 256. [Google Scholar] [CrossRef] [PubMed]
- Qiu, J.; Li, C.; Dong, Z.; Wang, J. Is diabetes mellitus a risk factor for low bone density: A systematic review and meta-analysis. BMC Endocr. Disord. 2021, 21, 65. [Google Scholar] [CrossRef]
- Tan, T.H.A.; Johansson, H.; Harvey, N.C.; Lorentzon, M.; Kanis, J.A.; McCloskey, E.; Schini, M. Assessment of fracture risk with FRAX and FRAXplus. Gac. Med. Mex. 2024, 160, 363–373. [Google Scholar] [CrossRef]
- Zerikly, R.; Demetriou, E.W. Use of Fracture Risk Assessment Tool in clinical practice and Fracture Risk Assessment Tool future directions. Womens Health 2024, 20, 17455057241231387. [Google Scholar] [CrossRef]
- Ferrari, S.; Trombetti, A.; Debrach, A.C.; Kozycki, S.; Padlina, I.; Chevalley, T.; Biver, E. [Metabolic bone diseases: What’s new in 2023]. Rev. Med. Suisse. 2024, 20, 255–258. [Google Scholar] [CrossRef]
- Schini, M.; Johansson, H.; Harvey, N.C.; Lorentzon, M.; Kanis, J.A.; McCloskey, E.V. An overview of the use of the fracture risk assessment tool (FRAX) in osteoporosis. J. Endocrinol. Investig. 2024, 47, 501–511. [Google Scholar] [CrossRef] [PubMed]
- Wu, W.; Zhou, J.C.; Yang, L. Surveillance and Evaluation of Vitamin D Nutrition and Its Health Impact in Chinese Older Adults. J. Nutr. 2025, 155, 1031–1040. [Google Scholar] [CrossRef]
- Anghel, D.; Ciobica, L.M.; Negru, M.M.; Jurcut, C.; Otlocan, L.; Coca, A. Bone mineral density and vitamin D levels in patients with rheumatoid arthritis. Osteoporos. Int. 2017, 28, S435–S436. [Google Scholar]
- Lei, S.; Zhang, X.; Song, L.; Wen, J.; Zhang, Z.; Tian, J.; Yang, R.; Xu, S.; Qiu, S.; MacIsaac, R.J.; et al. Expert consensus on vitamin D in osteoporosis. Ann. Jt. 2025, 10, 1. [Google Scholar] [CrossRef]
- Grant, W.B.; Wimalawansa, S.J.; Pludowski, P.; Cheng, R.Z. Vitamin D: Evidence-Based Health Benefits and Recommendations for Population Guidelines. Nutrients 2025, 17, 277. [Google Scholar] [CrossRef] [PubMed]
- Muscogiuri, G.; Altieri, B.; Annweiler, C.; Balercia, G.; Pal, H.B.; Boucher, B.J.; Cannell, J.J.; Foresta, C.; Grübler, M.R.; Kotsa, K.; et al. Vitamin D and chronic diseases: The current state of the art. Arch. Toxicol. 2017, 91, 97–107. [Google Scholar] [CrossRef]
- Elam, R.E.; Johnson, K.C.; Xu, H.; Isales, C.M.; Dong, Y.; Carbone, L.D. Predictors of fracture in middle-aged and older adults with type 2 diabetes and overweight or obesity. J. Clin. Endocrinol. Metab. 2024, 110, dgae623. [Google Scholar] [CrossRef] [PubMed]
- Pisani, P.; Conversano, F.; Muratore, M.; Adami, G.; Brandi, M.L.; Caffarelli, C.; Casciaro, E.; Di Paola, M.; Franchini, R.; Gatti, D.; et al. Fragility Score: A REMS-based indicator for the prediction of incident fragility fractures at 5 years. Aging Clin. Exp. Res. 2023, 35, 763–773. [Google Scholar] [CrossRef]


| Parameter | Entire Group (N = 136, 100%) | Group DM (N = 30, 22.06%) | Group nonDM (N = 106, 77.94%) | p-Value | p-Value Adjusted for BMI |
|---|---|---|---|---|---|
| Age (years), mean ± SD | 61.36 ± 8.20 | 61.87 ± 7.62 | 61.22 ± 8.39 | 0.703 | 0.298 |
| Years since menopause, mean ± SD | 14.60 ± 9.21 | 15.13 ± 7.82 | 14.45 ± 9.60 | 0.722 | 0.445 |
| BMI (kg/m2), mean ± SD | 27.71 ± 5.42 | 31.80 ± 5.31 | 26.54 ± 4.87 | <0.001 | N/A |
| Prevalent fractures, N (%) | 12 (8.76) | 2 (6.66) | 10 (9.43) | 0.737 | 0.982 |
| Dyslipidemia, N (%) | 85 (62.50) | 24 (80.00) | 61 (57.55) | 0.025 | 0.159 |
| Glycated hemoglobin A1c (%), mean ± SD * | 5.82 ± 0.90 | 6.59 ± 1.25 | 5.49 ± 0.41 | <0.001 | <0.001 |
| Normal DXA, N (%) | 38 (27.94) | 13 (43.33) | 25 (23.58) | 0.040 | 0.440 |
| Osteopenia, N (%) | 68 (50.00) | 12 (40.00) | 56 (52.83) | 0.215 | 0.180 |
| Osteoporosis, N (%) | 30 (22.06) | 5 (16.67) | 25 (23.58) | 0.420 | 0.380 |
| Less than 5 years, N (%) ** | 18 (60.00) | ||||
| Between 5 and 10 years, N (%) ** | 9 (30.00) | ||||
| More than 10 years, N (%) ** | 3 (10.00) |
| Parameter | Normal Range | Entire Cohort (N = 136, 100%) | Sub-Group DM (N = 30, 22.06%) | Sub-Group nonDM (N = 106, 77.94%) | p-Value | p-Value Adjusted for BMI |
|---|---|---|---|---|---|---|
| Mineral metabolism | ||||||
| Total serum calcium (mg/dL), mean ± SD | 8.4–10.3 | 9.57 ± 0.55 | 9.67 ± 0.44 | 9.55 ± 0.58 | 0.291 | 0.624 |
| Ionized serum calcium (mg/dL), mean ± SD | 3.9–4.9 | 4.14 ± 0.32 | 4.20 ± 0.19 | 4.13 ± 0.34 | 0.512 | 0.802 |
| Total proteins (g/dL), mean ± SD | 6.4–8.6 | 7.39 ± 0.49 | 7.44 ± 0.52 | 7.38 ± 0.48 | 0.594 | 0.719 |
| Serum phosphorus (mg/dL), mean ± SD | 2.5–4.5 | 3.68 ± 0.58 | 3.57 ± 0.43 | 3.71 ± 0.62 | 0.293 | 0.655 |
| Serum magnesium (mg/dL), mean ± SD | 1.6–2.6 | 1.97 ± 0.19 | 1.90 ± 0.27 | 1.99 ± 0.16 | 0.167 | 0.220 |
| 25-hydroxyvitamin D (ng/mL), mean ± SD | 30–100 | 20.39 ± 9.43 | 16.96 ± 6.76 | 21.29 ± 9.84 | 0.013 | 0.161 |
| PTH (pg/mL), mean ± SD | 16–65 | 50.63 ± 24.38 | 49.26 ± 24.23 | 51.05 ± 24.58 | 0.759 | 0.851 |
| Bone turnover markers | ||||||
| Osteocalcin (ng/mL), mean ± SD | 15–46 | 23.97 ± 12.32 | 18.09 ± 8.35 | 25.62 ± 12.78 | 0.002 | 0.070 |
| Alkaline phosphatase (U/L), mean ± SD | 40–150 | 83.14 ± 32.60 | 74.21 ± 18.54 | 85.87 ± 35.46 | 0.111 | 0.024 |
| P1NP (ng/mL), mean ± SD | 20.25–76.31 | 55.17 ± 30.13 | 44.30 ± 16.41 | 58.48 ± 32.62 | 0.124 | 0.193 |
| CrossLaps (ng/mL), mean ± SD | 0.33–0.782 | 0.46 ± 0.21 | 0.39 ± 0.18 | 0.48 ± 0.22 | 0.048 | 0.232 |
| DXA evaluation | ||||||
| Lumbar BMD (g/sqcm), mean ± SD | 1.025 ± 0.192 | 1.042 ± 0.262 | 1.020 ± 0.168 | 0.597 | 0.201 | |
| Lumbar T-score (SD), mean ± SD | >−1 | −1.17 ± 1.42 | −0.75 ± 1.51 | −1.29 ± 1.38 | 0.069 | 0.913 |
| Lumbar Z-score (SD), mean ± SD | −0.26 ± 1.23 | −0.06 ± 1.35 | −0.31 ± 1.19 | 0.330 | 0.398 | |
| Femoral neck BMD (g/sqcm), mean ± SD | 0.872 ± 0.144 | 0.934 ± 0.154 | 0.854 ± 0.136 | 0.007 | 0.509 | |
| Femoral neck T-score (SD), mean ± SD | >−1 | −1.12 ± 1.00 | −0.61 ± 1.61 | −1.26 ± 0.91 | 0.002 | 0.244 |
| Femoral neck Z-score (SD), mean ± SD | −0.01 ± 0.85 | 0.29 ± 1.09 | −0.09 ± 0.76 | 0.086 | 0.145 | |
| Total hip BMD (g/sqcm), mean ± SD | 0.947 ± 0.160 | 1.031 ± 0.170 | 0.924 ± 0.150 | 0.002 | 0.282 | |
| Total hip T-score (SD), mean ± SD | >−1 | −0.47 ± 1.25 | 0.20 ± 1.35 | −0.65 ± 1.17 | 0.002 | 0.277 |
| Total hip Z-score (SD), mean ± SD | 0.33 ± 1.01 | 0.81 ± 1.14 | 0.19 ± 0.94 | 0.005 | 0.104 | |
| Lumbar BMD | |||
|---|---|---|---|
| Parameter | B ± SE | β | p-Value |
| Constant | 1.367 ± 0.287 | <0.001 | |
| Type 2 diabetes mellitus | −0.037 ± 0.060 | −0.077 | 0.544 |
| Age | −0.012 ± 0.003 | −0.475 | <0.001 |
| Body mass index | 0.012 ± 0.004 | 0.336 | 0.009 |
| Osteocalcin | −0.002 ± 0.002 | −0.094 | 0.522 |
| CrossLaps | −0.131 ± 0.135 | −0.134 | 0.336 |
| 25-hydroxyvitamin D | 0.003 ± 0.003 | 0.122 | 0.255 |
| R2 = 0.427 |
| Femoral Neck BMD | |||
|---|---|---|---|
| Parameter | B ± SE | β | p-Value |
| Constant | 0.768 ± 0.170 | <0.001 | |
| Type 2 diabetes mellitus | 0.079 ± 0.036 | 0.233 | 0.030 |
| Age | −0.006 ± 0.002 | −0.342 | <0.001 |
| Body mass index | 0.009 ± 0.003 | 0.375 | <0.001 |
| Osteocalcin | 0.001 ± 0.001 | 0.093 | 0.451 |
| CrossLaps | −0.204 ± 0.080 | −0.296 | 0.013 |
| 25-hydroxyvitamin D | 0.004 ± 0.001 | 0.246 | 0.007 |
| R2 = 0.600 |
| Total Hip BMD | |||
|---|---|---|---|
| Parameter | B ± SE | β | p-value |
| Constant | 0.899 ± 0.190 | <0.001 | |
| Type 2 diabetes mellitus | 0.079 ± 0.039 | 0.209 | 0.048 |
| Age | −0.007 ± 0.002 | −0.367 | <0.001 |
| Body mass index | 0.012 ± 0.003 | 0.434 | <0.001 |
| Osteocalcin | 0.001 ± 0.002 | 0.048 | 0.693 |
| CrossLaps | −0.230 ± 0.089 | −0.298 | 0.012 |
| 25-hydroxyvitamin D | 0.003 ± 0.002 | 0.177 | 0.044 |
| R2 = 0.650 |
| 10-Year Probability of Major Osteoporotic Fracture (%) | Value |
|---|---|
| without femoral neck BMD, median (Q1, Q3) | 3.70 (2.50, 5.65) |
| with femoral neck BMD, median (Q1, Q3) | 3.70 (2.10, 5.40) |
| adjusted for lumbar BMD, median (Q1, Q3) | 2.90 (2.20, 3.80) |
| 10-Year Probability of Hip Fracture (%) | Value |
|---|---|
| without femoral neck BMD, median (Q1, Q3) | 0.60 (0.30, 160) |
| with femoral neck BMD, median (Q1, Q3) | 0.50 (0.20, 1.40) |
| adjusted for lumbar BMD (%), median (Q1, Q3) | 0.40 (0.20, 1.00) |
| 10-Year Probability of Fracture (%) | Sub-Group DM (N = 30) | Sub-Group nonDM (N = 106) | p-Value | p-Value Adjusted for BMI |
|---|---|---|---|---|
| MOF without femoral neck BMD, median (Q1, Q3) | 3.40 (2.10, 5.80) | 3.80 (2.70, 5.50) | 0.306 | 0.377 |
| MOF with femoral neck BMD, median (Q1, Q3) | 3.10 (2.30, 4.39) | 3.90 (2.90, 5.63) | 0.078 | 0.735 |
| MOF adjusted for lumbar BMD, median (Q1, Q3) | 2.75 (1.90, 3.25) | 3.00 (2.30, 4.30) | 0.121 | 0.705 |
| MOF adjusted for type 2 diabetes, median (Q1, Q3) | 3.70 (2.50, 5.60) | |||
| HF without femoral neck BMD, median (Q1, Q3) | 0.50 (0.20, 1.50) | 0.60 (0.40, 1.70) | 0.191 | 0.422 |
| HF with femoral neck BMD, median (Q1, Q3) | 0.35 (0.13, 0.80) | 0.59 (0.30, 1.53) | 0.027 | 0.792 |
| HF adjusted for lumbar BMD, median (Q1, Q3) | 0.20 (0.10, 0.45) | 0.40 (0.20, 1.10) | 0.007 | 0.959 |
| HF adjusted for type 2 diabetes, median (Q1, Q3) | 0.80 (0.20, 2.40) |
| 10-Year Probability of Major Osteoporotic Fractures (%) | Value |
|---|---|
| without femoral neck BMD, median (Q1, Q3) | 3.40 (2.10, 5.80) |
| with femoral neck BMD, median (Q1, Q3) | 3.10 (2.30, 4.39) |
| adjusted for lumbar BMD, median (Q1, Q3) | 2.75 (1.90, 3.25) |
| adjusted for type 2 diabetes, median (Q1, Q3) | 3.70 (2.50, 5.60) |
| 10-Year Probability for Major Osteoporotic Fracture | Without Femoral Neck BMD | With Femoral Neck BMD | Adjusted for Lumbar BMD | Adjusted for Type 2 Diabetes |
|---|---|---|---|---|
| without femoral neck BMD | r = 0.711 p < 0.001 | r = 0.769 p < 0.001 | r = 0.740 p < 0.001 | |
| with femoral neck BMD | r = 0.711 p < 0.001 | r = 0.923 p < 0.001 | r = 0.908 p < 0.001 | |
| adjusted for lumbar BMD | r = 0.769 p < 0.001 | r = 0.923 p < 0.001 | r = 0.927 p < 0.001 | |
| adjusted for type 2 diabetes | r = 0.740 p < 0.001 | r = 0.908 p < 0.001 | r = 0.927 p < 0.001 |
| 10-Year Probability of Hip Fracture (%) | Value |
|---|---|
| without femoral neck BMD (%), median (Q1, Q3) | 0.50 (0.20, 1.50) |
| with femoral neck BMD (%), median (Q1, Q3) | 0.35 (0.13, 0.80) |
| adjusted for lumbar BMD (%), median (Q1, Q3) | 0.20 (0.10, 0.45) |
| adjusted for diabetes (%), median (Q1, Q3) | 0.80 (0.20, 2.40) |
| 10-Year Probability of Hip Fracture | Without Femoral Neck BMD | With Femoral Neck BMD | Adjusted for Lumbar BMD | Adjusted for Type 2 Diabetes |
|---|---|---|---|---|
| without femoral neck BMD | r = 0.478 p < 0.001 | r = 0.573 p < 0.001 | r = 0.570 p = 0.001 | |
| with femoral neck BMD | r = 0.478 p < 0.001 | r = 0.856 p < 0.001 | r = 0.961 p < 0.001 | |
| adjusted for lumbar BMD | r = 0.573 p < 0.001 | r = 0.856 p < 0.001 | r = 0.942 p < 0.001 | |
| adjusted for diabetes | r = 0.570 p = 0.001 | r = 0.961 p < 0.001 | r = 0.942 p < 0.001 |
| MOF Adjusted for Diabetes | |||
| Parameter | B ± SE | β | p-Value |
| Constant | 0.272 ± 0.725 | 0.713 | |
| MOF without femoral neck BMD | 0.139 ± 0.181 | 0.096 | 0.454 |
| MOF with femoral neck BMD | 1.756 ± 0.700 | 1.526 | 0.025 |
| MOF adjusted for lumbar BMD | −1.163 ± 1.334 | −0.598 | 0.398 |
| R2 = 0.986 | |||
| HF Adjusted for Diabetes | |||
| Parameter | B ± SE | β | p-Value |
| Constant | −0.083 ± 0.046 | 0.094 | |
| HF without femoral neck BMD | 0.011 ± 0.053 | 0.003 | 0.836 |
| HF with femoral neck BMD | 1.663 ± 0.387 | 0.893 | <0.001 |
| HF adjusted for lumbar BMD | 0.327 ± 0.656 | 0.106 | 0.627 |
| R2 = 0.999 |
Disclaimer/Publisher’s Note: The statements, opinions and data contained in all publications are solely those of the individual author(s) and contributor(s) and not of MDPI and/or the editor(s). MDPI and/or the editor(s) disclaim responsibility for any injury to people or property resulting from any ideas, methods, instructions or products referred to in the content. |
© 2025 by the authors. Licensee MDPI, Basel, Switzerland. This article is an open access article distributed under the terms and conditions of the Creative Commons Attribution (CC BY) license (https://creativecommons.org/licenses/by/4.0/).
Share and Cite
Sima, O.-C.; Valea, A.; Ionovici, N.; Costachescu, M.; Florescu, A.-F.; Ciobica, M.-L.; Carsote, M. 10-Year Fracture Risk Assessment with Novel Adjustment (FRAXplus): Type 2 Diabetic Sample-Focused Analysis. Diagnostics 2025, 15, 1899. https://doi.org/10.3390/diagnostics15151899
Sima O-C, Valea A, Ionovici N, Costachescu M, Florescu A-F, Ciobica M-L, Carsote M. 10-Year Fracture Risk Assessment with Novel Adjustment (FRAXplus): Type 2 Diabetic Sample-Focused Analysis. Diagnostics. 2025; 15(15):1899. https://doi.org/10.3390/diagnostics15151899
Chicago/Turabian StyleSima, Oana-Claudia, Ana Valea, Nina Ionovici, Mihai Costachescu, Alexandru-Florin Florescu, Mihai-Lucian Ciobica, and Mara Carsote. 2025. "10-Year Fracture Risk Assessment with Novel Adjustment (FRAXplus): Type 2 Diabetic Sample-Focused Analysis" Diagnostics 15, no. 15: 1899. https://doi.org/10.3390/diagnostics15151899
APA StyleSima, O.-C., Valea, A., Ionovici, N., Costachescu, M., Florescu, A.-F., Ciobica, M.-L., & Carsote, M. (2025). 10-Year Fracture Risk Assessment with Novel Adjustment (FRAXplus): Type 2 Diabetic Sample-Focused Analysis. Diagnostics, 15(15), 1899. https://doi.org/10.3390/diagnostics15151899