Recent Trends in Synchronous Brain Metastasis Incidence and Mortality in the United States: Ten-Year Multicenter Experience


Abstract
1. Introduction
2. Materials and Methods
2.1. Ethics Approval
2.2. Data Sources
2.3. Demographic Characteristics
2.4. Tumor Characteristics
2.5. Data Analysis
3. Result
4. Discussion
Limitations
5. Conclusions
Supplementary Materials
Author Contributions
Funding
Institutional Review Board Statement
Informed Consent Statement
Data Availability Statement
Acknowledgments
Conflicts of Interest
References
- Nayak, L.; Lee, E.Q.; Wen, P.Y. Epidemiology of brain metastases. Curr. Oncol. Rep. 2012, 14, 48–54. [Google Scholar] [CrossRef]
- Tabouret, E.; Chinot, O.; Metellus, P.; Tallet, A.; Viens, P.; Goncalves, A. Recent trends in epidemiology of brain metastases: An overview. Anticancer Res. 2012, 32, 4655–4662. [Google Scholar]
- Tsukada, Y.; Fouad, A.; Pickren, J.W.; Lane, W.W. Central nervous system metastasis from breast carcinoma autopsy study. Cancer 1983, 52, 2349–2354. [Google Scholar] [CrossRef]
- Aoyama, H.; Shirato, H.; Tago, M.; Nakagawa, K.; Toyoda, T.; Hatano, K.; Kenjyo, M.; Oya, N.; Hirota, S.; Shioura, H.; et al. Stereotactic radiosurgery plus whole-brain radiation therapy vs stereotactic radiosurgery alone for treatment of brain metastases: A randomized controlled trial. JAMA 2006, 295, 2483–2491. [Google Scholar] [CrossRef]
- Patchell, R.A.; Tibbs, P.A.; Walsh, J.W.; Dempsey, R.J.; Maruyama, Y.; Kryscio, R.J.; Markesbery, W.R.; Macdonald, J.S.; Young, B. A randomized trial of surgery in the treatment of single metastases to the brain. N. Engl. J. Med. 1990, 322, 494–500. [Google Scholar] [CrossRef]
- Lin, N.U. Targeted therapies in brain metastases. Curr. Treat. Options Neurol. 2014, 16, 276. [Google Scholar] [CrossRef] [PubMed]
- Muldoon, L.L.; Soussain, C.; Jahnke, K.; Johanson, C.; Siegal, T.; Smith, Q.R.; Hall, W.A.; Hynynen, K.; Senter, P.D.; Peereboom, D.M.; et al. Chemotherapy delivery issues in central nervous system malignancy: A reality check. J. Clin. Oncol. 2007, 25, 2295–2305. [Google Scholar] [CrossRef]
- Lamba, N.; Kearney, R.B.; Catalano, P.J.; Hassett, M.J.; Wen, P.Y.; Haas-Kogan, D.A.; Aizer, A.A. Population-based estimates of survival among elderly patients with brain metastases. Neuro-Oncology 2021, 23, 661–676. [Google Scholar] [CrossRef]
- Barnholtz-Sloan, J.S.; Sloan, A.E.; Davis, F.G.; Vigneau, F.D.; Lai, P.; Sawaya, R.E. Incidence proportions of brain metastases in patients diagnosed (1973 to 2001) in the Metropolitan Detroit Cancer Surveillance System. J. Clin. Oncol. 2004, 22, 2865–2872. [Google Scholar] [CrossRef]
- Gavrilovic, I.T.; Posner, J.B. Brain metastases: Epidemiology and pathophysiology. J. Neuro-Oncol. 2005, 75, 5–14. [Google Scholar] [CrossRef]
- Cagney, D.N.; Martin, A.M.; Catalano, P.J.; Redig, A.J.; Lin, N.U.; Lee, E.Q.; Wen, P.Y.; Dunn, I.F.; Bi, W.L.; Weiss, S.E.; et al. Incidence and prognosis of patients with brain metastases at diagnosis of systemic malignancy: A population-based study. Neuro-Oncology 2017, 19, 1511–1521. [Google Scholar] [CrossRef] [PubMed]
- Che, W.; Wang, Y.; Wang, X.; Lyu, J.J.C.M. Midlife brain metastases in the United States: Is male at risk? Cancer Med. 2022, 11, 1202–1216. [Google Scholar] [CrossRef] [PubMed]
- Martin, A.M.; Cagney, D.N.; Catalano, P.J.; Warren, L.E.; Bellon, J.R.; Punglia, R.S.; Claus, E.B.; Lee, E.Q.; Wen, P.Y.; Haas-Kogan, D.A.; et al. Brain metastases in newly diagnosed breast cancer: A population-based study. JAMA Oncol. 2017, 3, 1069–1077. [Google Scholar] [CrossRef]
- Lim, H.; Devesa, S.S.; Sosa, J.A.; Check, D.; Kitahara, C.M. Trends in thyroid cancer incidence and mortality in the United States, 1974–2013. Jama 2017, 317, 1338–1348. [Google Scholar] [CrossRef] [PubMed]
- Koshy, M.; Villano, J.L.; Dolecek, T.A.; Howard, A.; Mahmood, U.; Chmura, S.J.; Weichselbaum, R.R.; McCarthy, B.J. Improved survival time trends for glioblastoma using the SEER 17 population-based registries. J. Neuro-Oncol. 2012, 107, 207–212. [Google Scholar] [CrossRef]
- Guo, F.; Kuo, Y.F.; Shih, Y.C.T.; Giordano, S.H.; Berenson, A.B. Trends in breast cancer mortality by stage at diagnosis among young women in the United States. Cancer 2018, 124, 3500–3509. [Google Scholar] [CrossRef]
- Kim, H.J.; Fay, M.P.; Feuer, E.J.; Midthune, D.N. Permutation tests for joinpoint regression with applications to cancer rates. Stat. Med. 2000, 19, 335–351. [Google Scholar] [CrossRef]
- Sacks, P.; Rahman, M. Epidemiology of brain metastases. Neurosurg. Clin. 2020, 31, 481–488. [Google Scholar] [CrossRef]
- Lamba, N.; Wen, P.Y.; Aizer, A.A. Epidemiology of brain metastases and leptomeningeal disease. Neuro-Oncology 2021, 23, 1447–1456. [Google Scholar] [CrossRef]
- Lyu, X.; Luo, B. Prognostic factors and survival prediction in HER2-positive breast cancer with bone metastases: A retrospective cohort study. Cancer Med. 2021, 10, 8114–8126. [Google Scholar] [CrossRef]
- Dong, S.; Yang, H.; Tang, Z.-R.; Ke, Y.; Wang, H.; Li, W.; Tian, K. Development and validation of a predictive model to evaluate the risk of bone metastasis in kidney cancer. Front. Oncol. 2021, 11, 4876. [Google Scholar] [CrossRef]
- Singh, R.; Stoltzfus, K.C.; Chen, H.; Louie, A.V.; Lehrer, E.J.; Horn, S.R.; Palmer, J.D.; Trifiletti, D.M.; Brown, P.D.; Zaorsky, N.G. Epidemiology of synchronous brain metastases. Neuro-Oncol. Adv. 2020, 2, vdaa041. [Google Scholar] [CrossRef]
- Smedby, K.; Brandt, L.; Bäcklund, M.; Blomqvist, P. Brain metastases admissions in Sweden between 1987 and 2006. Br. J. Cancer 2009, 101, 1919–1924. [Google Scholar] [CrossRef]
- Schouten, L.J.; Rutten, J.; Huveneers, H.A.; Twijnstra, A. Incidence of brain metastases in a cohort of patients with carcinoma of the breast, colon, kidney, and lung and melanoma. Cancer 2002, 94, 2698–2705. [Google Scholar] [CrossRef]
- Nieder, C.; Spanne, O.; Mehta, M.P.; Grosu, A.L.; Geinitz, H. Presentation, patterns of care, and survival in patients with brain metastases: What has changed in the last 20 years? Cancer 2011, 117, 2505–2512. [Google Scholar] [CrossRef]
- Welch, H.G.; Kramer, B.S.; Black, W.C. Epidemiologic signatures in cancer. N. Engl. J. Med. 2019, 381, 1378–1386. [Google Scholar] [CrossRef]
- Welch, H.G.; Albertsen, P.C. Prostate cancer diagnosis and treatment after the introduction of prostate-specific antigen screening: 1986–2005. J. Natl. Cancer Inst. 2009, 101, 1325–1329. [Google Scholar] [CrossRef]
- Welch, H.G.; Gorski, D.H.; Albertsen, P.C. Trends in metastatic breast and prostate cancer—Lessons in cancer dynamics. N. Engl. J. Med. 2015, 373, 1685–1687. [Google Scholar] [CrossRef]
- Brufsky, A.M.; Mayer, M.; Rugo, H.S.; Kaufman, P.A.; Tan-Chiu, E.; Tripathy, D.; Tudor, I.C.; Wang, L.I.; Brammer, M.G.; Shing, M.; et al. Central nervous system metastases in patients with HER2-positive metastatic breast cancer: Incidence, treatment, and survival in patients from registHER. Clin. Cancer Res. 2011, 17, 4834–4843. [Google Scholar] [CrossRef]
- Crivellari, D.; Pagani, O.; Veronesi, A.; Lombardi, D.; Nolè, F.; Thürlimann, B.; Hess, D.; Borner, M.; Bauer, J.; Martinelli, G.; et al. High incidence of central nervous system involvement in patients with metastatic or locally advanced breast cancer treated with epirubicin and docetaxel. Ann. Oncol. 2001, 12, 353–356. [Google Scholar] [CrossRef]
- Dawood, S.; Broglio, K.; Esteva, F.J.; Ibrahim, N.K.; Kau, S.-W.; Islam, R.; Aldape, K.D.; Yu, T.-K.; Hortobagyi, G.N.; Gonzalez-Angulo, A.M. Defining prognosis for women with breast cancer and CNS metastases by HER2 status. Ann. Oncol. 2008, 19, 1242–1248. [Google Scholar] [CrossRef]
- Xia, C.; Dong, X.; Li, H.; Cao, M.; Sun, D.; He, S.; Yang, F.; Yan, X.; Zhang, S.; Li, N.; et al. Cancer statistics in China and United States, 2022: Profiles, trends, and determinants. Chin. Med. J. 2022, 135, 584–590. [Google Scholar] [CrossRef]
- Barta, J.A.; Powell, C.A.; Wisnivesky, J.P. Global epidemiology of lung cancer. Ann. Glob. Health 2019, 85, 8. [Google Scholar] [CrossRef]
- Siegel, R.; Miller, K.; Fuchs, H.; Jemal, A. Cancer statistics, 2022. CA A Cancer J. Clin. 2022, 72, 7–33. [Google Scholar] [CrossRef]
- Youlden, D.R.; Cramb, S.M.; Baade, P.D. The International Epidemiology of Lung Cancer: Geographical distribution and secular trends. J. Thorac. Oncol. 2008, 3, 819–831. [Google Scholar] [CrossRef]
- Jemal, A.; Center, M.M.; DeSantis, C.; Ward, E.M. Global Patterns of Cancer Incidence and Mortality Rates and TrendsGlobal Patterns of Cancer. Cancer Epidemiol. Biomark. Prev. 2010, 19, 1893–1907. [Google Scholar] [CrossRef]
- Lortet-Tieulent, J.; Rentería, E.; Sharp, L.; Weiderpass, E.; Comber, H.; Baas, P.; Bray, F.; Coebergh, J.W.; Soerjomataram, I. Convergence of decreasing male and increasing female incidence rates in major tobacco-related cancers in Europe in 1988–2010. Eur. J. Cancer 2015, 51, 1144–1163. [Google Scholar] [CrossRef]
- Van der Heyden, J.H.A.; Schaap, M.M.; Kunst, A.E.; Esnaola, S.; Borrell, C.; Cox, B.; Leinsalu, M.; Stirbu, I.; Kalediene, R.; Deboosere, P.; et al. Socioeconomic inequalities in lung cancer mortality in 16 European populations. Lung Cancer 2009, 63, 322–330. [Google Scholar] [CrossRef]
- Walters, S.; Maringe, C.; Coleman, M.; Peake, M.D.; Butler, J.; Young, N.; Bergström, S.; Hanna, L.; Jakobsen, E.; Kölbeck, K.; et al. Lung cancer survival and stage at diagnosis in Australia, Canada, Denmark, Norway, Sweden and the UK: A population-based study, 2004–2007. Thorax 2013, 68, 551–564. [Google Scholar] [CrossRef]
- Welch, H.G.; Schwartz, L.M.; Woloshin, S. Are increasing 5-year survival rates evidence of success against cancer? JAMA 2000, 283, 2975–2978. [Google Scholar] [CrossRef]
- Lin, D.; Wang, M.; Chen, Y.; Gong, J.; Chen, L.; Shi, X.; Lan, F.; Chen, Z.; Xiong, T.; Sun, H.; et al. Trends in Intracranial Glioma Incidence and Mortality in the United States, 1975–2018. Front. Oncol. 2021, 11, 748061. [Google Scholar] [CrossRef] [PubMed]
- Soffietti, R.; Ahluwalia, M.; Lin, N.; Rudà, R. Management of brain metastases according to molecular subtypes. Nat. Rev. Neurol. 2020, 16, 557–574. [Google Scholar] [CrossRef] [PubMed]
- McKay, M.J. Brain metastases: Increasingly precision medicine—A narrative review. Ann. Transl. Med. 2021, 9, 1629. [Google Scholar] [CrossRef]
- Ceresoli, G.L.; Cappuzzo, F.; Gregorc, V.; Bartolini, S.; Crino, L.; Villa, E. Gefitinib in patients with brain metastases from non-small-cell lung cancer: A prospective trial. Ann. Oncol. 2004, 15, 1042–1047. [Google Scholar] [CrossRef] [PubMed]
- Welsh, J.W.; Komaki, R.; Amini, A.; Munsell, M.F.; Unger, W.; Allen, P.K.; Chang, J.Y.; Wefel, J.S.; McGovern, S.L.; Garland, L.L.; et al. Phase II trial of erlotinib plus concurrent whole-brain radiation therapy for patients with brain metastases from non–small-cell lung cancer. J. Clin. Oncol. 2013, 31, 895. [Google Scholar] [CrossRef]
- Mok, T.S.; Wu, Y.L.; Ahn, M.J.; Garassino, M.C.; Kim, H.R.; Ramalingam, S.S.; Shepherd, F.A.; He, Y.; Akamatsu, H.; Theelen, W.S.; et al. Osimertinib or platinum–pemetrexed in EGFR T790M–positive lung cancer. N. Engl. J. Med. 2017, 376, 629–640. [Google Scholar] [CrossRef]
- Achrol, A.S.; Rennert, R.C.; Anders, C.; Soffietti, R.; Ahluwalia, M.S.; Nayak, L.; Peters, S.; Arvold, N.D.; Harsh, G.R.; Steeg, P.S.; et al. Brain metastases. Nat. Rev. Dis. Prim. 2019, 5, 5. [Google Scholar] [CrossRef]
- McArthur, G.; Maio, M.; Arance, A.; Nathan, P.; Blank, C.; Avril, M.-F.; Garbe, C.; Hauschild, A.; Schadendorf, D.; Hamid, O.; et al. Vemurafenib in metastatic melanoma patients with brain metastases: An open-label, single-arm, phase 2, multicentre study. Ann. Oncol. 2017, 28, 634–641. [Google Scholar] [CrossRef]
- Long, G.V.; Trefzer, U.; Davies, M.A.; Kefford, R.F.; Ascierto, P.A.; Chapman, P.B.; Puzanov, I.; Hauschild, A.; Robert, C.; Algazi, A.; et al. Dabrafenib in patients with Val600Glu or Val600Lys BRAF-mutant melanoma metastatic to the brain (BREAK-MB): A multicentre, open-label, phase 2 trial. Lancet Oncol. 2012, 13, 1087–1095. [Google Scholar] [CrossRef]
- Mittapalli, R.K.; Vaidhyanathan, S.; Dudek, A.Z.; Elmquist, W.F. Mechanisms limiting distribution of the threonine-protein kinase B-RaFV600E inhibitor dabrafenib to the brain: Implications for the treatment of melanoma brain metastases. J. Pharmacol. Exp. Ther. 2013, 344, 655–664. [Google Scholar] [CrossRef]
- Bachelot, T.; Romieu, G.; Campone, M.; Diéras, V.; Cropet, C.; Dalenc, F.; Jimenez, M.; Le Rhun, E.; Pierga, J.-Y.; Gonçalves, A.; et al. Lapatinib plus capecitabine in patients with previously untreated brain metastases from HER2-positive metastatic breast cancer (LANDSCAPE): A single-group phase 2 study. Lancet Oncol. 2013, 14, 64–71. [Google Scholar] [CrossRef]
- Murthy, R.K.; Loi, S.; Okines, A.; Paplomata, E.; Hamilton, E.; Hurvitz, S.A.; Lin, N.U.; Borges, V.; Abramson, V.; Anders, C.; et al. Tucatinib, trastuzumab, and capecitabine for HER2-positive metastatic breast cancer. N. Engl. J. Med. 2020, 382, 597–609. [Google Scholar] [CrossRef] [PubMed]
- Tawbi, H.A.; Forsyth, P.A.; Algazi, A.; Hamid, O.; Hodi, F.S.; Moschos, S.J.; Khushalani, N.I.; Lewis, K.; Lao, C.D.; Postow, M.A.; et al. Combined nivolumab and ipilimumab in melanoma metastatic to the brain. N. Engl. J. Med. 2018, 379, 722–730. [Google Scholar] [CrossRef]
- Goldberg, S.B.; Schalper, K.A.; Gettinger, S.N.; Mahajan, A.; Herbst, R.S.; Chiang, A.C.; Lilenbaum, R.; Wilson, F.H.; Omay, S.B.; Yu, J.B.; et al. Pembrolizumab for management of patients with NSCLC and brain metastases: Long-term results and biomarker analysis from a non-randomised, open-label, phase 2 trial. Lancet Oncol. 2020, 21, 655–663. [Google Scholar] [CrossRef]
- Schmid, P.; Rugo, H.S.; Adams, S.; Schneeweiss, A.; Barrios, C.H.; Iwata, H.; Diéras, V.; Henschel, V.; Molinero, L.; Chui, S.Y.; et al. Atezolizumab plus nab-paclitaxel as first-line treatment for unresectable, locally advanced or metastatic triple-negative breast cancer (IMpassion130): Updated efficacy results from a randomised, double-blind, placebo-controlled, phase 3 trial. Lancet Oncol. 2020, 21, 44–59. [Google Scholar] [CrossRef]


| Characteristic | Incidence | Incidence-Based Mortality | ||
|---|---|---|---|---|
| Cases, No. (%) | Rate (95% CI) | Cases, No. (%) | Rate (95% CI) | |
| Overall | 66,655 (100) | 5.41 (5.37, 5.46) | 57,692 (100) | 4.7 (4.67, 4.74) |
| Age at Diagnosis/Death, y | ||||
| 20–39 | 1181 (1.77) | 0.27 (0.26, 0.29) | 694 (1.2) | 0.16 (0.15, 0.17) |
| 40–59 | 18,283 (27.43) | 3.8 (3.75, 3.86) | 14,154 (24.53) | 2.92 (2.88, 2.97) |
| 60–79 | 39,757 (59.65) | 17.56 (17.38, 17.73) | 35,386 (61.34) | 15.72 (15.56, 15.89) |
| ≥80 | 7434 (11.15) | 13.83 (13.52, 14.15) | 7458 (12.93) | 13.85 (13.54, 14.17) |
| Sex | ||||
| Male | 34,821 (52.24) | 6.21 (6.15, 6.28) | 30,657 (53.14) | 5.53 (5.47, 5.59) |
| Female | 31,834 (47.76) | 4.8 (4.75, 4.86) | 27,035 (46.86) | 4.07 (4.02, 4.12) |
| Race | ||||
| White | 53,257 (79.9) | 5.41 (5.36, 5.45) | 46,491 (80.58) | 4.73 (4.68, 4.77) |
| Black | 7418 (11.13) | 6.31 (6.16, 6.46) | 6535 (11.33) | 5.65 (5.51, 5.79) |
| Other* | 5980 (8.97) | 4.63 (4.52, 4.76) | 4666 (8.09) | 3.69 (3.58, 3.8) |
| Median Household Income | ||||
| <75,000 | 47,386 (71.09) | 5.64 (5.59, 5.69) | 41,445 (71.84) | 4.95 (4.9, 5) |
| ≥75,000 | 19,269 (28.91) | 4.94 (4.87, 5.01) | 16,247 (28.16) | 4.19 (4.12, 4.26) |
| Rural–Urban Distribution | ||||
| Urban | 56,598 (84.91) | 5.26 (5.21, 5.3) | 48,649 (84.33) | 4.54 (4.5, 4.58) |
| Rural | 10,057 (15.09) | 6.6 (6.47, 6.73) | 9043 (15.67) | 5.91 (5.78, 6.03) |
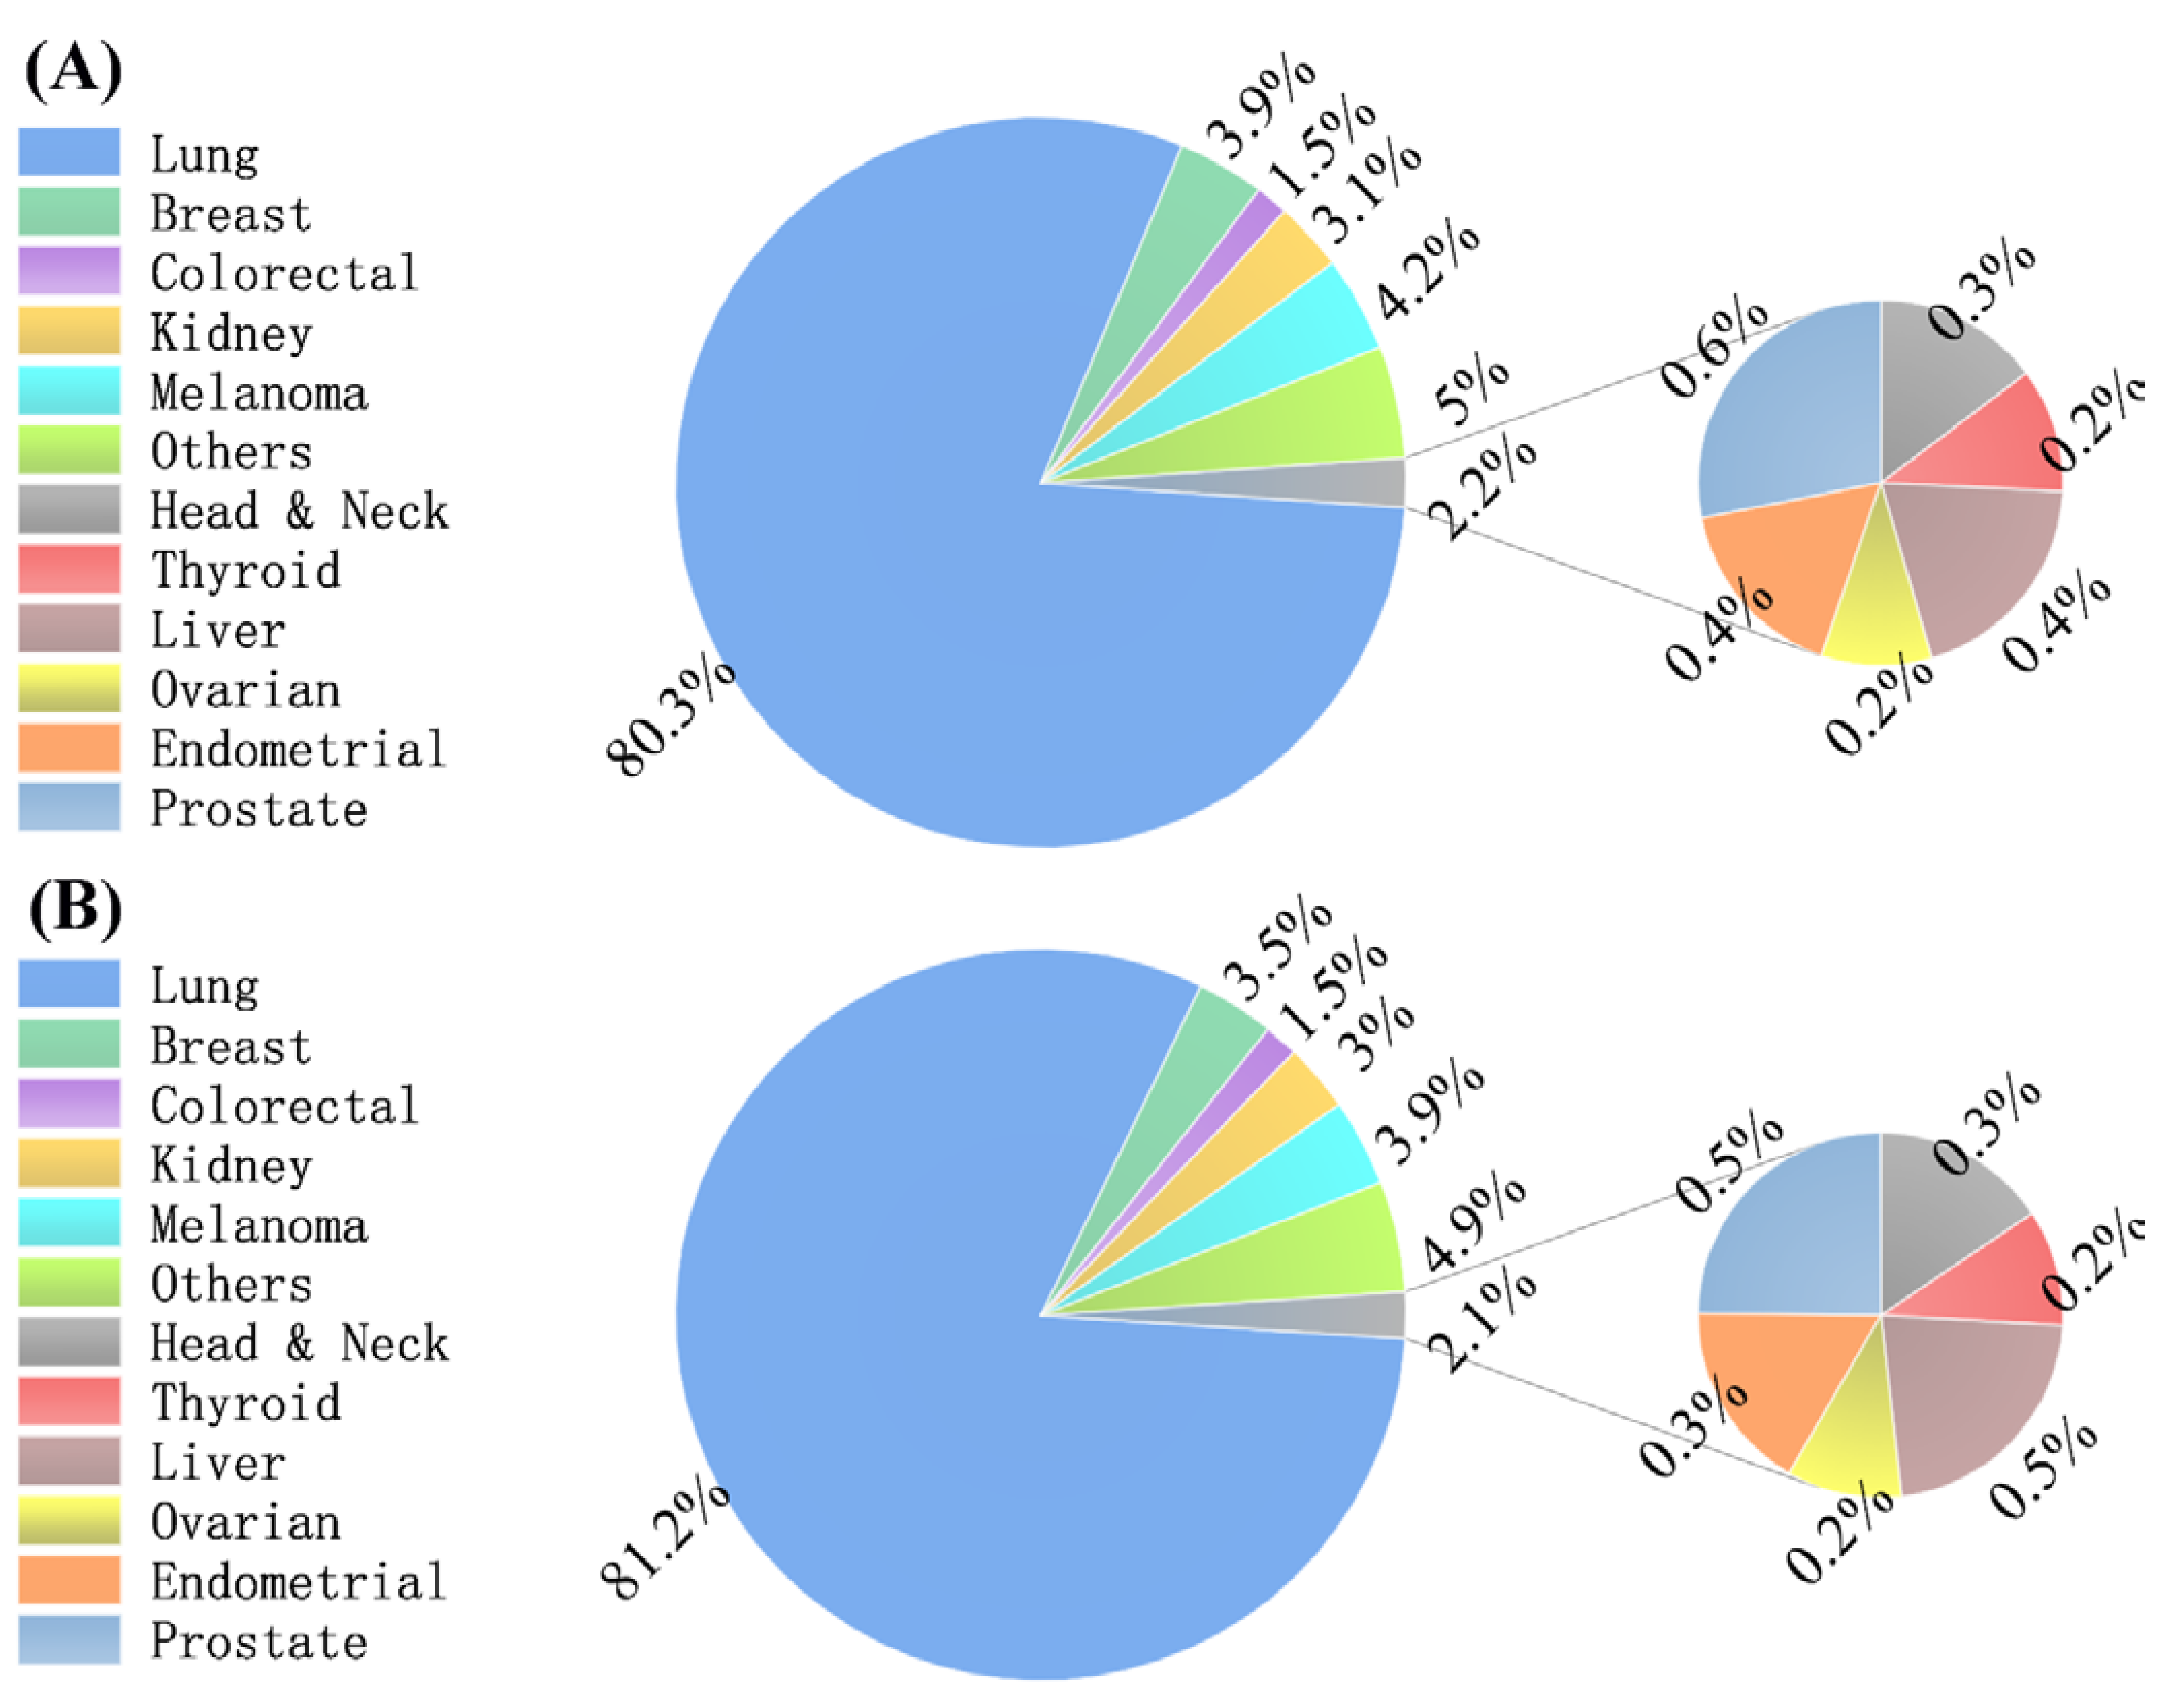
| Primary Tumor Site | ||||
| Head and neck | 213 (0.32) | 0.02 (0.02, 0.02) | 185 (0.32) | 0.02 (0.01, 0.02) |
| Thyroid | 159 (0.24) | 0.01 (0.01, 0.02) | 122 (0.21) | 0.01 (0.01, 0.01) |
| Lung | 53,492 (80.25) | 4.34 (4.30, 4.38) | 46,854 (81.21) | 3.82 (3.79, 3.86) |
| Breast | 2571 (3.86) | 0.21 (0.20, 0.22) | 2004 (3.47) | 0.16 (0.16, 0.17) |
| Colorectal | 977 (1.47) | 0.08 (0.07, 0.08) | 868 (1.5) | 0.07 (0.07, 0.08) |
| Kidney | 2054 (3.08) | 0.16 (0.16, 0.17) | 1733 (3) | 0.14 (0.13, 0.15) |
| Melanoma | 2812 (4.22) | 0.23 (0.22, 0.24) | 2231 (3.87) | 0.18 (0.18, 0.19) |
| Liver | 284 (0.43) | 0.02 (0.02, 0.03) | 264 (0.46) | 0.02 (0.02, 0.02) |
| Ovarian | 141 (0.21) | 0.01 (0.01, 0.01) | 121 (0.21) | 0.01 (0.01, 0.01) |
| Endometrial | 240 (0.36) | 0.02 (0.02,0.02) | 199 (0.34) | 0.02 (0.01,0.02) |
| Prostate | 406 (0.61) | 0.03 (0.03, 0.04) | 295 (0.51) | 0.02 (0.02, 0.03) |
| Other | 3306 (4.96) | 0.27 (0.26, 0.28) | 2816 (4.88) | 0.23 (0.22, 0.24) |
| T-Stage | ||||
| 1 | 7564 (11.35) | 0.60 (0.59, 0.62) | 6235 (10.81) | 0.50 (0.49, 0.51) |
| 2 | 14,227 (21.34) | 1.15 (1.13, 1.17) | 12,385 (21.47) | 1.00 (0.99, 1.02) |
| 3 | 12,502 (18.76) | 1.00 (0.98, 1.02) | 11,087 (19.22) | 0.89 (0.87, 0.91) |
| 4 | 17,786 (26.68) | 1.43 (1.41, 1.45) | 15,584 (27.01) | 1.26 (1.24, 1.28) |
| Other | 15,108 (22.67) | 1.24 (1.22, 1.26) | 12,877 (22.32) | 1.06 (1.04, 1.07) |
| N-Stage | ||||
| 0 | 15,885 (23.83) | 1.29 (1.27, 1.31) | 13,563 (23.51) | 1.11 (1.09, 1.13) |
| 1 | 7909 (11.87) | 0.63 (0.62, 0.65) | 6704 (11.62) | 0.54 (0.52, 0.55) |
| 2 | 23,366 (35.06) | 1.88 (1.86, 1.91) | 20,774 (36.01) | 1.68 (1.66, 1.70) |
| 3 | 11,395 (17.1) | 0.90 (0.89, 0.92) | 9855 (17.08) | 0.78 (0.77, 0.80) |
| Other | 8628 (12.94) | 0.71 (0.69, 0.72) | 7268 (12.6) | 0.60 (0.58, 0.61) |
| Chemotherapy | ||||
| No | 33,272 (49.92) | 2.74 (2.71,2.77) | 30,458 (52.79) | 2.51 (2.49,2.54) |
| Yes | 33,383 (50.08) | 2.67 (2.65,2.7) | 27,234 (47.21) | 2.19 (2.16,2.22) |
| Radiotherapy | ||||
| No | 22,135 (33.21) | 1.82 (1.8,1.85) | 19,909 (34.51) | 1.64 (1.62,1.67) |
| Yes | 44,520 (66.79) | 3.59 (3.56,3.63) | 37,783 (65.49) | 3.06 (3.03,3.09) |
| Surgery | ||||
| No | 62,967 (94.47) | 5.12 (5.08,5.16) | 54,946 (95.24) | 4.48 (4.44,4.52) |
| Yes | 3688 (5.53) | 0.30 (0.29,0.31) | 2746 (4.76) | 0.22 (0.22,0.23) |
| Characteristic | Overall (2010–2019) | Trends | ||||||
|---|---|---|---|---|---|---|---|---|
| 1 | 2 | |||||||
| APC (95% CI) | p-Value | Year | APC (95% CI) | p-Value | Year | APC (95% CI) | p-Value | |
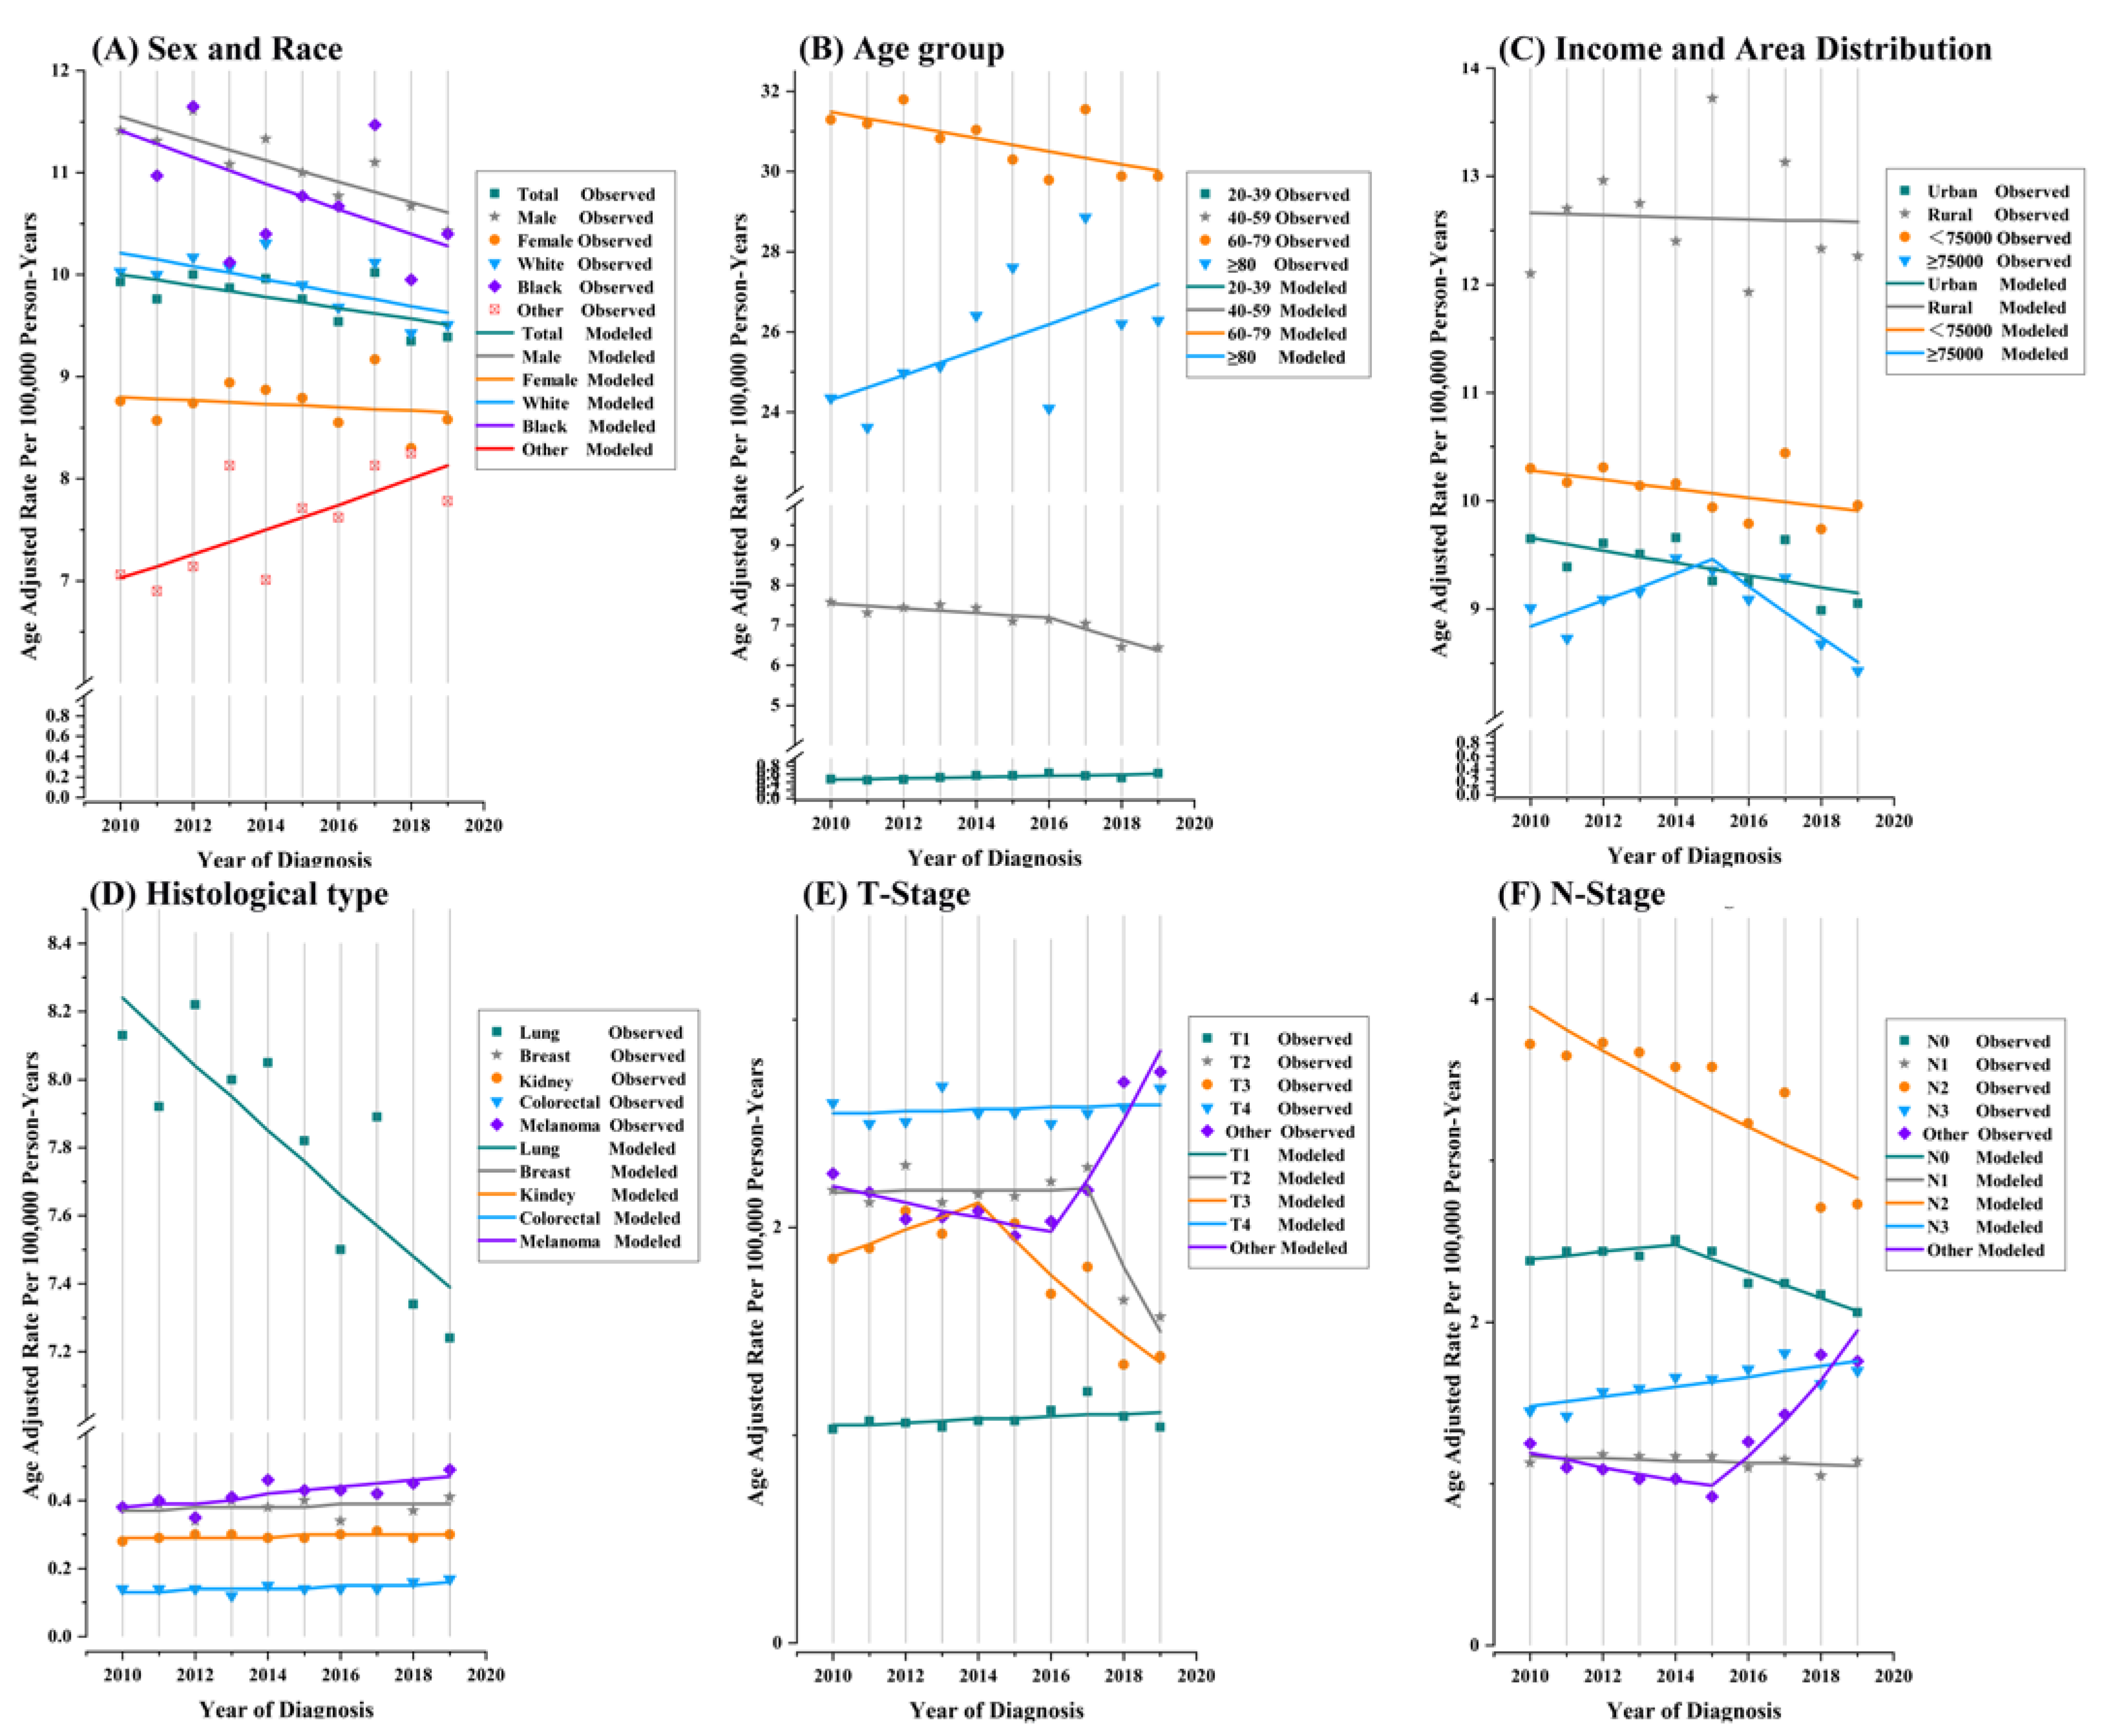
| Overall | −0.6 (−1.1 to 0) | <0.001 | ||||||
| Age at Diagnosis/Death, y | ||||||||
| 20–39 | 2.8 (0.7 to 5) | 0.015 | ||||||
| 40–59 | −1.9 (−3.2 to −0.5) | 0.007 | 2010–2016 | −0.8 (−2.3 to 0.7) | 0.228 | 2016–2019 | −4 (−8.1 to 0.4) | 0.066 |
| 60–79 | −0.5 (−1 to −0.1) | 0.010 | ||||||
| ≥80 | 1.3 (−0.1 to 2.6) | 0.103 | ||||||
| Sex | ||||||||
| Male | −0.9 (−1.4 to −0.5) | <0.001 | ||||||
| Female | −0.2(−0.9 to 0.5) | 0.565 | ||||||
| Race | ||||||||
| White | −0.6 (−1.2 to −0.1) | 0.035 | ||||||
| Black | −1.2 (−2.5 to 0.3) | 0.096 | ||||||
| Other | 1.6 (0.4 to 2.9) | 0.018 | ||||||
| Median Household Income | ||||||||
| <75,000 | −0.4 (−0.9 to 0.1) | 0.111 | ||||||
| ≥75,000 | −0.4 (−1.6 to 0.8) | 0.496 | 2010–2015 | 1.4 (−0.6 to 3.3) | 0.128 | 2015–2019 | −2.6 (−5.2 to 0.1) | 0.053 |
| Rural–Urban Distribution | ||||||||
| Urban | −0.6 (−1.1 to −0.1) | 0.033 | ||||||
| Rural | −0.1 (−1.2 to 1.1) | 0.884 | ||||||
| Primary Tumor Site | ||||||||
| Head and neck | −1 (−4.1 to 2.1) | 0.466 | ||||||
| Thyroid | 5.1 (−6 to 17.4) | 0.337 | ||||||
| Lung | −1.2 (−1.8 to −0.6) | 0.002 | ||||||
| Breast | 0.6 (−1.3 to 2.5) | 0.508 | ||||||
| Colorectal | 1.9 (−0.1 to 3.9) | 0.064 | ||||||
| Kidney | 0.5 (−0.2 to 1.2) | 0.142 | ||||||
| Melanoma | 2.5 (0.9 to 4.2) | 0.008 | ||||||
| Liver | 3.4 (0.4 to 6.5) | 0.029 | ||||||
| Ovarian | 0.3 (−5.4 to 6.3) | 0.919 | ||||||
| Endometrial | 0.5 (−3.5 to 4.7) | 0.774 | ||||||
| Prostate | 3.1 (−1.6 to 8.1) | 0.165 | ||||||
| Other | 4.2 (1.8 to 6.7) | 0.004 | ||||||
| T-Stage | ||||||||
| 1 | 0.7 (−0.5 to 1.8) | 0.217 | ||||||
| 2 | −4.0 (−6.1 to −2) | <0.001 | 2010–2017 | 0.1 (−1.4 to 1.6) | 0.898 | 2017–2019 | −17.2 (−26.2 to −7.1) | 0.008 |
| 3 | −3.5 (−7.3 to 0.5) | 0.084 | 2010–2014 | 3.4 (−5.4 to 13) | 0.381 | 2014–2019 | −8.7 (−14.3 to −2.7) | 0.014 |
| 4 | 0.2 (−0.5 to 0.9) | 0.500 | ||||||
| Other | 2.9 (0.5 to 5.4) | 0.016 | 2010–2016 | −1.7 (−4.3 to 0.9) | 0.147 | 2016–2019 | 13.0 (4.6 to 22.1) | 0.010 |
| N-Stage | ||||||||
| 0 | −1.6 (−2.6 to −0.6) | 0.001 | 2010–2014 | 1 (−1.2 to 3.2) | 0.305 | 2014–2019 | −3.6 (−5.1 to −2.1) | 0.002 |
| 1 | −0.5 (−1.4 to 0.3) | 0.195 | ||||||
| 2 | −3.4 (−5 to −1.7) | 0.002 | ||||||
| 3 | 2.0 (0.8 to 3.2) | 0.004 | ||||||
| Other | 5.7 (2.5 to 8.8) | <0.001 | 2010–2015 | −3.7 (−8.1 to 0.9) | 0.093 | 2015–2019 | 18.6 (11 to 26.7) | 0.001 |
| Chemotherapy | ||||||||
| No | −0.6 (−1.7, 0.5) | 0.219 | ||||||
| Yes | −0.4 (−1.3, 0.5) | 0.388 | 2010–2014 | 1.6 (−0.4, 3.7) | 0.099 | 2014–2019 | −2 (−3.4, −0.6) | 0.016 |
| Radiotherapy | ||||||||
| No | 0.9 (0, 1.7) | 0.04 | ||||||
| Yes | −1.3 (−2.1, −0.4) | 0.008 | ||||||
| Surgery | ||||||||
| No | −0.4 (−1, 0.1) | 0.127 | ||||||
| Yes | −2.7 (−3.9, −1.4) | 0.001 | ||||||
| Characteristic | Overall (2010–2019) | Trends | ||||||
|---|---|---|---|---|---|---|---|---|
| 1 | 2 | |||||||
| APC (95% CI) | p-Value | Year | APC (95% CI) | p-Value | Year | APC (95% CI) | p-Value | |
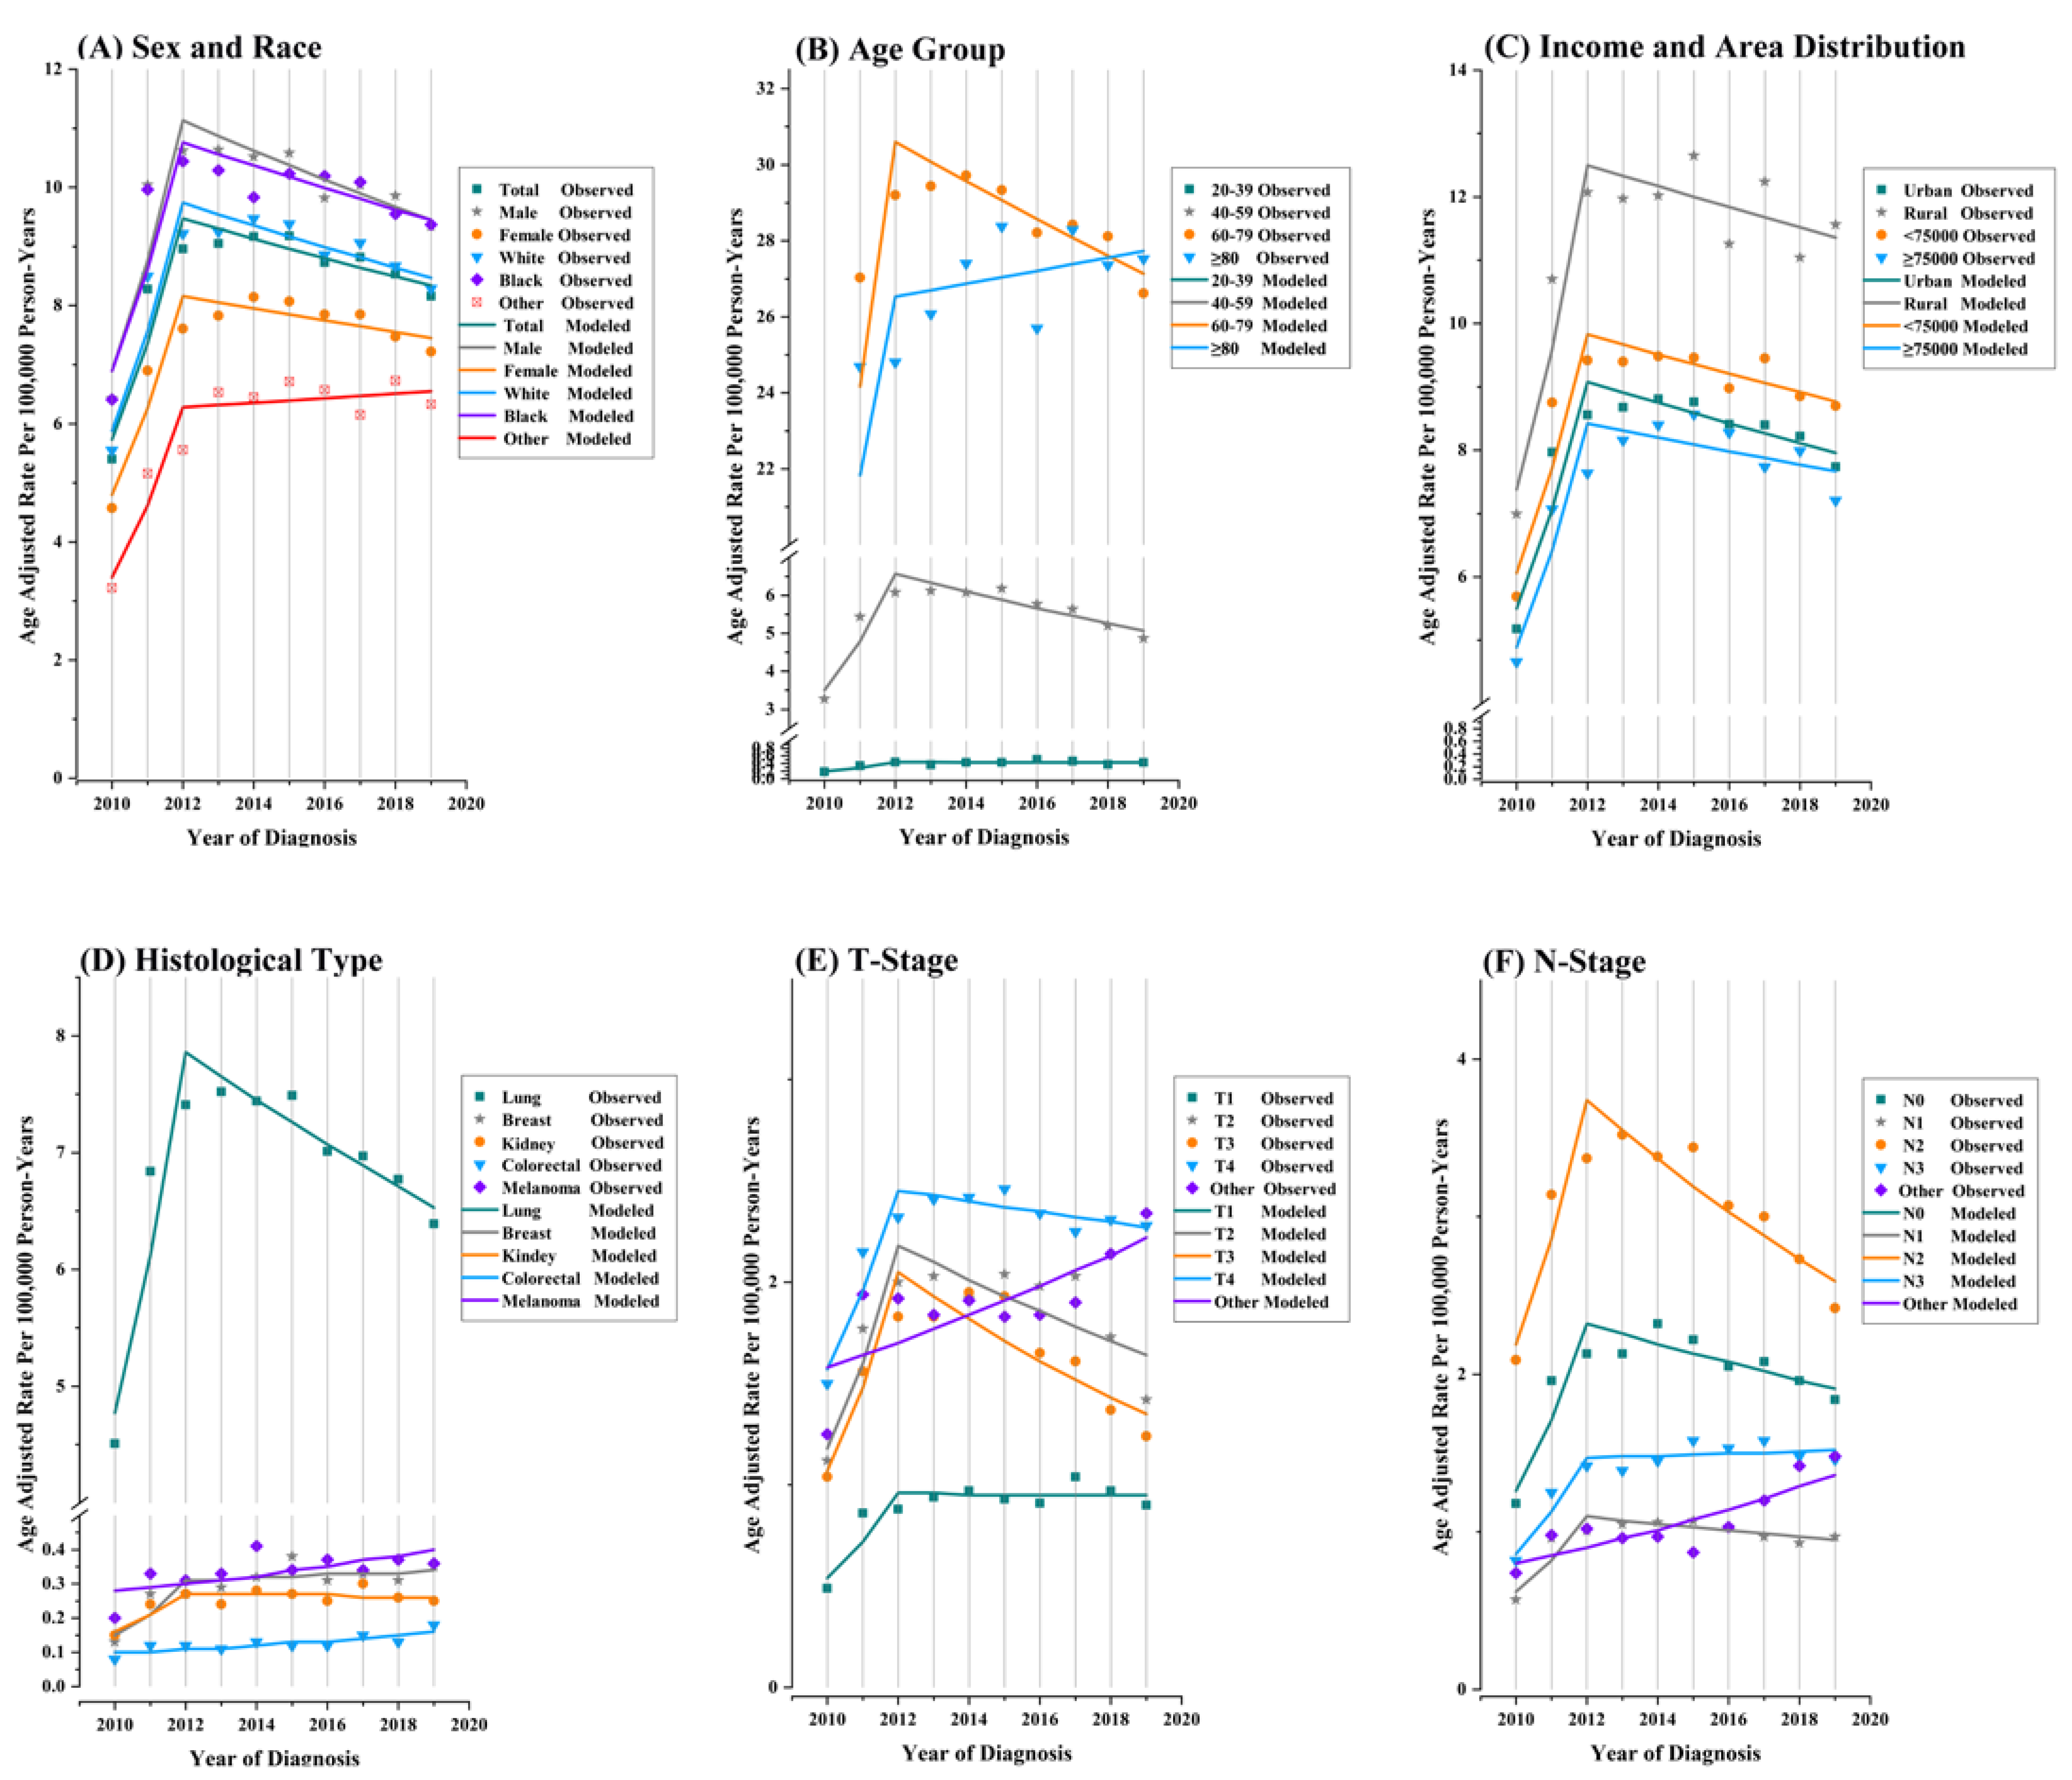
| Over | 4.3 (2.8 to 5.8) | <0.001 | 2010–2012 | 28.6 (19 to 38.9) | <0.001 | 2012–2019 | −1.8 (−2.8 to −0.8) | 0.006 |
| Age at Diagnosis/Death, y | ||||||||
| 20–39 | 9.2 (0.9 to 18.3) | 0.030 | 2010–2012 | 49.9 (−2.1 to 129.6) | 0.058 | 2012–2019 | −0.2 (−5.8 to 5.6) | 0.921 |
| 40–59 | 37.1 (20 to 56.5) | 0.001 | 2010–2012 | 37.1 (20 to 56.5) | 0.002 | 2012–2019 | −3.6 (−5.3 to −1.9) | 0.003 |
| 60–78 | 26.6 (18.8 to 34.9) | <0.001 | 2010–2012 | 26.6 (18.8 to 34.9) | <0.001 | 2012–2019 | −1.7 (−2.5 to −0.9) | 0.003 |
| ≥80 | 4.9 (2.2 to 7.8) | <0.001 | 2010–2012 | 21.5 (5.4 to 40.2) | 0.017 | 2012–2019 | 0.6 (−1.3 to 2.6) | 0.432 |
| Sex | ||||||||
| Male | 3.6 (2.1 to 5.1) | <0.001 | 2010–2012 | 27.2 (17.6 to 37.5) | 0.001 | 2012–2019 | −2.3 (−3.3 to −1.3) | 0.002 |
| Female | 5.0 (3.1 to 7) | <0.001 | 2010–2012 | 30.4 (17.9 to 44.1) | 0.001 | 2012–2019 | −1.3 (−2.6 to 0.1) | 0.056 |
| Race | ||||||||
| White | 4.1 (2.4 to 5.9) | <0.001 | 2010–2012 | 28.6 (17.6 to 40.8) | 0.001 | 2012–2019 | −2.0 (−3.1 to −0.8) | 0.008 |
| Black | 3.6 (1.7 to 5.5) | <0.001 | 2010–2012 | 25.0 (13.3 to 37.8) | 0.002 | 2012–2019 | −1.8 (−3.1 to −0.6) | 0.015 |
| Other | 7.5 (5.1 to 10.1) | <0.001 | 2010–2012 | 35.8 (20 to 53.8) | 0.001 | 2012–2019 | 0.6 (−1 to 2.3) | 0.391 |
| Median Household Income | ||||||||
| <75,000 | 4.2 (2.4 to 6) | <0.001 | 2010–2012 | 27.3 (16.3 to 39.5) | 0.001 | 2012–2019 | −1.6 (−2.8 to −0.4) | 0.019 |
| ≥75,000 | 5.1 (2.2 to 8.1) | 0.001 | 2010–2012 | 31.2 (12.8 to 52.7) | 0.006 | 2012–2019 | −1.3 (−3.3 to 0.7) | 0.149 |
| Rural–Urban Distribution | ||||||||
| Urban | 4.2 (2.7 to 5.8) | <0.001 | 2010–2012 | 28.5 (18.7 to 39.1) | <0.001 | 2012–2019 | −1.9 (−2.9 to −0.8) | 0.006 |
| Rural | 4.9 (1.7 to 8.2) | 0.002 | 2010–2012 | 30.2 (10.3 to 53.7) | 0.009 | 2012–2019 | −1.4 (−3.5 to 0.9) | 0.174 |
| Primary Tumor Site | ||||||||
| Head and neck | 3.9 (−1.7 to 9.7) | 0.148 | ||||||
| Thyroid | - | - | ||||||
| Lung | 3.6 (2.1 to 5) | <0.001 | 2010–2012 | 28.4 (19.2 to 38.2) | <0.001 | 2012–2019 | −2.6 (−3.6 to −1.6) | 0.001 |
| Breast | 9.8 (3.1 to 17) | 0.004 | 2010–2012 | 44.8 (3.3 to 103) | 0.037 | 2012–2019 | 1.4 (−3 to 6.1) | 0.454 |
| Colorectal | 5.7 (2.3 to 9.3) | 0.005 | ||||||
| Kidney | 5.6 (−0.3 to 11.8) | 0.064 | 2010–2012 | 30.1 (−4.1 to 76.7) | 0.077 | 2012–2019 | −0.6 (−4.6 to 3.6) | 0.728 |
| Melanoma | 4.1 (0 to 8.4) | 0.048 | ||||||
| Liver | 4.4 (−1.7 to 10.8) | 0.139 | ||||||
| Ovarian | 0.7 (−9.2 to 11.6) | 0.885 | ||||||
| Endometrial | 1.9 (−4.9 to 9.1) | 0.554 | ||||||
| Prostate | 17.7 (5.8 to 30.9) | 0.003 | 2010–2012 | 93.4 (9.4 to 242) | 0.031 | 2012–2019 | 2.1 (−5.4 to 10.2) | 0.512 |
| Other | 7.9 (2.2 to 13.9) | 0.006 | 2010–2012 | 27 (−4.8 to 69.6) | 0.086 | 2012–2019 | 3 (−0.9 to 7) | 0.109 |
| T-Stage | ||||||||
| 1 | 6.5 (2.7 to 10.5) | 0.001 | 2010–2012 | 33.6 (9.9 to 62.3) | 0.012 | 2012–2019 | −0.2 (−2.7 to 2.5) | 0.880 |
| 2 | 3.8 (−2.9 to 10.9) | 0.275 | 2010–2012 | 36.2 (−4.6 to 94.3) | 0.076 | 2012–2019 | −4 (−8.4 to 0.7) | 0.080 |
| 3 | 2.6 (−2.5 to 8) | 0.327 | 2010–2012 | 38.8 (5.5 to 82.6) | 0.028 | 2012–2019 | −5.9 (−9.3 to −2.4) | 0.008 |
| 4 | 4.2 (2.7 to 5.7) | <0.001 | 2010–2012 | 25.0 (15.5 to 35.3) | 0.001 | 2012–2019 | −1.1 (−2.1 to 0) | 0.044 |
| Other | 3.9 (0.7 to 7.1) | 0.022 | ||||||
| N-Stage | ||||||||
| 0 | 4.7 (1.5 to 8) | 0.003 | 2010–2012 | 35.5 (15 to 59.7) | 0.005 | 2012–2019 | −2.7 (−4.8 to −0.6) | 0.023 |
| 1 | 4.9 (2.7 to 7.2) | <0.001 | 2010–2012 | 33.4 (19.1 to 49.5) | 0.001 | 2012–2019 | −2.0 (−3.5 to −0.5) | 0.017 |
| 2 | 1.9 (−1.1 to 5) | 0.225 | 2010–2012 | 30.6 (11.1 to 53.6) | 0.008 | 2012–2019 | −5.1 (−7.1 to −3) | 0.002 |
| 3 | 6.5 (2.9 to 10.1) | <0.001 | 2010–2012 | 30.5 (9 to 56.3) | 0.013 | 2012–2019 | 0.4 (−1.9 to 2.9) | 0.657 |
| Other | 6.1 (2.9 to9.4) | 0.002 | ||||||
| Chemotherapy | ||||||||
| No | 1.6 (−0.3, 3.6) | 0.094 | 2010–2012 | 14.4 (3.3, 26.7) | 0.02 | 2012–2019 | −1.7 (−3.1, −0.4) | 0.022 |
| Yes | 8.4 (5.5, 11.3) | <0.001 | 2010–2012 | 54.1 (33.6, 77.8) | 0.001 | 2012–2019 | −2 (−3.8, −0.1) | 0.042 |
| Radiotherapy | ||||||||
| No | 3.2 (1.2, 5.4) | 0.002 | 2010–2012 | 14.1 (2.4, 27.2) | 0.026 | 2012–2019 | 0.3 (−1.1, 1.8) | 0.591 |
| Yes | 4.9 (3.2, 6.7) | <0.001 | 2010–2012 | 38 (26.1, 50.9) | <0.001 | 2012–2019 | −3 (−4.1, −1.8) | 0.001 |
| Surgery | ||||||||
| No | 4.1 (2.7, 5.6) | <0.001 | 2010–2012 | 27.8 (18.5, 37.9) | <0.001 | 2012–2019 | −1.8 (−2.8, −0.8) | 0.006 |
| Yes | 7.4 (3.9, 10.9) | <0.001 | 2010–2012 | 46.9 (23.6, 74.6) | 0.002 | 2012–2019 | −1.8 (−4.1, 0.5) | 0.094 |
Publisher’s Note: MDPI stays neutral with regard to jurisdictional claims in published maps and institutional affiliations. |
© 2022 by the authors. Licensee MDPI, Basel, Switzerland. This article is an open access article distributed under the terms and conditions of the Creative Commons Attribution (CC BY) license (https://creativecommons.org/licenses/by/4.0/).
Share and Cite
Che, W.; Liu, J.; Fu, T.; Wang, X.; Lyu, J. Recent Trends in Synchronous Brain Metastasis Incidence and Mortality in the United States: Ten-Year Multicenter Experience. Curr. Oncol. 2022, 29, 8374-8389. https://doi.org/10.3390/curroncol29110660
Che W, Liu J, Fu T, Wang X, Lyu J. Recent Trends in Synchronous Brain Metastasis Incidence and Mortality in the United States: Ten-Year Multicenter Experience. Current Oncology. 2022; 29(11):8374-8389. https://doi.org/10.3390/curroncol29110660
Chicago/Turabian StyleChe, Wenqiang, Jie Liu, Tengyue Fu, Xiangyu Wang, and Jun Lyu. 2022. "Recent Trends in Synchronous Brain Metastasis Incidence and Mortality in the United States: Ten-Year Multicenter Experience" Current Oncology 29, no. 11: 8374-8389. https://doi.org/10.3390/curroncol29110660
APA StyleChe, W., Liu, J., Fu, T., Wang, X., & Lyu, J. (2022). Recent Trends in Synchronous Brain Metastasis Incidence and Mortality in the United States: Ten-Year Multicenter Experience. Current Oncology, 29(11), 8374-8389. https://doi.org/10.3390/curroncol29110660