Article

Model-Based Characterization of the Metabolism of Recombinant Adeno-Associated Virus (rAAV) Production via Human Embryonic Kidney (HEK293) Cells

by
Somaiyeh Khodadadi Karimvand
1,
Miroslava Cuperlovic-Culf
2,3,
Amine A. Kamen
4 and
Miodrag Bolic
1,*
1
School of Electrical Engineering and Computer Science, University of Ottawa, Ottawa, ON K1N 6N5, Canada
2
Digital Technologies Research Center, National Research Council, Ottawa, ON K1A 0R6, Canada
3
Department of Biochemistry, Microbiology, and Immunology, Faculty of Medicine, University of Ottawa, Ottawa, ON K1H 8M5, Canada
4
Department of Bioengineering, McGill University, Montreal, QC H3A 0E9, Canada
*
Author to whom correspondence should be addressed.
Bioengineering 2025, 12(4), 345; https://doi.org/10.3390/bioengineering12040345
Submission received: 18 February 2025 / Revised: 10 March 2025 / Accepted: 21 March 2025 / Published: 27 March 2025
(This article belongs to the Section Biochemical Engineering)

Abstract

In this paper, we present a kinetic–metabolic model describing adeno-associated virus (AAV) production via HEK293 cells that encompasses the main metabolic pathways, namely, glycolysis, tricarboxylic acid cycle (TCA), pyruvate fates, the pentose phosphate pathway, anaplerotic reaction, amino acid metabolism, nucleotides synthesis, biomass synthesis, and the metabolic pathways of protein synthesis of the AAV (capsid and Rep proteins). For the modeling, Michaelis–Menten kinetics was assumed to define the metabolic model. A dataset from bioreactor cultures containing metabolite profiles of adeno-associated virus 6 (AAV6) production via triple transient transfection in a low-cell-density culture, including the concentration profiles of glutamine, glutamic acid, glucose, lactate, and ammonium, was utilized for fitting and computing the model parameters. The model that resulted from the adjusted parameters defined the experimental data well. Subsequently, a Sobol-based global sensitivity analysis procedure was applied to determine the most sensitive parameters in the final model.

1. Introduction

Adeno-associated viruses (AAVs), which belong to the Parvoviridae family, are small single-stranded DNA viruses that are non-enveloped and inherently unable to replicate independently. Therefore, they need a helper virus (adenovirus or herpes simplex virus (HSV)) to provide the genes required for vector replication. The AAV is characterized by a small protein capsid that contains a single-stranded DNA genome. Due to their inability to generate disease, AAVs are excellent candidates for gene therapy [1]. Their high safety due to low toxicity, robust and long-term transgene expression, and the availability of viral serotypes have recently made recombinant adeno-associated virus (rAAV) vectors some of the most widely used outstanding choices for gene delivery vectors in the pre-clinical models of human disease. The increase in demand for gene therapy products has created the need to produce large quantities of rAAVs.
A mammalian cell culture platform, e.g., Chinese hamster ovary (CHO) cells and Human Embryonic Kidney 293 (HEK 293), has been successfully employed in the technology of industrial biopharmaceutical drugs through the advancements in their capability to express human proteins with proper processing. However, due to the lack of certain sugar-transferring enzymes, CHO cells cannot perform all types of human glycosylation [2]. Furthermore, by producing immunogenic glycan structures, CHO cells can increase the drug’s clearance and reduce the efficacy [3].
CHO cells naturally release virus-like particles (VLPs) into the culture medium. These VLPs must either be inactivated or eliminated from the final recombinant product during downstream processing (DSP). Thus, another significant limitation of CHO cells lies in their tendency to produce retroviral VLPs, which cannot be separated from AAV particles [4].
The most common cell lines used in the production of AAVs for preclinical and clinical studies are insect cells, mainly Spodoptera frugiperda (Sf9) cells, Henrietta Lacks (HeLa) cells, Baby Hamster Kidney (BHK) cells [5], and the transient transfection of HEK293 cells. Currently, HEK293 is known as the most extensively used human cell line for the transient transfection of rapid production of rAAVs. HEK293 cells are the preferred cell expression platform for rAAV production. Several metabolic network models have been reported in the literature for the HEK293 cell line. Abbate et al. recently presented a detailed model of HEK293 metabolism [6]. It should be noted that changes in the cell metabolism of HEK293 cells due to the transfection effect can change the rAAV viral vector production process.
Today, there is an urgent need to improve rAAV manufacturing to fulfill the high requirements of the viral vectors for preclinical/clinical studies. However, the transfection-based manufacturing of rAAV viral vectors remains challenging due to low yields of final production and a low fraction of full capsids in the harvesting step [7,8]. In other words, the main problem of rAAV production is the low yield of capsids containing a therapeutic element, which leads to high costs due to additional purification steps to remove empty particles. Consequently, increasing attention has been directed to optimizing the vector titer, purification of high-titer rAAVs, and increasing the productivity [4]. Thus, different strategies, such as chromatography modes, including size exclusion and ion exchange, were developed for AAV purification [9,10]. The increasing use of AAVs as a vector system is mostly due to the very efficient long-term expression of the therapeutic gene in terminally differentiated cells and the simplicity of the genome. Since an AAV requires a helper virus to replicate successfully in human cells, a significant change in the development of AAV design was the use of plasmids for rAAVs production, and the most common technique is the utilization of the triple transfection of HEK293 cells. Nguyen et al. 2021 presented a mechanistic model for synthesizing rAAV viral vectors by triple plasmid transfection in the biomanufacturing process [11].
Metabolic modeling is a powerful tool emerging as a promising alternative to the study, design, and quantitative evaluation of biological processes. Achieving such models requires the use of kinetic models to encapsulate their behavior. Indeed, mathematical kinetic modeling provides the optimal framework for characterizing the dynamic properties of mammalian cell culture [12,13,14].
Nowadays, developing in silico mathematical models to understand the mechanism of processes; predict the responses to various process inputs; and thus, minimize the time and cost of production optimization can be considered a promising tool. The mechanical models, developed based on chemical and biological principles, can help us understand the mechanisms and regulation of cell growth and production. However, due to the biological process’s complexity and our lack of knowledge, it is usually difficult to develop a completely accurate model.
To our knowledge, a detailed kinetic mechanistic model related to AAV production in the HEK293 cell line platform has not been reported yet. This study aimed to present a mechanical, mathematical model for the metabolic pathways of the rAAV viral vector production process within the HEK293 cell platform based on flux kinetic expressions. Indeed, a metabolic model framework based on flux kinetics was developed. The model was successfully validated by an experimental metabolic dataset of a bioreactor culture to optimize the model parameters. In what follows, the sensitivity analysis of the optimized parameters is performed to evaluate their impacts on the final quantity of production progress.

2. Theoretical Background

All data analysis tasks, including the model fitting and sensitivity analysis, were conducted using the MATLAB 2019b software environment.

2.1. Fitting Process

To obtain precise parameter constants, the kinetic process was fitted using the efficient, robust, and iterative non-linear regression algorithms known as Newton–Gauss–Levenberg/Marquardt (NGL/M) [15]. Herein, in the NGL/M algorithm, the non-linear parameters subjected to fitting were the Km (metabolism constant), υmax (maximum velocity), and C0 (initial concentration of an involved component) of the reaction mechanism defining the matrix of metabolite profiles. These parameters were refined to minimize the sum of the squares of the residual matrix. The non-linearity of the parameters arises from the inherent non-linear nature of the relationship between the parameters and the residuals.
In the iterative NGL/M algorithm, the process begins with an initial estimation of each parameter (p). The parameter vector is then refined by incorporating an appropriate parameter shift vector δp, leading to a more refined fit, although it may still not be perfect. This iterative process is repeated until the optimal solution is achieved [16].
The parameters of the model were fitted based on measured data by minimizing the sum of the mean squared error (SMSE) between the measured and estimated model output as follows:
S M S E = i n ( y i ŷ i ) 2 n
where n is the number of data points, yi is the experimental measured data, and ŷi is the corresponding predicted result.
The concentration profiles of all the involved species were modeled using a set of numerical ordinary differential equations (ODE solver) that describe the hard model of the corresponding biokinetic equations. Michaelis–Menten kinetics was employed to investigate the kinetic parameters and optimize the Km and υmax values.

2.2. Global Sensitivity Analysis

Sensitivity analysis (SA) is a critical step in identifying and prioritizing significant reactions and parameters, as well as examining how variations in input parameters impact the output of a system or model. This analysis facilitates a comprehensive understanding of the system’s sensitivity to changes in each input parameter. Its applicability extends across diverse fields, including engineering, environmental science, systems control, process optimization, chemical and reactor design, and cell biology.
These valuable mathematical tools hold significant importance in modeling and the assessment of risks associated with complex systems, categorically falling into three distinct types: screening methods, local sensitivity analysis methods, and global sensitivity analysis methods. Conventional local sensitivity methods typically rely on linear assumptions and encounter limitations when applied to nonlinear systems. In contrast, the more complicated global sensitivity methods may pose challenges due to time constraints.
Global sensitivity analysis (GSA) offers valuable insights into the robustness and reliability of a model or system, shedding light on the impact of design variables on its performance. Such information is valuable for informing optimization processes. The input parameters within a system encompass a range of factors, including physicochemical attributes, such as kinetic constants and thermodynamic equilibria, along with initial conditions and operating conditions. As physicochemical parameters are commonly derived from experimental measurements or theoretical calculations, inherent uncertainties often accompany these values. So, GSA played a crucial role in categorizing parameters according to their impact reduction. Furthermore, it facilitated the exclusion of parameters that had a minimal influence on the model sensitivity from the subsequent optimization cycle, thus maintaining them at their initial values [15].
Various types of global sensitivity analyses are available, including the weighted average of local sensitivity analysis, partial rank correlation coefficient, multiparametric sensitivity analysis, Fourier amplitude sensitivity analysis, and Sobol’s method. Among these methods, Sobol sensitivity analysis based on variance decomposition stands out as one of the most powerful techniques thus far [17].
Sobol introduced the variance-based method, along with its corresponding sensitivity concept, which relies on a high-dimensional model representation. This method breaks down the variance of the model output Y = f(X) = f (X1, X2, , Xn) into different terms (first order, second order, and higher orders), accounting for the input parameters and their interactions, as shown in the following multidimensional expression:
Y = f X = f 0 + i = 1 n f i X i + i = 1 n j > i n f i , j X i , X j + + f 1,2 n ( X 1 , X 2 , X n )  
where f0, fi (Xi), and fij (Xi, Xj) represent the mean, first-order terms, and second-order terms of f(X), respectively, and Xi ϵ [0, 1]; i = 1, 2, …, n.
Several types of Sobol indices exist. However, calculating higher orders becomes unfeasible with a large number of input variables. The first-order sensitivity index (Si) quantifies the extent to which each uncertain parameter contributes to the variance in the model output:
S i = V [ E [ Y   X i ] ] V [ Y ]
Here, 𝔼 [YXi] represents the expected value of the output Y when parameter Xi is fixed and 𝕍 [Y] is the total variance of the response. A low sensitivity index for a parameter indicates that variations in that parameter result in relatively minor changes in the final model output. Conversely, a high sensitivity index for a parameter suggests that alterations to it cause significant shifts in the model output. Each Si informs us about the anticipated reduction in the model’s variance when parameter Xi is held constant. It should be noted that the total of the first-order Sobol sensitivity indices cannot exceed one.

3. Methodology

3.1. The Mathematical Model

Mathematical models offer substantial potential for streamlining experimental processes, leading to cost savings and reduced time requirements for labor-intensive laboratory investigations. Additionally, they contribute to a deeper comprehension of the underlying mechanisms governing these processes. Metabolic flux analysis (MFA) has found extensive application in biotechnology for characterizing the state of cellular metabolism. This analysis relies on pseudo-steady-state mass balances around intracellular metabolites. The metabolic flux rate is determined by the substrate concentrations using Michaelis–Menten-type kinetics. The flux kinetic equation is formulated as follows:
υ = υ m a x   .   [ S ] K m + [ S ]
Here, υ denotes the reaction rate or flux, υmax represents the maximum reaction rate (attained when the enzyme is saturated with the substrate), [S] denotes the substrate concentration, and Km is the Michaelis–Menten affinity constant. Km signifies the substrate concentration at which the reaction rate is half of υmax.

3.2. Kinetic Model of the Bioprocesses

The primary aim of this research was to construct a model that accurately characterized the dynamics of AAV production within a bioreactor culture. In the current phase of model development, the HEK293 cell was treated as a single compartment, with no consideration given to intracellular sub-compartments, such as the mitochondria or the nucleus. The dynamic model comprised 32 reactions, incorporating a total of 89 kinetic parameters (Km = 52, υmax = 37). The network employed in this study is outlined in Table 1, which encompasses key metabolic pathways, namely, the glycolysis, tricarboxylic acid cycle (TCA), pyruvate fates, pentose phosphate pathway, anaplerotic reaction, amino acid metabolism, nucleotides synthesis, biomass synthesis, and the metabolic pathways of protein synthesis of the AAV (capsid and Rep proteins). The sequences of recombinant proteins were sourced from the National Institutes of Health (NIH). A total of fifty-three ordinary differential equations, which represented mass balances in the model, were considered.

4. Experimental Data Sets

In this study, we utilized a previously published dataset [18] to develop a metabolic model framework based on flux kinetics related to AAV production in the HEK293 cell line platform. This dataset includes metabolite profiles observed during the production of AAV6 in TubeSpin bioreactors under a low-cell-density culture (LCD: 1 × 10⁶ cells mL−1). At 24 h intervals, samples of the culture were collected and then subjected to centrifugation to separate the cellular components. The supernatant obtained after centrifugation was analyzed to quantify the levels of key nutrients and metabolites, including glutamine, glutamic acid, glucose, lactate, and ammonium. The data utilized in this study are presented in Figure 1. The initial concentration at time zero was known for these five species, while the fitting process required knowledge of the initial concentration for all the species. However, since such information was only available for five of the species, adjustments to the initial concentrations of the remaining species, as well as the model parameters, were made during the optimization iterations. Further details about this real-world example can be found in another source [18].

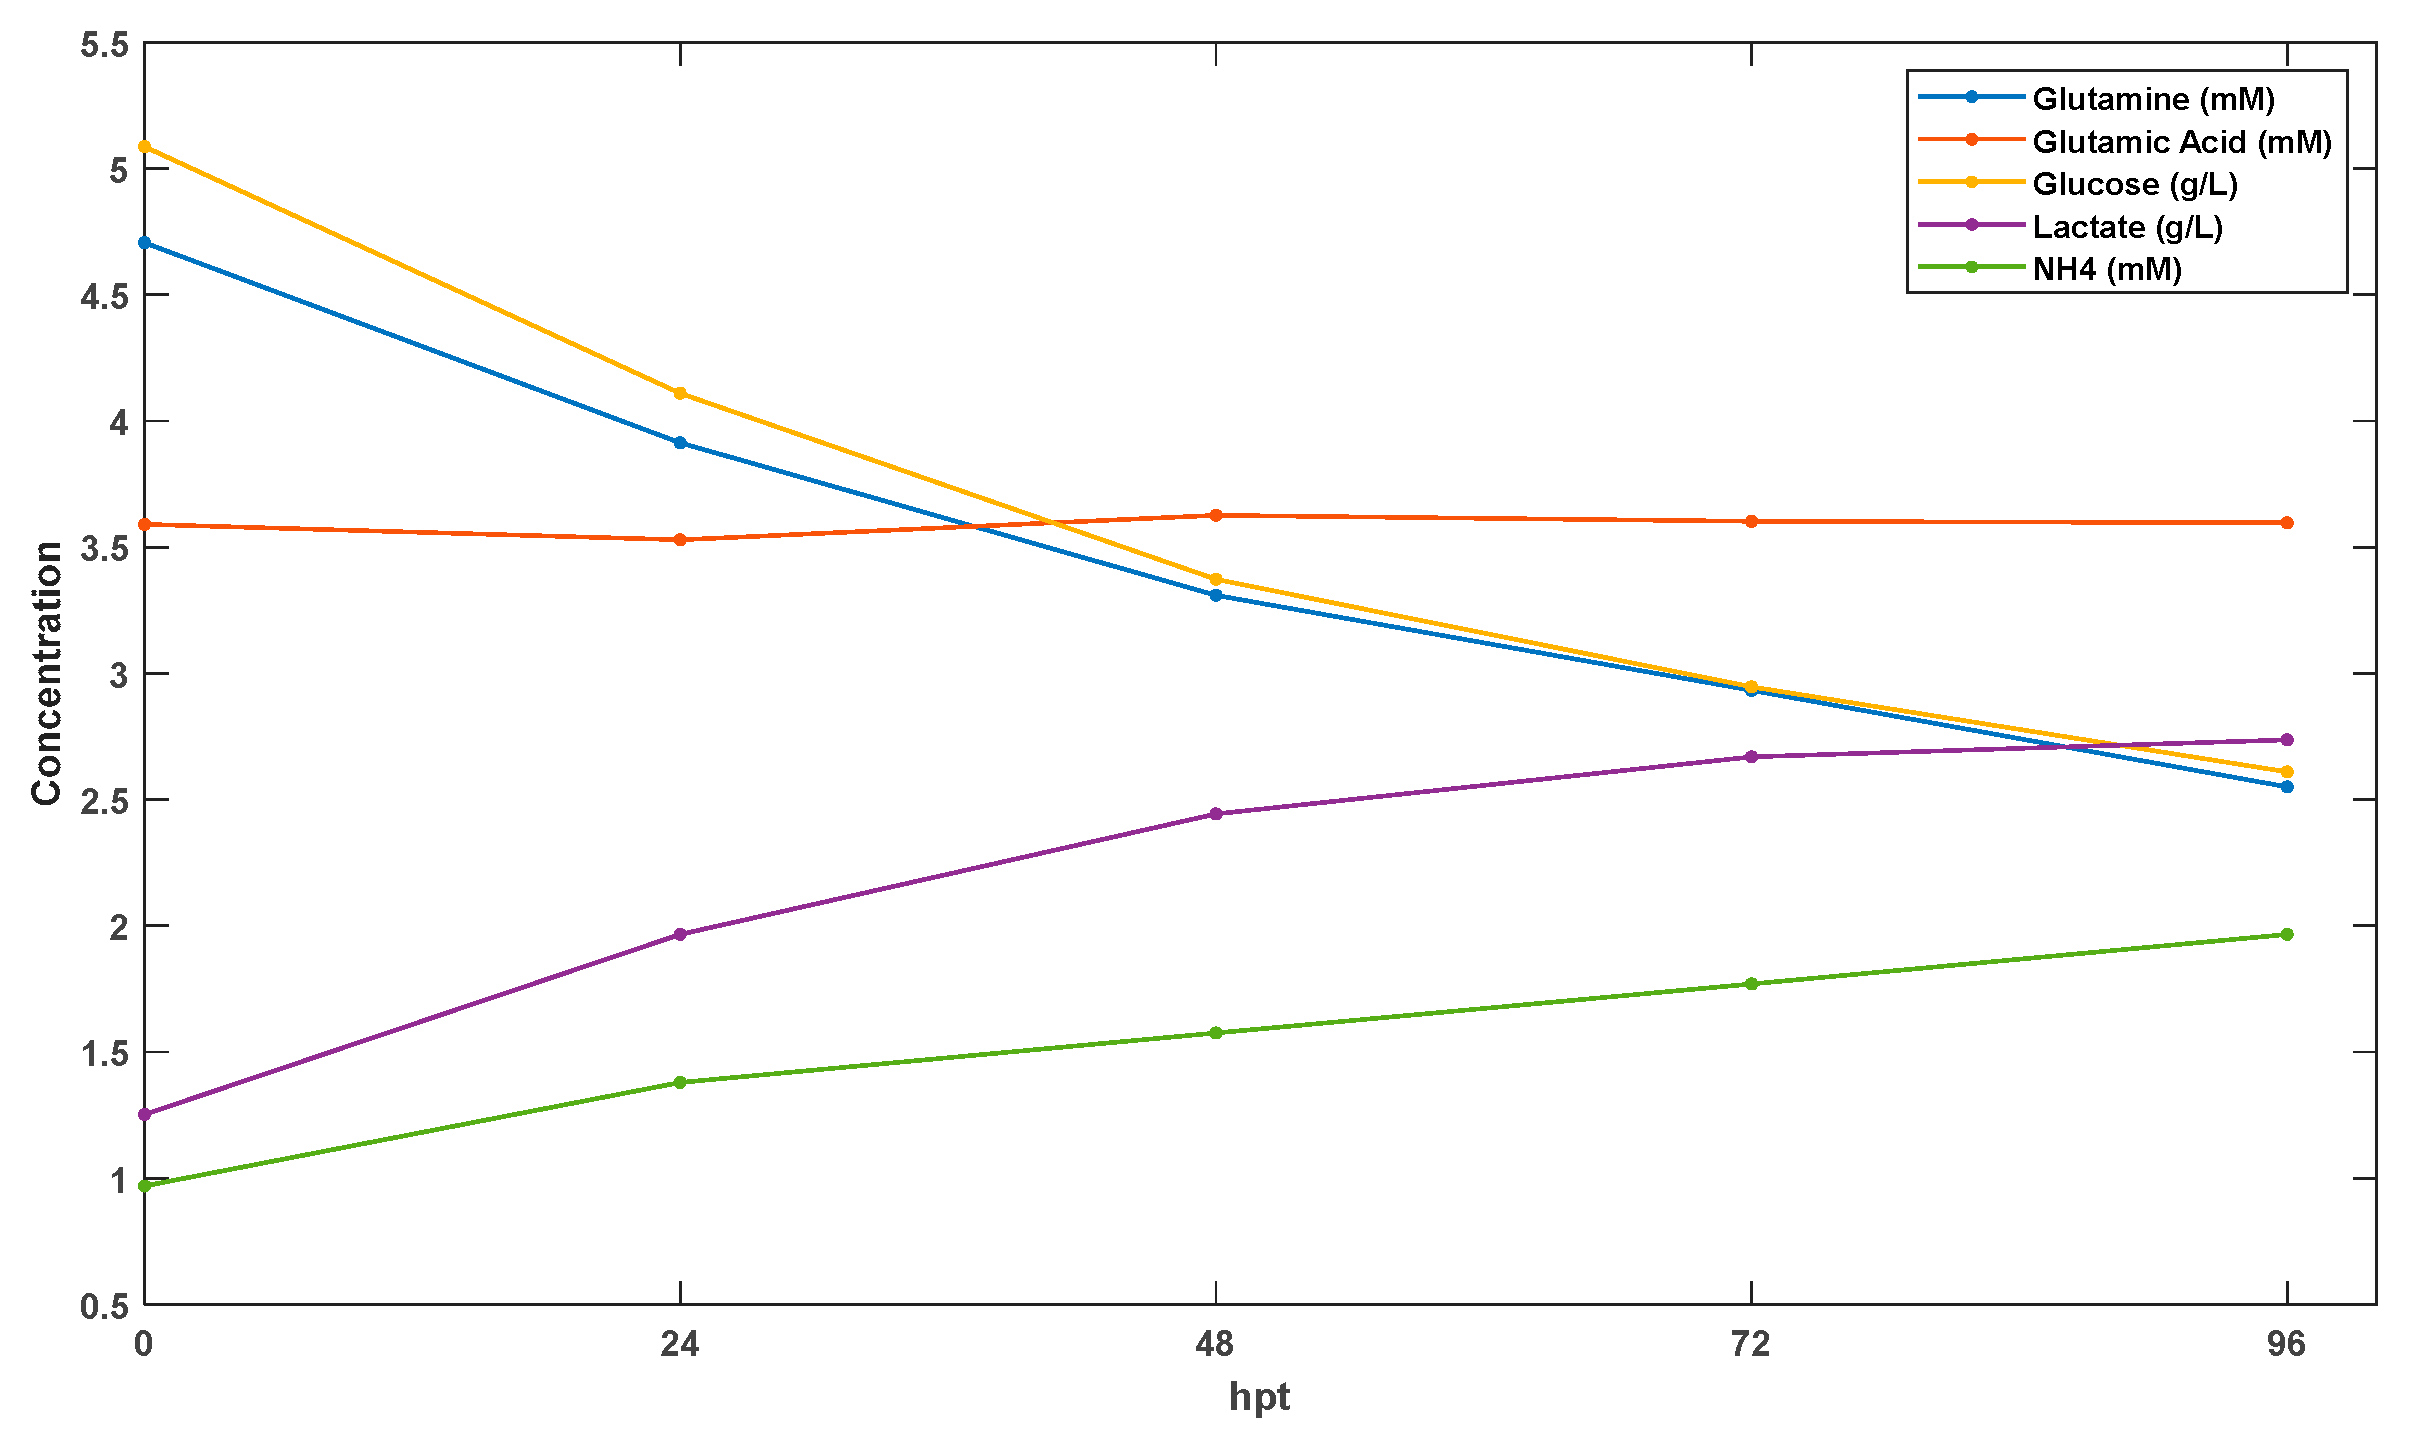
5. Results and Discussion

To optimize the AAV production, a suitable mathematical representation of the process was indispensable. The inherent complexity of even the simplest living cell means that any mathematical depiction serves as a rough approximation. Indeed, a mathematical model is inherently a simplification of system behavior. In the modeling realm, it is an accepted theory that a single set of data can be compatible with multiple models. In this study, adhering to Occam’s razor theory and acknowledging the limited available data, as well as the absence of initial information (such as the initial concentrations of all the involved components), we opted for a simpler model for the optimization of AAV production via HEK293 cells.

5.1. Model Optimization

To compute the parameters of the developed model, we employed the NGL/M parameter estimation procedure. The initial parameter estimates were derived from the literature. Given the large number of parameters in the model (142), we optimized them by fitting 2–10 parameters at a time while keeping the rest constant. This process was iteratively repeated, with the fitted parameters replaced by another group in each iteration. We continued this cycle until the fitted parameters no longer changed significantly, and the sum of the squared residuals reached its minimum value. The optimized kinetic parameters (Km, υmax), in addition to the initial composition and the concentrations (C0) in the bioreactor medium, are listed in Table 2 and Table 3 respectively.
In Figure 2, the calculated kinetic metabolite profiles are represented by lines, with experimentally measured data points indicated by star markers. The profiles obtained were well recovered, and the calculated and measured profiles generally exhibited good agreement, with the exception of the glutamic acid profile. The observed lack of a good fit was attributed to the absence of enough information regarding the profile of glutamic acid in the model. Specifically, this species has solely been considered in the construction of AAV proteins (Rep and Cap) within the model.
The total sum of the squares of residuals, denoting the differences between the real and modeled profiles, was 7.07 mM, with individual contributions as follows: ssq-Ammonia = 0.027 mM, ssq-Lactate = 0.268 mM, ssq-Glucose = 6.746 mM, ssq-Glutamic Acid = 0.005 mM, and ssq-Glutamine = 0.022 mM. The greatest ssq was associated with glucose, a result of its higher profile intensity compared with the other metabolites. Indeed, the higher intensity translated to a more significant impact on the sum of the squares of residuals (ssq), which contributed to a notable difference in the deviation.

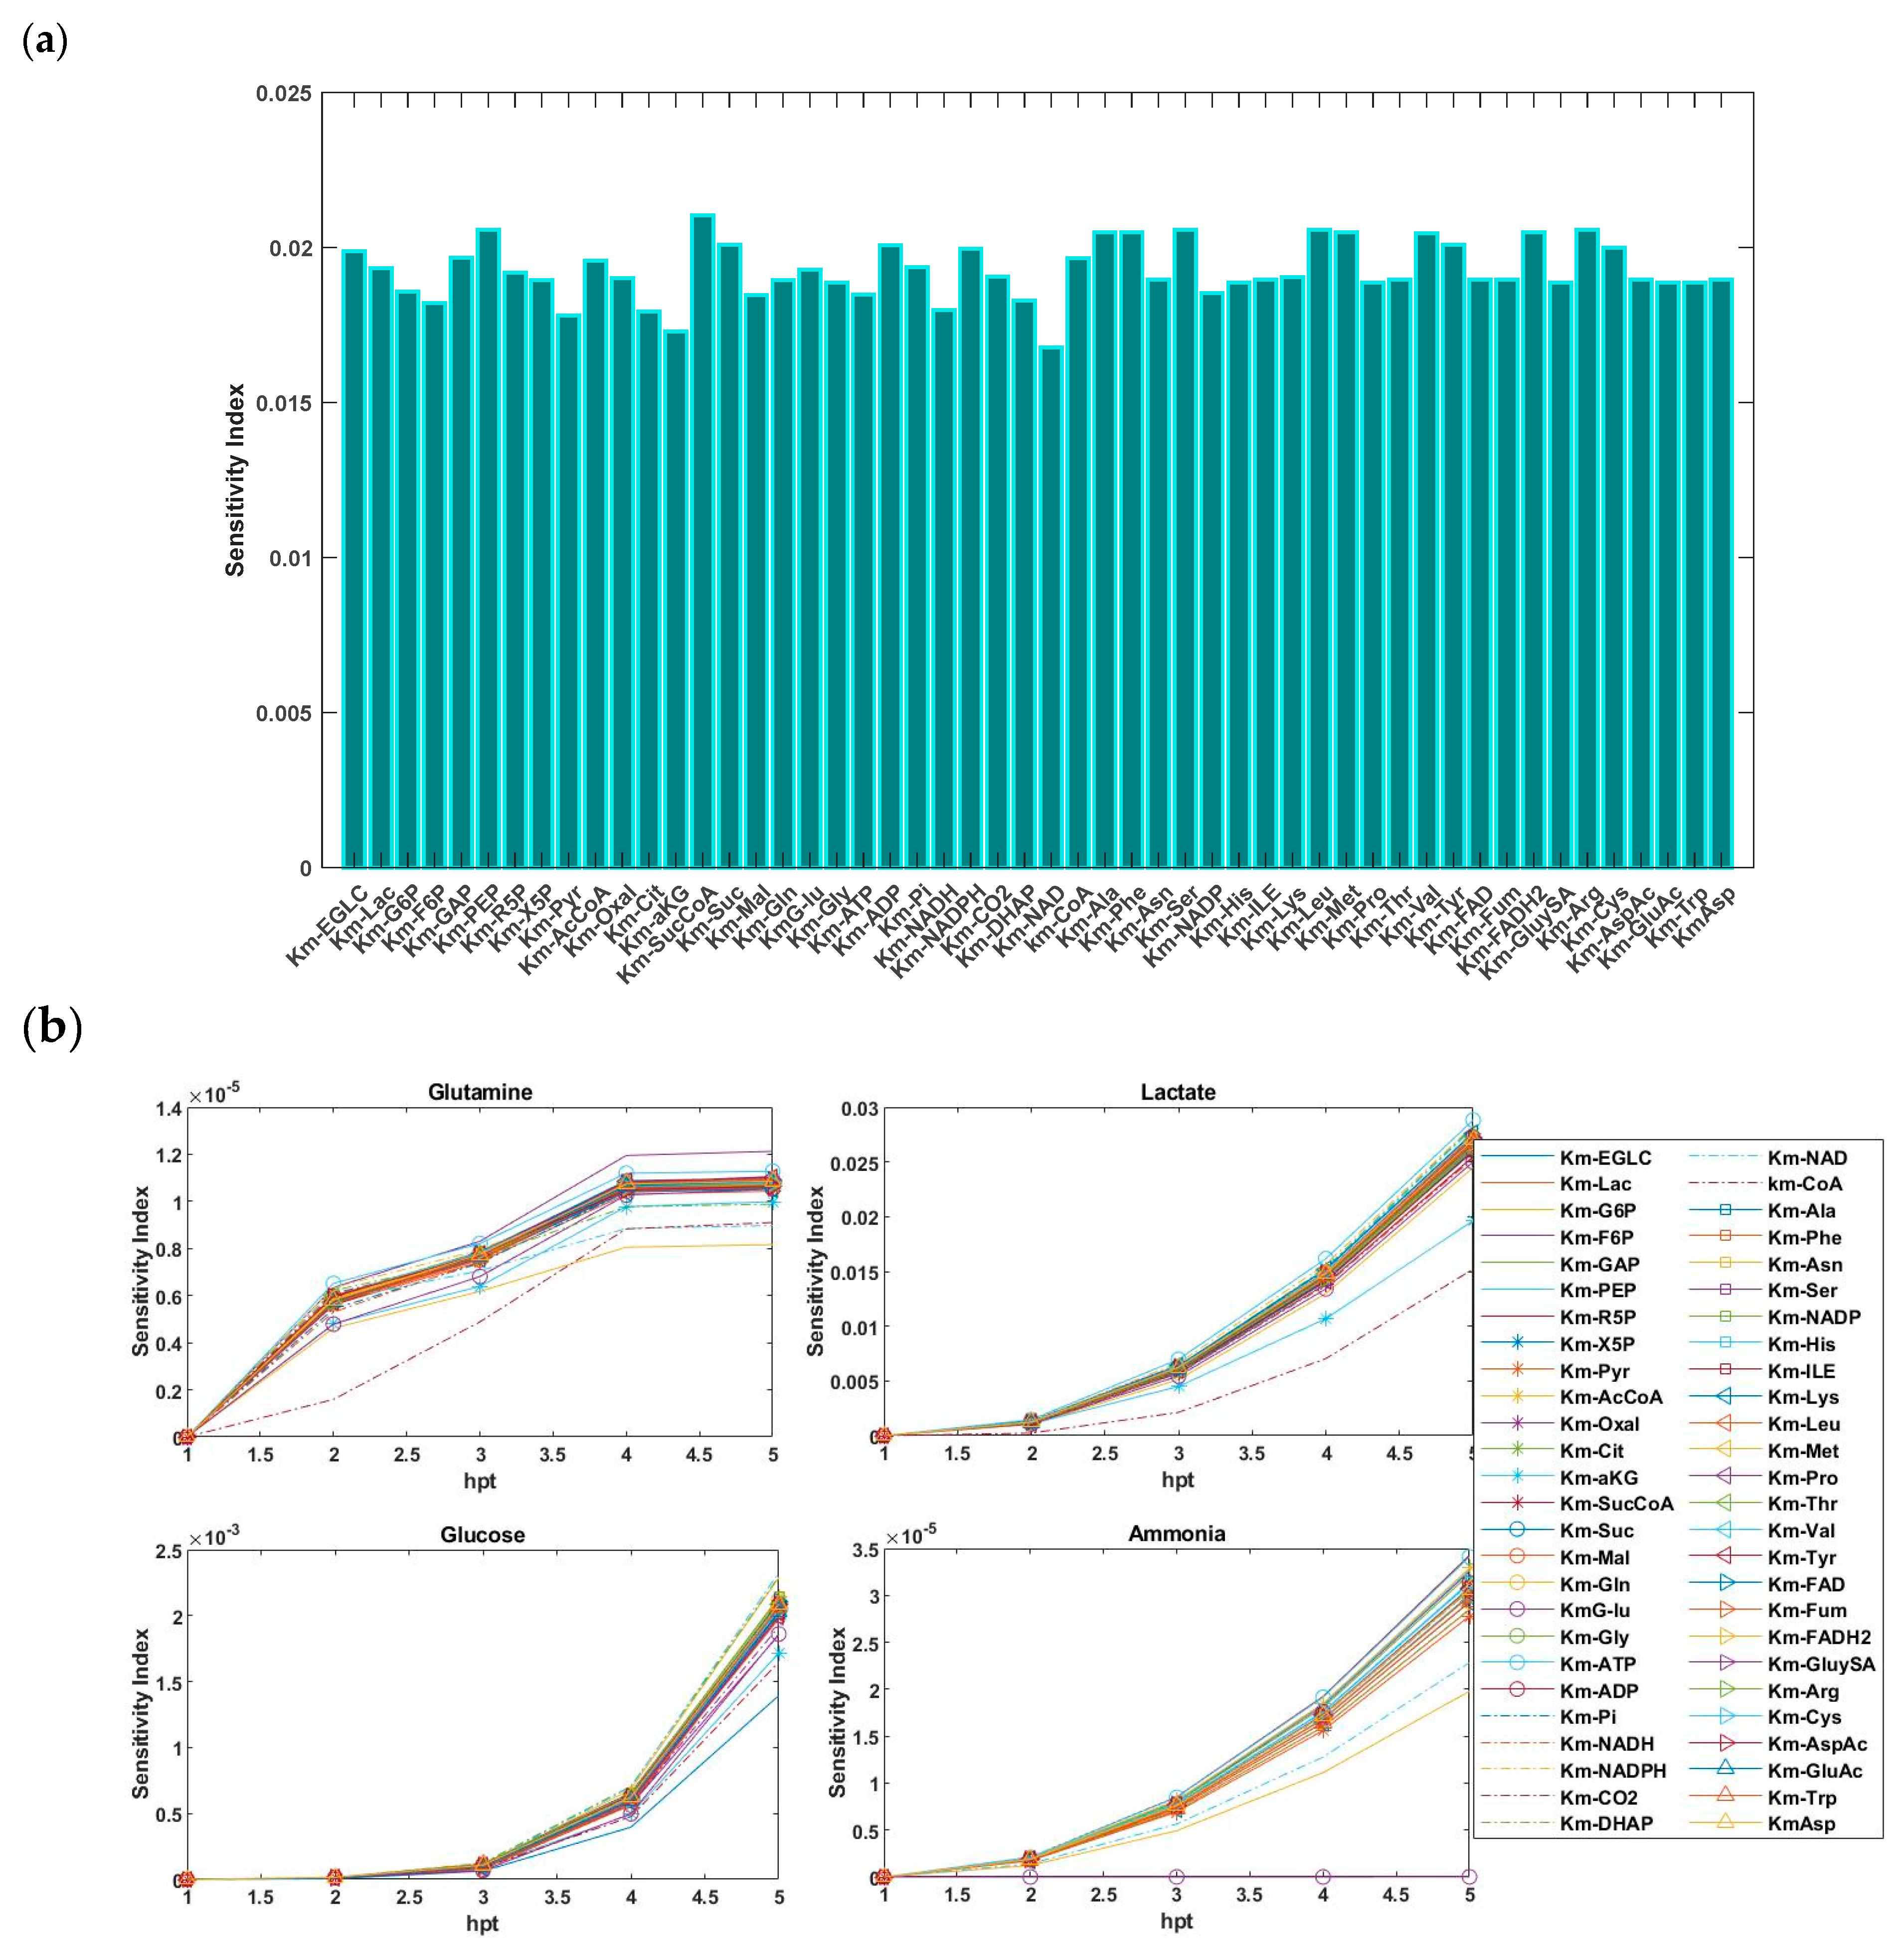
5.2. Sensitivity Analysis

Given the complexity of the system, the model yielded a considerable number of parameters. Consequently, a Sobol-based global sensitivity analysis (SGSA) of the kinetic parameters was carried out to assess the model’s dependence on specific parameters over time. Considering that model inputs can encompass a wide range, including parameters Km and υmax, global sensitivity analysis has emerged as an innovative approach for identifying which reactions and processes have the greatest significant impact on the behavior of the overall system.
For this, all parameters were simultaneously varied across the entire parameter space. Each parameter was defined to cover a specific finite range (specify the range including the lower and upper bounds for each), distributed uniformly. Then, a series of model outputs utilized the defined ODE model, which covered various ranges of parameter uncertainties, was generated. The model output was a random variable with a mean (f0) and total variance (𝕍). Finally, the Sobol method was employed to decompose 𝕍 into contributions from individual parameter effects (Equation (3)).
For the SGSA, we explored two alternative perspectives. First, the sensitivity results of 37 vmax and 52 Km parameters of the system were computed and are presented in Figure 3a and Figure 4a, respectively. In Figure 3a, the results indicate that parameters vmax-PGI, vmax-f-TPI, vmax-PK, vmax-CITS, vmax-AKGDH, vmax-r-LDH, vmax-GluySA, vmax-Rep, and vmax-Cap were the primary contributors, where they explained approximately 26% of the variability in the model output. This was followed by the significant parameters vmax-r-TPI, vmax-r-PGK, vmax-PDH, vmax-CS, vmax-f-SD, vmax-r-FH, vmax-G6PDH, vmax-PC, vmax-NS, and vmax-Biomass, which collectively contributed an additional 22% of the variation. However, as seen in Figure 4a, the magnitudes of the sensitivity indices for all Km parameters were slightly varied but remained approximately close to each other.
Next, we investigated the relative influence of the uncertainty in these parameters (vmax, Km) on the output concentrations of glutamine, glucose, lactate, and ammonium. Indeed, the sensitivity index reflected the influence of each parameter on the output at the specified time. For each profile concentration output, the importance of the parameters was ranked (Figure 3b and Figure 4b). Due to the absence of enough information regarding the profile of glutamic acid in the model, this component was neglected. It was observed that the sensitivity indices, and consequently, the degree of importance of the parameters, varied for each profile.
Our study provides an initial investigation into metabolic pathways associated with rAAV vector production. Using a simplified model, we identified pathways that could inform future studies. Given the inherent complexity and variability of biological systems, fully comprehensive models remain challenging to develop. However, simplified models can still offer valuable insights by approximating system behaviour [19].
We recognize that the proposed model, constrained by the available dataset, does not fully capture the complexity of rAAV production. However, the extracted parameters provide useful insights and indicate a degree of predictive potential for rAAV yields. While not comprehensive, this model offers a foundation for refining future models and informing metabolic engineering strategies to address challenges in large-scale rAAV manufacturing.

6. Conclusions

In this paper, we propose a metabolic behavior model for AAV production in an HEK293 cell line culture. The model, describing metabolic network flux kinetics, was calibrated to estimate key parameters. We utilized a measured dataset that contained five metabolite profiles from the production of adeno-associated virus 6 via triple transient transfection in a low-cell-density culture. These profiles included concentrations of glutamine (mM), glutamic acid, glucose, lactate, and ammonium. The model was applied to the experimental dataset, which allowed for the extraction of key parameters. Additionally, a Sobol-based global sensitivity analysis was conducted to identify and assess the most sensitive parameters of the model. As expected in such a complex system, multiple critical parameters exhibited interdependencies and varied with external conditions.
While this approach provides a structured framework for studying metabolic behaviors in AAV production, the findings should be interpreted with caution due to the limited dataset used for the model calibration. Expanding the dataset with more diverse conditions and additional validation experiments would be necessary to further assess the model’s reliability and general applicability. Despite these limitations, the model offers preliminary insights into key metabolic processes in HEK293 cells, which could support future efforts to optimize AAV production.

7. Limitations and Future Work

While incorporating additional datasets would provide a more comprehensive understanding of metabolic pathways in rAAV vector production, the present study was limited by constraints in experimental facilities and sample collection. As a result, the findings should be interpreted within the context of the specific dataset used.
To improve the model’s applicability, further optimization of different datasets is necessary. Although the model describes metabolic behaviors within the given dataset, its parameters may not be directly transferable to other conditions without recalibration. Variations in culture conditions, measurement techniques, and experimental setups could impact model predictions, requiring additional validation.
Given these limitations, the model should be considered an initial step toward understanding metabolic dynamics in rAAV production rather than a definitive predictive tool. Future work will focus on expanding the dataset, refining the parameter estimation, and validating the model across different production environments to enhance its robustness and generalizability.

Author Contributions

Conceptualization, S.K.K., M.C.-C., A.A.K. and M.B.; methodology, S.K.K., M.C.-C., A.A.K. and M.B.; software, S.K.K.; validation, S.K.K., M.C.-C., A.A.K. and M.B.; formal analysis, S.K.K.; investigation, S.K.K.; resources, S.K.K., M.C.-C., A.A.K. and M.B.; data curation, A.A.K.; writing—original draft preparation, S.K.K.; writing—review and editing, S.K.K. and M.B.; visualization, S.K.K.; supervision, M.B.; project administration, M.B.; funding acquisition, M.B. All authors have read and agreed to the published version of the manuscript.

Funding

This research was funded by the National Research Council Canada through the AI for Design Challenge Program (operating grants AI4D-103-1).

Institutional Review Board Statement

Not applicable.

Informed Consent Statement

Not applicable.

Data Availability Statement

The data that support the findings of this study are available from the corresponding author upon reasonable request.

Conflicts of Interest

The authors declare no conflicts of interest.

References

  1. Finer, M.; Glorioso, J. A brief account of viral vectors and their promise for gene therapy. Gene Ther. 2017, 24, 1–2. [Google Scholar] [CrossRef] [PubMed]
  2. Grabenhorst, E.; Schlenke, P.; Pohl, S.; Nimtz, M.; Conradt, H.S. Genetic engineering of recombinant glycoproteins and the glycosylation pathway in mammalian host cells. In Glycotechnology; Springer: Boston, MA, USA, 1999; pp. 1–17. [Google Scholar]
  3. Giorgetti, S.I.; Etcheverrigaray, M.; Terry, F.; Martin, W.; De Groot, A.S.; Ceaglio, N.; Oggero, M.; Mufarrege, E.F. Development of highly stable and de-immunized versions of recombinant alpha interferon: Promising candidates for the treatment of chronic and emerging viral diseases. Clin. Immunol. 2021, 233, 108888. [Google Scholar] [CrossRef] [PubMed]
  4. Clément, N.; Grieger, J.C. Manufacturing of recombinant adeno-associated viral vectors for clinical trials. Mol. Ther. Methods Clin. Dev. 2016, 3, 16002. [Google Scholar] [CrossRef] [PubMed]
  5. Sanchez-Martinez, Z.V.; Alpuche-Lazcano, S.P.; Stuible, M.; Durocher, Y. CHO cells for virus-like particle and subunit vaccine manufacturing. Vaccine 2024, 42, 2530–2542. [Google Scholar] [CrossRef] [PubMed]
  6. Abbate, T.; Dewasme, L.; Wouwer, A.V.; Bogaerts, P. Adaptive flux variability analysis of HEK cell cultures. Comput. Chem. Eng. 2020, 133, 106633. [Google Scholar] [CrossRef]
  7. Adamson-Small, L.; Potter, M.; Falk, D.J.; Cleaver, B.; Byrne, B.J.; Clément, N. A scalable method for the production of high-titer and high-quality adeno-associated type 9 vectors using the HSV platform. Mol. Ther. Methods Clin. Dev. 2016, 3, 16031. [Google Scholar] [CrossRef] [PubMed]
  8. Dash, S.; Sharon, D.M.; Mullick, A.; Kamen, A.A. Only a small fraction of cells produce assembled capsids during transfection-based manufacturing of adeno-associated virus vectors. Biotechnol. Bioeng. 2022, 119, 1685–1690. [Google Scholar] [CrossRef] [PubMed]
  9. Gagnon, P.; Goricar, B.; Mencin, N.; Zvanut, T.; Peljhan, S.; Leskovec, M.; Strancar, A. Multiple-monitor HPLC assays for rapid process development, in-process monitoring, and validation of AAV production and purification. Pharmaceutics 2021, 13, 113. [Google Scholar] [CrossRef] [PubMed]
  10. Rieser, R.; Koch, J.; Faccioli, G.; Richter, K.; Menzen, T.; Biel, M.; Winter, G.; Michalakis, S. Comparison of different liquid chromatography-based purification strategies for adeno-associated virus vectors. Pharmaceutics 2021, 13, 748. [Google Scholar] [CrossRef] [PubMed]
  11. Nguyen, T.N.; Sha, S.; Hong, M.S.; Maloney, A.J.; Barone, P.W.; Neufeld, C.; Wolfrum, J.; Springs, S.L.; Sinskey, A.J.; Braatz, R.D. Mechanistic model for production of recombinant adeno-associated virus via triple transfection of HEK293 cells. Mol. Ther. Methods Clin. Dev. 2021, 21, 642–655. [Google Scholar] [CrossRef] [PubMed]
  12. Kyriakopoulos, S.; Ang, K.S.; Lakshmanan, M.; Huang, Z.; Yoon, S.; Gunawan, R.; Lee, D.Y. Kinetic modeling of mammalian cell culture bioprocessing: The quest to advance biomanufacturing. Biotechnol. J. 2018, 13, 1700229. [Google Scholar] [CrossRef] [PubMed]
  13. Rico, J.; Nantel, A.; Pham, P.L.; Voyer, R.; Durocher, Y.; Penny, S.; Surendra, A.; Pinto, D.; Sasseville, M.; Culf, E.; et al. Kinetic model of metabolism of monoclonal antibody producing CHO cells. Curr. Metabolomics 2018, 6, 207–217. [Google Scholar] [CrossRef]
  14. Ghorbaniaghdam, A.; Henry, O.; Jolicoeur, M. A kinetic-metabolic model based on cell energetic state: Study of CHO cell behavior under Na-butyrate stimulation. Bioprocess Biosyst. Eng. 2013, 36, 469–487. [Google Scholar] [CrossRef] [PubMed]
  15. Cai, Y.; Yan, X.; Dan, H. Review of sensitivity analysis. J. Beijing Norm. Univ. 2008, 1, 9–16. [Google Scholar]
  16. Maeder, M.; Neuhold, Y.-M. Practical Data Analysis in Chemistry; Elsevier: Amsterdam, The Netherlands, 2007. [Google Scholar]
  17. Sobol’, I.M. On sensitivity estimation for nonlinear mathematical models. Mat. Model. 1990, 2, 112–118. [Google Scholar]
  18. Moço, P.D.; Xu, X.; Silva, C.A.T.; Kamen, A.A. Production of adeno-associated viral vector serotype 6 by triple transfection of suspension HEK293 cells at higher cell densities. Biotechnol. J. 2023, 18, 2300051. [Google Scholar] [CrossRef] [PubMed]
  19. Karimvand, S.K.; Maeder, M.; Abdollahi, H. A chemical equilibrium modelling strategy for tuning the apparent equilibrium constants of the chemical systems. Anal. Chim. Acta 2019, 1049, 29–37. [Google Scholar] [CrossRef] [PubMed]
Figure 1. Metabolite profiles of production of adeno-associated virus 6 (AAV6) via triple transient transfection in low-cell-density culture, including concentration profiles of glutamine (mM), glutamic acid (mM), glucose (g/L), lactate (g/L), and ammonium (mM).
Bioengineering 12 00345 g001
Figure 2. Comparison of experimental (star markers) and recovered (line) kinetic profiles of five metabolites: (a) lactate (mM), (b) glucose (mM), (c) glutamine (mM), (d) ammonium (mM), and (e) glutamic acid (mM).
Bioengineering 12 00345 g002
Figure 3. (a) First-order Sobol sensitivity indices of the 37 Vmax parameters. (b) Changes in the sensitivity indices concerning the glutamine, glucose, ammonia, and lactate output concentrations over time.
Bioengineering 12 00345 g003
Figure 4. (a) First-order Sobol sensitivity indices of the 52 Km parameters. (b) Changes in the sensitivity indices concerning the glutamine, glucose, ammonia, and lactate output concentrations over time.
Bioengineering 12 00345 g004
Table 1. Reactions of the metabolic network of the AAV production via an HEK293 cell.
#Metabolic PathwayMetabolic Reaction Network
υ1GlycolysisGlc + ATP → G6P + ADP
υ2G6P → F6P
υ3F6P + ATP → DHAP + G3P + ADP
υ4DHAP ↔ G3P
υ5G3P + NAD+ + ADP ↔ PEP + NADH + ATP
υ6PEP + ADP → Pyr + ATP
υ7Tricarboxylic acid cyclePyr + NAD+ + CoA → AcCoA + CO2 + NADH
υ8AcCoA + Oxal + H2O → Cit + CoA
υ9Cit + NADP+ → αKG + CO2 + NADPH
υ10αKG + CoA + NAD+ → SucCoA + CO2 + NADH
υ11SucCoA + ADP + Pi → Suc + ATP + CoA
υ12Suc + FAD ↔ Fum + FADH2
υ13Fum ↔ Mal
υ14Mal + NAD+ → Oxal + NADH
υ15Pyruvate fatesG6P + 2NADP+ + H2O → R5P + 2NADPH + CO2
υ162X5P + R5P → 2F6P + G3P
υ17Anaplerotic reactionMal + NADP+ → Pyr + CO2 + NADPH
υ18Pyr + CO2 + ATP → Oxal
υ19Amino acid metabolismGlu + NAD+ → αKG + NH4 + NADH
υ20Oxal + Glu → Asp + αKG
υ21Gln → Glu + NH4
υ22Ser → Pyr + NH4
υ23Asn → Asp + NH4
υ24Glu + ATP + 2NADPH + H+ → Pro- + ADP + 2NADP+
υ25GluySA → Pro-
υ26His → Glu + NH4
υ27Nucleotides synthesis2Asp + Gly + 2Gln + 0.6R5P + CO2 → 2Mal + 2Glu
υ28Pentose phosphate pathwayG6P + 2NADP+ + H2O → R5P + 2NADPH + CO2
υ292X5P + R5P → 2F6P + G3P
υ30Biomass synthesis0.024*R5P + 0.029*G6P + 0.04*Gln + 0.013*Ala + 0.007*Arg + 0.026*Asp + 0.003*His + 0.0084*Ile + 0.013*Leu + 0.01*Lys + 0.099*Ser + 0.004*Tyr + 0.0096*Val + 0.016*Gly + 3.78*ATP → Biomass
υ31Protein folding0.05*Ala + 0.03*Cys + 0.06*AspAc + 0.07*GluAc + 0.03*Phe + 0.05*Gly + 0.02*His + 0.06*ILE + 0.08*Lys + 0.08*Leu + 0.02*Met + 0.04*Asn + 0.05*Pro + 0.05*Glu + 0.04*Arg + 0.07*Ser + 0.07*Thr + 0.06*Val + 0.03*Trp + 0.03*Tyr + ATP → Rep + ADP
υ320.07*Ala + 0.01*Cys + 0.06*AspAc + 0.05*GluAc + 0.05*Phe + 0.08*Gly + 0.02* His + 0.03* ILE + 0.05* Lys + 0.06* Leu + 0.01*Met + 0.09*Asn + 0.08*Pro + 0.05*Glu + 0.04*Arg + 0.07*Ser + 0.07*Thr + 0.05*Val + 0.02*Trp + 0.04*Tyr + ATP → Cap + ADP
Table 2. The equations of the metabolite fluxes of the considered model and their fitted parameters Km and υmax.
FluxEquationsParameters
υHK υ H K = υ m a x H K G l c K m G l c + G l c A T P K m A T P + A T P υmaxHK = 0.205
KmGlc = 5.100
KmATP = 0.594
υPGI υ P G I = υ m a x P G I G 6 P K m G 6 P + G 6 P υmaxPGI = 2.283
KmG6P = 2.165
υPFK υ P F K = υ m a x P F K F 6 P K m F 6 P + F 6 P A T P K m A T P + A T P υmaxPFK = 6.667
KmF6P = 0.016
υTPI υ T P I = υ m a x f T P I D H A P K m D H A P + D H A P υ m a x r T P I G A P K m G A P + G A P υmax-f-TPI = 1.296
KmDHAP = 0.043
υmax-r-TPI = 14.299
KmGAP = 4.6 × 10⁻⁶
υPGK υ P G K = υ m a x f P G K G A P K m G A P + G A P N A D K m N A D + N A D A D P K m A D P + A D P υ m a x r P G K P E P K m P E P + P E P N A D H K m N A D H + N A D H A T P K m A T P + A T P υmax-f-PGK = 3.841
υmax-r-PGK = 4.0 × 10⁻³
KmNAD = 2.4 × 10⁻⁵
KmADP = 4.3 × 10⁻⁷
KmPEP = 0.018
KmNADH = 0.017
υPK υ P K = υ m a x P K P E P K m P E P + P E P A D P K m A D P + A D P υmaxPK = 2.520
υPDH υ P D H = υ m a x P D H P y r K m P Y r + P y r N A D K m N A D + N A D C o A K m C o A + C o A υmaxPDH = 0.571
KmPYr = 0.013
KmCoA = 6.4 × 10⁻⁴
υCS υ C S = υ m a x C S A c C o A K m A c C o A + A c C o A O x a l K m O x a l + O x a l υmaxCS = 0.125
KmAcCoA = 0.012
KmOxal = 0.004
υCITS υ C I T S = υ m a x C I T S C i t K m C i t + C i t N A D P K m N A D P + N A D P υmaxCITS = 1.634
KmCit = 0.082
KmNADP = 6.9 × 10⁻⁴
υAKGDH υ A K G D H = υ m a x A K G D H a K G K m a K G + a K G C o A K m C o A + C o A N A D K m N A D + N A D υmaxAKGDH = 1.496
KmaKG = 1.9 × 10⁻⁵
υSCL υ S C L = υ m a x S C L S u c C o A K m S u c C o A + S u c C o A A D P K m A D P + A D P P i K m P i + P i υmaxSCL = 1.300
KmSucCoA = 6 × 10⁻⁴
KmPi = 0.047
υSD υ S D = υ m a x f S D S u c K m S u c + S u c F A D K m F A D + F A D υ m a x r S D F U M K m F U M + F U M F A D H 2 K m F A D H 2 + F A D H 2 υmax-f-SD = 2.378
υmax-r-SD = 1.989
KmSuc = 0.034
KmFAD = 1.320
KmFUM = 0.041
KmFADH2 = 0.053
υFH υ F H = υ m a x f F H F u m K m F u m + F u m υ m a x r F H M a l K m M a l + M a l υmax-f-FH = 8.3 × 10⁻²
υmax-r-FH = 1.777
KmMal = 0.046
υMDH υ M D H = υ m a x M D H M a l K m M a l + M a l N A D K m N A D + N A D υmaxMDH = 1.4 × 10⁻²
υLDH υ L D H = υ m a x f L D H P y r K m P y r + P y r N A D H K m N A D H + N A D H υ m a x r L D H L a c K m L a c + L a c N A D K m N A D + N A D υmax-f-LDH = 0.565
υmax-r-LDH = 0.275
KmLac = 3.119
υAlaTA υ A l a T A = υ m a x A l a T A P y r K m P y r + P y r G l u K m G l u + G l u υmaxAlaTA = 3.1 × 10⁻²
KmGlu = 1.7 × 10⁻⁴
υG6PDH υ G 6 P D H = υ m a x G 6 P D H G 6 P K m G 6 P + G 6 P N A D P K m N A D P + N A D P υmaxG6PDH = 5 × 10⁻³
υTK υ T K = υ m a x T K X 5 P K m X 5 P + X 5 P R 5 P K m R 5 P + R 5 P υmaxTK = 4 × 10−3
KmX5P = 7 × 10⁻³
KmR5P = 6.5 × 10⁻²
υME υ M E = υ m a x M E M a l K m M a l + M a l N A D P K m N A D P + N A D P υmaxME = 0.84
υPC υ P C = υ m a x P C P y r K m P y r + P y r C O 2 K m C O 2 + C O 2 A T P K m A T P + A T P υmaxPC = 9.02
KmCO2 = 0.45
υGLDH υ G L D H = υ m a x G L D H G l u K m G l u + G l u N A D K m N A D + N A D υmaxGLDH = 2.3 × 10⁻²
υASTA υ A S T A = υ m a x A S T A O x a l K m O x a l + O x a l G l u K m G l u + G l u υmaxASTA = 1.21
υGLNS υ G L N S = υ m a x G L N S G l n K m G l n + G l n υmaxGLNS = 0.01
υSDHH υ S D H H = υ m a x S D H H S e r K m S e r + S e r υmaxSDHH = 0.43
KmSer = 0.96
υASN υ A S N = υ m a x A S N A s n K m A s n + A s n υmaxASN = 1 × 10⁻⁴
KmAsn = 1.7 × 10⁻³
υGlu υ G l u = υ m a x G l u G l u K m G l u + G l u A T P K m A T P + A T P N A D P H K m N A D P H + N A D P H υmaxGlu = 0.98
KmNADPH = 8.06 × 10⁻⁵
υGluySA υ G l u y S A = υ m a x G l u y S A G l u y S A K m G l u y S A + G l u y S A υmaxGluySA = 8.5 × 10⁻²
KmGluySA = 2.15 × 10⁻³
υHis υ H i s = υ m a x H i s H i s K m H i s + H i s υmaxHis = 6 × 10⁻⁴
KmHis = 1.89 × 10⁻²
υNS υ N S = υ m a x N S A s p K m A s p + A s p G l y K m G l y + G l y G l n K m G l n + G l n R 5 P K m R 5 P + R 5 P C O 2 K m C O 2 + C O 2 υmaxNS = 0.79
KmAsp = 1.29 × 10⁻⁵
KmGly = 1.51 × 10⁻⁵
KmGln = 3 × 10⁻⁴
υGrowth υ G r o w t h = υ m a x G r o w t h R 5 P K m R 5 P + R 5 P G 6 P K m G 6 P + G 6 P G l n K m G l n + G l n A l a K m A l a + A l a
A r g K m A r g + A r g A s p K m A s p + A s p H i s K m H i s + H i s I l e K m I l e + I l e L e u K m L e u + L e u L y s K m L y s + L y s
S e r K m S e r + S e r T y r K m T y r + T y r V a l K m V a l + V a l G l y K m G l y + G l y A T P K m A T P + A T P
υGrowth = 1.8 × 10⁻²
KmAla = 2.8 × 10⁻²
KmArg = 1.2 × 10⁻²
KmIle = 1.7 × 10⁻²
KmLeu = 3.9 × 10⁻⁴
KmLys = 5.8 × 10⁻²
KmTyr = 8.1 × 10⁻³
KmVal = 0.60
υRep υ R e p = υ m a x R e p A l a K m A l a + A l a C y s K m c y s + C y s A s p A c K m A s p A c + A s p A c G l u A c K m G l u A c + G l u A c
P h e K m P h e + P h e G l y K m G l y + G l y H i s K m H i s + H i s I l e K m I l e + I l e L y s K m L y s + L y s L e u K m L e u + L e u
M e t K m M e t + M e t A s n K m A s n + A s n P r o K m P r o + P r o G l u K m G l u + G l u A r g K m A r g + A r g S e r K m S e r + S e r
T h r K m T h r + T h r V a l K m V a l + V a l T r p K m T r p + T r p T y r K m T y r + T y r A T P K m A T P + A T P
υmaxRep = 2.5 × 10⁻³
KmCys = 4.94 × 10⁻²
KmAspAc = 4.95 × 10⁻²
KmGluAc = 5.03 × 10⁻²
KmPhe = 7.1 × 10⁻²
KmMet = 0.32
KmPro = 4.74 × 10⁻²
KmThr = 1.94 × 10⁻²
KmTrp = 4.99 × 10⁻²
υCep υ C e p = υ m a x C e p A l a K m A l a + A l a C y s K m S y s + C y s A s p A c K m A s p A c + A s p A c G l u A c K m G l u A c + G l u A c
P h e K m P h e + P h e G l y K m G l y + G l y H i s K m H i s + H i s I l e K m I l e + I l e L y s K m L y s + L y s L e u K m L e u + L e u
M e t K m M e t + M e t A s n K m A s n + A s n P r o K m P r o + P r o G l u K m G l u + G l u A r g K m A r g + A r g S e r K m S e r + S e r
T h r K m T h r + T h r V a l K m V a l + V a l T r p K m T r p + T r p T y r K m T y r + T y r A T P K m A T P + A T P
υmaxCep = 2.9 × 10⁻²
Table 3. The fitted initial concentrations of all the involved species.
MetaboliteNameFitted ValueMetaboliteNameFitted Value
ATPATP19.95 mMHisHistidine0.604 mM
ADPADP0.175 mMIleIsoleucine0.777 mM
AcCoAAcetyl-CoA0.016 mMLac 1Lactate13.91 mM
αKGAlpha-ketoglutarate0.110 mMLysLysine0.017 mM
AlaAlanine6.985 mMLeuLeucine0.517 mM
AspAspartate3.065 mMMalMalate4.262 mM
AsnAsparagine0.495 mMMetMethionine1.150 mM
ArgArginine0.519 mMNAD
NADH
Nicotinamide adenine dinucleotide0.634 mM
0.029 mM
AspAcAspartic acid0.011 mMNADP
NADPH
Nicotinamide adenine dinucleotide phosphate0.009 mM
0.106 mM
CoACoenzyme A 1.132 mMNH4 1Ammonia0.97 mM
CitCitrate0.810 mMOxalOxaloacetate0.003 mM
CO2CO23.530 mMPep3-phosphoglycerate0.309 mM
CysCysteine0.248 mMPyrPyruvate7.291 mM
DHAPdihydroxyacetone phosphate3.072 mMPiOrthophosphate or hydrogenphosphate0.498 mM
F6PFructose-6-phosphate0.685 mMProProline1.520 mM
FADflavin adenine dinucleotide3.630 mMPhePhenylalanine0.874 mM
FumFumaric acid0.192 mMR5PRibulose-5-phosphate1.169 mM
FADH2 0.753 mMSucCoASuccinate Coenzyme A0.007 mM
GLC 1Glucose28.23 mMSucSuccinate0.997 mM
GAPGlyceraldehyde 3-phosphate0.600 mMSerSerine0.012 mM
G6PGlucose-6-phosphate1.255 mMThrThreonine0.205 mM
GluGlutamate2.82 × 10−5 mMTrpTryptophan0.237 mM
Gln 1Glutamine4.7 mMTyrTyrosine0.255 mM
GluySAGlutamateγ−semialdehyde0.034 mMValValine0.107 mM
GluAc 1Glutamic acid3.59 mMX5PXylulose 5 − phosphate0.004 mM
GlyGlycine1.155 mM
1 The initial concentrations of these species were included in the available data.
Disclaimer/Publisher’s Note: The statements, opinions and data contained in all publications are solely those of the individual author(s) and contributor(s) and not of MDPI and/or the editor(s). MDPI and/or the editor(s) disclaim responsibility for any injury to people or property resulting from any ideas, methods, instructions or products referred to in the content.

