

Reliability of an Inertial Measurement System Applied to the Technical Assessment of Forehand and Serve in Amateur Tennis Players

 , , , ,
  ,
,  and
and
Abstract
:1. Introduction
1.1. Game Fundamentals
1.2. Assessment Systems for Game Fundamentals
2. Materials and Methods
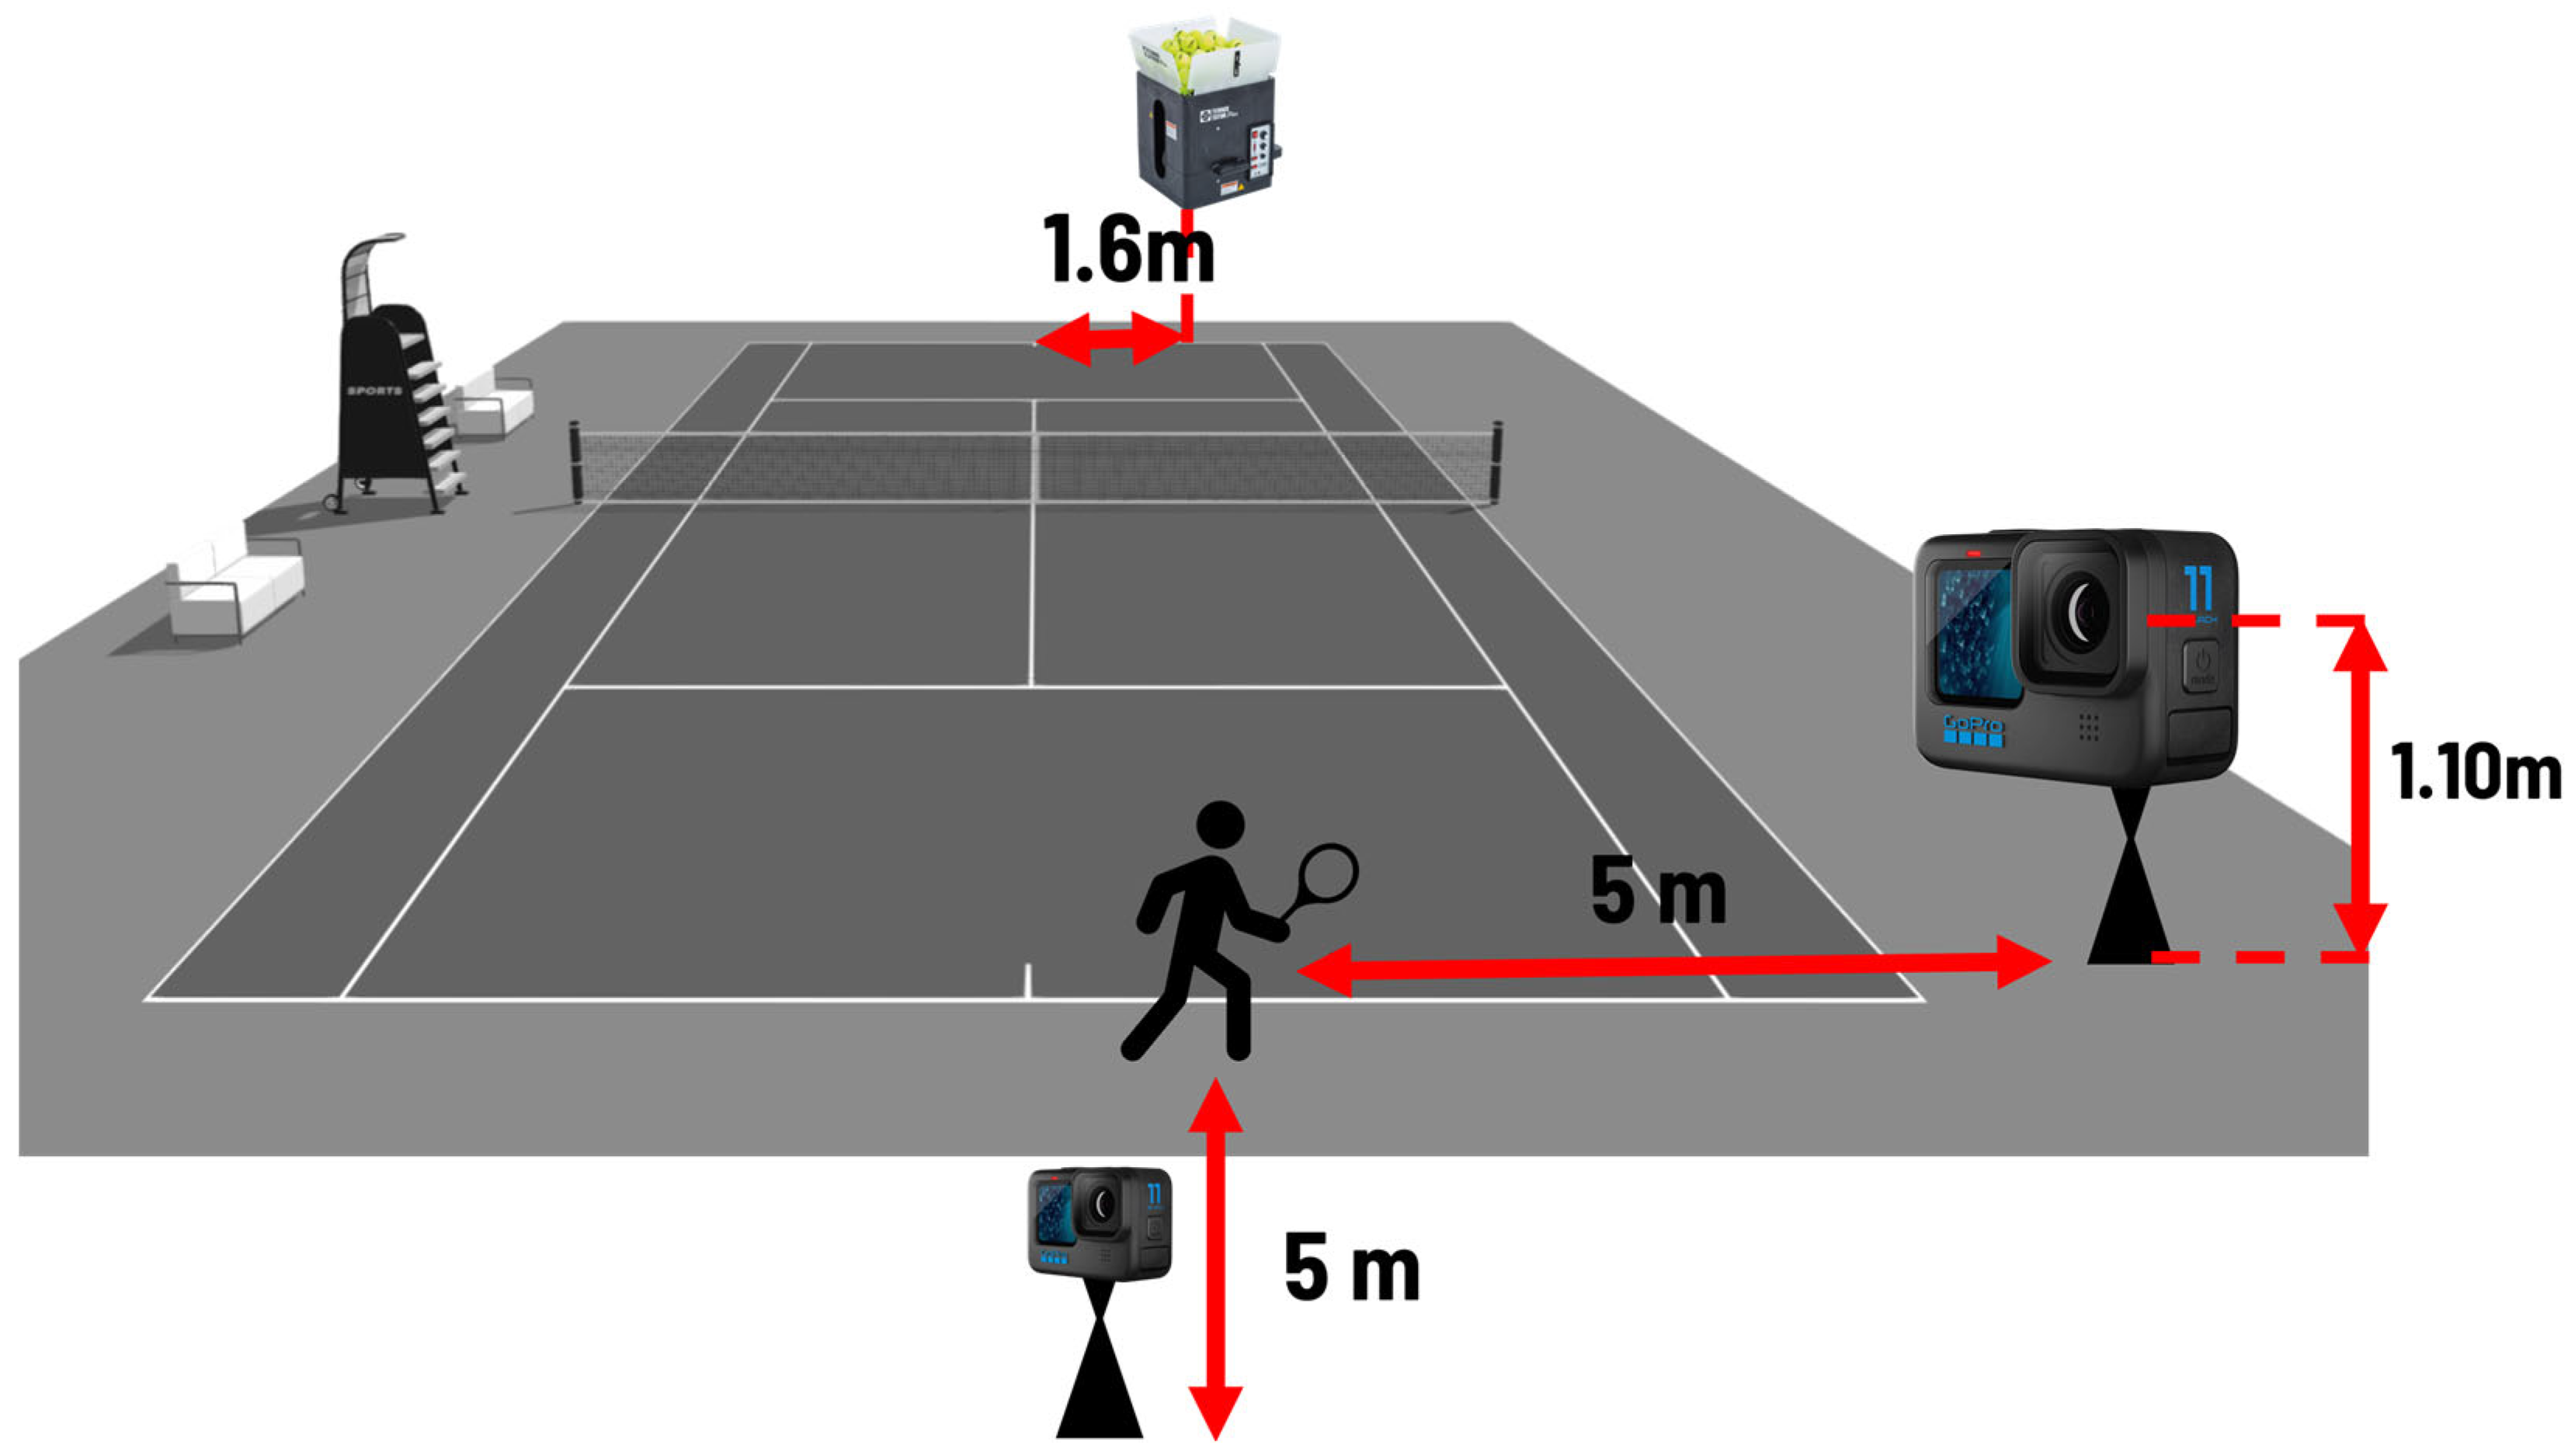
2.1. Data Collection
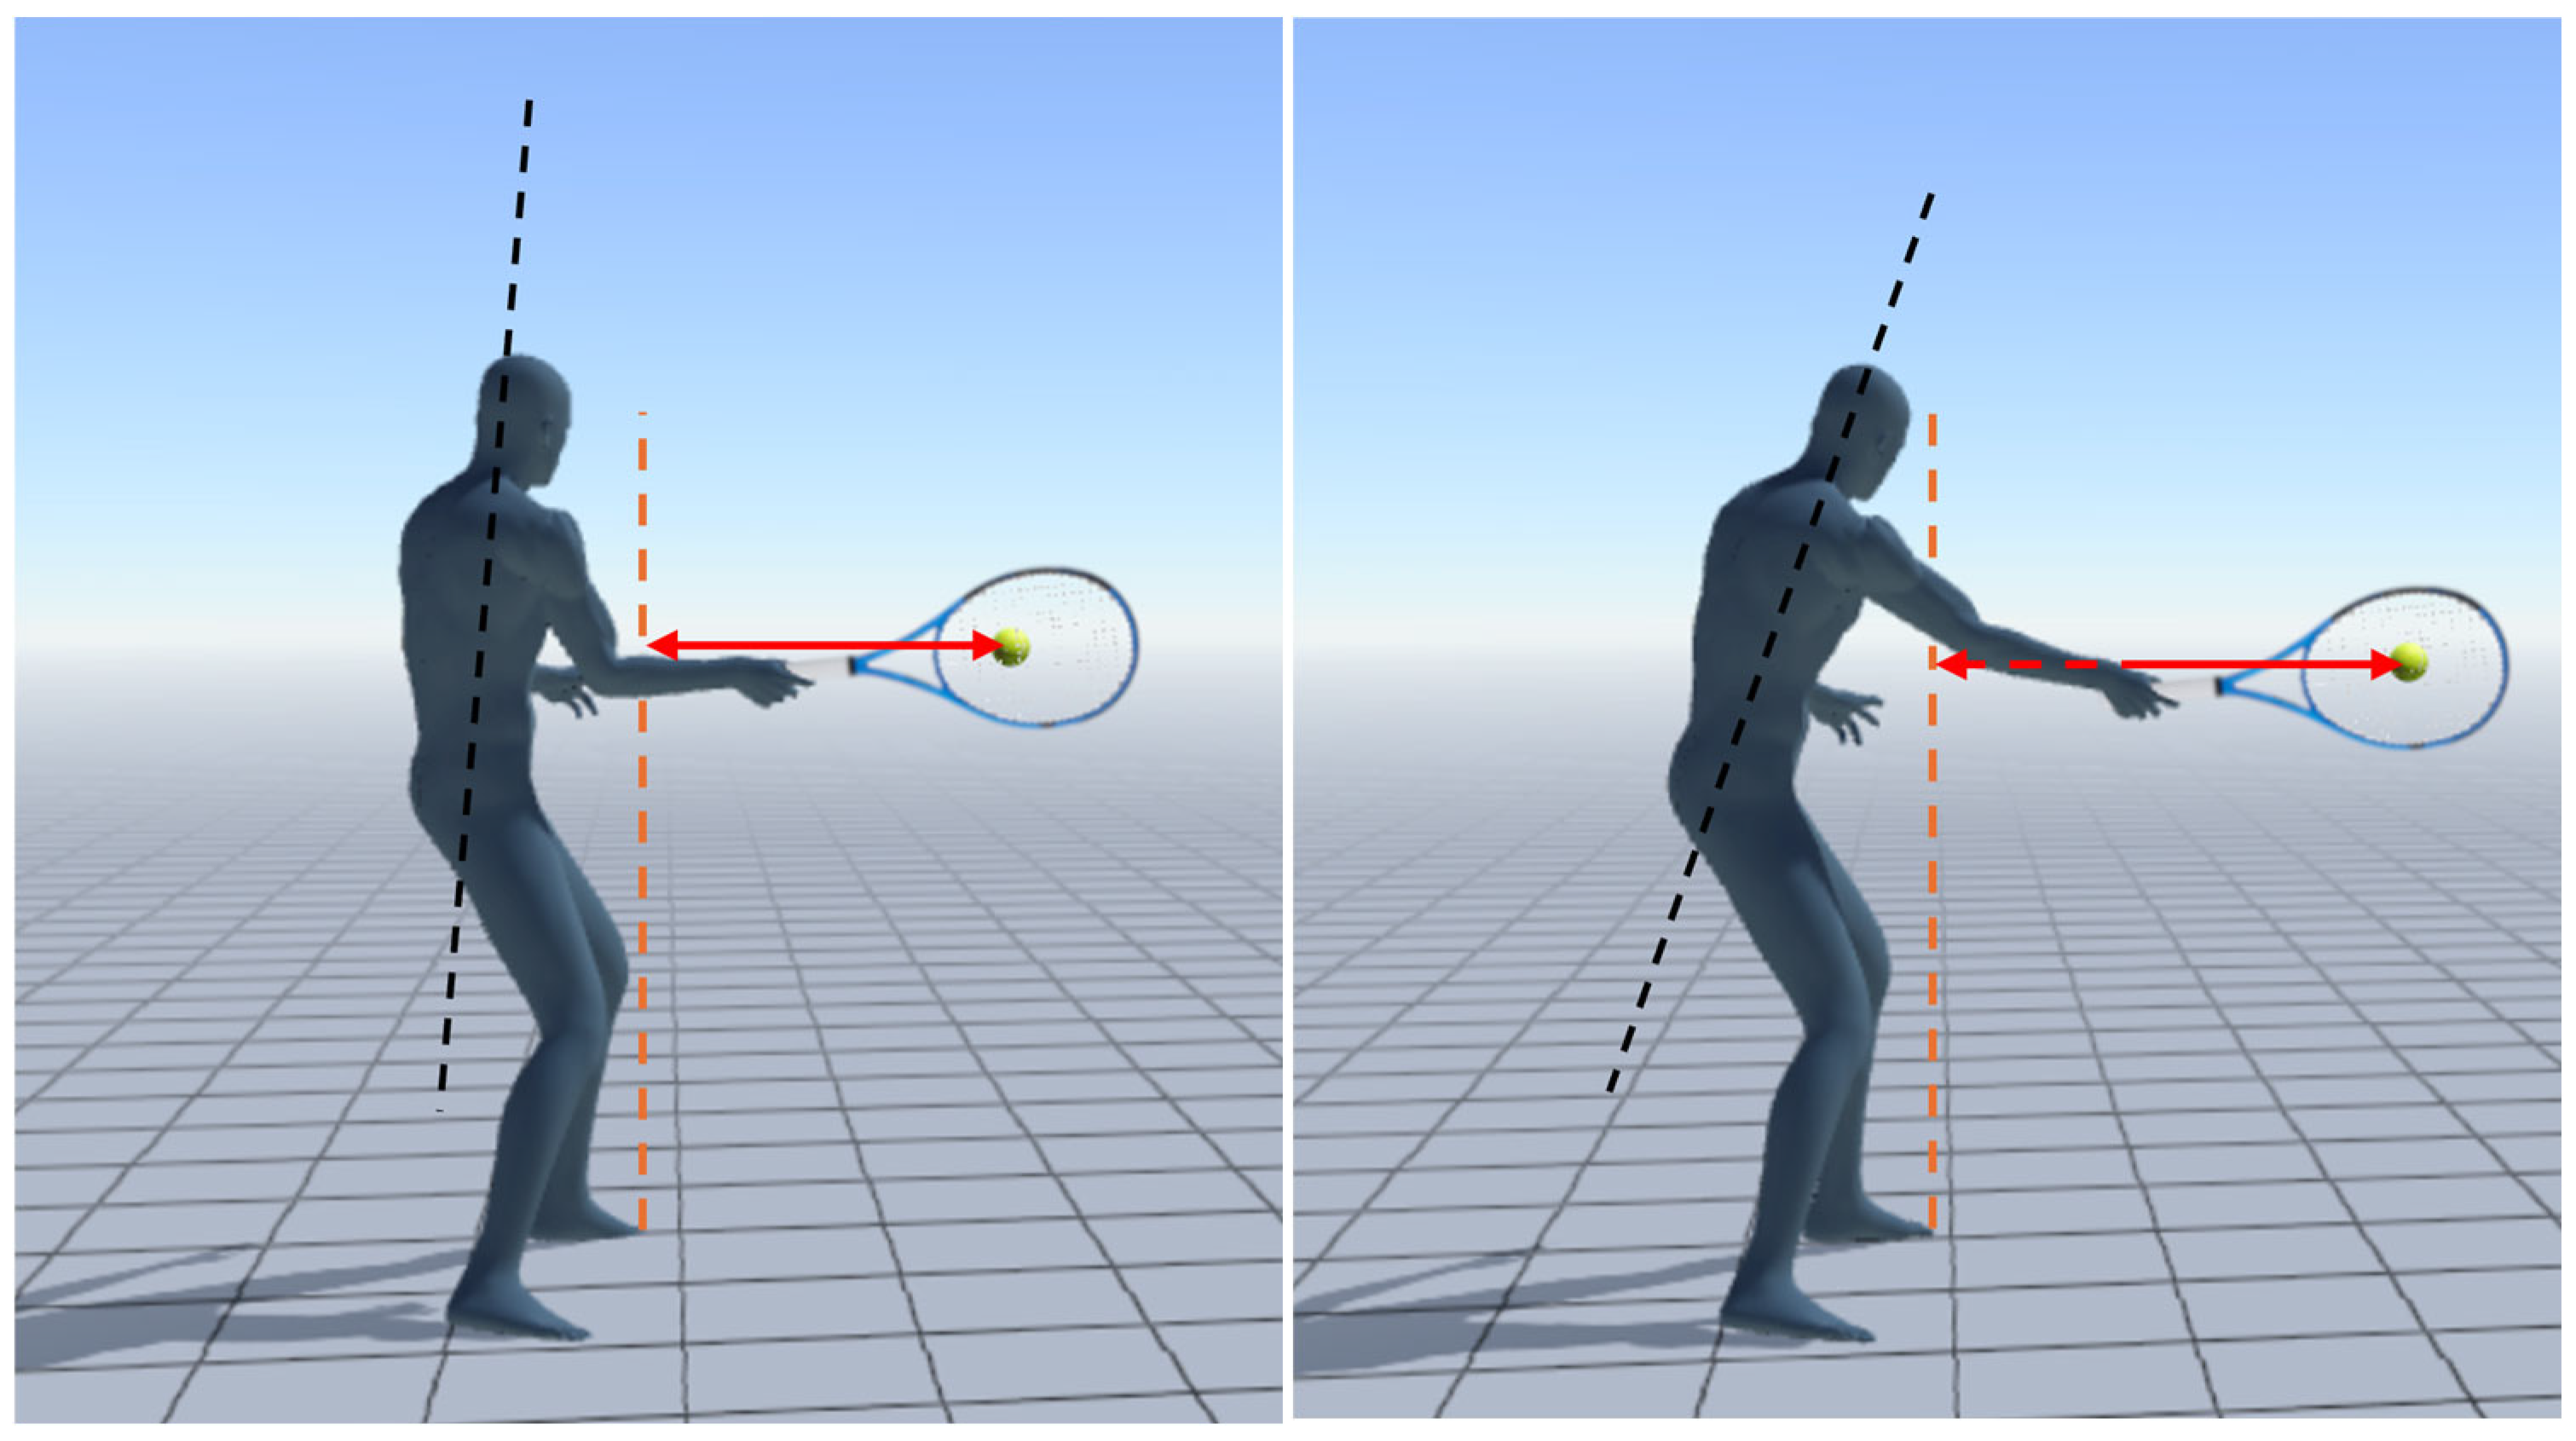
2.2. Forehand Assessment
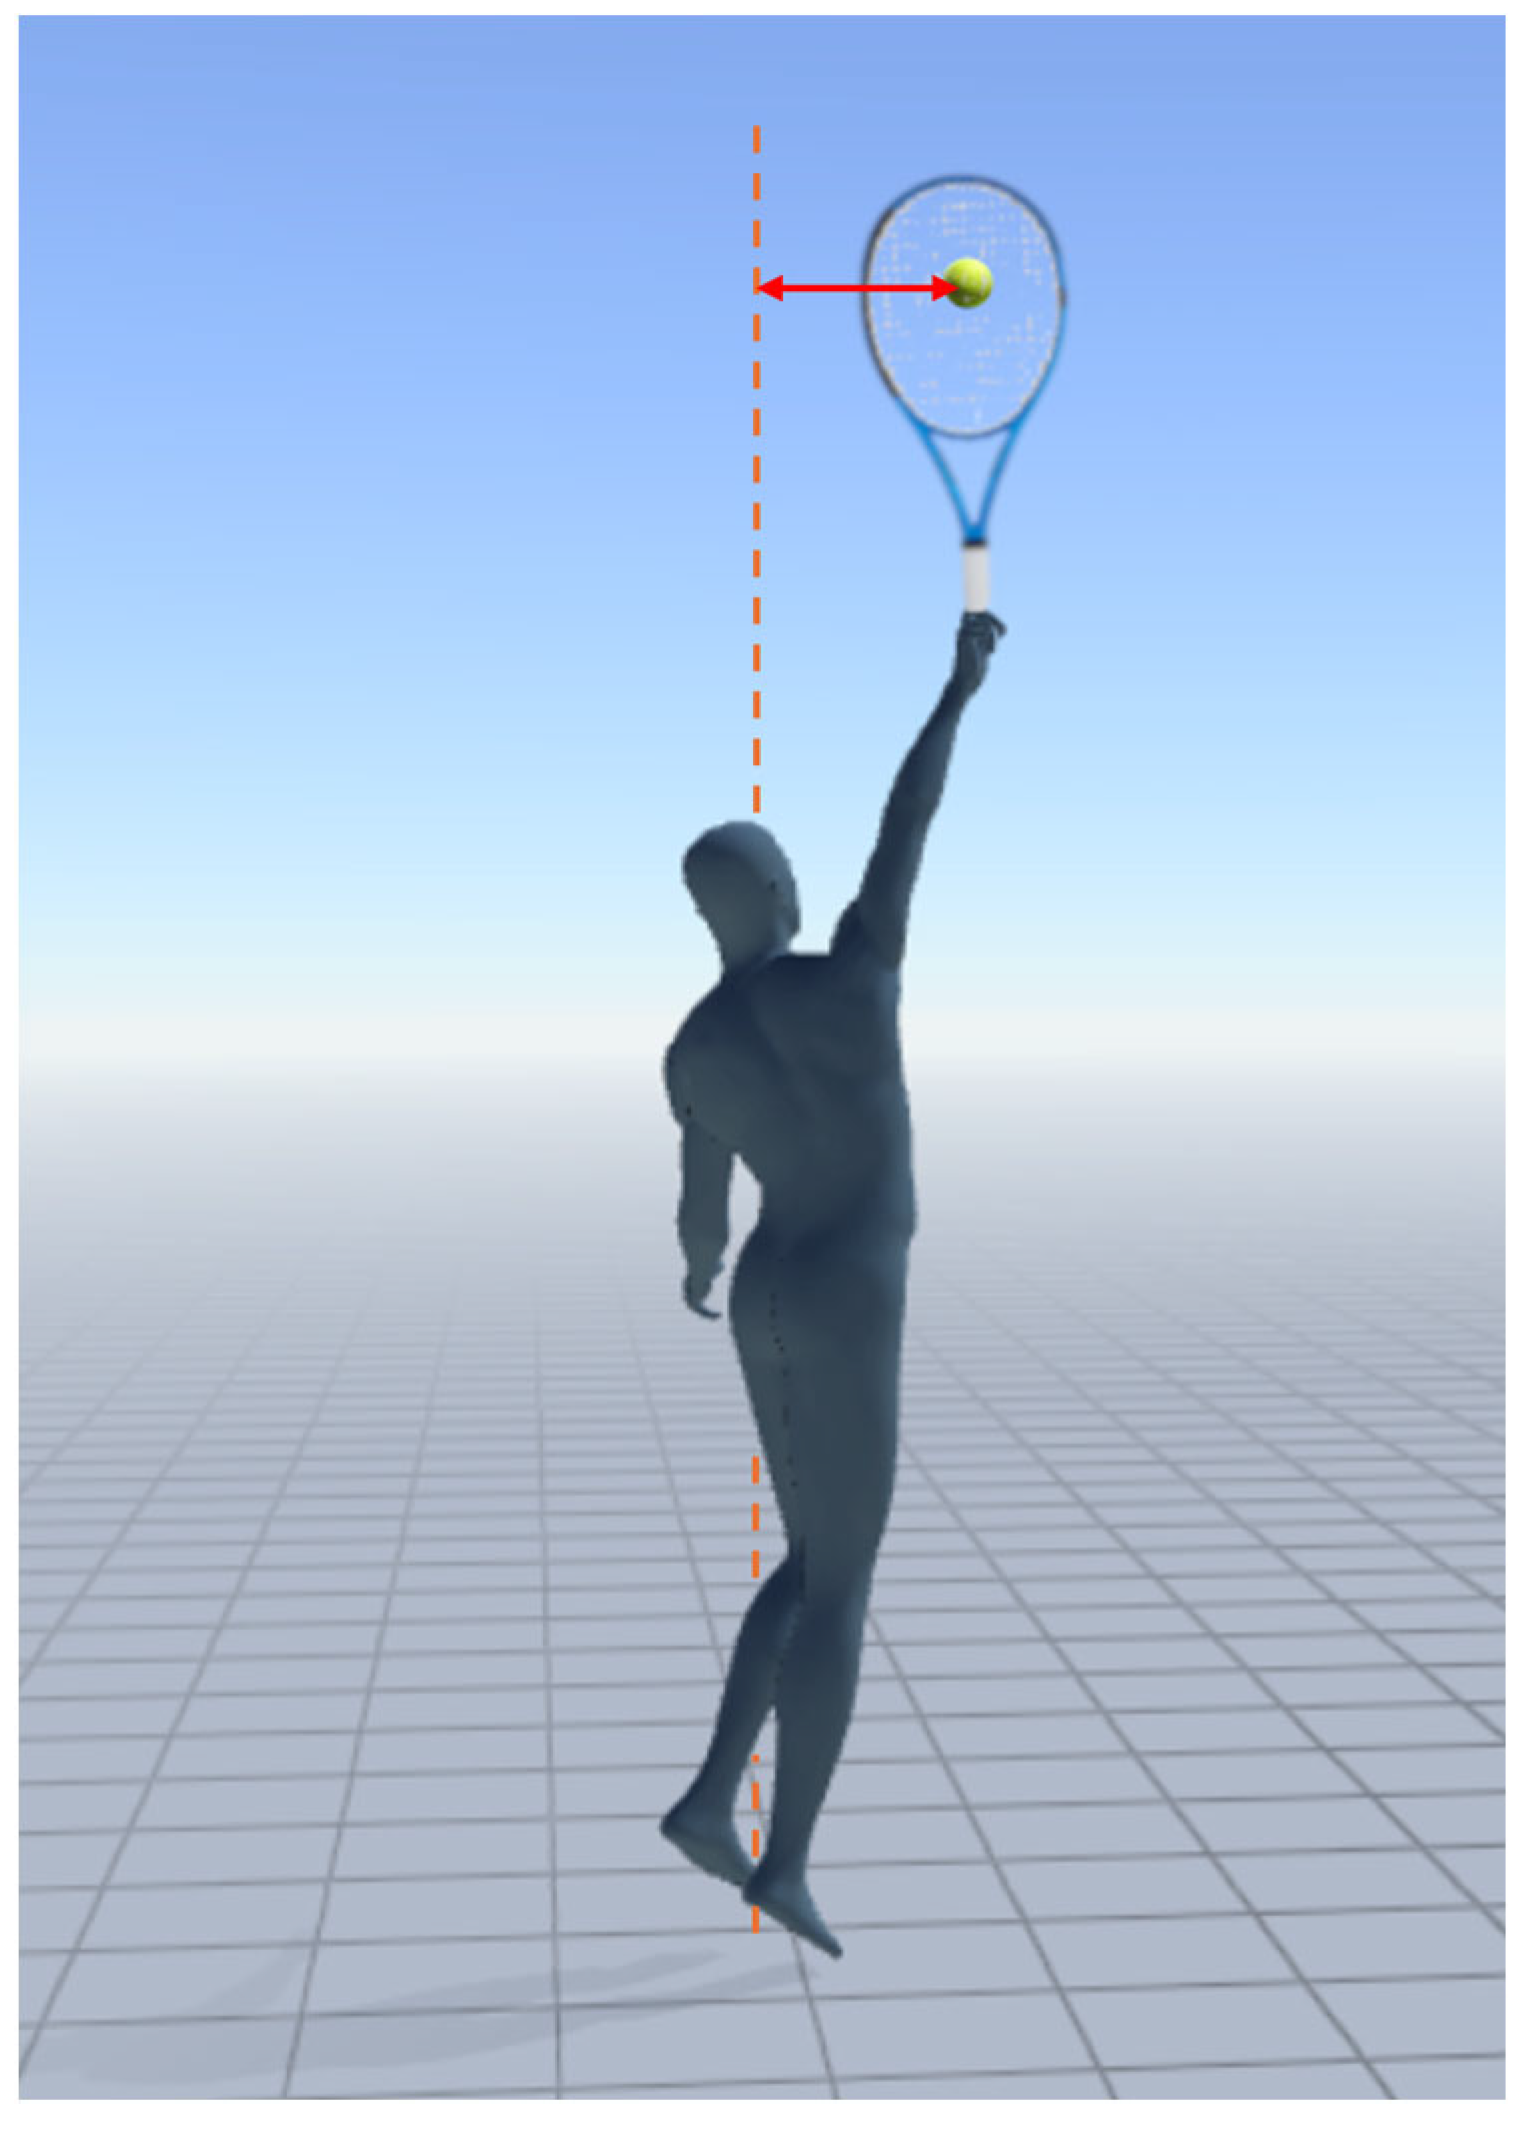
2.3. Serve Assessment
2.4. Video Analysis
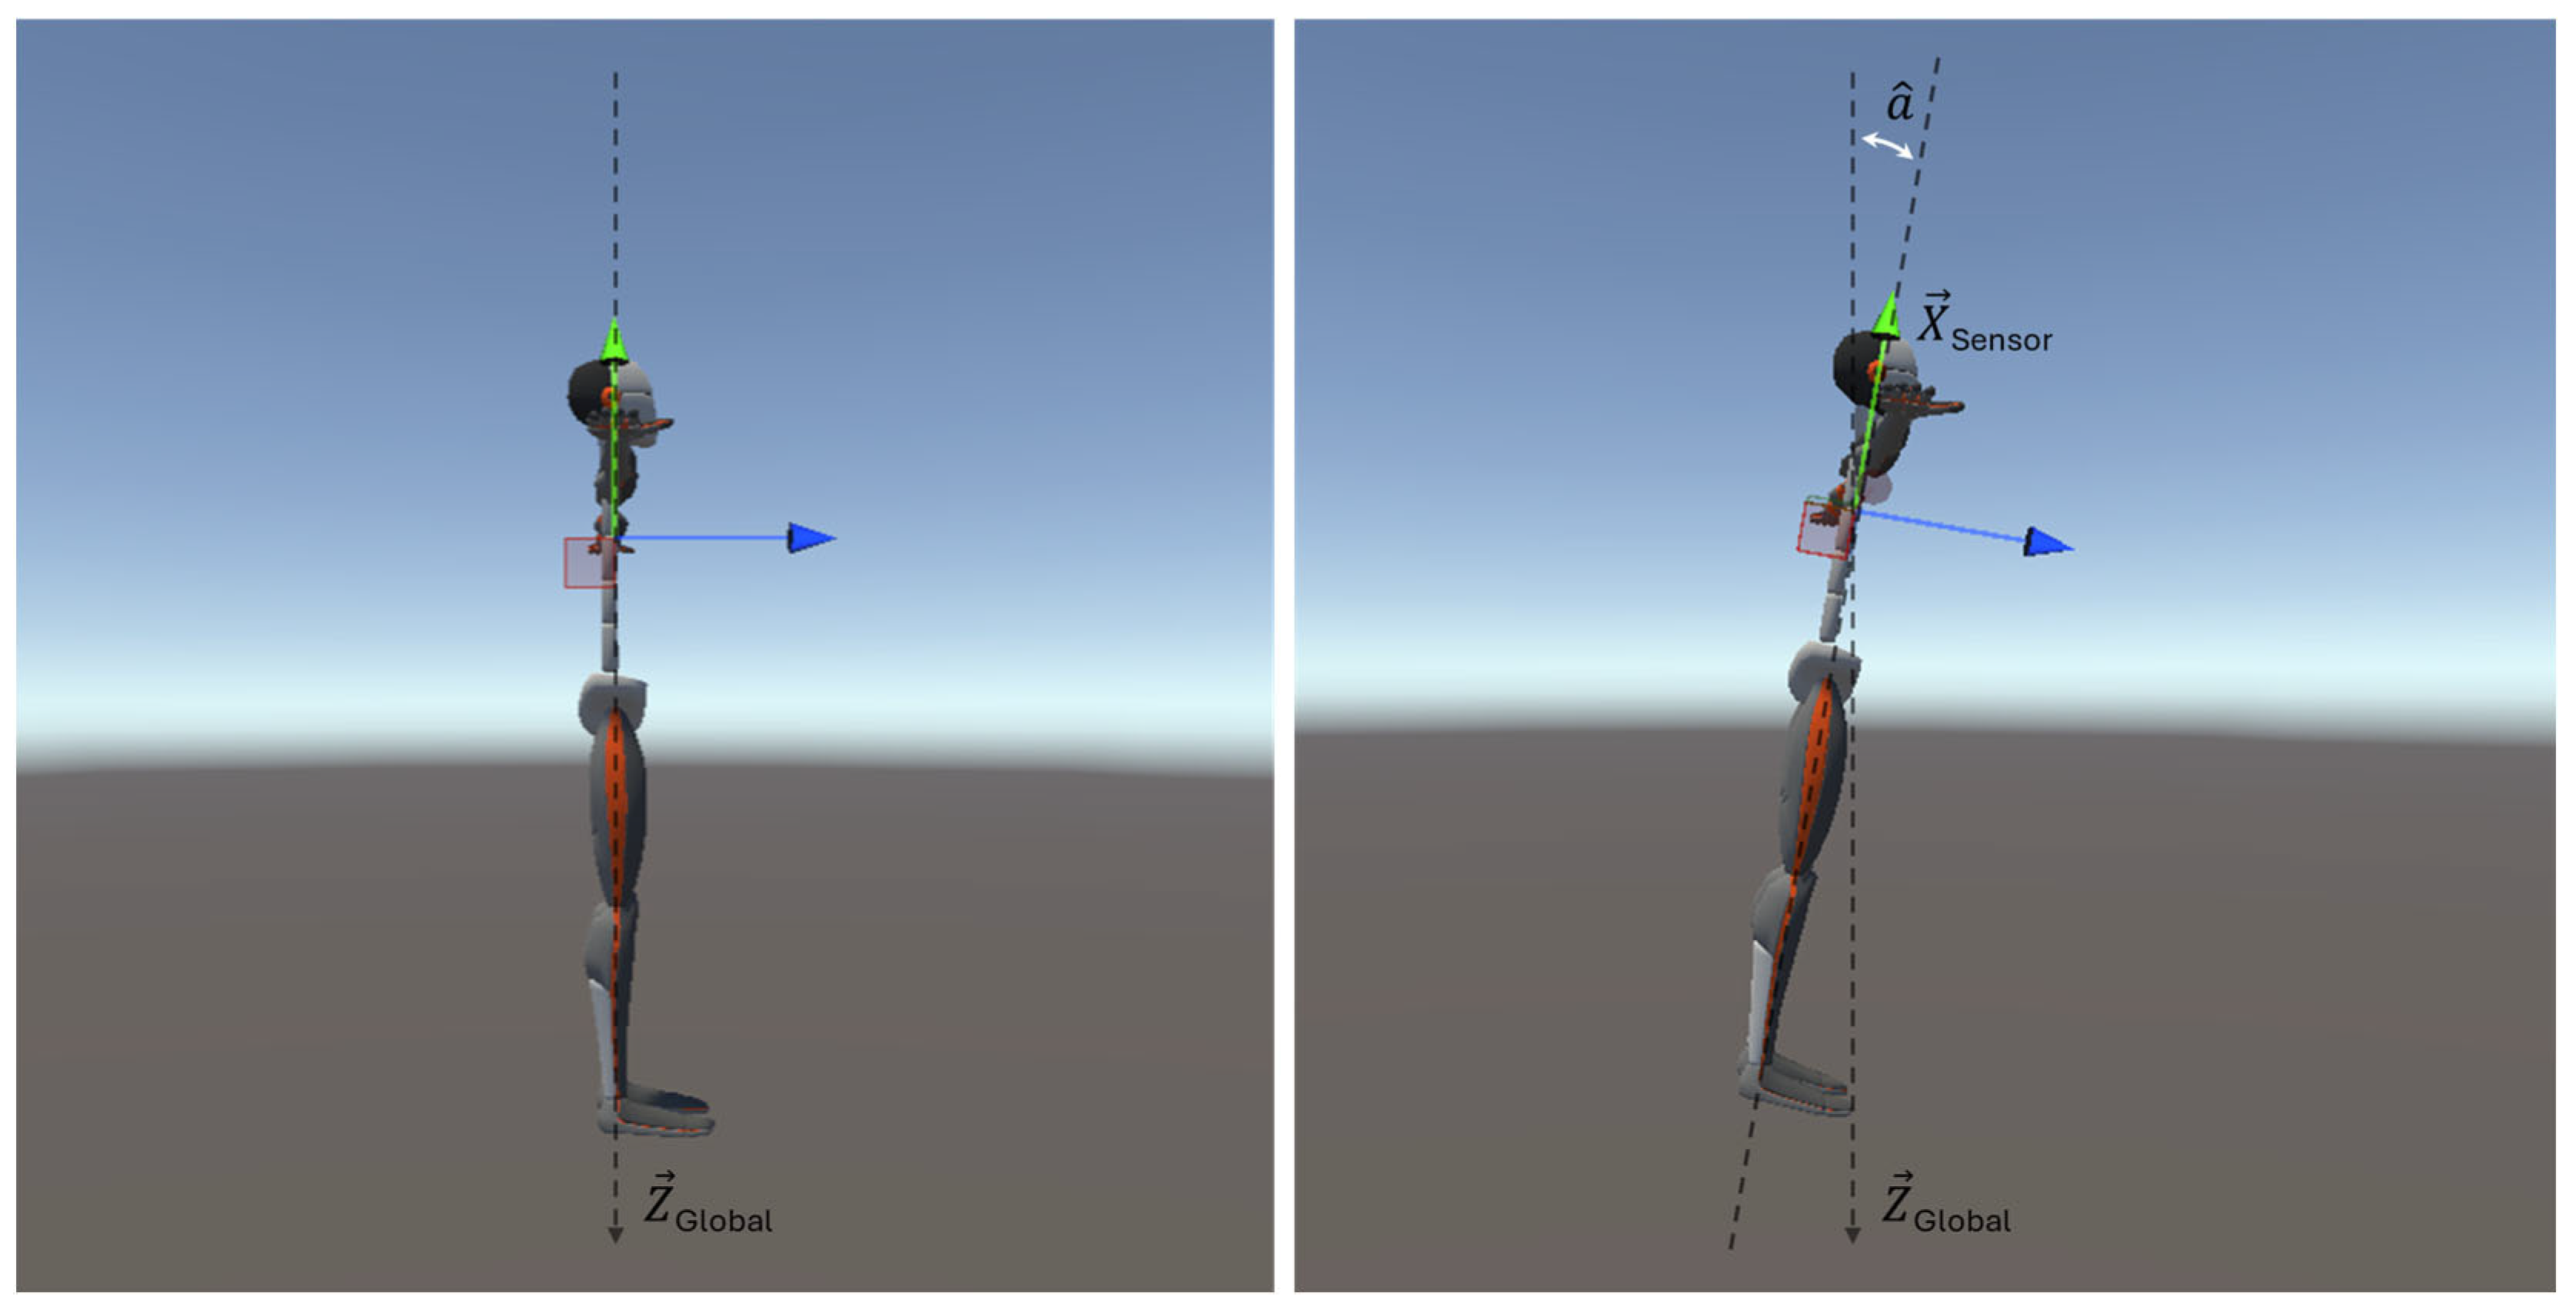
2.5. Inertial System Data Analysis
2.6. Statistical Analysis
2.7. Exclusion Criteria
3. Results
3.1. Forehand
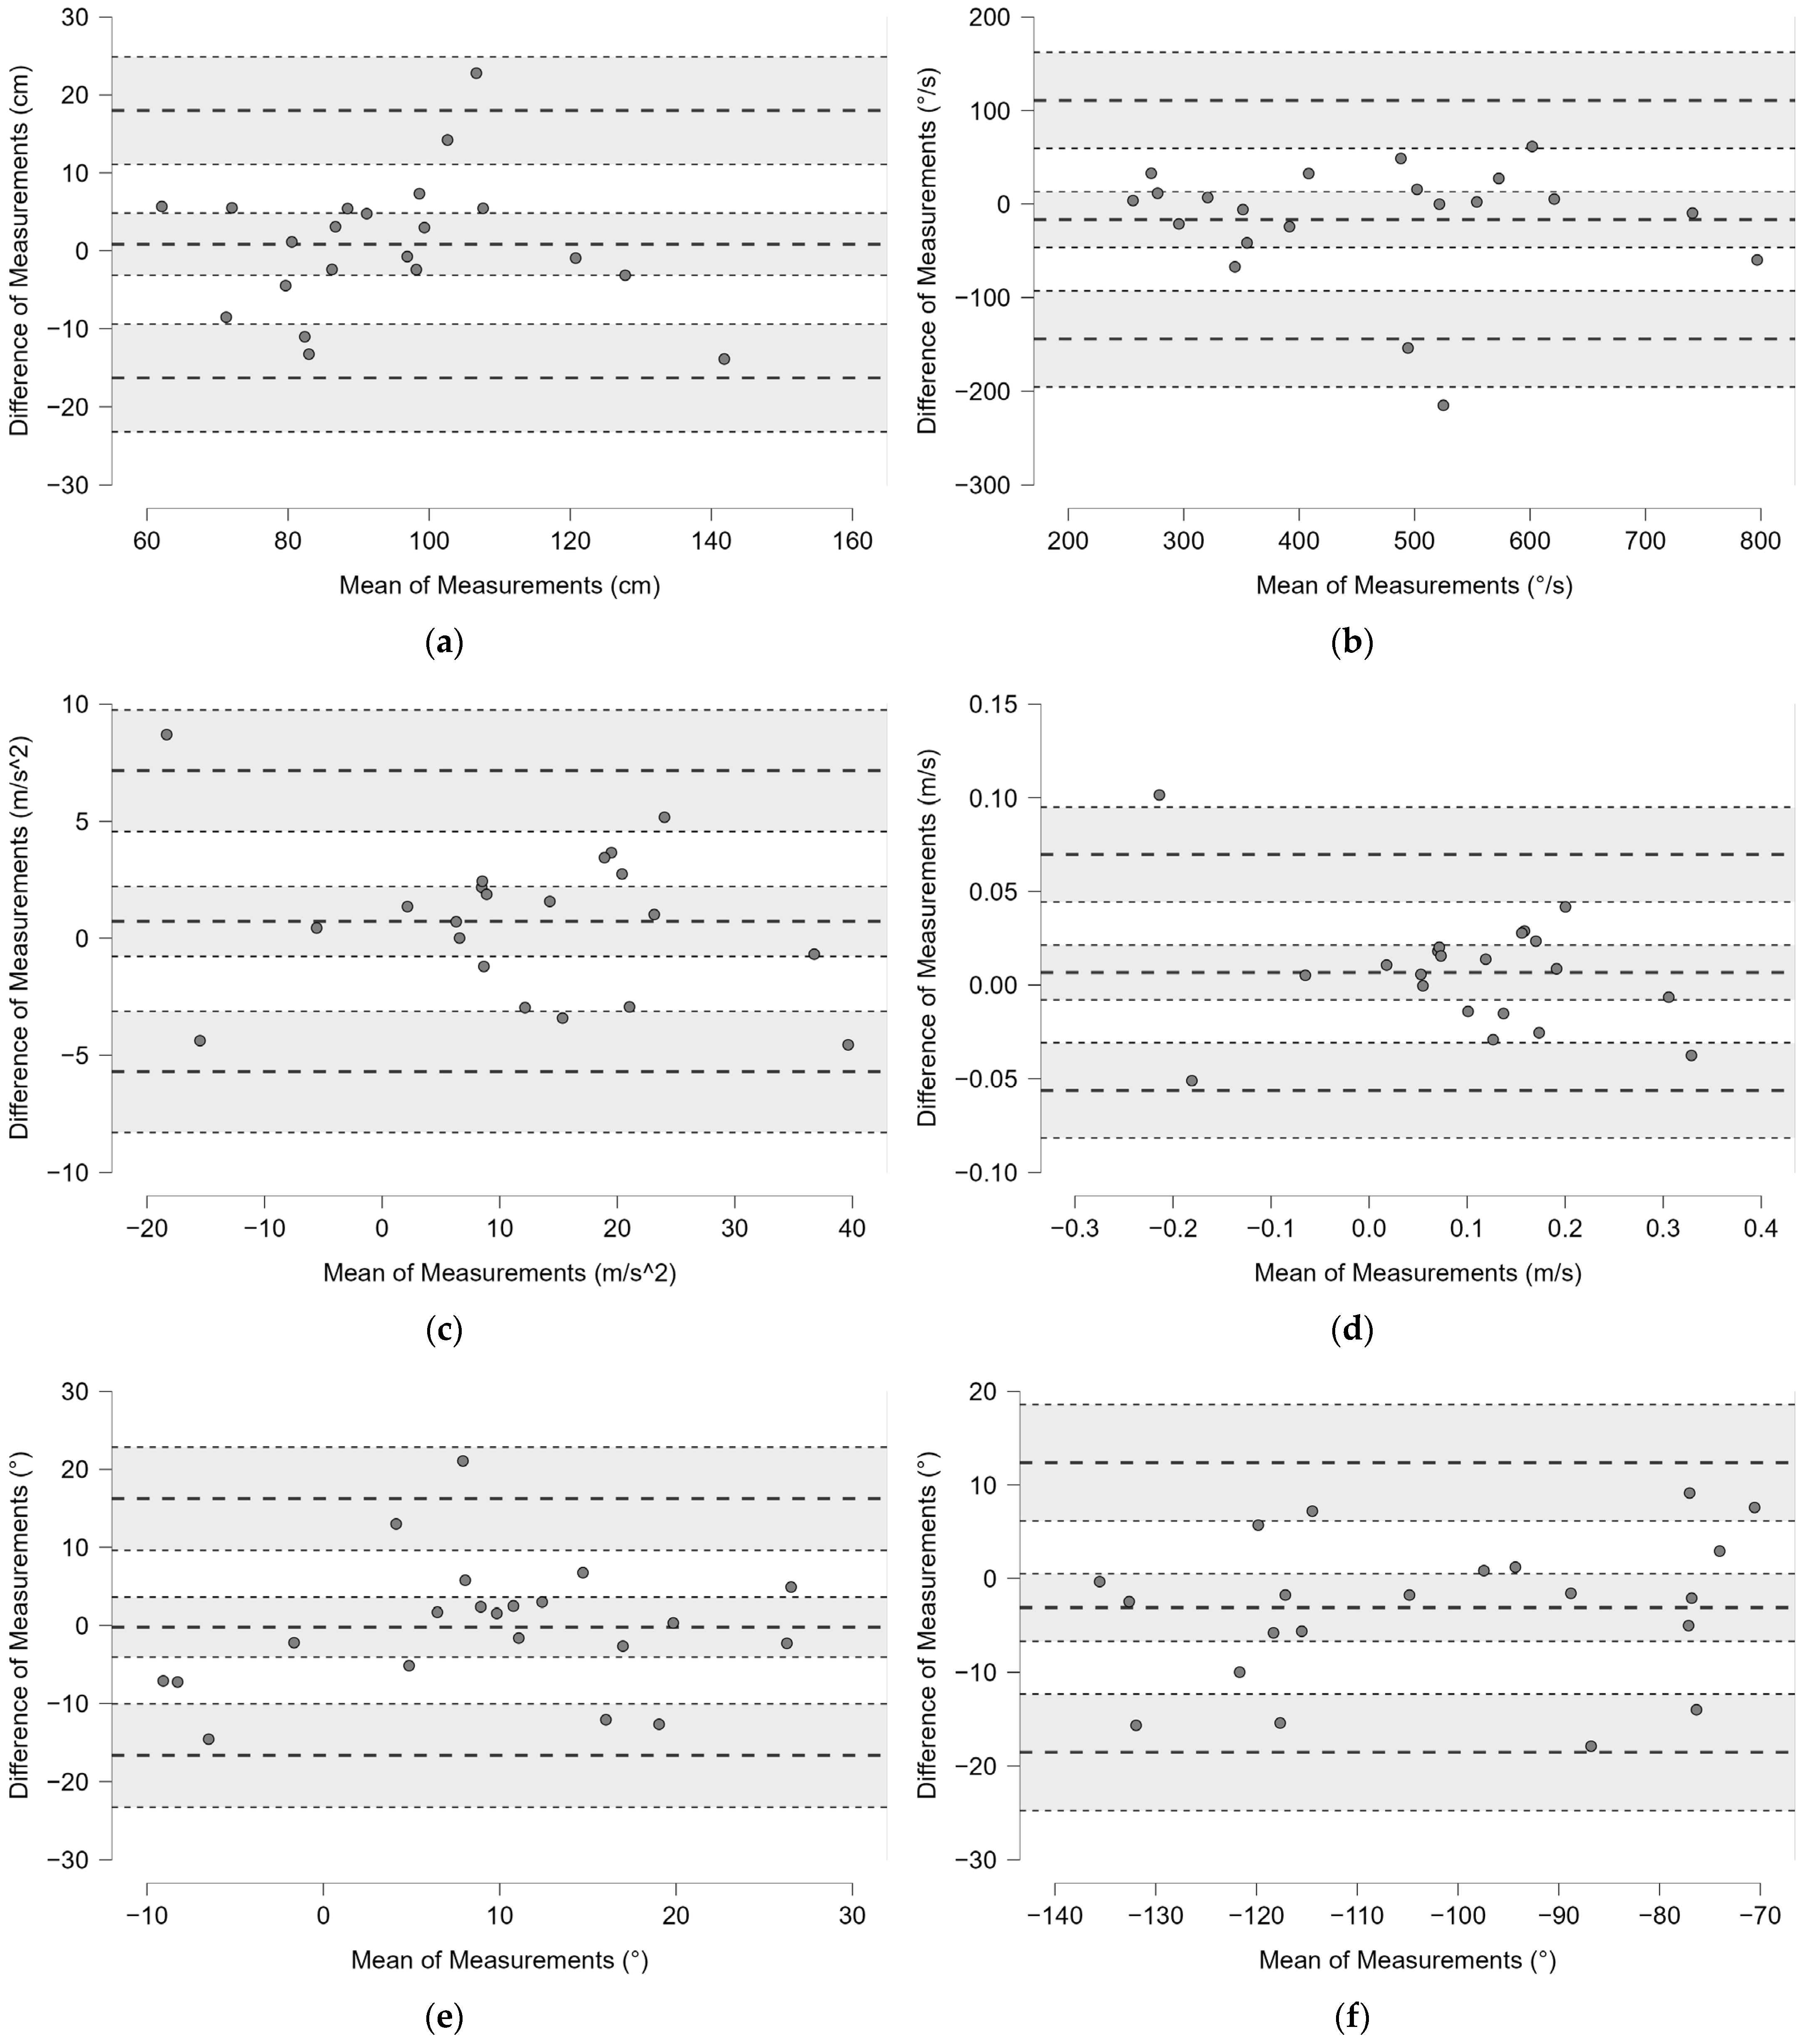
3.1.1. Reliability
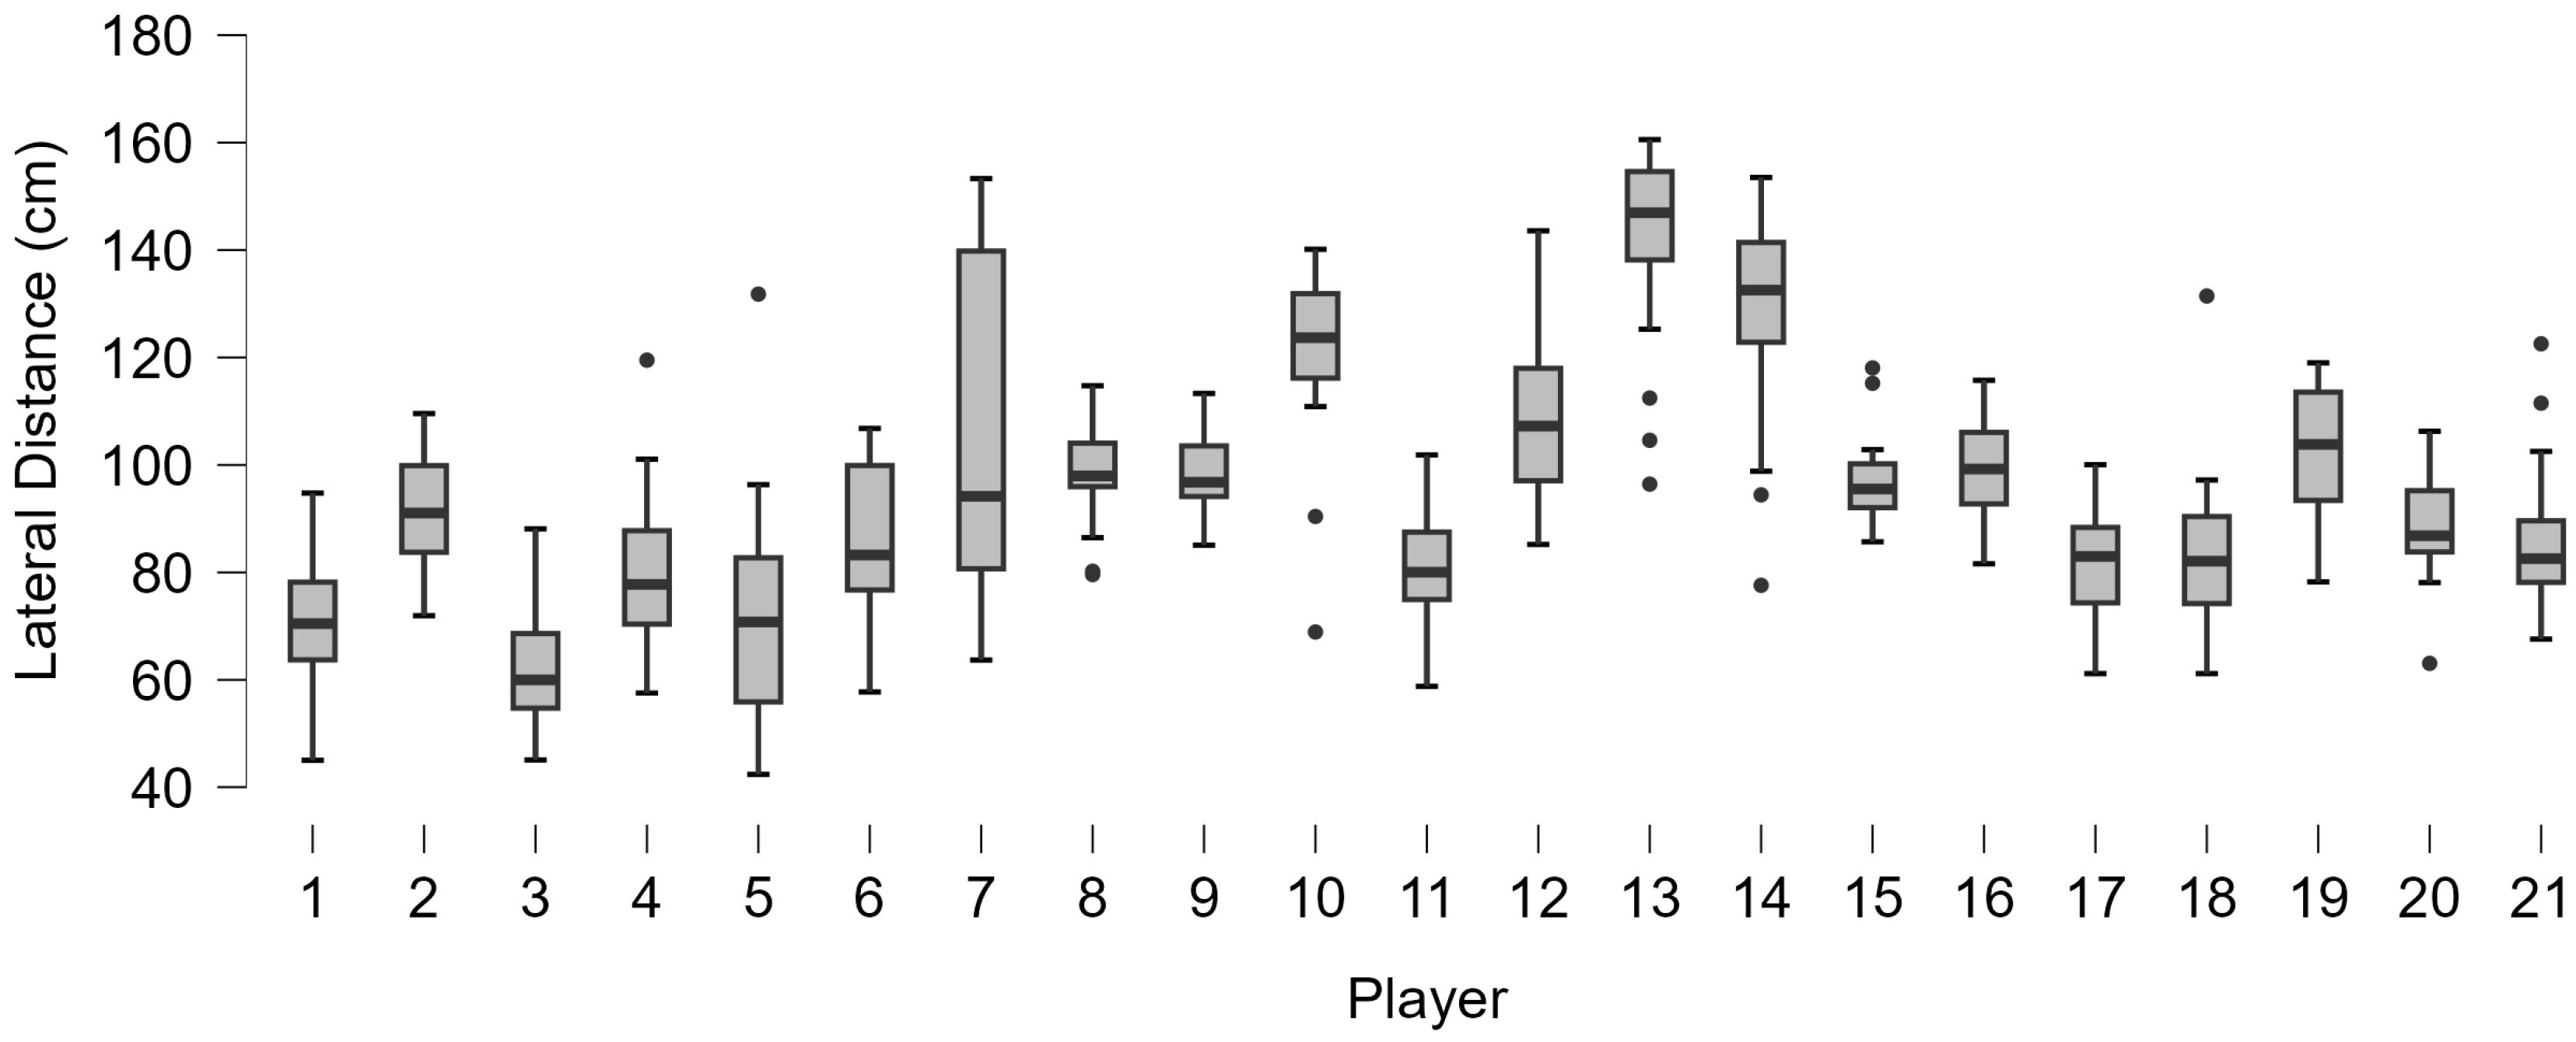
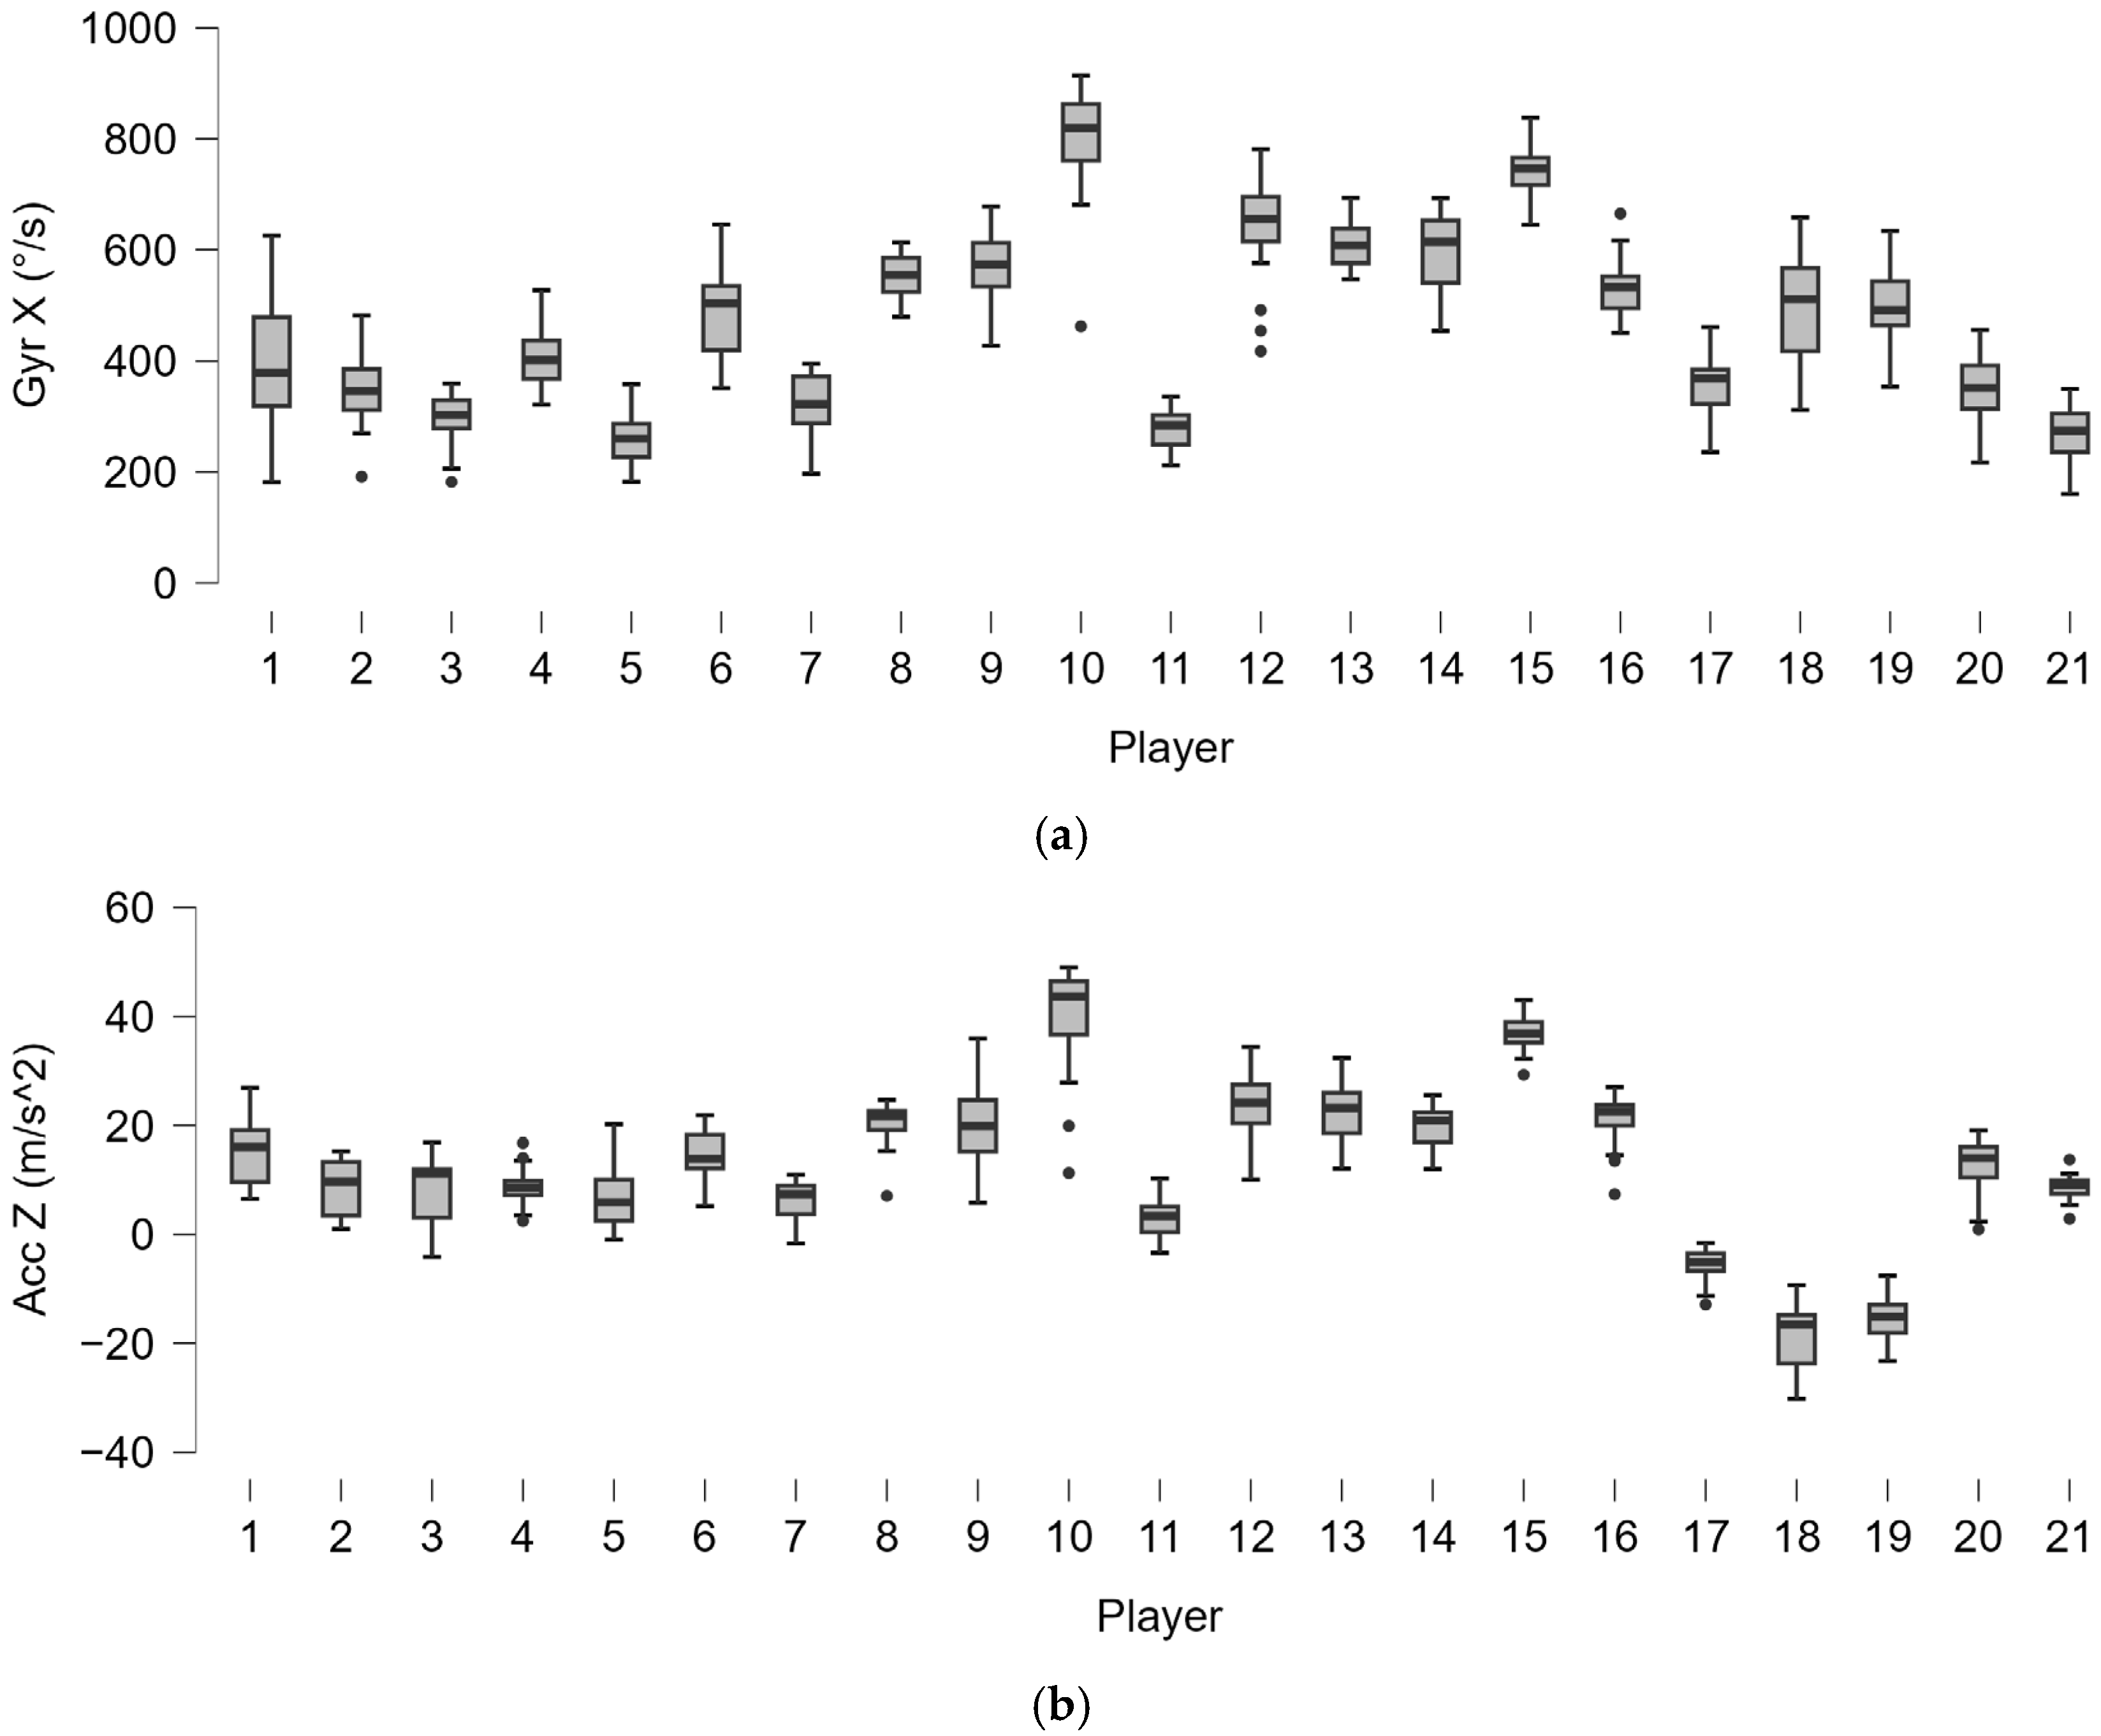
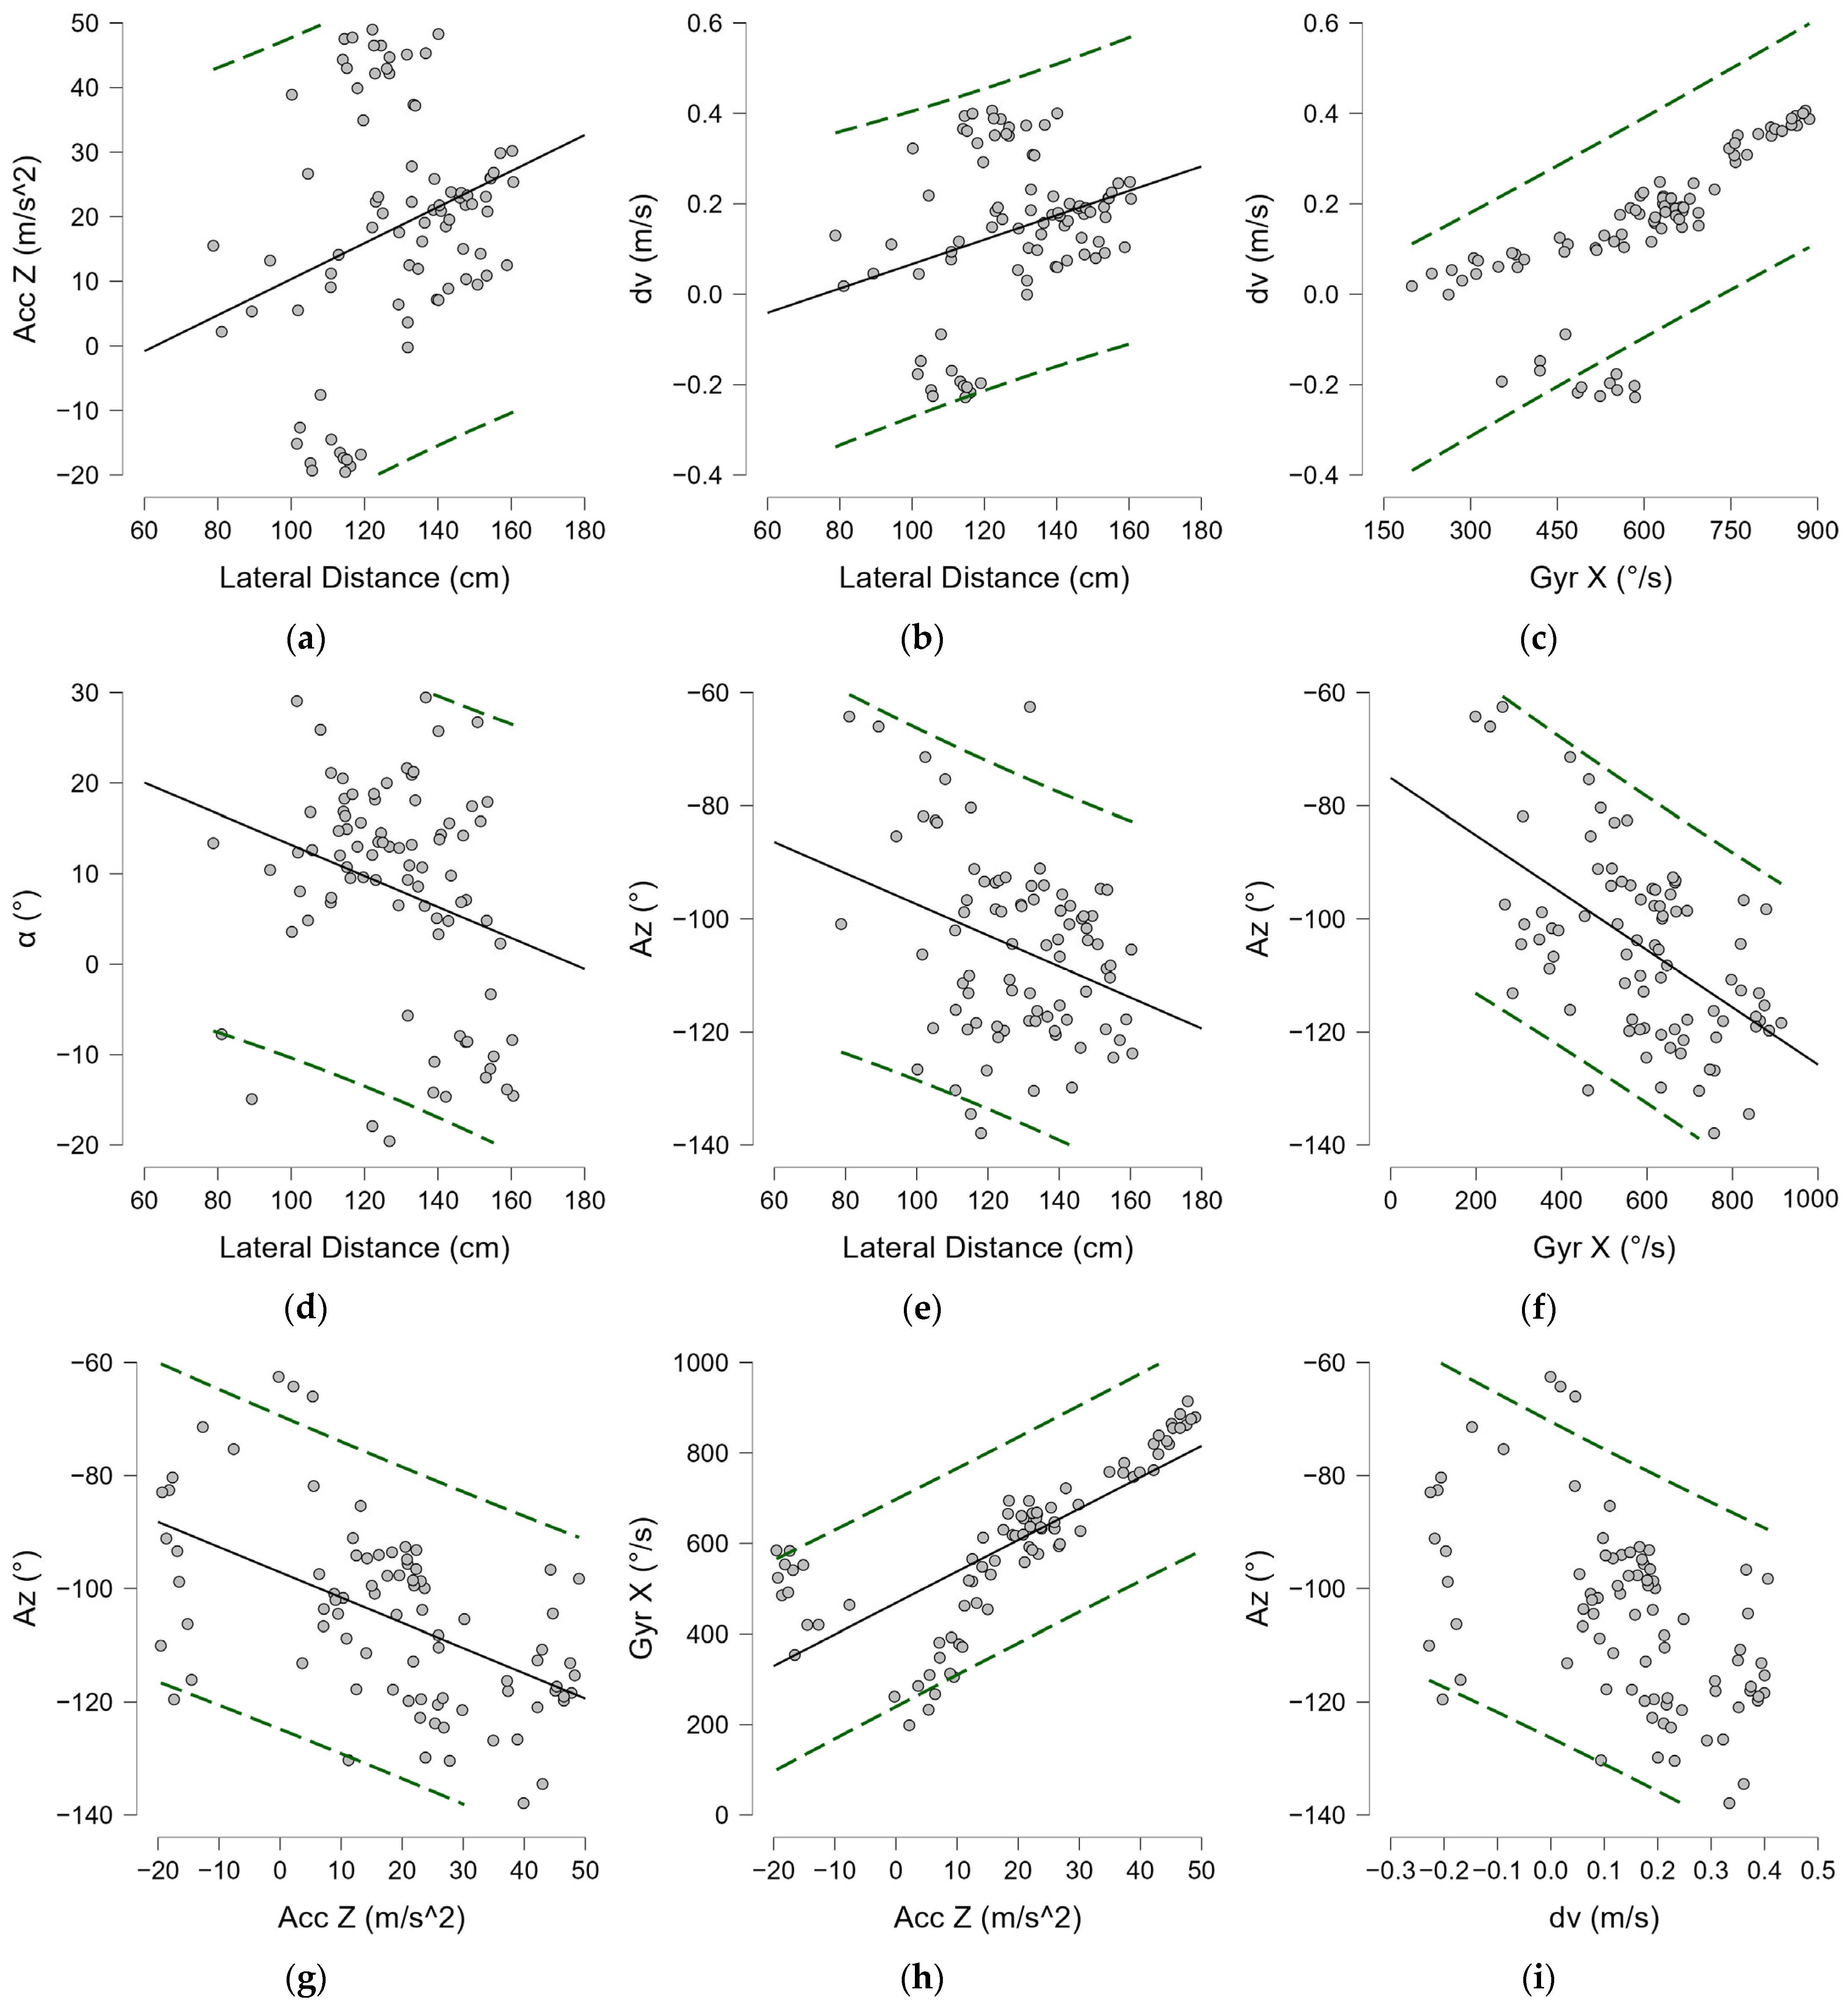
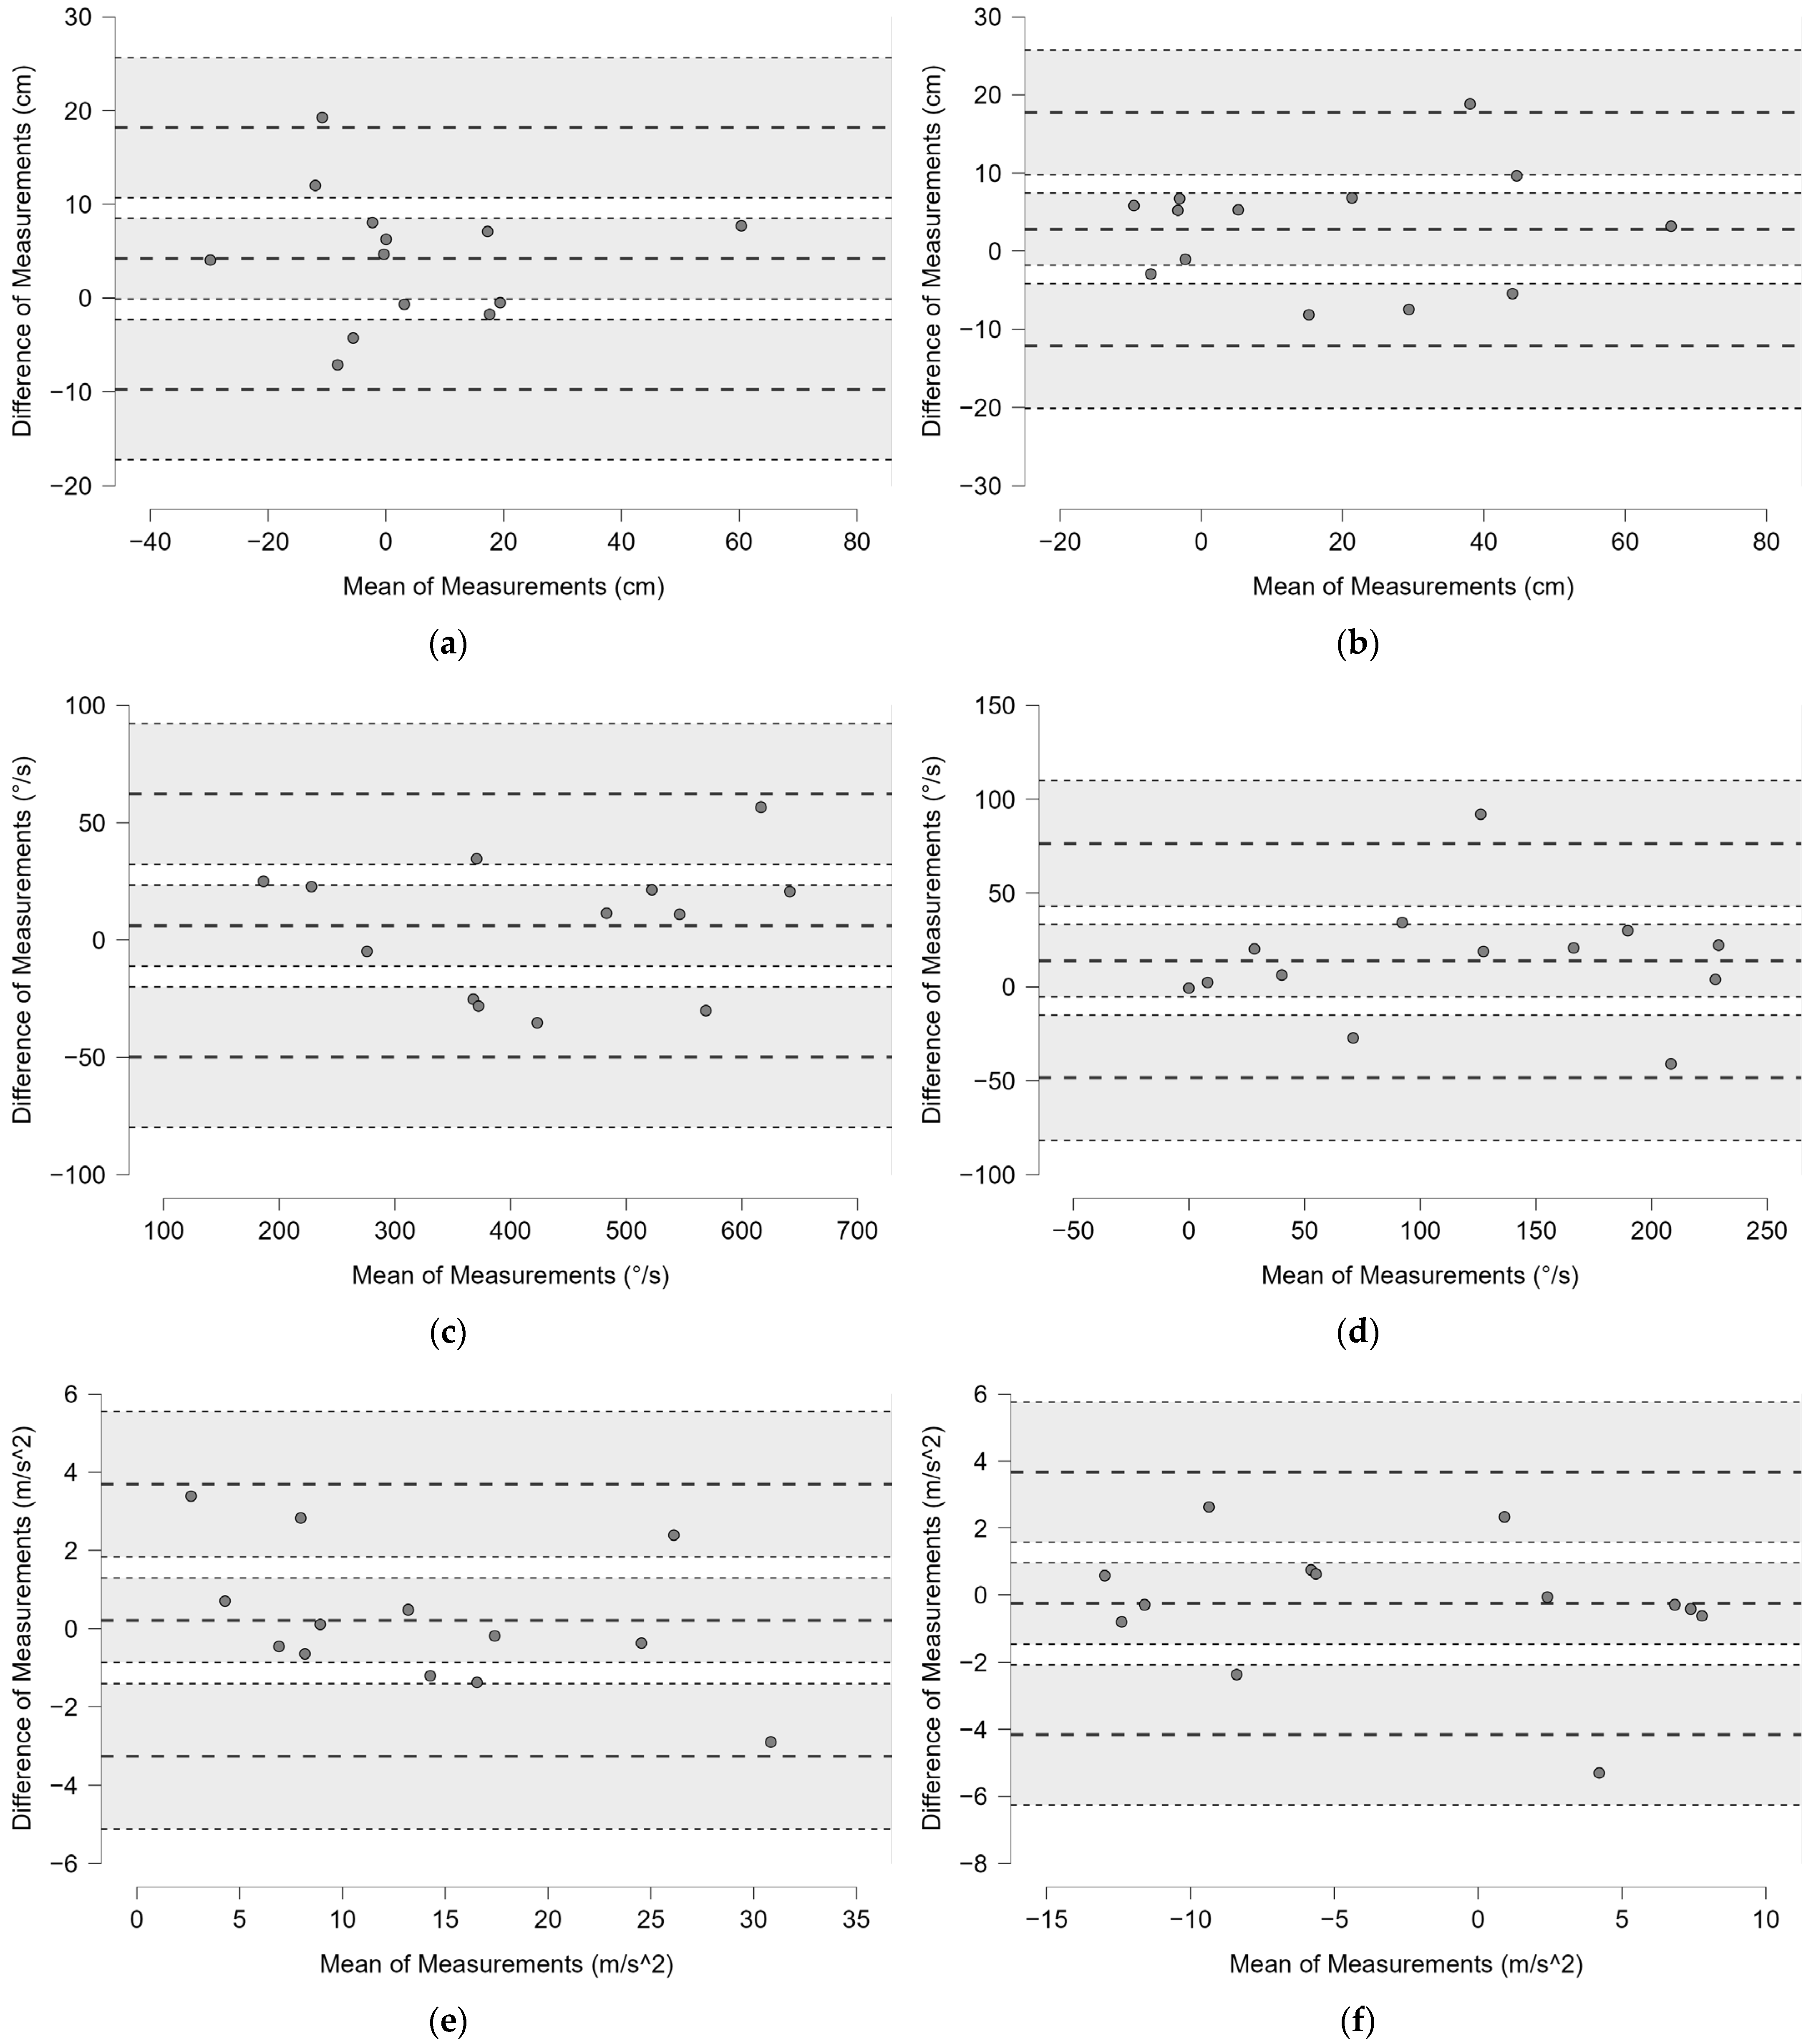
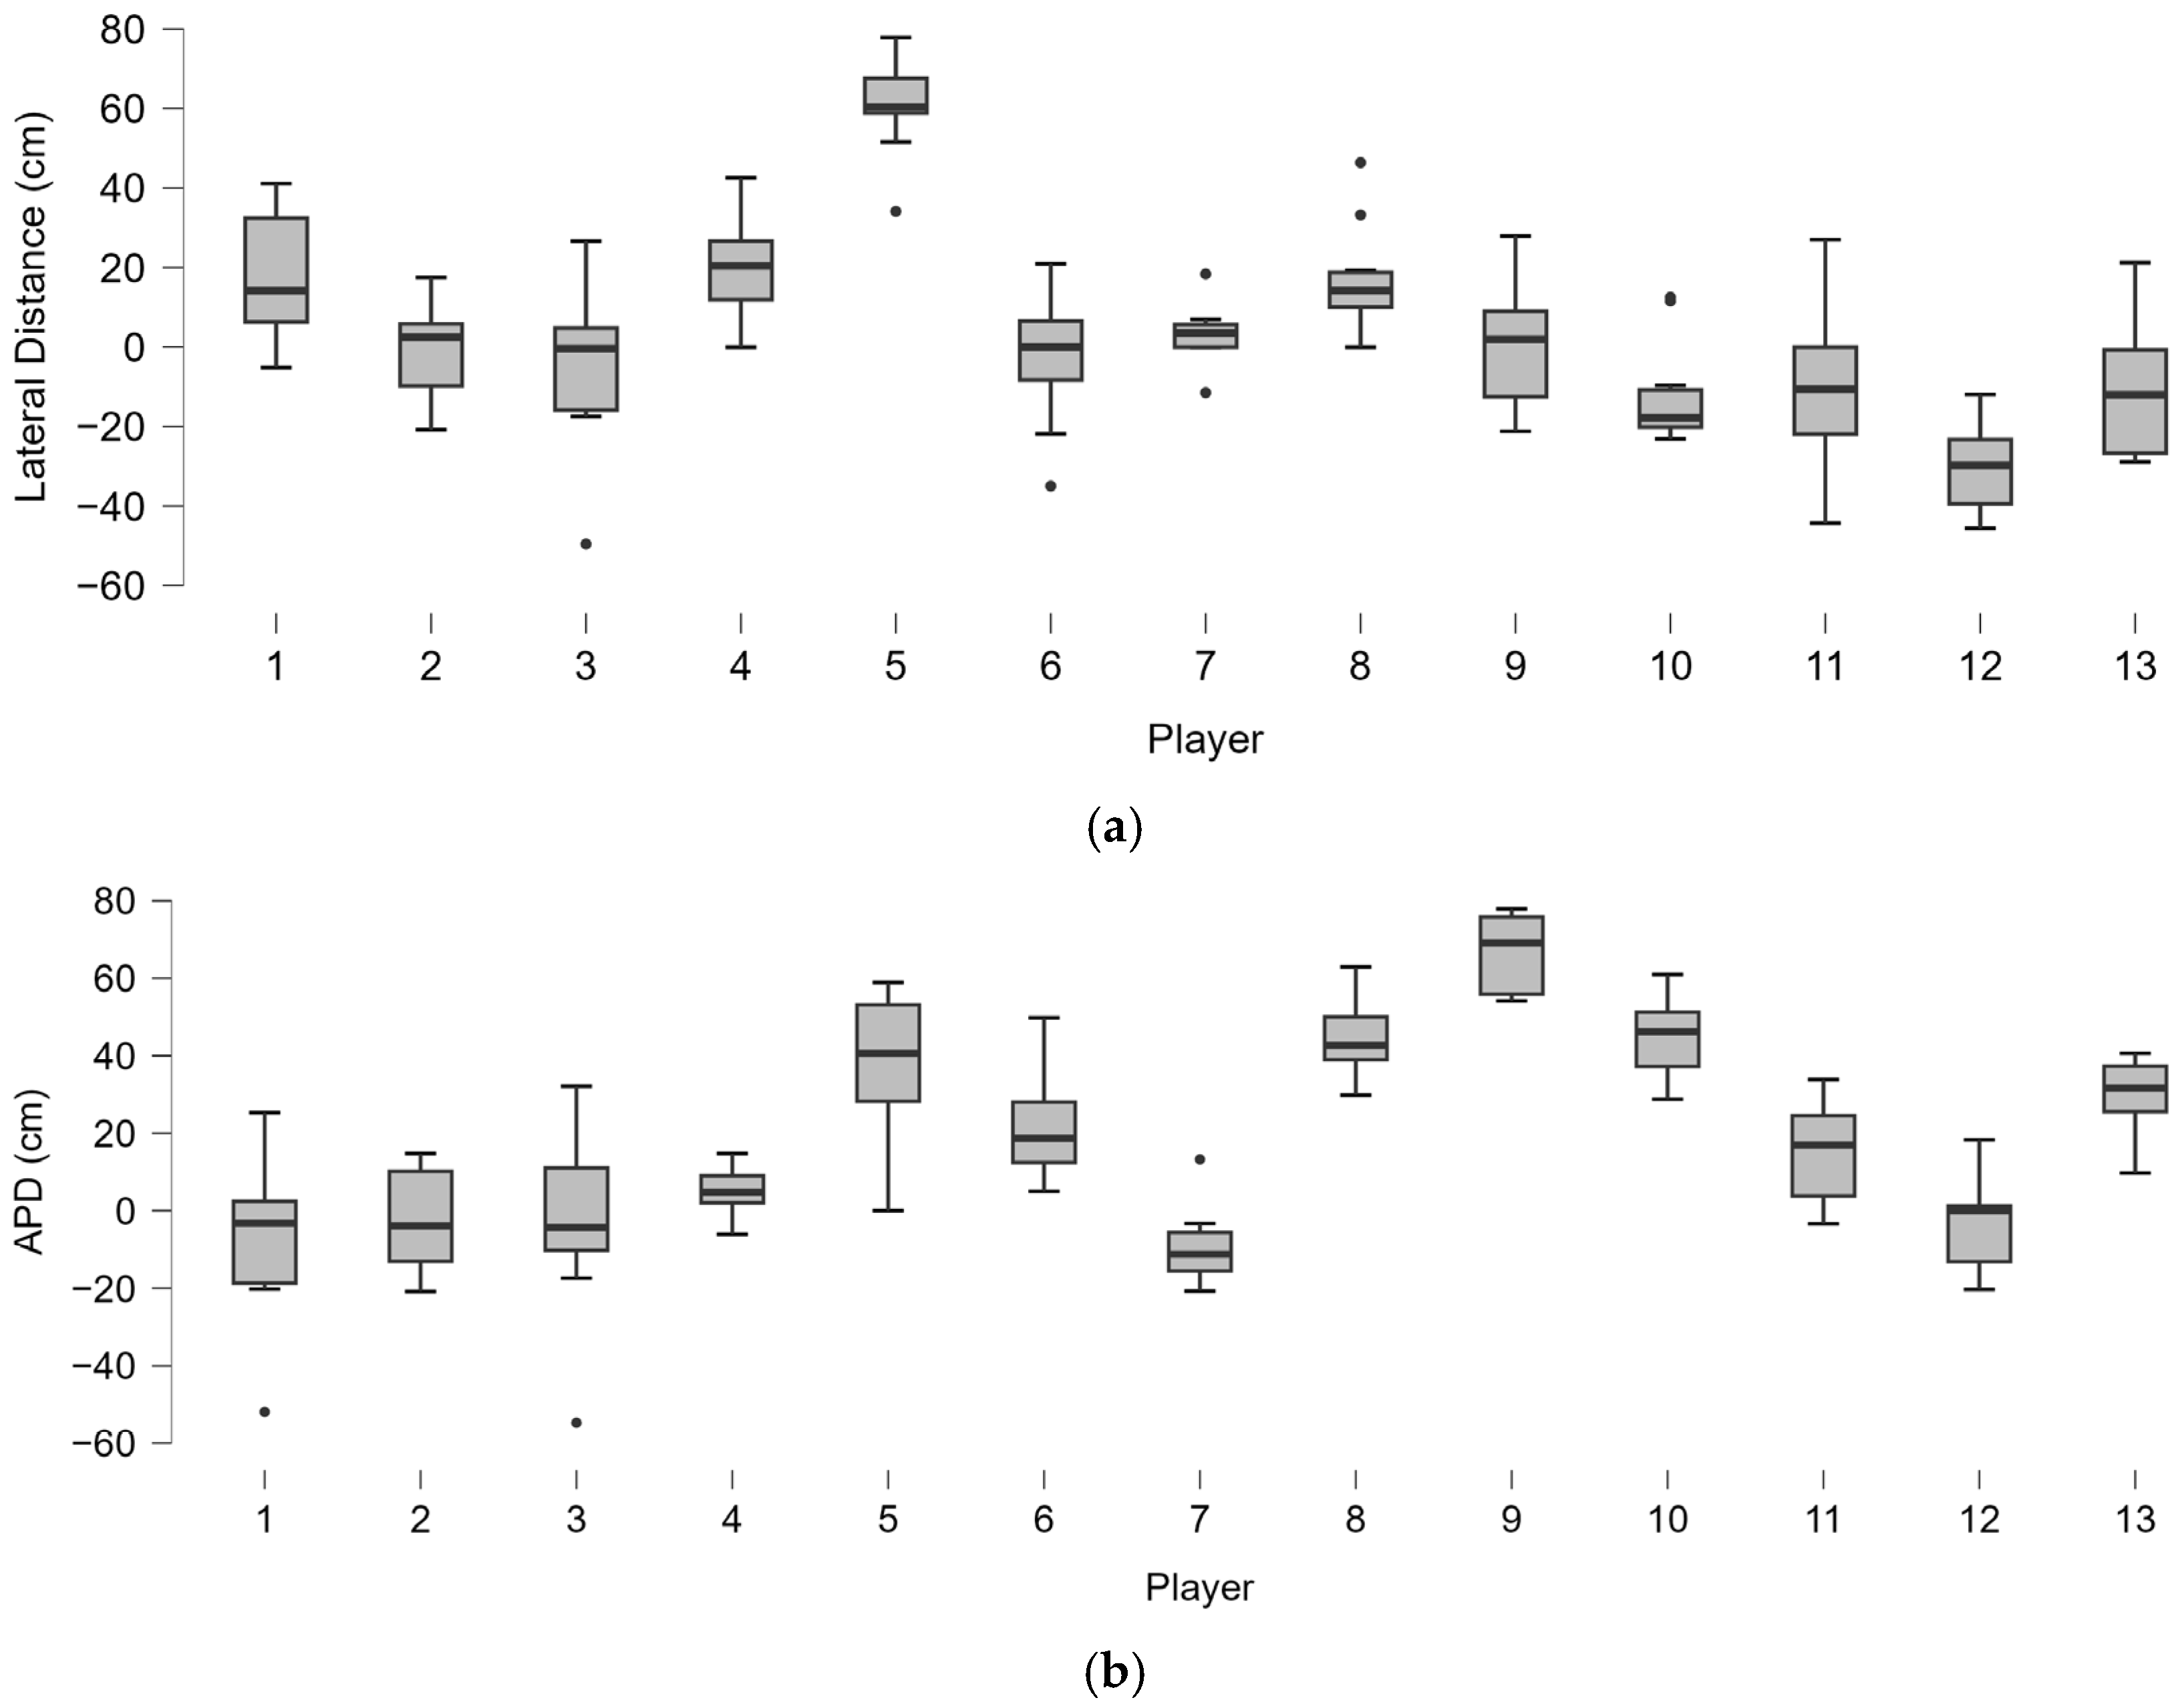
3.1.2. Data Variability
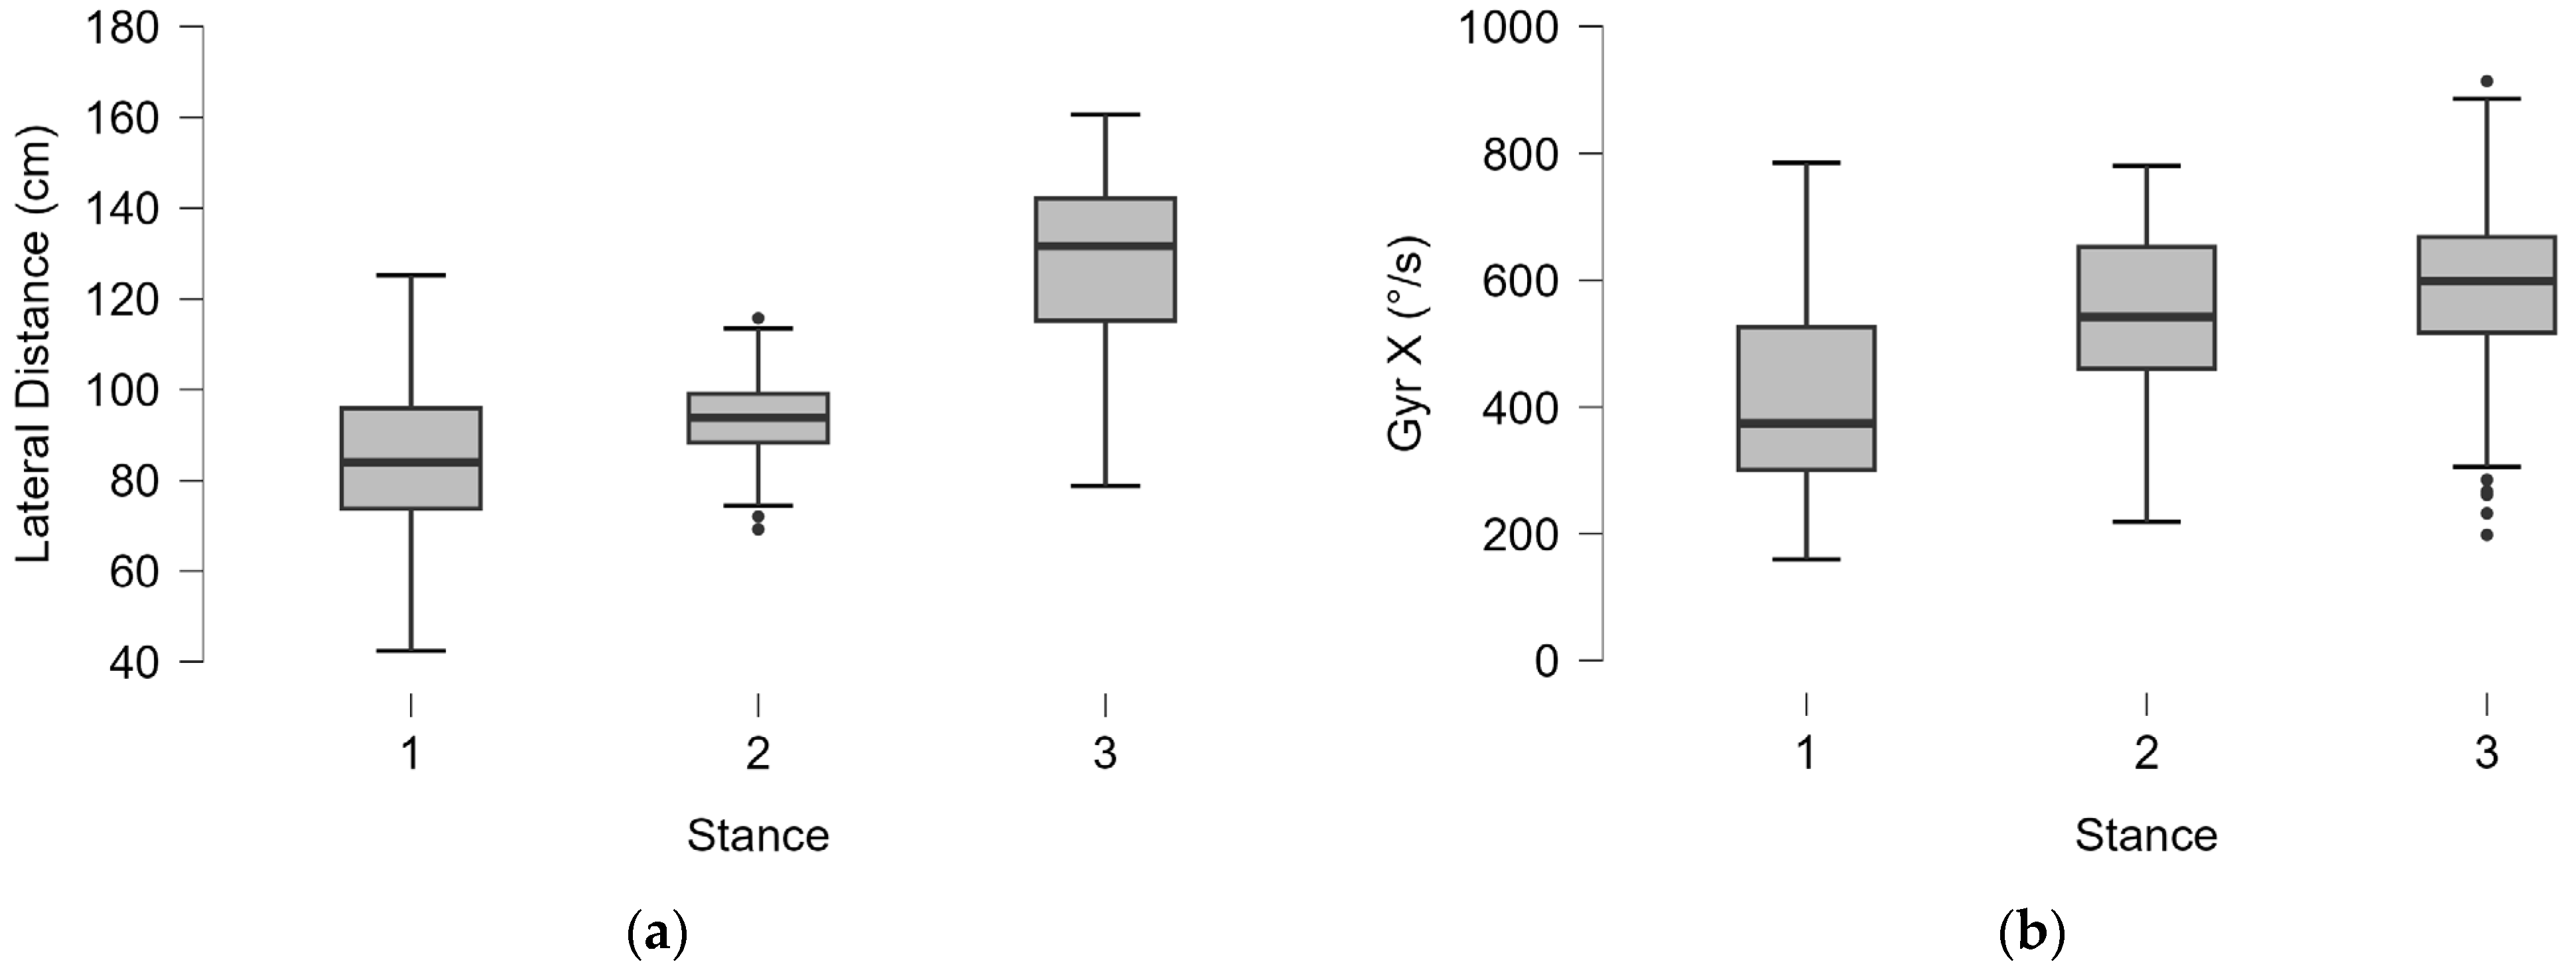
3.1.3. Neutral Stance
3.1.4. Open Stance
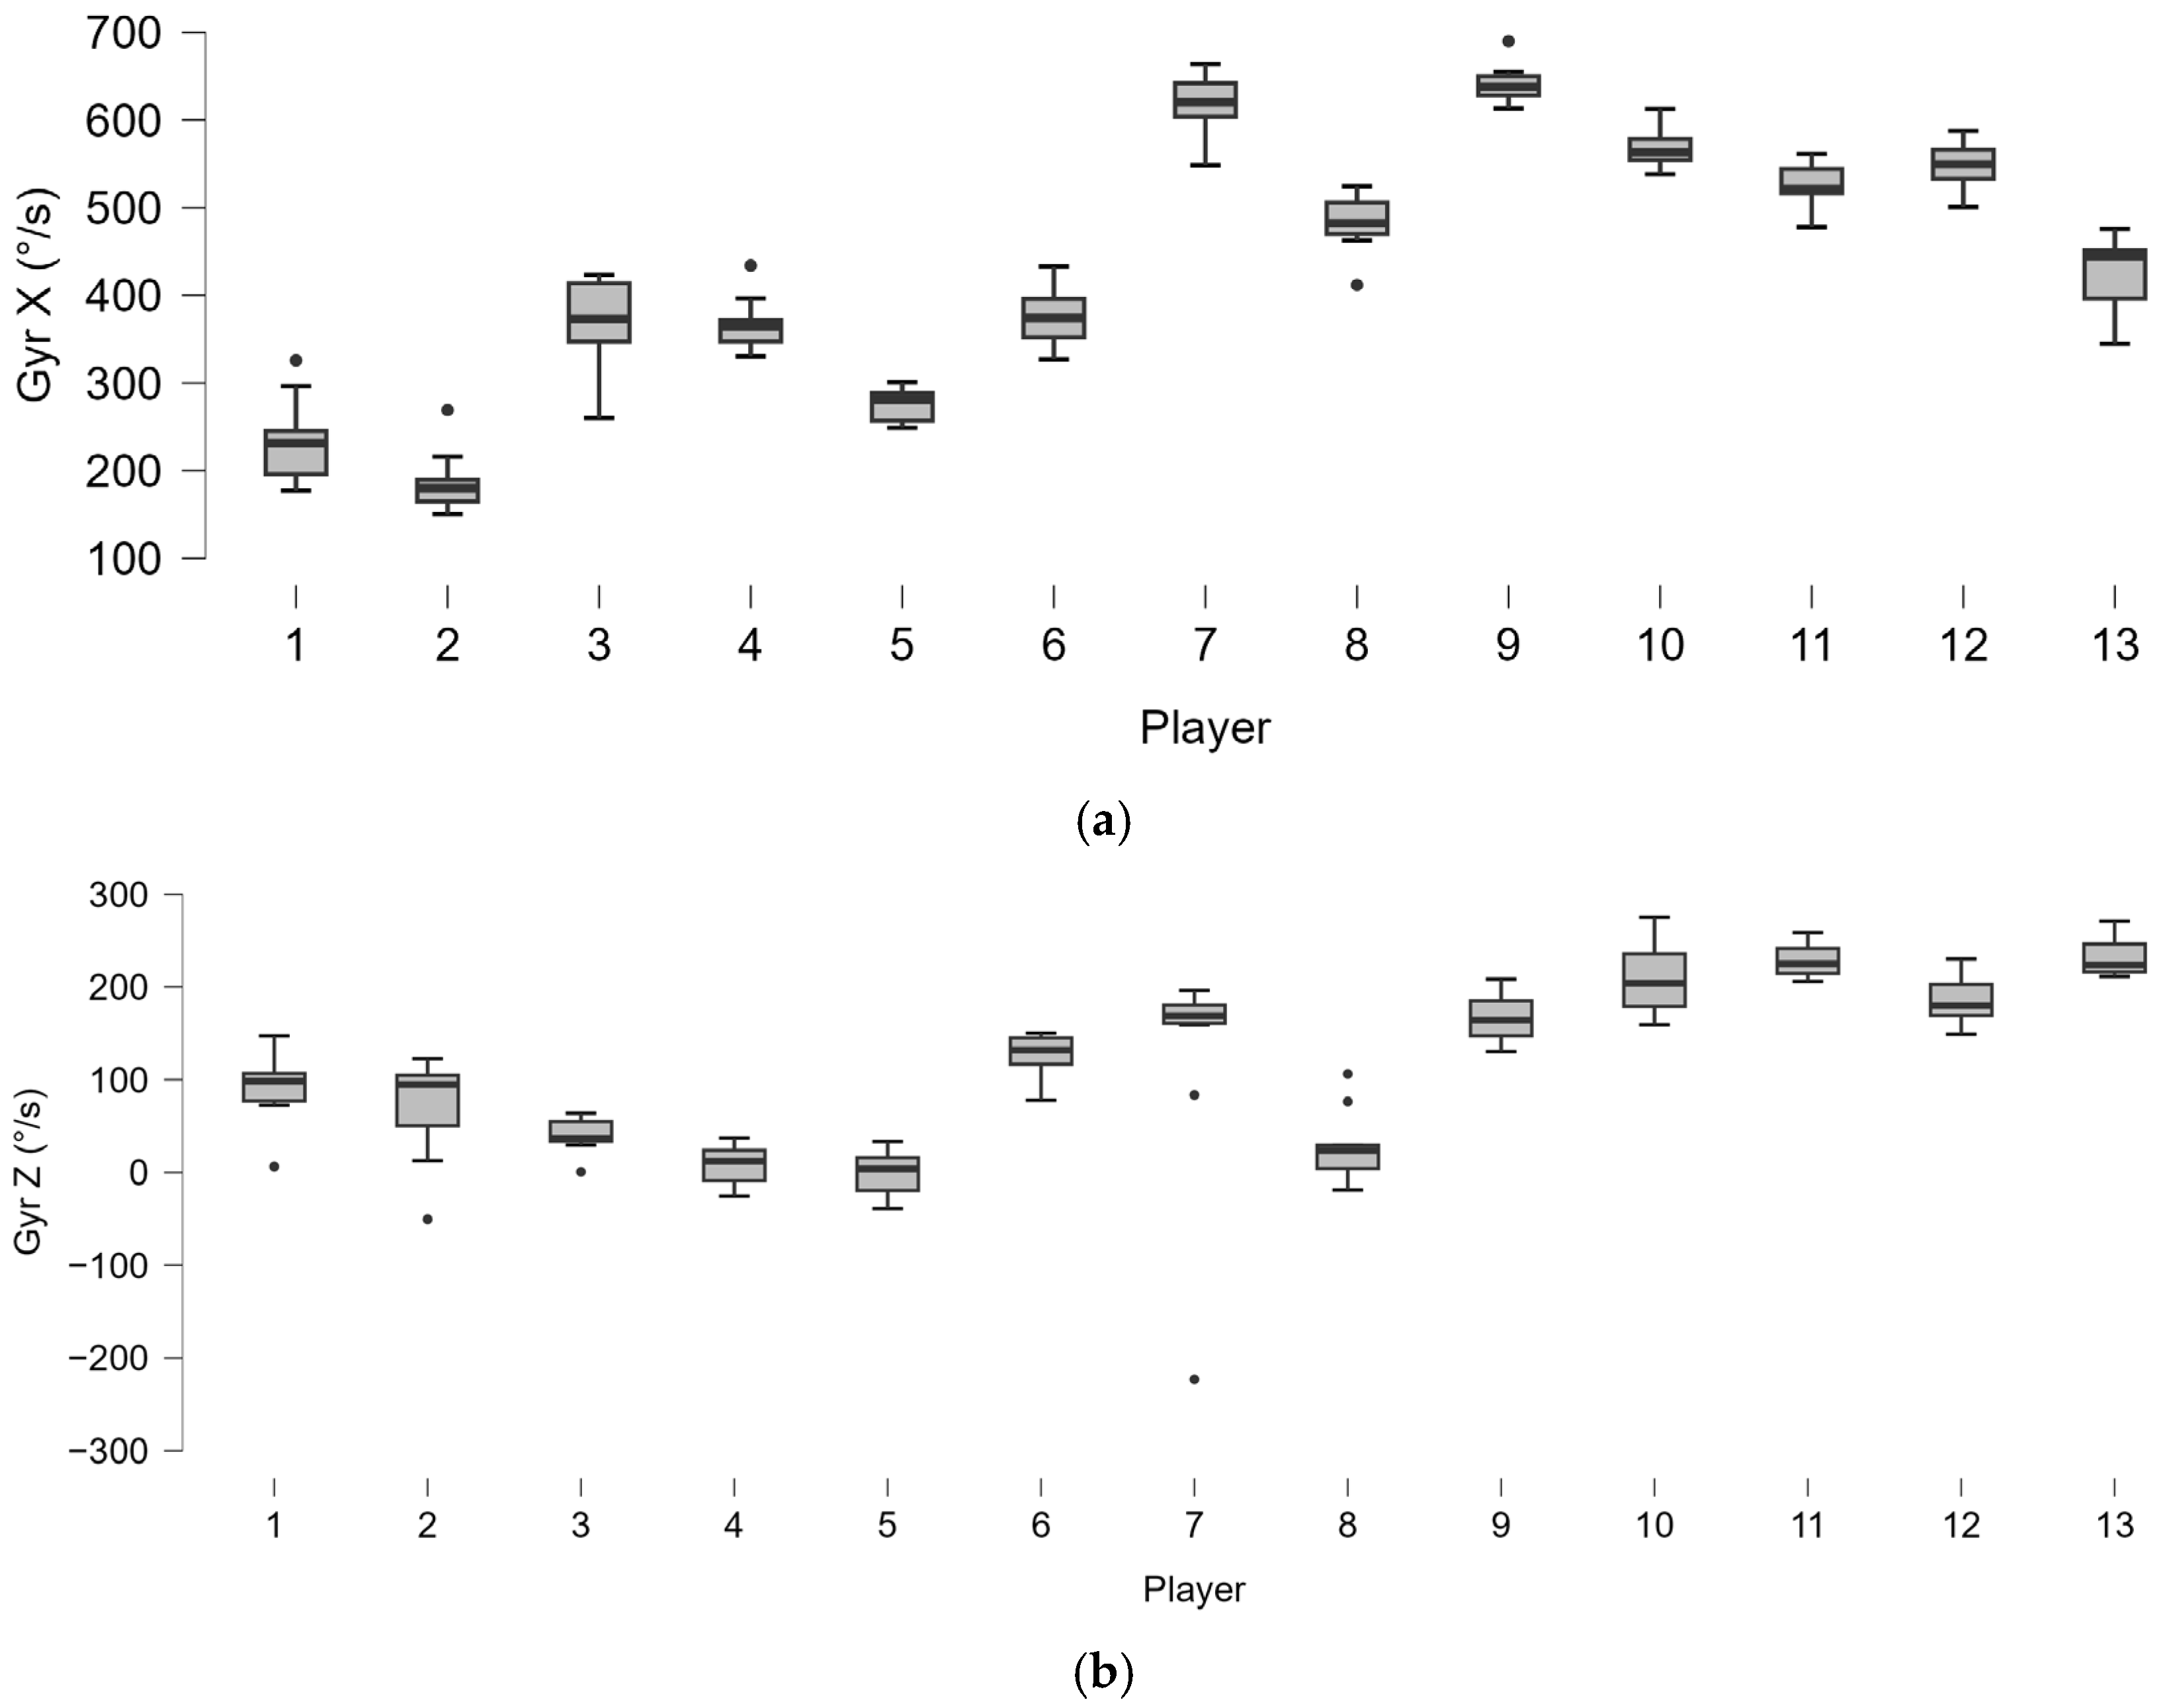
3.2. Serve
3.2.1. Reliability
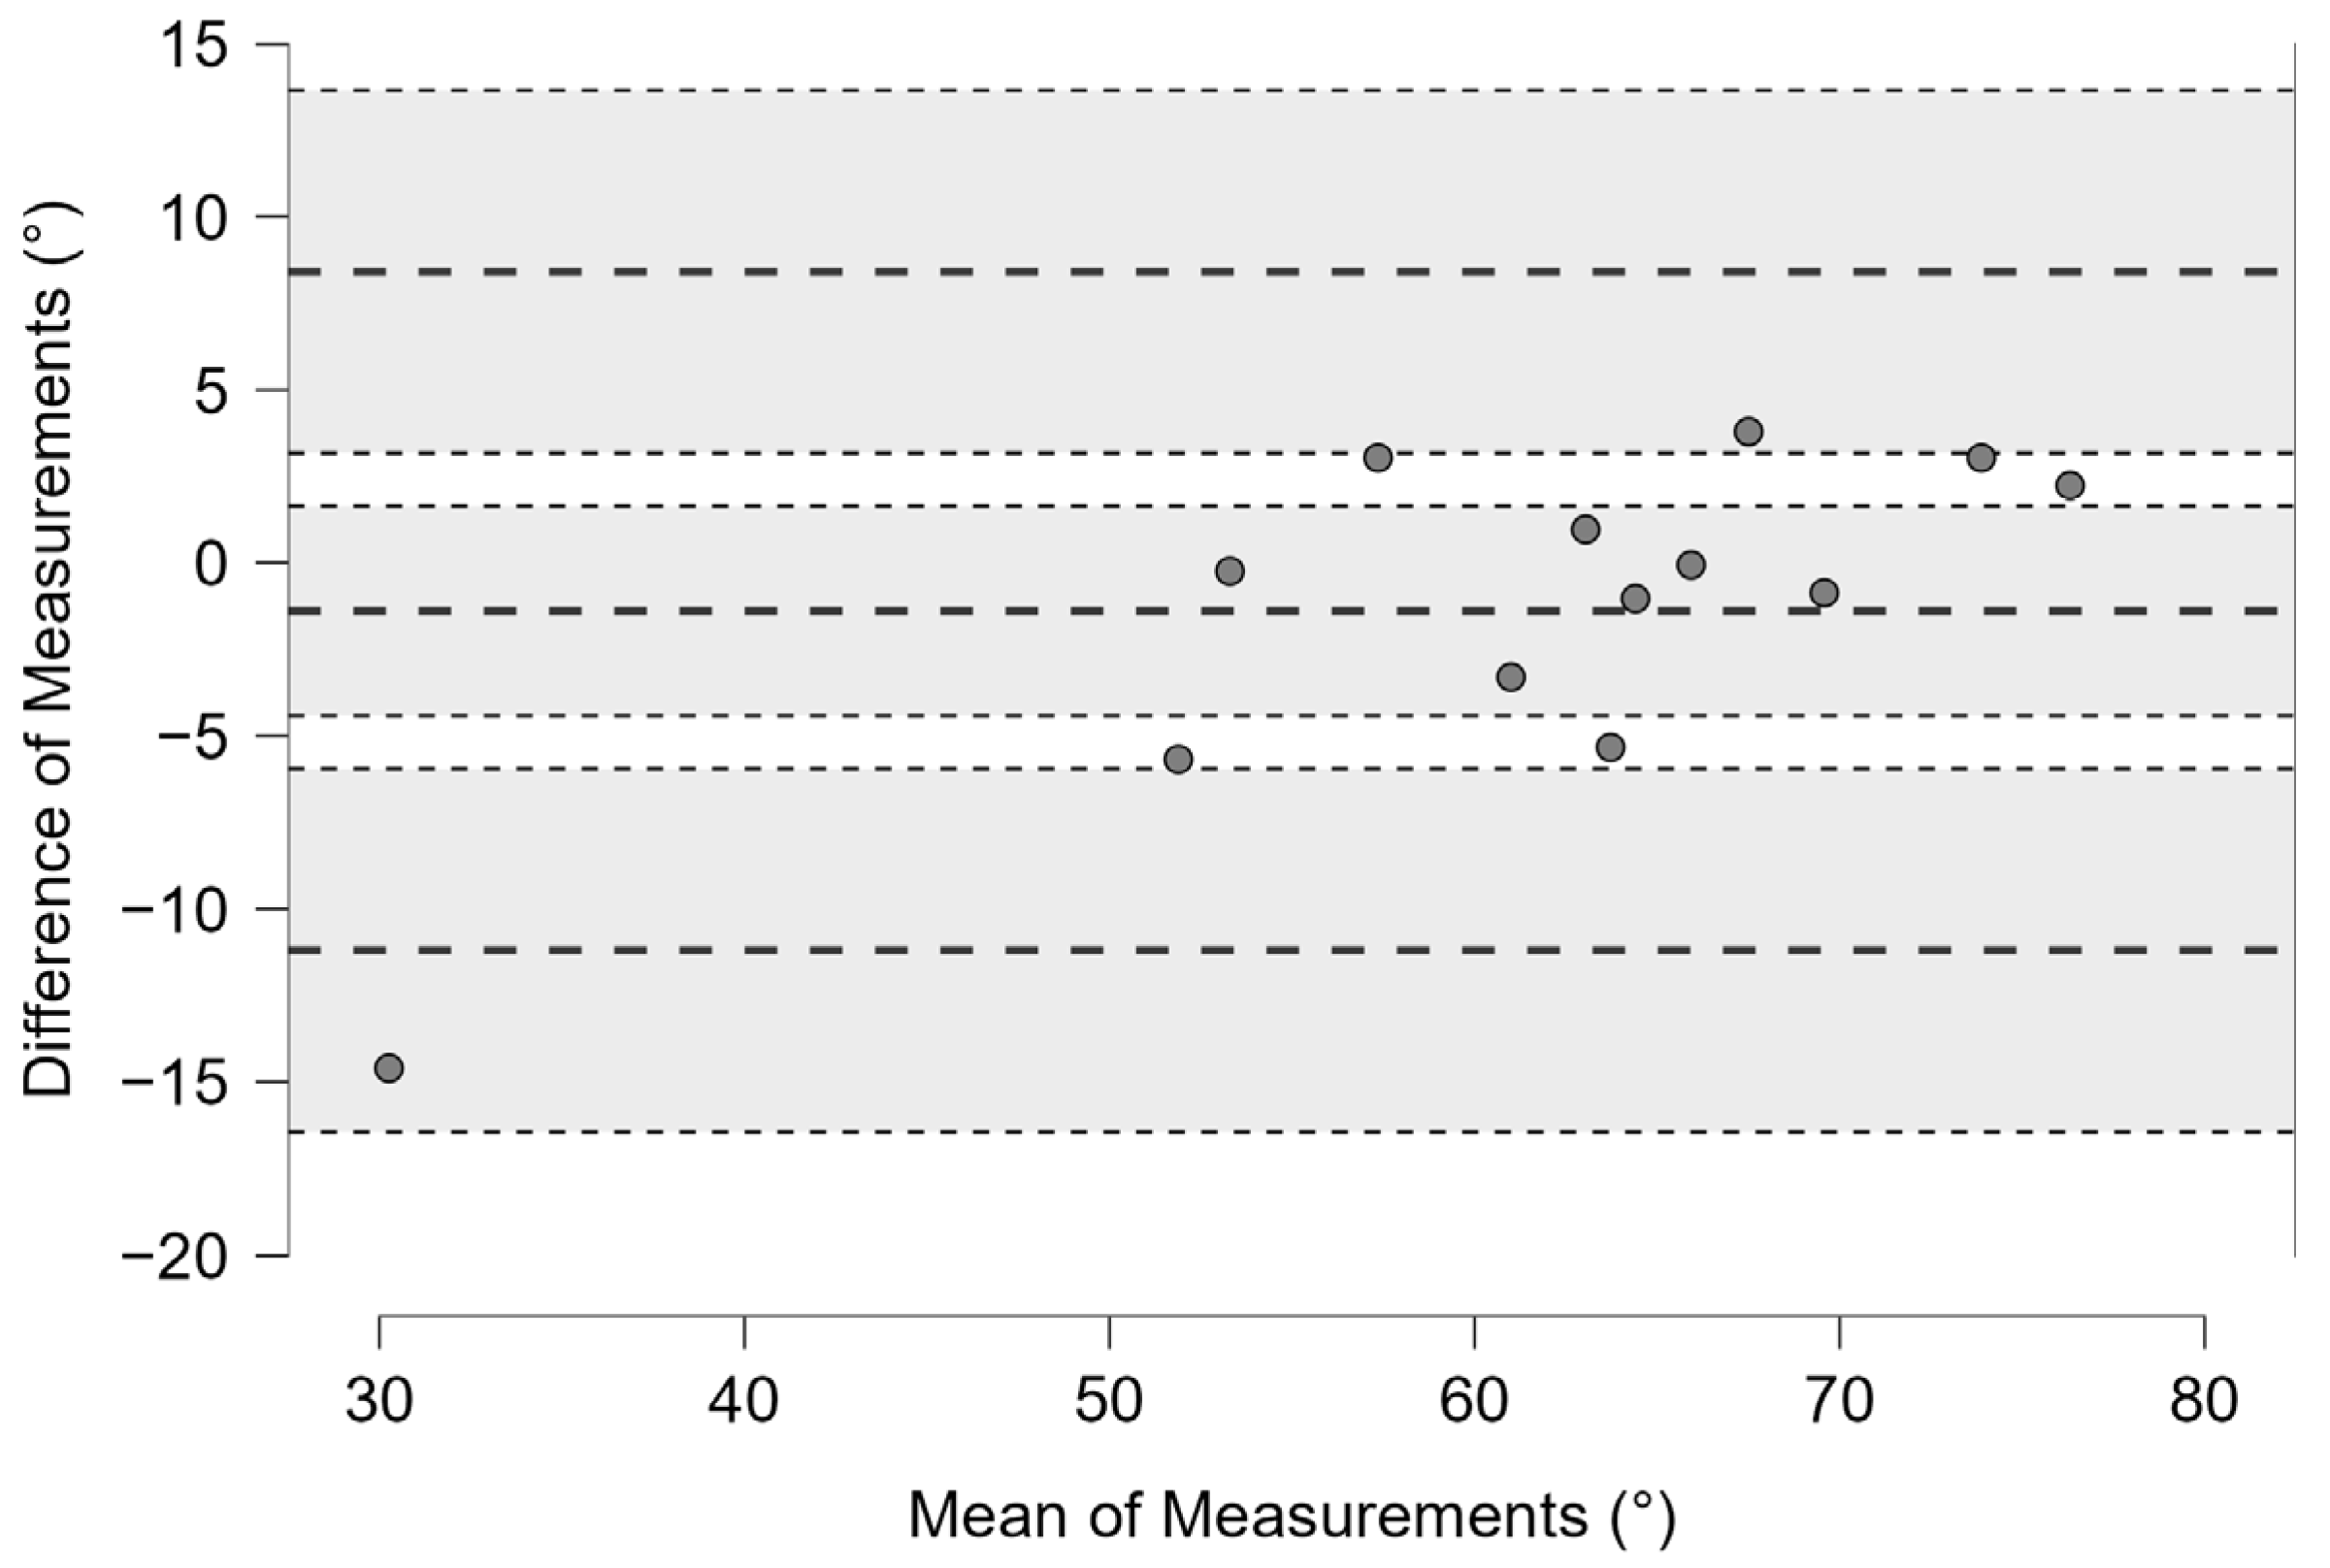
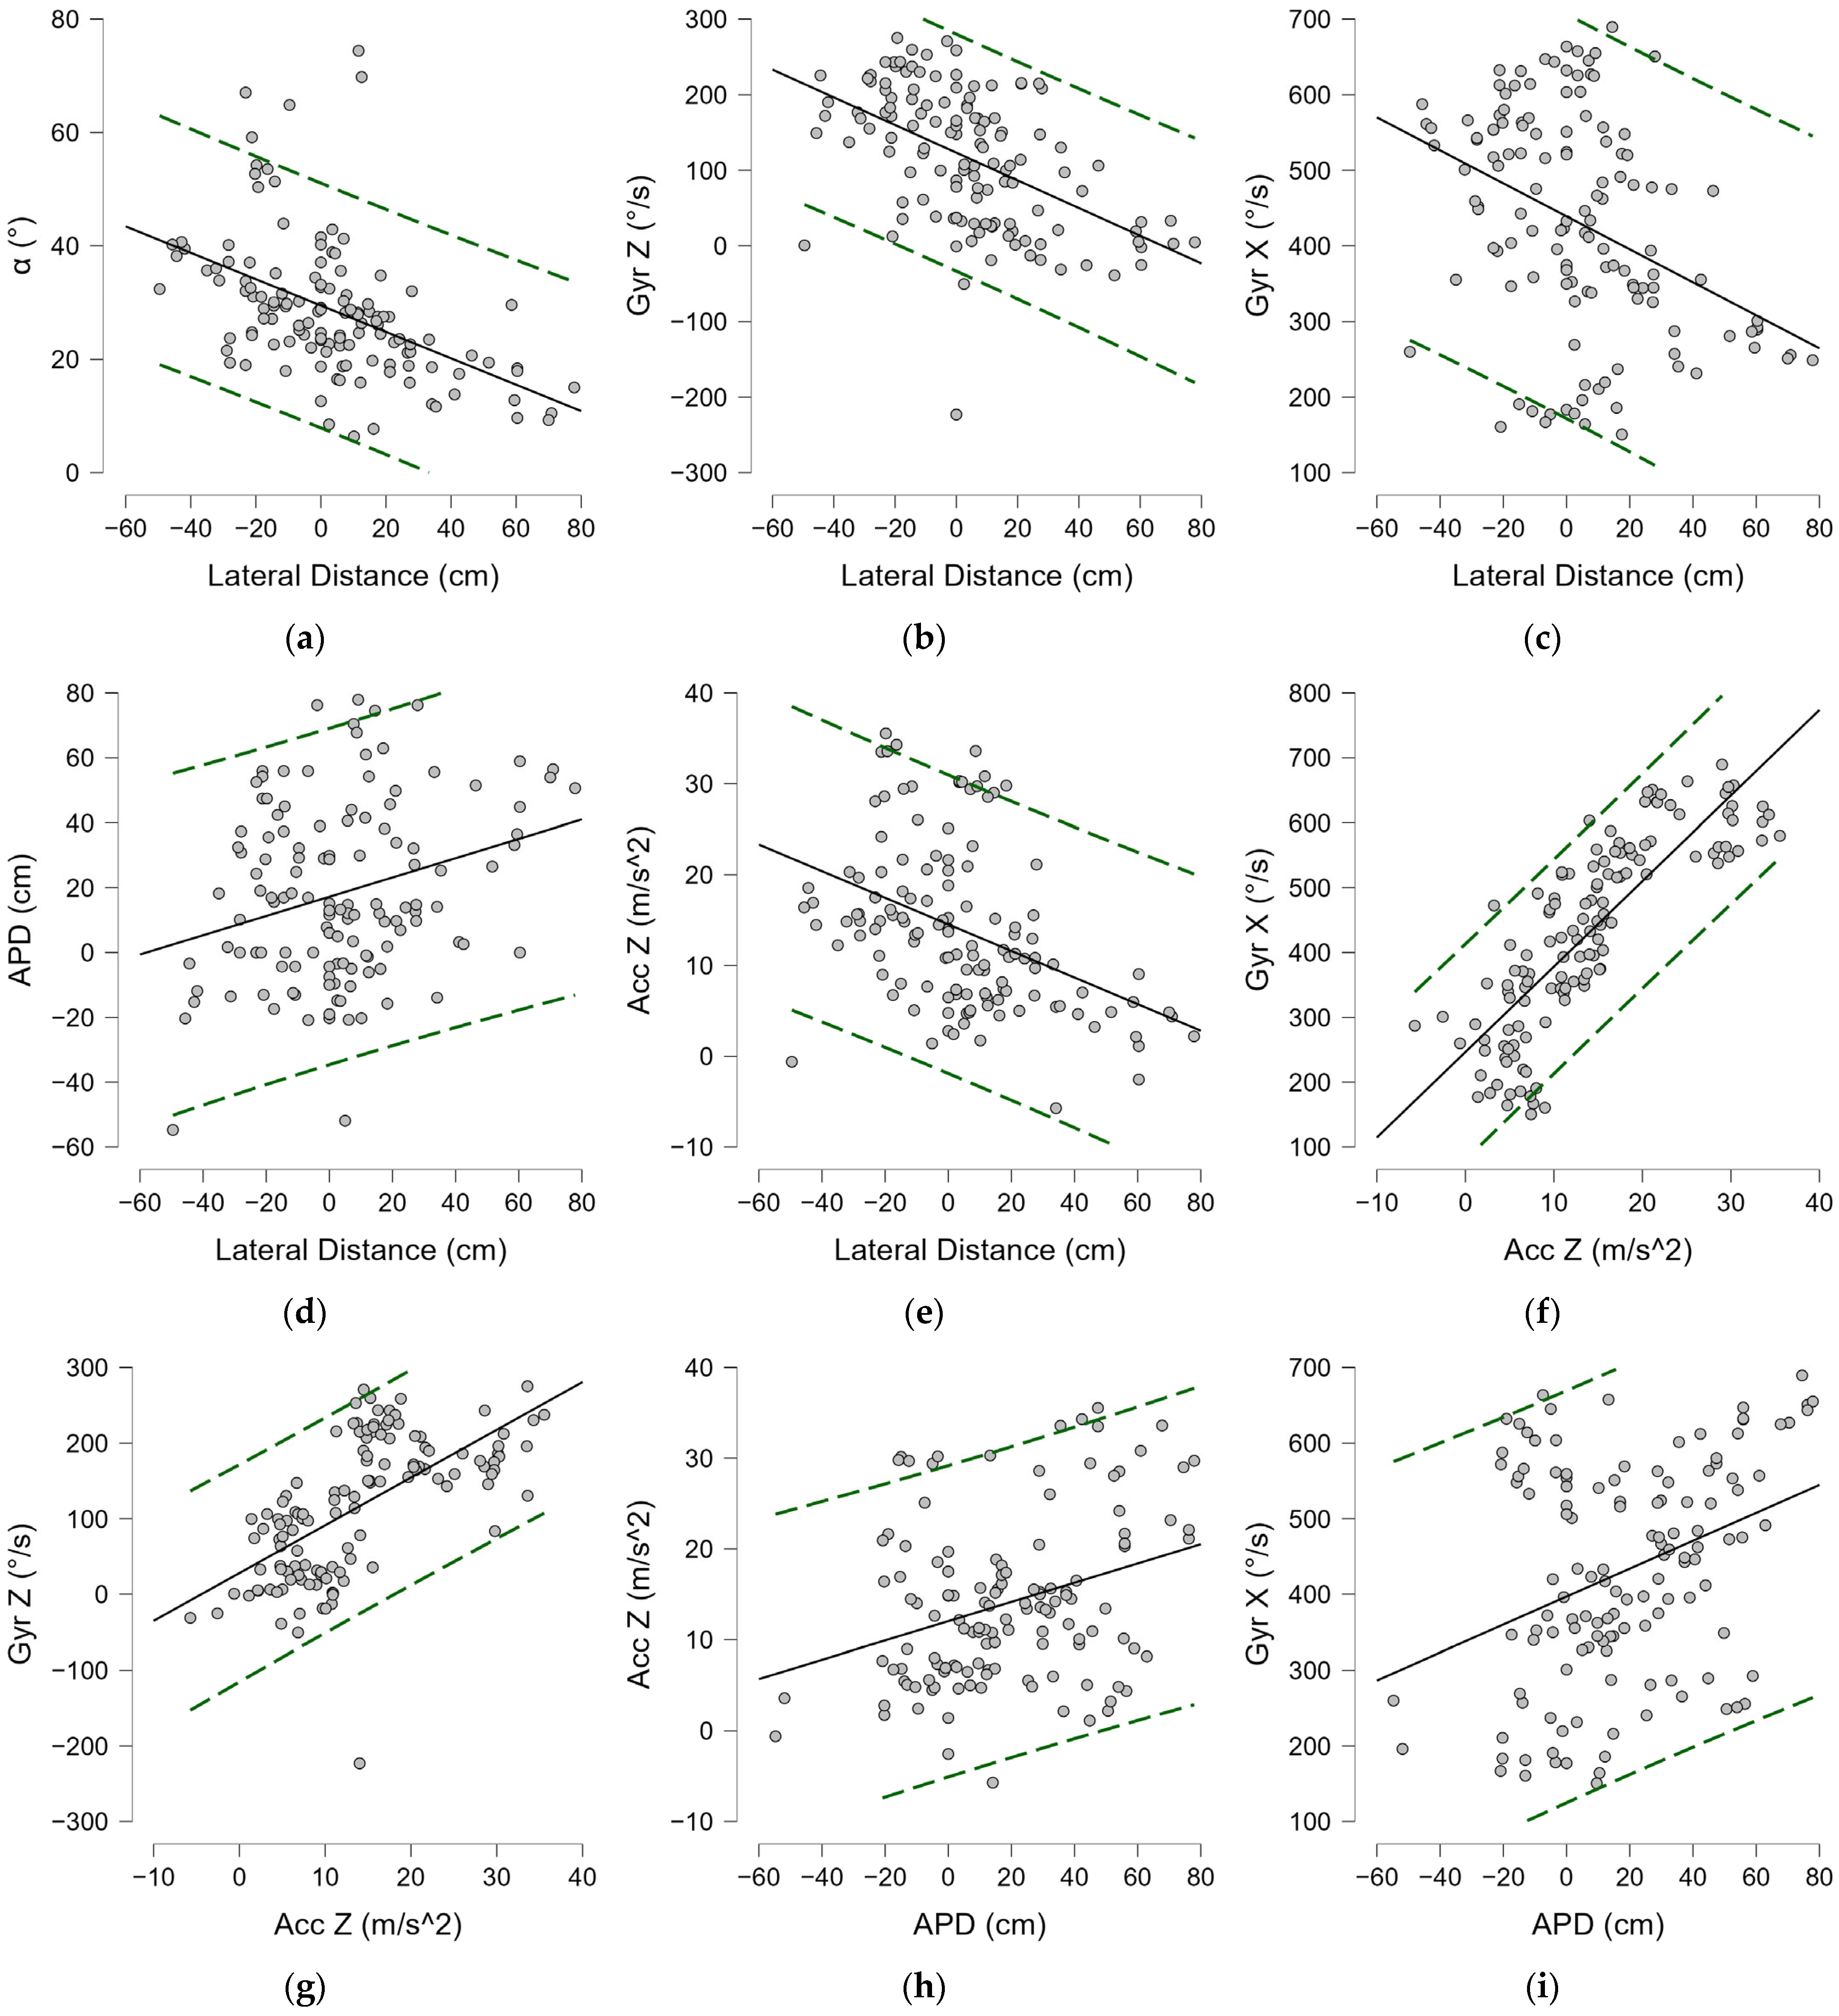
3.2.2. Data Variability
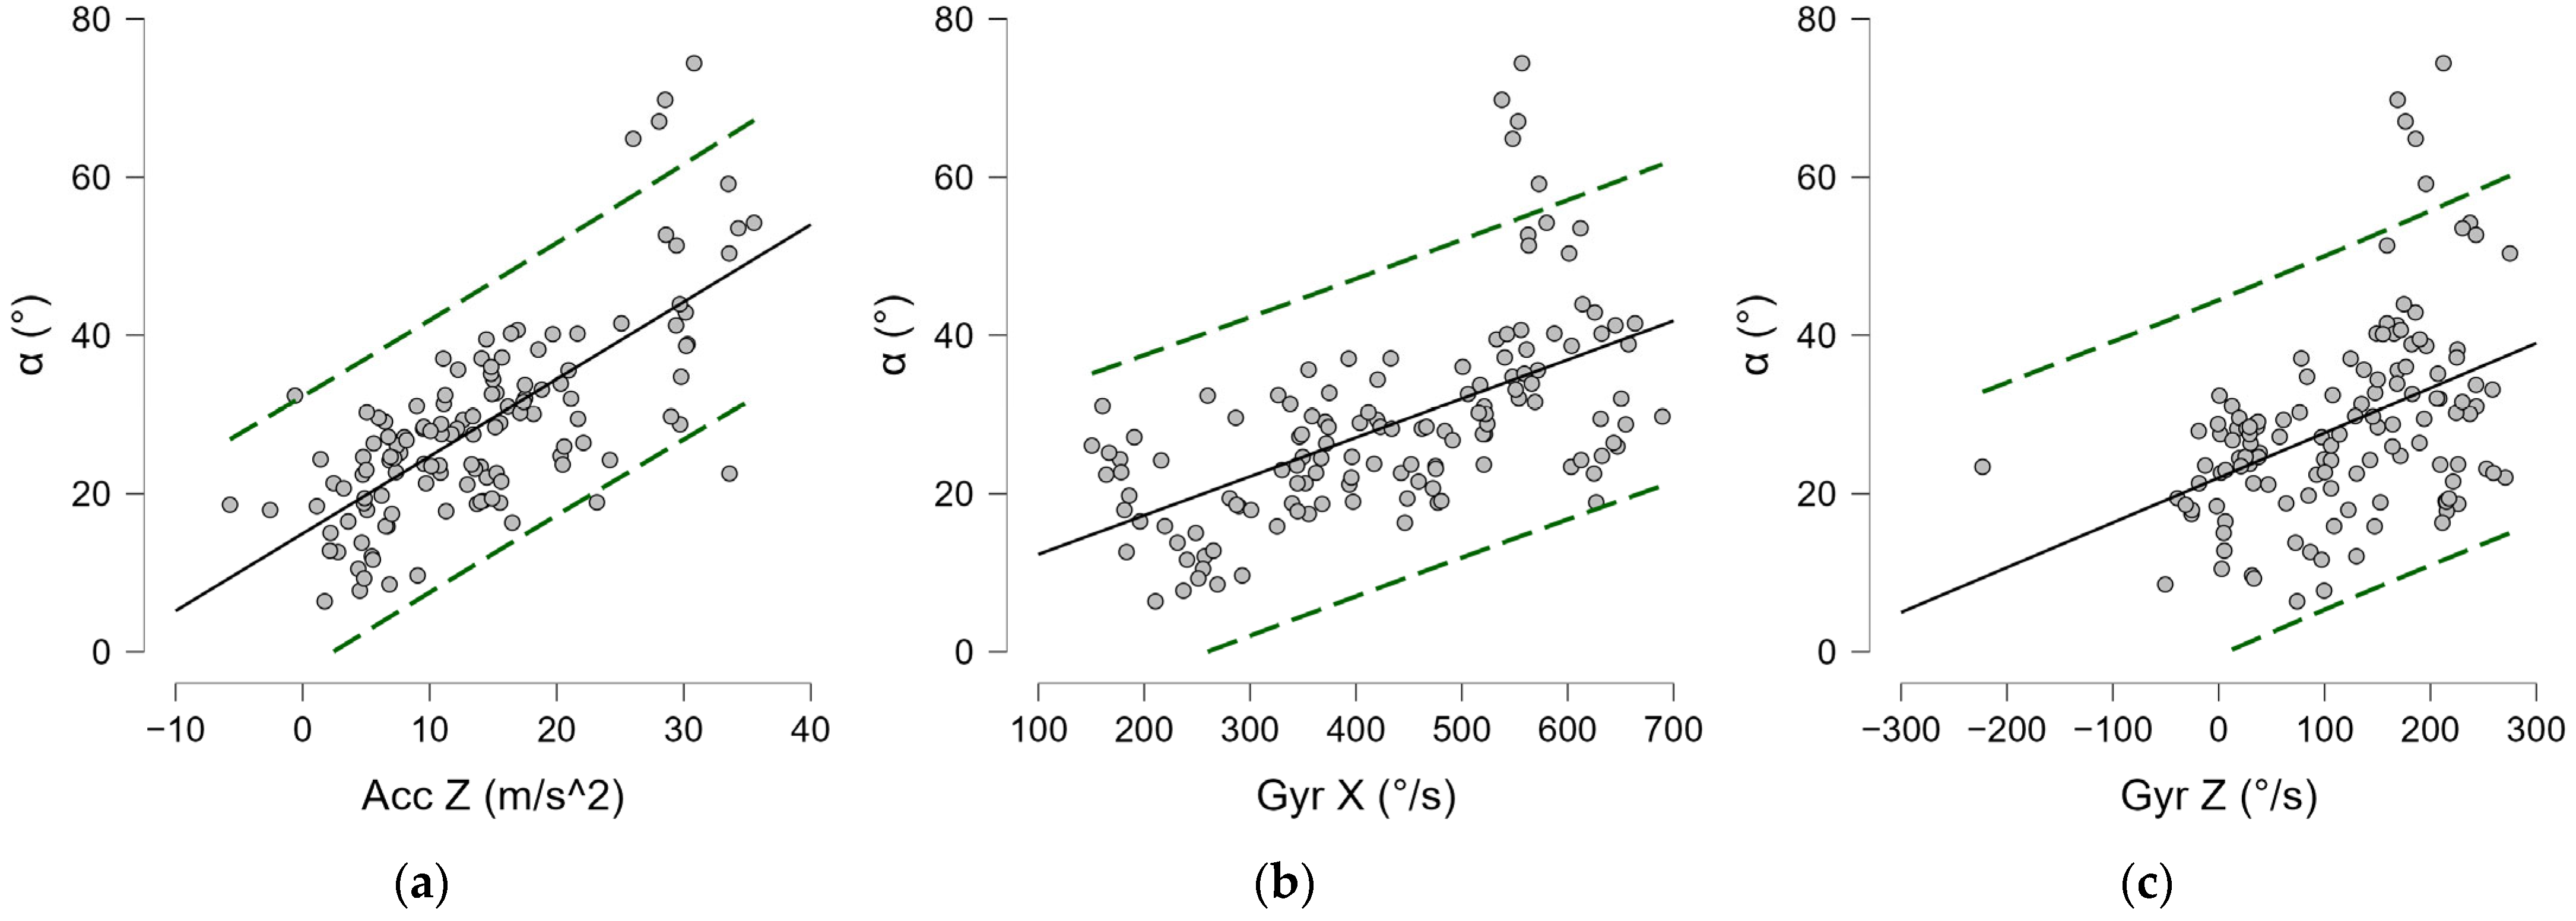
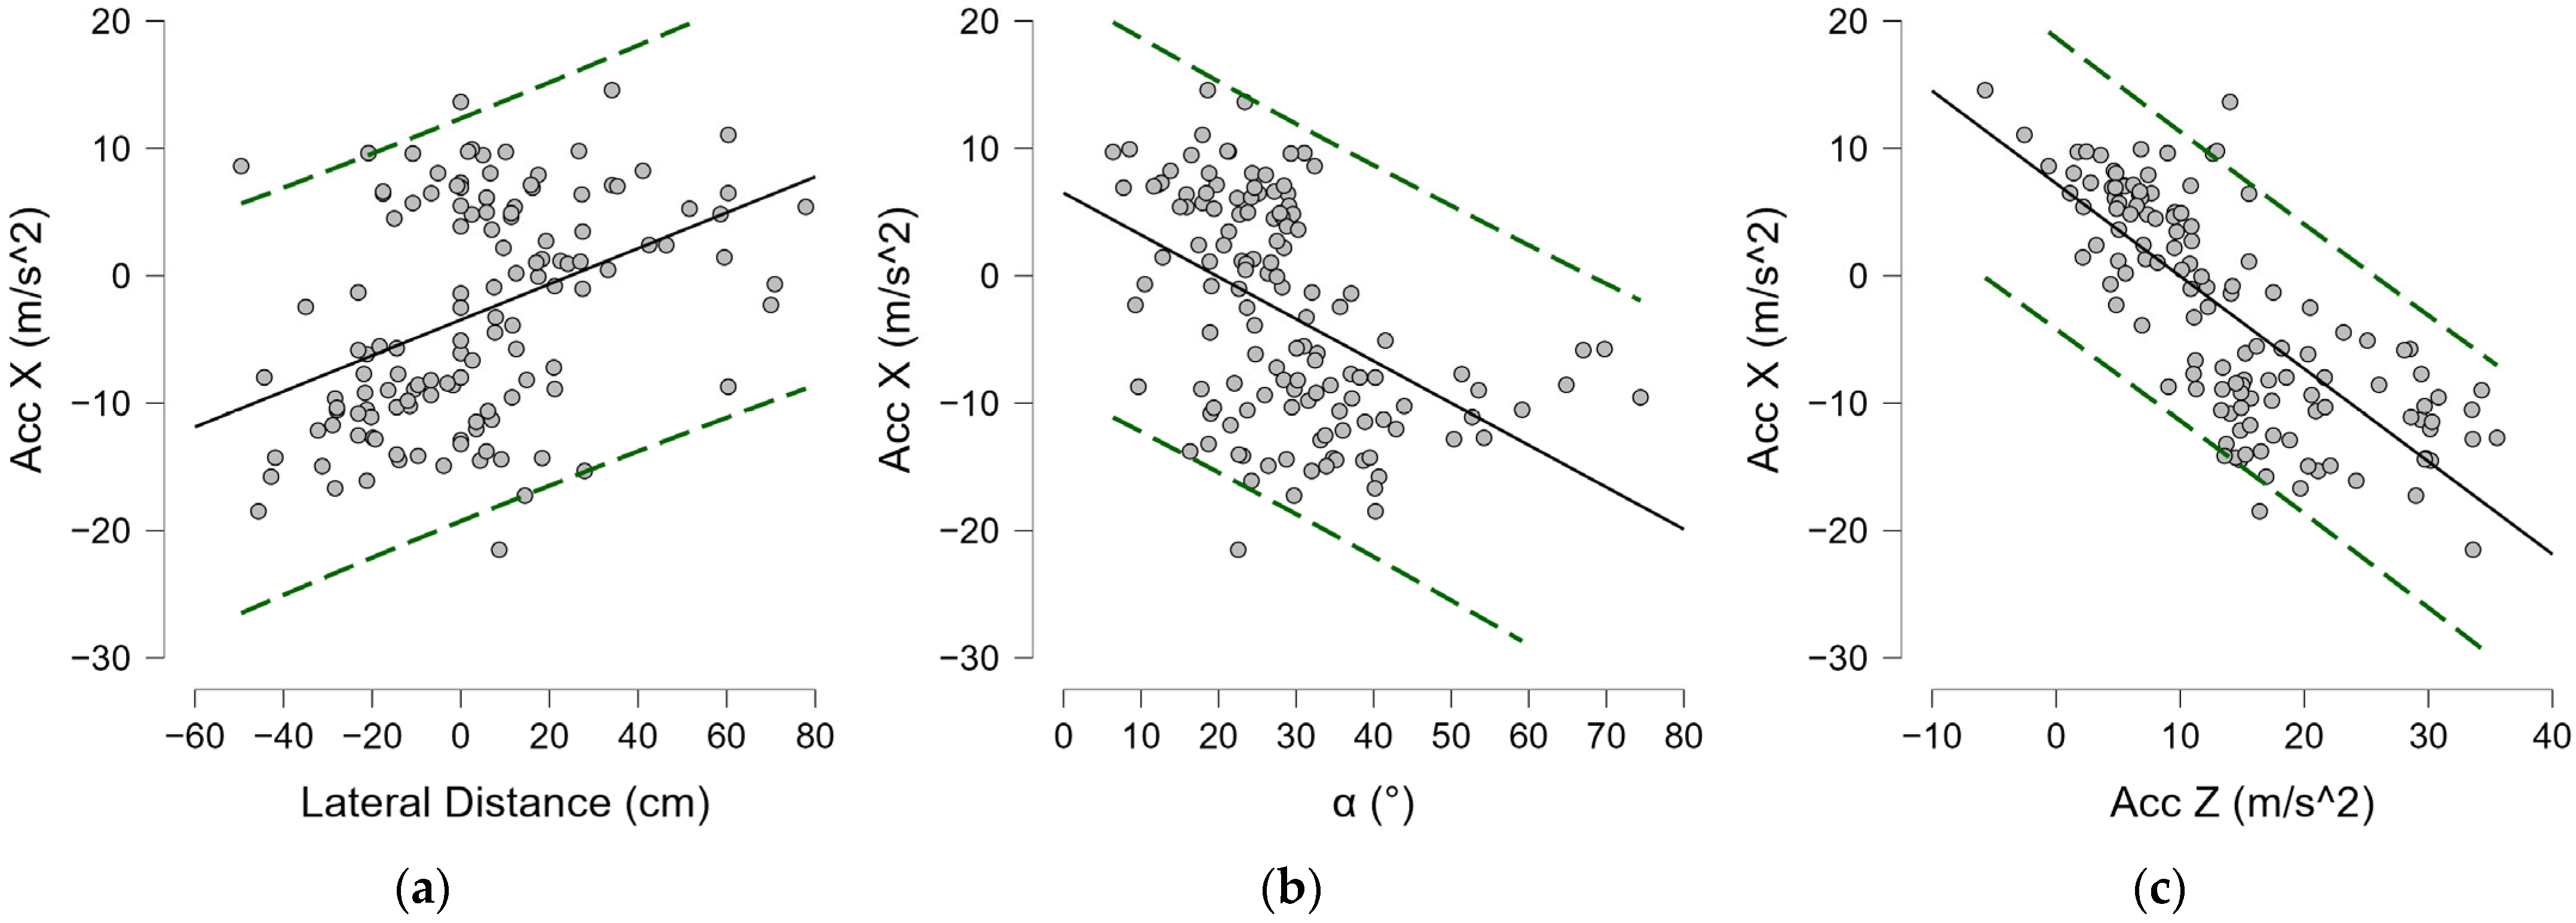
3.2.3. Inferential Statistics
4. Discussion
4.1. Forehand
4.2. Serve
4.3. Applicability and Developments
4.4. Limitations of the Study
5. Conclusions
Author Contributions
Funding
Institutional Review Board Statement
Informed Consent Statement
Data Availability Statement
Acknowledgments
Conflicts of Interest
References
- Clerici, G. 500 Anni Di Tennis; Mondadori Electa: Milan, Italy, 2007; ISBN 978-88-370-5469-4. [Google Scholar]
- Scaino, A.; De Ferrari, G. Impressa Dei Duchi Di Trattato Del Giuoco Della Palla Di Messer Antonio Scaino Da Salò, Diuiso in Tre Parti. Con Due Tauole, l’vna de’ Capitoli, l’altra Delle Cose Piu Notabili, Che in Esso Si Contengono; Appresso Gabriel Giolito De’ Ferrari et Fratelli: Venice, Italy, 1555. [Google Scholar]
- Cross, R.; Pollard, G. Grand Slam Men’s Singles Tennis 1995–2009 Part 2: Points, Games and Sets. Coach. Sport Sci. Rev. 2011, 19, 53. [Google Scholar]
- Casale, L. Physical Training for Tennis Players; Professional Tennis Registry: Wesley Chapel, FL, USA, 2003. [Google Scholar]
- Roetert, E.P.; Kovacs, M. Tennis Anatomy; Human Kinetics: Champaign, IL, USA, 2019. [Google Scholar]
- Reid, M.; Elliott, B.; Crespo, M. Mechanics and Learning Practices Associated with the Tennis Forehand: A Review. J. Sports Sci. Med. 2013, 12, 225. [Google Scholar] [PubMed]
- Castellani, A.; D’Aprile, A.; Tamorri, S. Tennis Training; Società stampa sportive: Rome, Italy, 2007. [Google Scholar]
- Fu, M.C.; Ellenbecker, T.S.; Renstrom, P.A.; Windler, G.S.; Dines, D.M. Epidemiology of Injuries in Tennis Players. Curr. Rev. Musculoskelet. Med. 2018, 11, 1–5. [Google Scholar] [CrossRef] [PubMed]
- Elliott, B. Biomechanics and Tennis. Br. J. Sports Med. 2006, 40, 392–396. [Google Scholar] [CrossRef] [PubMed]
- Martin, C.; Kulpa, R.; Delamarche, P.; Bideau, B. Professional Tennis Players’ Serve: Correlation between Segmental Angular Momentums and Ball Velocity. Sports Biomech. 2013, 12, 2–14. [Google Scholar] [CrossRef]
- Jacquier-Bret, J.; Gorce, P. Kinematics Characteristics of Key Point of Interest during Tennis Serve among Tennis Players: A Systematic Review and Metaanalysis. Front. Sports Act. Living 2024, 6, 1432030. [Google Scholar] [CrossRef]
- Johnson, C.D.; McHugh, M. Performance Demands of Professional Male Tennis Players. Br. J. Sports Med. 2006, 40, 696–699. [Google Scholar] [CrossRef]
- Genevois, C.; Reid, M.; Rogowski, I.; Crespo, M. Performance Factors Related to the Different Tennis Backhand Groundstrokes: A Review. J. Sports Sci. 2015, 14, 194. [Google Scholar]
- Cam, İ.; Turhan, B.; Onag, Z. The Analysis of the Last Shots of the Top-Level Tennis Players in Open Tennis Tournaments. Turk. J. Sport Exerc. 2013, 15, 54–57. [Google Scholar]
- Ridhwan, S.; Ghoshb, A.K.; Keong, C.C. The Fractional Utilization of Maximal Oxygen Consumption during Execution of Ground Strokes and Simulated Match in 14 to 18 Years Malaysian Singles Tennis Players. Int. J. Appl. Sports Sci. 2010, 22, 45–65. [Google Scholar] [CrossRef]
- Landlinger, J.; Lindinger, S.; Stöggl, T.; Wagner, H.; Müller, E. Key Factors and Timing Patterns in the Tennis Forehand of Different Skill Levels. J. Sports Sci. Med. 2010, 9, 643. [Google Scholar] [PubMed]
- Roetert, P.; Groppel, J.L. World-Class Tennis Technique; Human Kinetics: Champaign, IL, USA, 2001; pp. 147–171. [Google Scholar]
- Caprioli, L.; Campoli, F.; Edriss, S.; Frontuto, C.; Najlaoui, A.; Padua, E.; Romagnoli, C.; Annino, G.; Bonaiuto, V. Assessment of Tennis Timing Using an Acoustic Detection System. In Proceedings of the 2024 IEEE International Workshop on Sport, Technology and Research (STAR), Lecco, Italy, 8–10 July 2024; IEEE: Piscataway, NJ, USA, 2024; pp. 285–289. [Google Scholar]
- Verrelli, C.M.; Caprioli, L.; Bonaiuto, V. Cyclic Human Movements and Time-Harmonic Structures: Role of the Golden Ratio in the Tennis Forehand. In Proceedings of the International Workshop on Engineering Methodologies for Medicine and Sport, Rome, Italy, 7–9 February 2024; Springer: Berlin/Heidelberg, Germany, 2024; pp. 557–577. [Google Scholar]
- Bertino, L.; Mohovich, B.; Pankhurst, A. Manuale Performance Workshop 2012; Professional Tennis Registry: Wesley Chapel, FL, USA, 2012. [Google Scholar]
- Roetert, E.P.; Kovacs, M.; Knudson, D.; Groppel, J.L. Biomechanics of the Tennis Groundstrokes: Implications for Strength Training. Strength Cond. J. 2009, 31, 41–49. [Google Scholar] [CrossRef]
- Rogowski, I.; Rouffet, D.; Lambalot, F.; Brosseau, O.; Hautier, C. Trunk and Upper Limb Muscle Activation during Flat and Topspin Forehand Drives in Young Tennis Players. J. Appl. Biomech. 2011, 27, 15–21. [Google Scholar] [CrossRef]
- Elliott, B.; Takahashi, K.; Noffal, G. The Influence of Grip Position on Upper Limb Contributions to Racket Head Velocity in a Tennis Forehand. J. Appl. Biomech. 1997, 13, 182–196. [Google Scholar] [CrossRef]
- Seeley, M.K.; Funk, M.D.; Denning, W.M.; Hager, R.L. Tennis Forehand Kinematics Change as Post-Impact Ball Speed Is Altered. In The Biomechanics of Batting, Swinging, and Hitting; Routledge: London, UK, 2016; pp. 181–192. [Google Scholar]
- Muhamad, T.A.; Golestani, F.; Abd Razak, M.R. Comparison of Open and Closed Stance Forehand Strokes among Intermediate Tennis Players. Int. J. Kinesiol. Sports Sci. 2016, 4, 26–32. [Google Scholar]
- Martin, C.; Sorel, A.; Touzard, P.; Bideau, B.; Gaborit, R.; DeGroot, H.; Kulpa, R. Influence of the Forehand Stance on Knee Biomechanics: Implications for Potential Injury Risks in Tennis Players. J. Sports Sci. 2021, 39, 992–1000. [Google Scholar] [CrossRef] [PubMed]
- Lambrich, J.; Muehlbauer, T. Biomechanical Analyses of Different Serve and Groundstroke Techniques in Tennis: A Systematic Scoping Review. PLoS ONE 2023, 18, e0290320. [Google Scholar] [CrossRef] [PubMed]
- Reid, M.; Elliott, B. Tennis: The One-and Two-Handed Backhands in Tennis. Sports Biomech. 2002, 1, 47–68. [Google Scholar] [CrossRef]
- Söğüt, M. A Comparison of Serve Speed and Motor Coordination between Elite and Club Level Tennis Players. J. Hum. Kinet. 2017, 55, 171–176. [Google Scholar] [CrossRef]
- Meier, C.; Frank, C.; Gröben, B.; Schack, T. Verbal Instructions and Motor Learning: How Analogy and Explicit Instructions Influence the Development of Mental Representations and Tennis Serve Performance. Front. Psychol. 2020, 11, 2. [Google Scholar] [CrossRef] [PubMed]
- Hernández-Davo, H.; Urbán, T.; Sarabia, J.M.; Juan-Recio, C.; Javier Moreno, F. Variable Training: Effects on Velocity and Accuracy in the Tennis Serve. J. Sports Sci. 2014, 32, 1383–1388. [Google Scholar] [CrossRef]
- Tsetseli, M.; Malliou, V.; Zetou, E.; Michalopoulou, M.; Kambas, A. The Effect of Coordination Training Program on the Development of Tennis Service Technique. Biol. Exerc. 2010, 6, 29. [Google Scholar] [CrossRef]
- Kim, J.; Xie, X. Learning Tasks for Teaching Tennis Serve at a Beginning Level. J. Phys. Educ. Recreat. Danc. 2024, 95, 41–48. [Google Scholar] [CrossRef]
- Colomar, J.; Corbi, F.; Brich, Q.; Baiget, E. Determinant Physical Factors of Tennis Serve Velocity: A Brief Review. Int. J. Sports Physiol. Perform. 2022, 17, 1159–1169. [Google Scholar] [CrossRef] [PubMed]
- Reid, M.; Elliott, B.; Alderson, J. Lower-Limb Coordination and Shoulder Joint Mechanics in the Tennis Serve. Med. Sci. Sports Exerc. 2008, 40, 308–315. [Google Scholar] [CrossRef] [PubMed]
- Roetert, E.P.; Ellenbecker, T.S.; Reid, M. Biomechanics of the Tennis Serve: Implications for Strength Training. Strength Cond. J. 2009, 31, 35–40. [Google Scholar] [CrossRef]
- Elliott, B.; Whiteside, D.; Lay, B.; Reid, M. The Female Tennis Serve: An Analagous Version of the Male Serve? In Proceedings of the ISBS-Conference Proceedings Archive, Taipei, Taiwan, 7–11 July 2013.
- Carboch, J.; Hrychová, D. Flat Serve Success in the Relationship to the Serve Toss and Racket-Ball Impact of Competitive and Hobby Tennis Players: A Case Study. Int. J. Sport Exerc. Health Res. 2022, 6, 136–139. [Google Scholar] [CrossRef]
- Carboch, J.; Tufano, J.J.; Süss, V. Ball Toss Kinematics of Different Service Types in Professional Tennis Players. Int. J. Perform. Anal. Sport 2018, 18, 881–891. [Google Scholar] [CrossRef]
- Kovacs, M.; Ellenbecker, T. An 8-Stage Model for Evaluating the Tennis Serve: Implications for Performance Enhancement and Injury Prevention. Sports Health 2011, 3, 504–513. [Google Scholar] [CrossRef] [PubMed]
- Kovacs, M.S.; Ellenbecker, T.S. A Performance Evaluation of the Tennis Serve: Implications for Strength, Speed, Power, and Flexibility Training. Strength Cond. J. 2011, 33, 22–30. [Google Scholar] [CrossRef]
- Gescheit, D.T.; Cormack, S.J.; Duffield, R.; Kovalchik, S.; Wood, T.O.; Omizzolo, M.; Reid, M. Injury Epidemiology of Tennis Players at the 2011–2016 Australian Open Grand Slam. Br. J. Sports Med. 2017, 51, 1289–1294. [Google Scholar] [CrossRef]
- Abrams, G.D.; Sheets, A.L.; Andriacchi, T.P. Review of Tennis Serve Motion Analysis and the Biomechanics of Three Serve Types with Implications for Injury. Biomech. Batting Swing. Hitting 2016, 13, 144–156. [Google Scholar] [CrossRef] [PubMed]
- Abrams, G.D.; Renstrom, P.A.; Safran, M.R. Epidemiology of Musculoskeletal Injury in the Tennis Player. Br. J. Sports Med. 2012, 46, 492–498. [Google Scholar] [CrossRef] [PubMed]
- Maquirriain, J.; Baglione, R. Epidemiology of Tennis Injuries: An Eight-Year Review of Davis Cup Retirements. Eur. J. Sport Sci. 2016, 16, 266–270. [Google Scholar] [CrossRef] [PubMed]
- Rusdiana, A.; Abdullah, M.R.B.; Syahid, A.M. Backhand Drive Stroke Technique in Tennis: 3D Biomechanical Analysis Approach. J. Phys. Educ. Sport 2022, 22, 2826–2832. [Google Scholar]
- Edriss, S.; Romagnoli, C.; Caprioli, L.; Zanela, A.; Panichi, E.; Campoli, F.; Padua, E.; Annino, G.; Bonaiuto, V. The Role of Emergent Technologies in the Dynamic and Kinematic Assessment of Human Movement in Sport and Clinical Applications. Appl. Sci. 2024, 14, 1012. [Google Scholar] [CrossRef]
- Annino, G.; Bonaiuto, V.; Campoli, F.; Caprioli, L.; Edriss, S.; Padua, E.; Panichi, E.; Romagnoli, C.; Romagnoli, N.; Zanela, A. Assessing Sports Performances Using an Artificial Intelligence-Driven System. In Proceedings of the 2023 IEEE International Workshop on Sport, Technology and Research (STAR), Cavalese-Trento, Italy, 14–16 September 2023; IEEE: Piscataway, NJ, USA; pp. 98–103. [Google Scholar]
- Wagner, H.; Pfusterschmied, J.; Tilp, M.; Landlinger, J.; von Duvillard, S.P.; Müller, E. Upper-Body Kinematics in Team-Handball Throw, Tennis Serve, and Volleyball Spike. Scand. J. Med. Sci. Sports 2014, 24, 345–354. [Google Scholar] [CrossRef] [PubMed]
- Reid, M.; Giblin, G.; Whiteside, D. A Kinematic Comparison of the Overhand Throw and Tennis Serve in Tennis Players: How Similar Are They Really? J. Sports Sci. 2015, 33, 713–723. [Google Scholar] [CrossRef] [PubMed]
- Busuttil, N.A.; Reid, M.; Connolly, M.; Dascombe, B.J.; Middleton, K.J. A Kinematic Analysis of the Upper Limb during the Topspin Double-Handed Backhand Stroke in Tennis. Sports Biomech. 2022, 21, 1046–1064. [Google Scholar] [CrossRef] [PubMed]
- Cabarkapa, D.; Cabarkapa, D.V.; Miller, J.D.; Templin, T.T.; Frazer, L.L.; Nicolella, D.P.; Fry, A.C. Biomechanical Characteristics of Proficient Free-Throw Shooters—Markerless Motion Capture Analysis. Front. Sports Act. Living 2023, 5, 1208915. [Google Scholar] [CrossRef]
- Caprioli, L.; Campoli, F.; Edriss, S.; Padua, E.; Panichi, E.; Romagnoli, C.; Annino, G.; Bonaiuto, V. Video Analysis Application to Assess the Reaction Time in an ATP Tennis Tournament. In Proceedings of the 11th International Conference on Sport Sciences Research and Technology Support, Rome, Italy, 16–17 November 2023; pp. 16–17. [Google Scholar]
- Leddy, C.; Bolger, R.; Byrne, P.J.; Kinsella, S.; Zambrano, L. Concurrent Validity of the Human Pose Estimation Model “MediaPipe Pose” and the XSENS Inertial Measuring System for Knee Flexion and Extension Analysis During Hurling Sport Motion. In Proceedings of the 2023 IEEE International Workshop on Sport, Technology and Research (STAR), Cavalese-Trento, Italy, 14–16 September 2023; IEEE: Piscataway, NJ, USA, 2023; pp. 49–52. [Google Scholar]
- Najlaoui, A.; Campoli, F.; Caprioli, L.; Edriss, S.; Frontuto, C.; Romagnoli, C.; Annino, G.; Bonaiuto, V.; Zanela, A. AI-Driven Paddle Motion Detection. In Proceedings of the 2024 IEEE international workshop on sport, technology and research (STAR), Lecco, Italy, 08–10 July 2024; IEEE: Piscataway, NJ, USA, 2024; pp. 290–295. [Google Scholar]
- Edriss, S.; Caprioli, L.; Campoli, F.; Manzi, V.; Padua, E.; Bonaiuto, V.; Romagnoli, C.; Annino, G. Advancing Artistic Swimming Officiating and Performance Assessment: A Computer Vision Study Using MediaPipe. Int. J. Comput. Sci. Sport 2024, 23, 35–47. [Google Scholar] [CrossRef]
- Pedro, B.; Cabral, S.; Veloso, A.P. Concurrent Validity of an Inertial Measurement System in Tennis Forehand Drive. J. Biomech. 2021, 121, 110410. [Google Scholar] [CrossRef] [PubMed]
- Zanela, A.; Caprioli, L.; Frontuto, C.; Bonaiuto, V. Integrative Analysis of Movement: AI-Enhanced Video and Inertial Sensors in Athletic Contexts. In Proceedings of the International Workshop on Engineering Methodologies for Medicine and Sport, Rome, Italy, 7 February 2024; Springer: Berlin/Heidelberg, Germany, 2024; pp. 625–641. [Google Scholar]
- Brito, A.V.; Fonseca, P.; Costa, M.J.; Cardoso, R.; Santos, C.C.; Fernandez-Fernandez, J.; Fernandes, R.J. The Influence of Kinematics on Tennis Serve Speed: An In-Depth Analysis Using Xsens MVN Biomech Link Technology. Bioengineering 2024, 11, 971. [Google Scholar] [CrossRef] [PubMed]
- Alcala, E.; Voerman, J.; Konrath, J.; Vydhyanathan, A. Xsens DOT Wearable Sensor Platform White Paper. White Paper, 20 January 2021. [Google Scholar]
- Delgado-García, G.; Vanrenterghem, J.; Ruiz-Malagón, E.J.; Molina-García, P.; Courel-Ibáñez, J.; Soto-Hermoso, V.M. IMU Gyroscopes Are a Valid Alternative to 3D Optical Motion Capture System for Angular Kinematics Analysis in Tennis. Proc. Inst. Mech. Eng. Part P J. Sports Eng. Technol. 2021, 235, 3–12. [Google Scholar] [CrossRef]
- Ebner, C.J.; Findling, R.D. Tennis Stroke Classification: Comparing Wrist and Racket as Imu Sensor Position. In Proceedings of the 17th International Conference on Advances in Mobile Computing & Multimedia, Munich, Germany, 2–4 December 2019; pp. 74–83. [Google Scholar]
- Kos, M.; Kramberger, I. Tennis Stroke Consistency Analysis Using Miniature Wearable IMU. In Proceedings of the 2018 25th International Conference on Systems, Signals and Image Processing (IWSSIP), Maribor, Slovenia, 20–22 June 2018; IEEE: Piscataway, NJ, USA, 2018; pp. 1–4. [Google Scholar]
- Pedro, B.; João, F.; Lara, J.P.; Cabral, S.; Carvalho, J.; Veloso, A.P. Evaluation of Upper Limb Joint Contribution to Racket Head Speed in Elite Tennis Players Using Imu Sensors: Comparison between the Cross-Court and inside-out Attacking Forehand Drive. Sensors 2022, 22, 1283. [Google Scholar] [CrossRef] [PubMed]
- Caprioli, L.; Bonaiuto, V.; Campoli, F.; Edriss, S.; Romagnoli, C.; Salvi, V.; Padua, E.; Annino, G. Application of an Inertial System to Impact Distance Detection in the Tennis Forehand. In Proceedings of the ECSS 2024 Book of Abstract, Glasgow, UK, 2–5 July 2024. [Google Scholar]
- Caprioli, L.; Campoli, F.; Edriss, S.; Padua, E.; Najlaoui, A.; Romagnoli, C.; Annino, G.; Bonaiuto, V. Impact Distance Detection in Tennis Forehand by an Inertial System. In Proceedings of the 12th International Conference on Sport Sciences Research and Technology Support, SciTePress, Porto, Portugal, 21–22 November 2024; pp. 277–282. [Google Scholar]
- Beange, K.H.; Chan, A.D.; Graham, R.B. Investigating Concurrent Validity of Inertial Sensors to Evaluate Multiplanar Spine Movement. J. Biomech. 2024, 164, 111939. [Google Scholar] [CrossRef] [PubMed]
- Cittadini, M.; De Benedetto, V. Validazione Dell’affidabilità e Dell’accuratezza Di Un Metodo Basato Su Sensore Inerziale per La Valutazione Di Parametri Spazio-Temporali in Task Di Salto Verticale. Master’s Thesis, Politecnico di Milano, Milan, Italy, 19 December 2022. [Google Scholar]
- Kinovea Software, Version 0.9. 2021.
- Shrout, P.E.; Fleiss, J.L. Intraclass Correlations: Uses in Assessing Rater Reliability. Psychol. Bull. 1979, 86, 420. [Google Scholar] [CrossRef]
- American Educational Research Association; American Psychological Association; National Council on Measurement in Education. Standards for Educational and Psychological Testing; American Psychological Association: Washington, NE, USA, 1985.
- Tomczak, M.; Tomczak, E. The Need to Report Effect Size Estimates Revisited. Overv. Some Recomm. Meas. Eff. Size. 2014, 21, 19–25. [Google Scholar]
- Martín, E.L.; Martinez, D.A. The Effect Size in Scientific Publication. Educ. XX1 2023, 26, 9–17. [Google Scholar]
- Cooper, H.; Hedges, L.V.; Valentine, J.C. The Handbook of Research Synthesis and Meta-Analysis; Russell Sage Foundation: Manhattan, NY, USA, 2019. [Google Scholar]
- MedCalc Statistical Software, Version 23.0.2; MedCalc: New York, NY, USA, 2024.
- Chambers, J.M. Software for Data Analysis: Programming with R. Springer: New York, NY, USA, 2008; Volume 2, No. 1. [Google Scholar]
- Cabarkapa, D.V.; Cabarkapa, D.; Philipp, N.M.; Fry, A.C. Impact of the Anatomical Accelerometer Placement on Vertical Jump Performance Characteristics. Sports 2023, 11, 92. [Google Scholar] [CrossRef] [PubMed]


| Set 1 | Set 2 | ρ | Wilcoxon-Signed Rank Test | ES | 95% CI for ES | ||||||
|---|---|---|---|---|---|---|---|---|---|---|---|
| Parameters | Mean ± SD | Median | IQR | Mean ± SD | Median | IQR | W | p | |||
| LD (cm) | 95 ± 20 | 104 | 40 | 94 ± 20 | 104 | 38 | 0.894 *** | 132 | 0.585 | 0.143 | −0.331 to 0.559 |
| Gyr X (°/s) | 453 ± 154 | 450 | 287 | 470 ± 160 | 483 | 251 | 0.887 *** | 105 | 0.733 | −0.091 | −0.522 to 0.377 |
| Acc Z (m/s2) | 13 ± 14 | 13 | 18 | 12 ± 15 | 13 | 17 | 0.969 *** | 143 | 0.355 | 0.238 | −0.241 to 0.624 |
| dv (m/s) | 0.10 ± 0.1 | 0.13 | 0.1 | 0.09 ± 0.1 | 0.14 | 0.1 | 0.973 *** | 140 | 0.412 | 0.212 | −0.266 to 0.607 |
| (°) | 9 ± 12 | 12 | 12 | 10 ±10 | 11 | 14 | 0.631 ** | 110 | 0.865 | −0.048 | −0.490 to 0.414 |
| (°) | −104 ± 23 | −118 | 29 | −101 ± 21 | −113 | 28 | 0.895 *** | 71 | 0.128 | −0.385 | −0.717 to 0.085 |
| Parameters | ICC3,k | 95% CI for ICC | CV a % | 95% CI for CV | SEM | MDC |
|---|---|---|---|---|---|---|
| LD (cm) | 0.951 | 0.908 to 0.973 | 6.335 | 3.804 to 8.112 | 1.865 | 3.656 |
| Gyr X (°/s) | 0.955 | 0.917 to 0.976 | 9.500 | 0 to 13.517 | 13.349 | 26.165 |
| Acc Z (m/s2) | 0.987 | 0.976 to 0.993 | 17.067 | 9.054 to 22.374 | 0.694 | 1.359 |
| dv (m/s) | 0.985 | 0.973 to 0.992 | 16.453 | 8.732 to 21.568 | 0.007 | 0.014 |
| (°) | 0.834 | 0.690 to 0.911 | 82.146 | 26.412 to 113.130 | 1.788 | 3.505 |
| (°) | 0.967 | 0.939 to 0.982 | 6.145 | 3.392 to 8.001 | 1.669 | 3.271 |
| ρ | p | |
|---|---|---|
| Lateral distance (cm)—Gyr X | 0.568 | <0.001 |
| Lateral distance (cm)—Acc Z | 0.487 | <0.001 |
| Acc Z—Gyr X | 0.732 | <0.001 |
| −0.402 | <0.001 | |
| 0.432 | <0.001 | |
| 0.472 | <0.001 | |
| 0.527 | <0.001 | |
| −0.599 | <0.001 | |
| −0.596 | <0.001 | |
| −0.410 | <0.001 |
| ρ | p | |
|---|---|---|
| Lateral distance (cm)—Acc Z | 0.258 | 0.018 |
| Lateral distance (cm)—dv | 0.255 | 0.020 |
| Gyr X—dv | 0.879 | <0.001 |
| −0.281 | 0.010 | |
| −0.238 | 0.030 | |
| −0.492 | <0.001 | |
| −0.560 | <0.001 | |
| Acc Z—Gyr X | 0.878 | <0.001 |
| −0.562 | <0.001 |
| Set 1 | Set 2 | ρ | Wilcoxon-Signed Rank Test | ES | 95% CI for ES | ||||||
|---|---|---|---|---|---|---|---|---|---|---|---|
| Parameters | Mean ± SD | Median | IQR | Mean ± SD | Median | IQR | W | p | |||
| LD (cm) | 6 ± 22 | 6 | 30 | 2 ± 22 | 1.3 | 34 | 0.879 *** | 71 | 0.080 | 0.560 | 0.017 to 0.848 |
| APD (cm) | 20 ± 25 | 15 | 41 | 17 ± 24 | 13 | 37 | 0.901 *** | 61 | 0.305 | 0.341 | −0.256 to 0.749 |
| Gyr X (°/s) | 434 ± 149 | 400 | 236 | 428 ± 146 | 428 | 263 | 0.984 *** | 51 | 0.735 | 0.121 | −0.458 to 0.628 |
| Gyr Z (°/s) | 124 ± 85 | 132 | 162 | 110 ± 84 | 100 | 159 | 0.934 *** | 69 | 0.110 | 0.516 | −0.045 to 0.830 |
| Acc Z (m/s2) | 14 ± 8 | 12.5 | 11 | 14 ± 9 | 12.6 | 13 | 0.967 *** | 47 | 0.946 | 0.033 | −0.525 to 0.571 |
| Acc X (m/s2) | −3 ± 8 | −1.5 | 15 | −3 ± 8 | −1.2 | 17 | 0.973 *** | 42 | 0.839 | −0.077 | −0.600 to 0.492 |
| (°) | 29 ± 14 | 27 | 14 | 28 ± 10 | 27 | 15 | 0.907 *** | 35 | 0.497 | −0.231 | −0.692 to 0.364 |
| Parameters | ICC3,k | 95% CI for ICC | CV a % | 95% CI for CV | SEM | MDC |
|---|---|---|---|---|---|---|
| LD (cm) | 0.973 | 0.941 to 0.988 | 2684% | 0 to 4766 | 1.860 | 3.646 |
| APD (cm | 0.976 | 0.946 to 0.989 | 61% | 0 to 89 | 2.049 | 4.015 |
| Gyr X (°/s) | 0.991 | 0.979 to 0.996 | 5% | 3 to 7 | 7.719 | 15.130 |
| Gyr Z (°/s) | 0.963 | 0.918 to 0.984 | 260% | 0 to 462 | 8.670 | 16.995 |
| Acc Z (m/s2) | 0.990 | 0.979 to 0.996 | 27% | 0 to 46 | 6.108 | 11.971 |
| Acc X (m/s2) | 0.985 | 0.967 to 0.993 | 57% | 0 to 93 | 0.527 | 1.033 |
| (°) | 0.955 | 0.899 to 0.980 | 10% | 0 to 17 | 1.319 | 2.585 |
| ρ | p | |
|---|---|---|
| −0.556 | <0.001 | |
| Lateral distance (cm)—Gyr Z | −0.548 | <0.001 |
| Lateral distance (cm)—Gyr X | −0.373 | <0.001 |
| Lateral distance (cm)—ADP (cm) | 0.211 | 0.016 |
| Lateral distance (cm)—Acc Z | −0.460 | <0.001 |
| Lateral distance (cm)—Acc X | 0.405 | <0.001 |
| Acc Z—Gyr X | 0.871 | <0.001 |
| Acc Z—Gyr Z | 0.708 | <0.001 |
| Acc Z—Acc X | −0.792 | <0.001 |
| ADP (cm)—Acc Z | 0.262 | <0.001 |
| ADP (cm)—Acc X | −0.281 | 0.001 |
| ADP (cm)—Gyr X | 0.289 | <0.001 |
| Gyr X—Acc X | −0.717 | <0.001 |
| Gyr Z—Acc X | −0.714 | <0.001 |
| —Acc Z | 0.687 | <0.001 |
| —Acc X | −0.517 | <0.001 |
| —Gyr X | 0.636 | <0.001 |
| —Gyr Z | 0.422 | <0.001 |
Disclaimer/Publisher’s Note: The statements, opinions and data contained in all publications are solely those of the individual author(s) and contributor(s) and not of MDPI and/or the editor(s). MDPI and/or the editor(s) disclaim responsibility for any injury to people or property resulting from any ideas, methods, instructions or products referred to in the content. |
© 2025 by the authors. Licensee MDPI, Basel, Switzerland. This article is an open access article distributed under the terms and conditions of the Creative Commons Attribution (CC BY) license (https://creativecommons.org/licenses/by/4.0/).
Share and Cite
Caprioli, L.; Romagnoli, C.; Campoli, F.; Edriss, S.; Padua, E.; Bonaiuto, V.; Annino, G. Reliability of an Inertial Measurement System Applied to the Technical Assessment of Forehand and Serve in Amateur Tennis Players. Bioengineering 2025, 12, 30. https://doi.org/10.3390/bioengineering12010030
Caprioli L, Romagnoli C, Campoli F, Edriss S, Padua E, Bonaiuto V, Annino G. Reliability of an Inertial Measurement System Applied to the Technical Assessment of Forehand and Serve in Amateur Tennis Players. Bioengineering. 2025; 12(1):30. https://doi.org/10.3390/bioengineering12010030
Chicago/Turabian StyleCaprioli, Lucio, Cristian Romagnoli, Francesca Campoli, Saeid Edriss, Elvira Padua, Vincenzo Bonaiuto, and Giuseppe Annino. 2025. "Reliability of an Inertial Measurement System Applied to the Technical Assessment of Forehand and Serve in Amateur Tennis Players" Bioengineering 12, no. 1: 30. https://doi.org/10.3390/bioengineering12010030
APA StyleCaprioli, L., Romagnoli, C., Campoli, F., Edriss, S., Padua, E., Bonaiuto, V., & Annino, G. (2025). Reliability of an Inertial Measurement System Applied to the Technical Assessment of Forehand and Serve in Amateur Tennis Players. Bioengineering, 12(1), 30. https://doi.org/10.3390/bioengineering12010030