Article

Spatial Estimation of Soil Loss and Planning of Suitable Soil and Water Conservation Interventions for Environmental Sustainability in Northern Karnataka in India Using Geospatial Techniques

by
Raghavan Rejani
1,
Kondru Venkateswara Rao
1,
Maheshwar Shivashankar Shirahatti
2,
Kotha Sammi Reddy
1,*,
Gajjala Ravindra Chary
1,
Kodigal A. Gopinath
1,
Mohammed Osman
1,
Mathyam Prabhakar
1 and
Vinod Kumar Singh
1
1
ICAR-Central Research Institute for Dryland Agriculture, Hyderabad 500059, India
2
AICRPDA Centre, Vijayapura 586101, India
*
Author to whom correspondence should be addressed.
Water 2022, 14(22), 3623; https://doi.org/10.3390/w14223623
Submission received: 10 October 2022 / Accepted: 27 October 2022 / Published: 10 November 2022
(This article belongs to the Special Issue Simulation of the Hydrological, Thermal and Energy Budgets)

Abstract

:
The selected study area lies in Karnataka State of Southern India and is frequently subjected to prolonged dry spells, high soil erosion, declining groundwater levels, and reductions in crop yield. In order to make this region sustainable, estimation of soil loss, selection and prioritization of suitable interventions, and its adoption are very important. In this study, spatial soil loss estimation models were developed sub-district-wise using the Revised universal soil loss equation (RUSLE) and GIS for a period of 70 years (1951 to 2020). The observed soil loss data for the period of 2011 to 2015 were used for validation of the model (R2 = 0.89) and were found satisfactory. The average annual rainfall ranged spatially from 420 to 3700 mm, erosivity (R) ranged from 2606 to >15,000 MJ mm ha−1 h−1 year−1, and average annual soil loss varied from <2.0 to >15.0 t ha−1 y−1 in the northern dry zone of Karnataka. Most of the study area had an average annual rainfall of 550 to 800 mm and the soil loss was <10.0 t ha−1 y−1. A higher erosivity and soil loss occurred in the western part of the selected area where high rainfall is predominant. A considerable variability in rainfall, erosivity, and soil loss was found in high, medium, and low-rainfall regions from 1951 to 2020. The spatial soil loss was estimated catchment-wise and prioritized to determine the vulnerable areas. It was found that 7.69% of the area with soil loss ≥ 15.0 t ha−1 y−1 needs top priority for planning interventions (Priority 1) followed by 10.49% of the area with soil loss ranging from 10.0 to 15.0 t ha−1 y−1 (Priority 2) and 42.7% of the area under 5.0 to 10.0 t ha−1 y−1 (Priority 3), and the remaining area has lower priority. In order to make Northern Karnataka more sustainable, suitable site-specific moisture conservation practices and water-harvesting/groundwater recharge structures were planned using geospatial techniques. Among the selected moisture conservation interventions, conservation furrow and contour cultivation are very suitable for all the nine districts followed by compartmental bunding and semi-circular bunds. Out of the total area, conservation furrow was found suitable for 45.3% of the area, contour cultivation for 24.3% of the area, and compartmental bunding and semi-circular bunds for 16.8 and 16.9% of the areas, respectively. The study indicated that a considerable amount of topsoil is lost as erosion and, hence, planning and adoption of suitable in situ soil and water conservation practices and water-harvesting/groundwater recharge structures are the need of the hour for the sustainable management of this region. The identified locations were validated using visual interpretations, ground truth, and recorded data.

1. Introduction

About 75 billion tons of soil is eroded in a year from the arable regions of the world, and most of the agricultural land is losing soil 13 to 40 times more quickly than the rate of regeneration of soil [1,2]. Even though the soil degradation process occurs naturally, human interferences accelerate its extent and its associated impacts on food production [3]. It is also well recognized as a major threat to environmental and soil biodiversity [4,5]. In India, 53.0% of the area is affected from the soil erosion with an average rate of 16.0 t ha−1 y−1 [6]. Soil erosion is a common type of land degradation across the globe, and for attaining a land-degradation-free world for future needs, execution of immediate action plans such as obtaining precise data of soil loss and planning and adoption of suitable management strategies for erosion control is needed [7,8,9]. The climate crisis will strongly affect the erosion process. Directly, rainfall erosivity is expected to increase under the future climate projection [10].
The yield of crops mainly depends on two natural resources, namely land and water, and, hence, the conservation and precise utilization of these resources are very important [11,12,13]. Excessive erosion causes on-site as well as off-site problems [14]. The on-site impact of erosion is the loss of the top fertile soil, which adversely affects the root growth, moisture storage, and crop yields, leads to ecological collapse, and reduces the carrying capacity and storage of streams, reservoirs, tanks, and riverbeds [15,16,17,18,19,20,21,22]. Soil erosion generally depends on different parameters such as rainfall, soil, topography, and land use/land cover [23,24]. Mechanical and vegetative measures are generally used to control erosion.
In India, out of 120.72 M ha of degraded land, 82.57 M ha is deteriorated due to water-induced erosion [25,26]. Among different Indian states, approximately 49.0% of the area of Karnataka State is impacted by erosion at a rate of >10.0 t ha−1 yr−1 and is in the fifth position with respect to soil erosion. The soil loss in different districts of Karnataka ranges from <5.0 to >10.0 t ha−1 yr−1 [25]. This is driven by natural and anthropogenic factors including a high density of population, unemployment rate, agricultural expansion, poor management practices, and climate change impacts [27]. Previous studies have reported that one-third of the districts, namely Koppal, Bagalkote, Bellary, and Dharwad, require soil loss mitigation in a phased manner, whereas two districts, namely Belgavi and Vijayapura, are worst affected and need immediate conservation [25].
The most commonly used methodologies for determination of soil erosion include runoff plots and gauging devices, remote sensing, and modeling [2,28,29]. The models widely used by researchers include the Universal Soil Loss Equation (USLE) [30,31,32], Revised Universal Soil Loss Equation (RUSLE) [33,34], Water Erosion Prediction Project (WEPP) [35], Kinematic Runoff and Erosion Model (KINEROS) [36], Pan-European Soil Erosion Risk Assessment (PESERA) [37], Coordination of Information on the Environment (CORINE) [38], and Erosion Potential Model (EPM) [39]. These models are applied in different regions across the world. The widely applied models for soil loss estimation include USLE, RUSLE, and the Soil Loss Estimation model of Southern Africa (SLEMSA) [40,41]. Other commonly used models are the Areal Nonpoint Source Watershed Environment Response Simulation (ANSWERS) [42], Agricultural Non-Point Source Pollution (AGNPS) [43], and Chemical, Runoff, and Erosion from Agricultural Management Systems (CREAMS) [44]. ANSWERS and CREAMS consider slope, vegetation, rainfall, soil, and erosion control methods [40].
The selected study area has a limited number of gauging stations and the availability of runoff and soil loss data is very low; hence, estimation of the soil loss is needed [42]. The RUSLE has been commonly applied for soil loss determination at the watershed and regional scale because of its easiness and compatibility with GIS. This study aims to determine the soil loss spatially with RUSLE and prioritize the vulnerable areas for site-specific management. In order to control the soil erosion and to conserve the moisture in the soil, adoption of in situ moisture conservation techniques is essential. Selection of a suitable intervention using surveys for large areas is a time-consuming task and, hence, for planning of site-specific in situ interventions, application of geospatial techniques is well suited. Very limited literature is available in this regard and there is no study carried out in Northern Karnataka. Therefore, a methodology is developed in this study to plan suitable soil and water conservation interventions for a large area in Northern Karnataka using geospatial techniques to minimize the soil erosion.

2. Materials and Methods
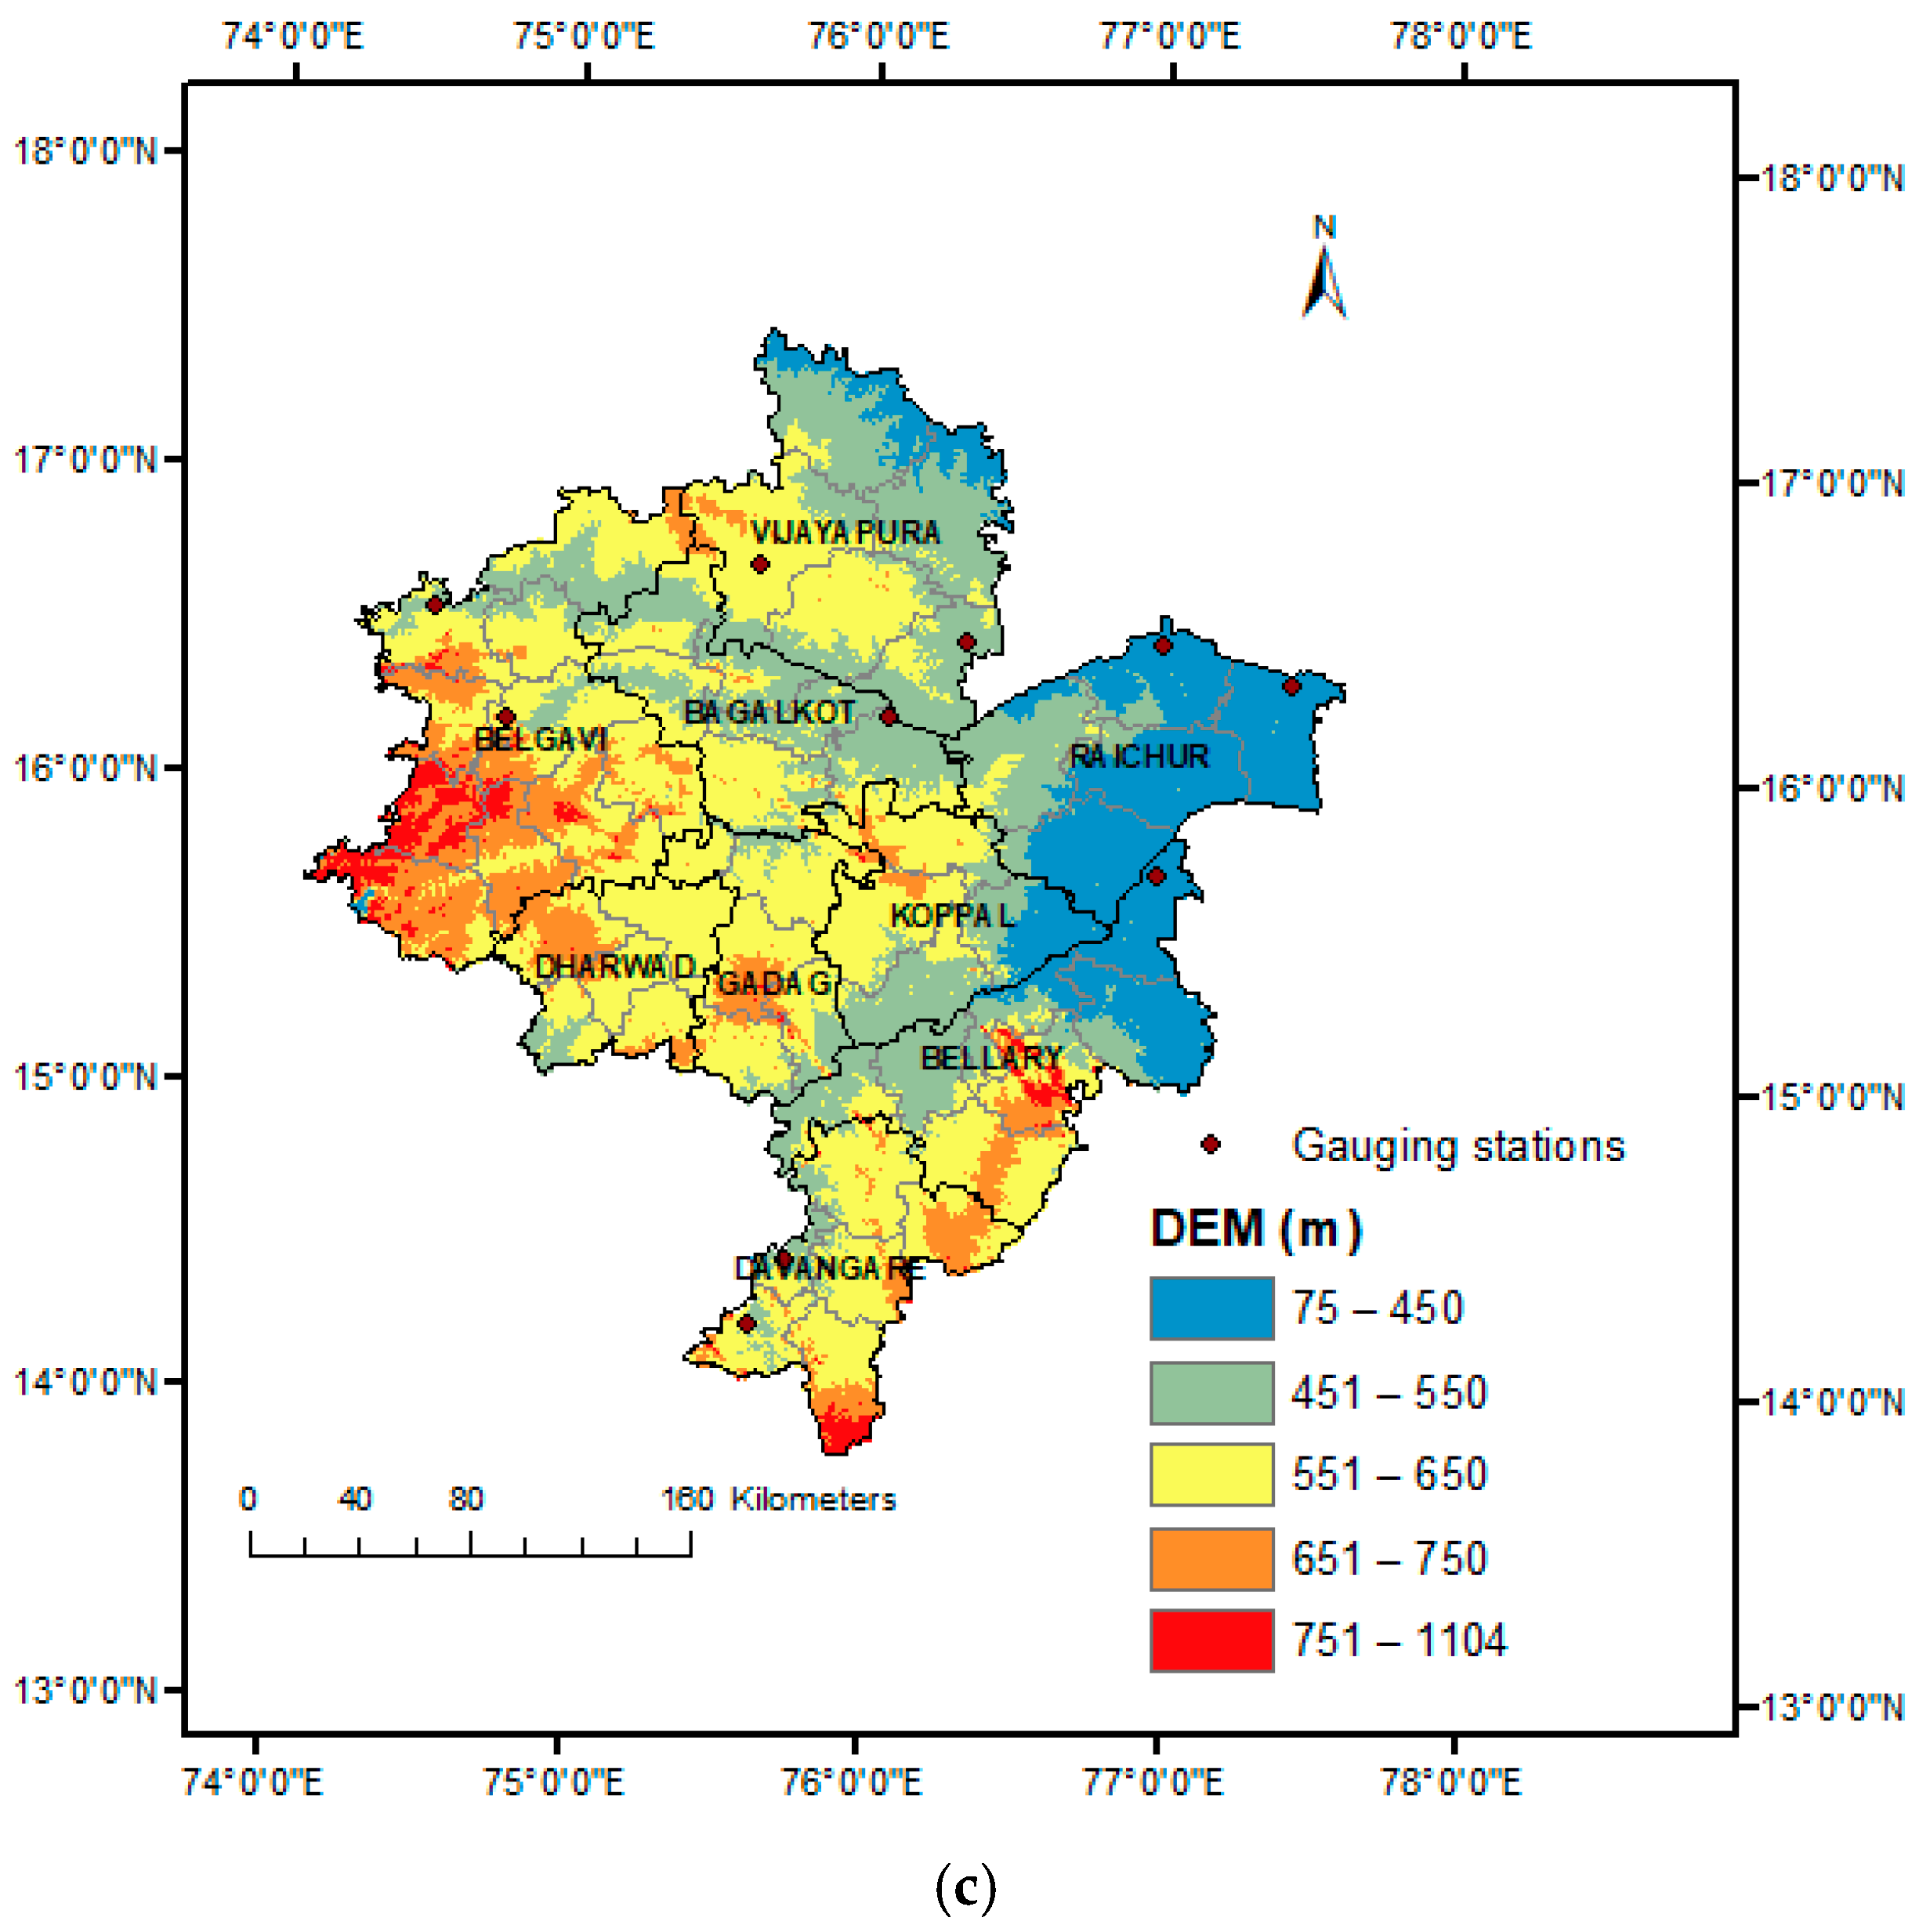
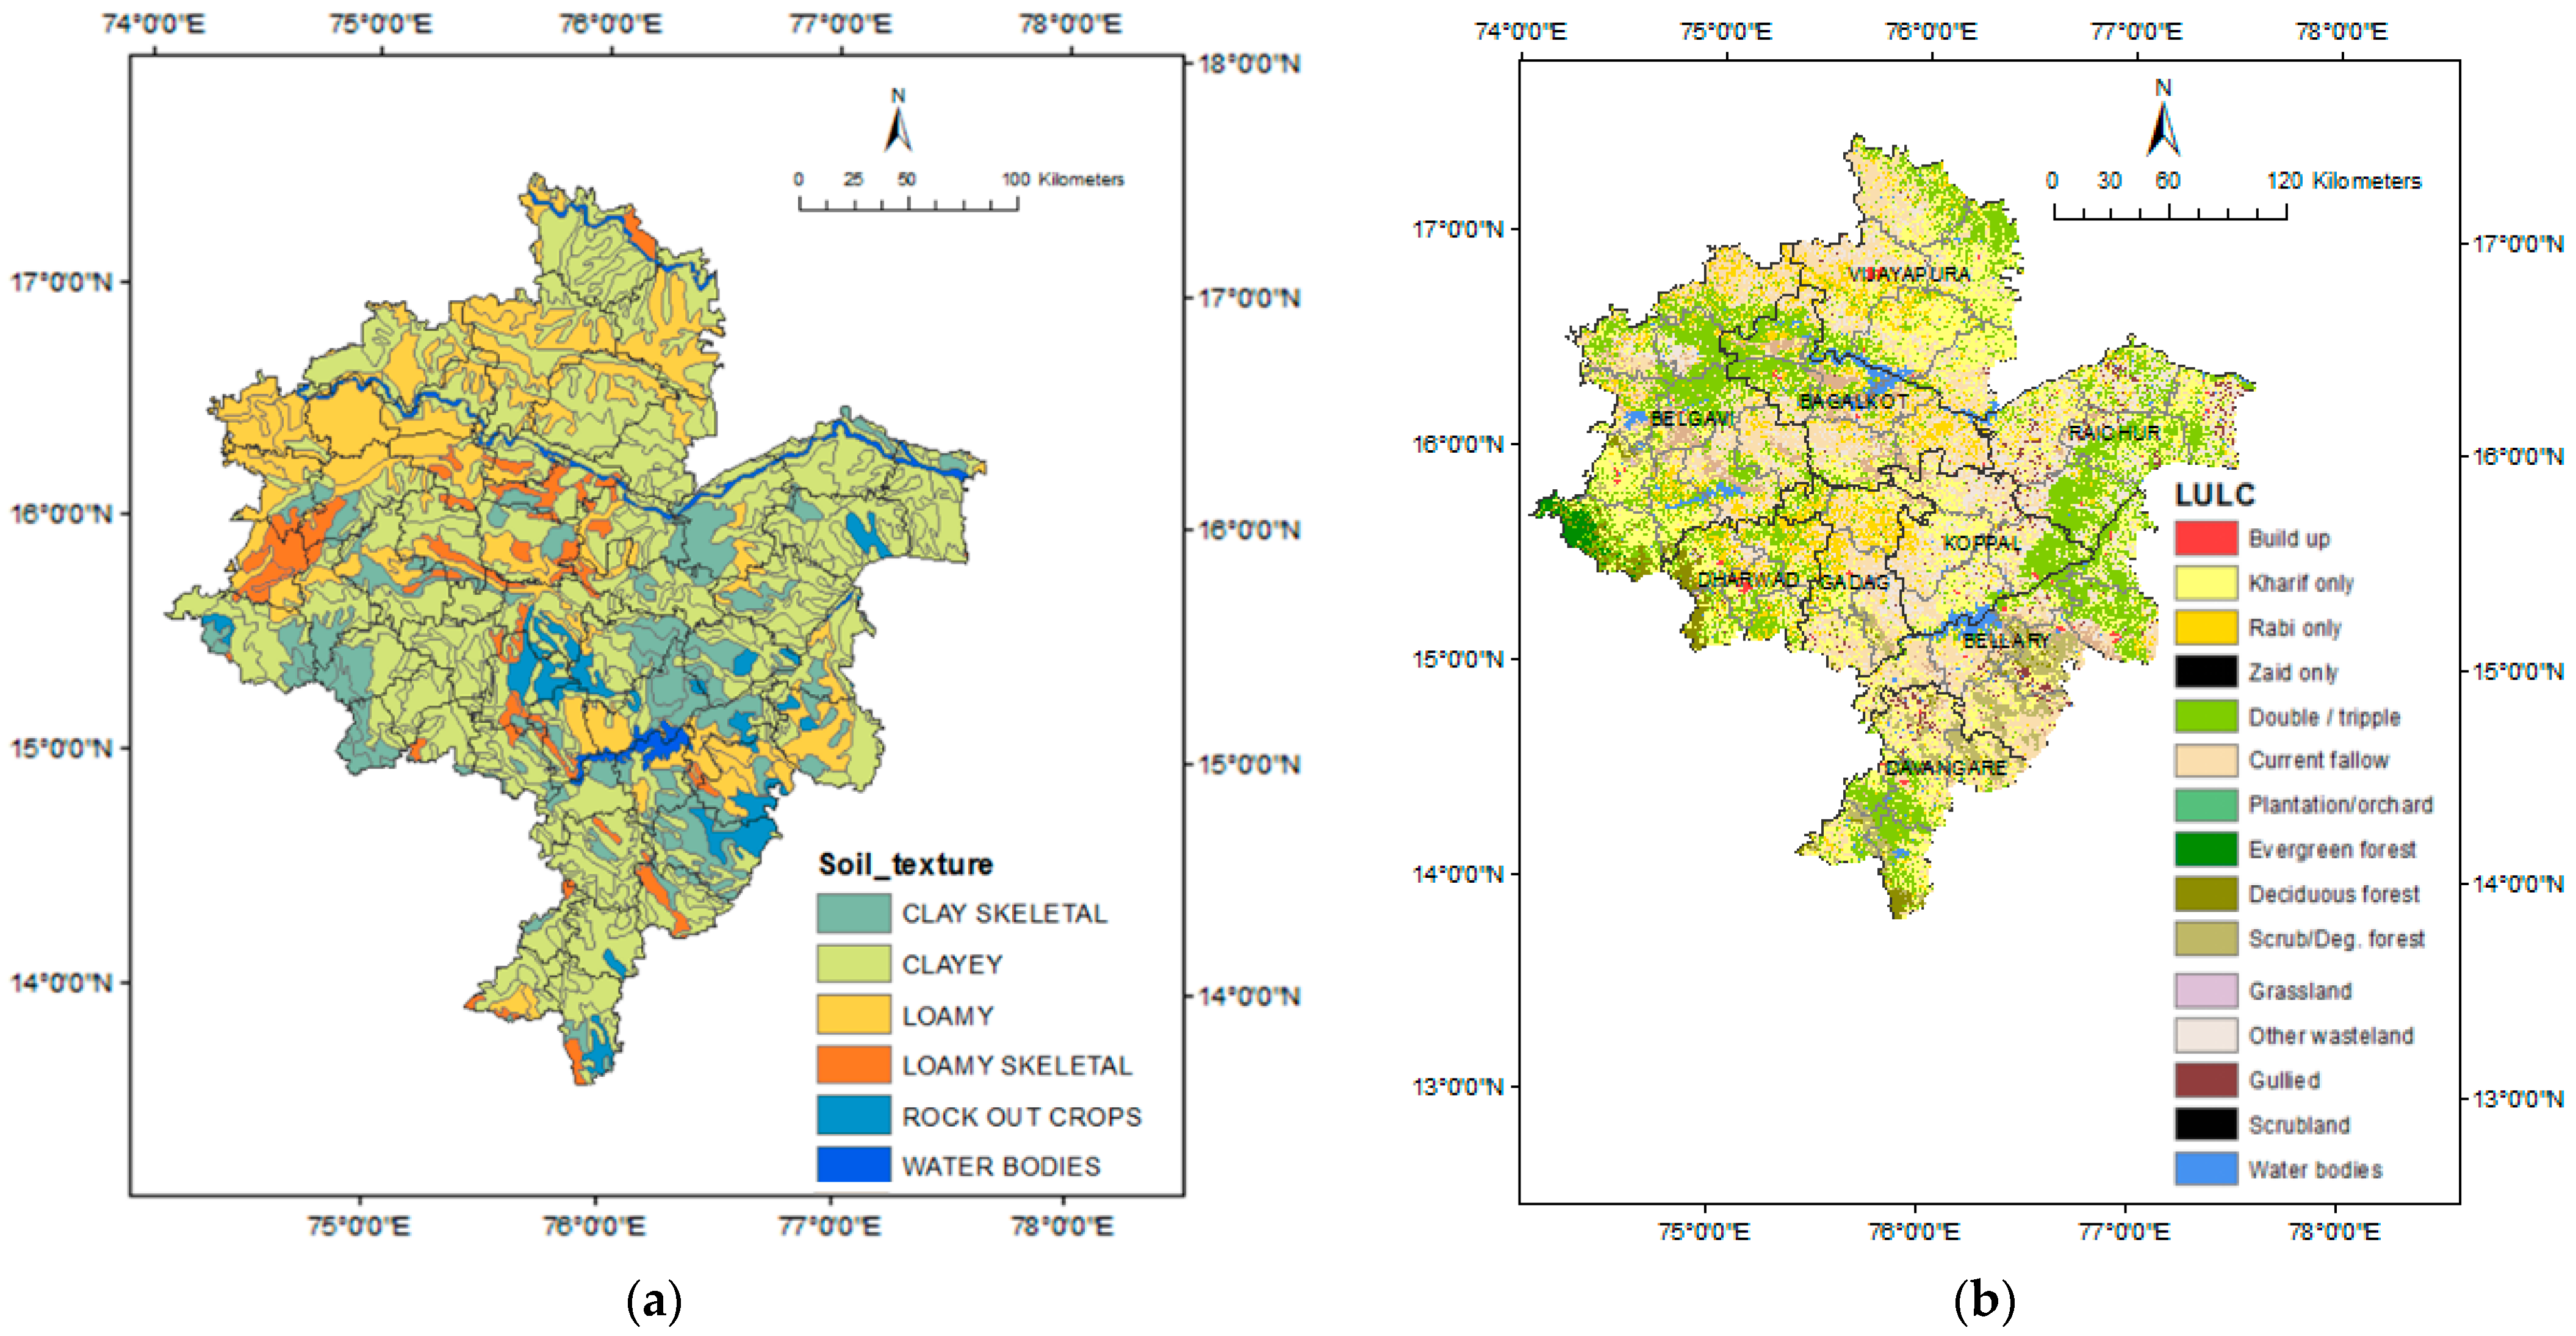
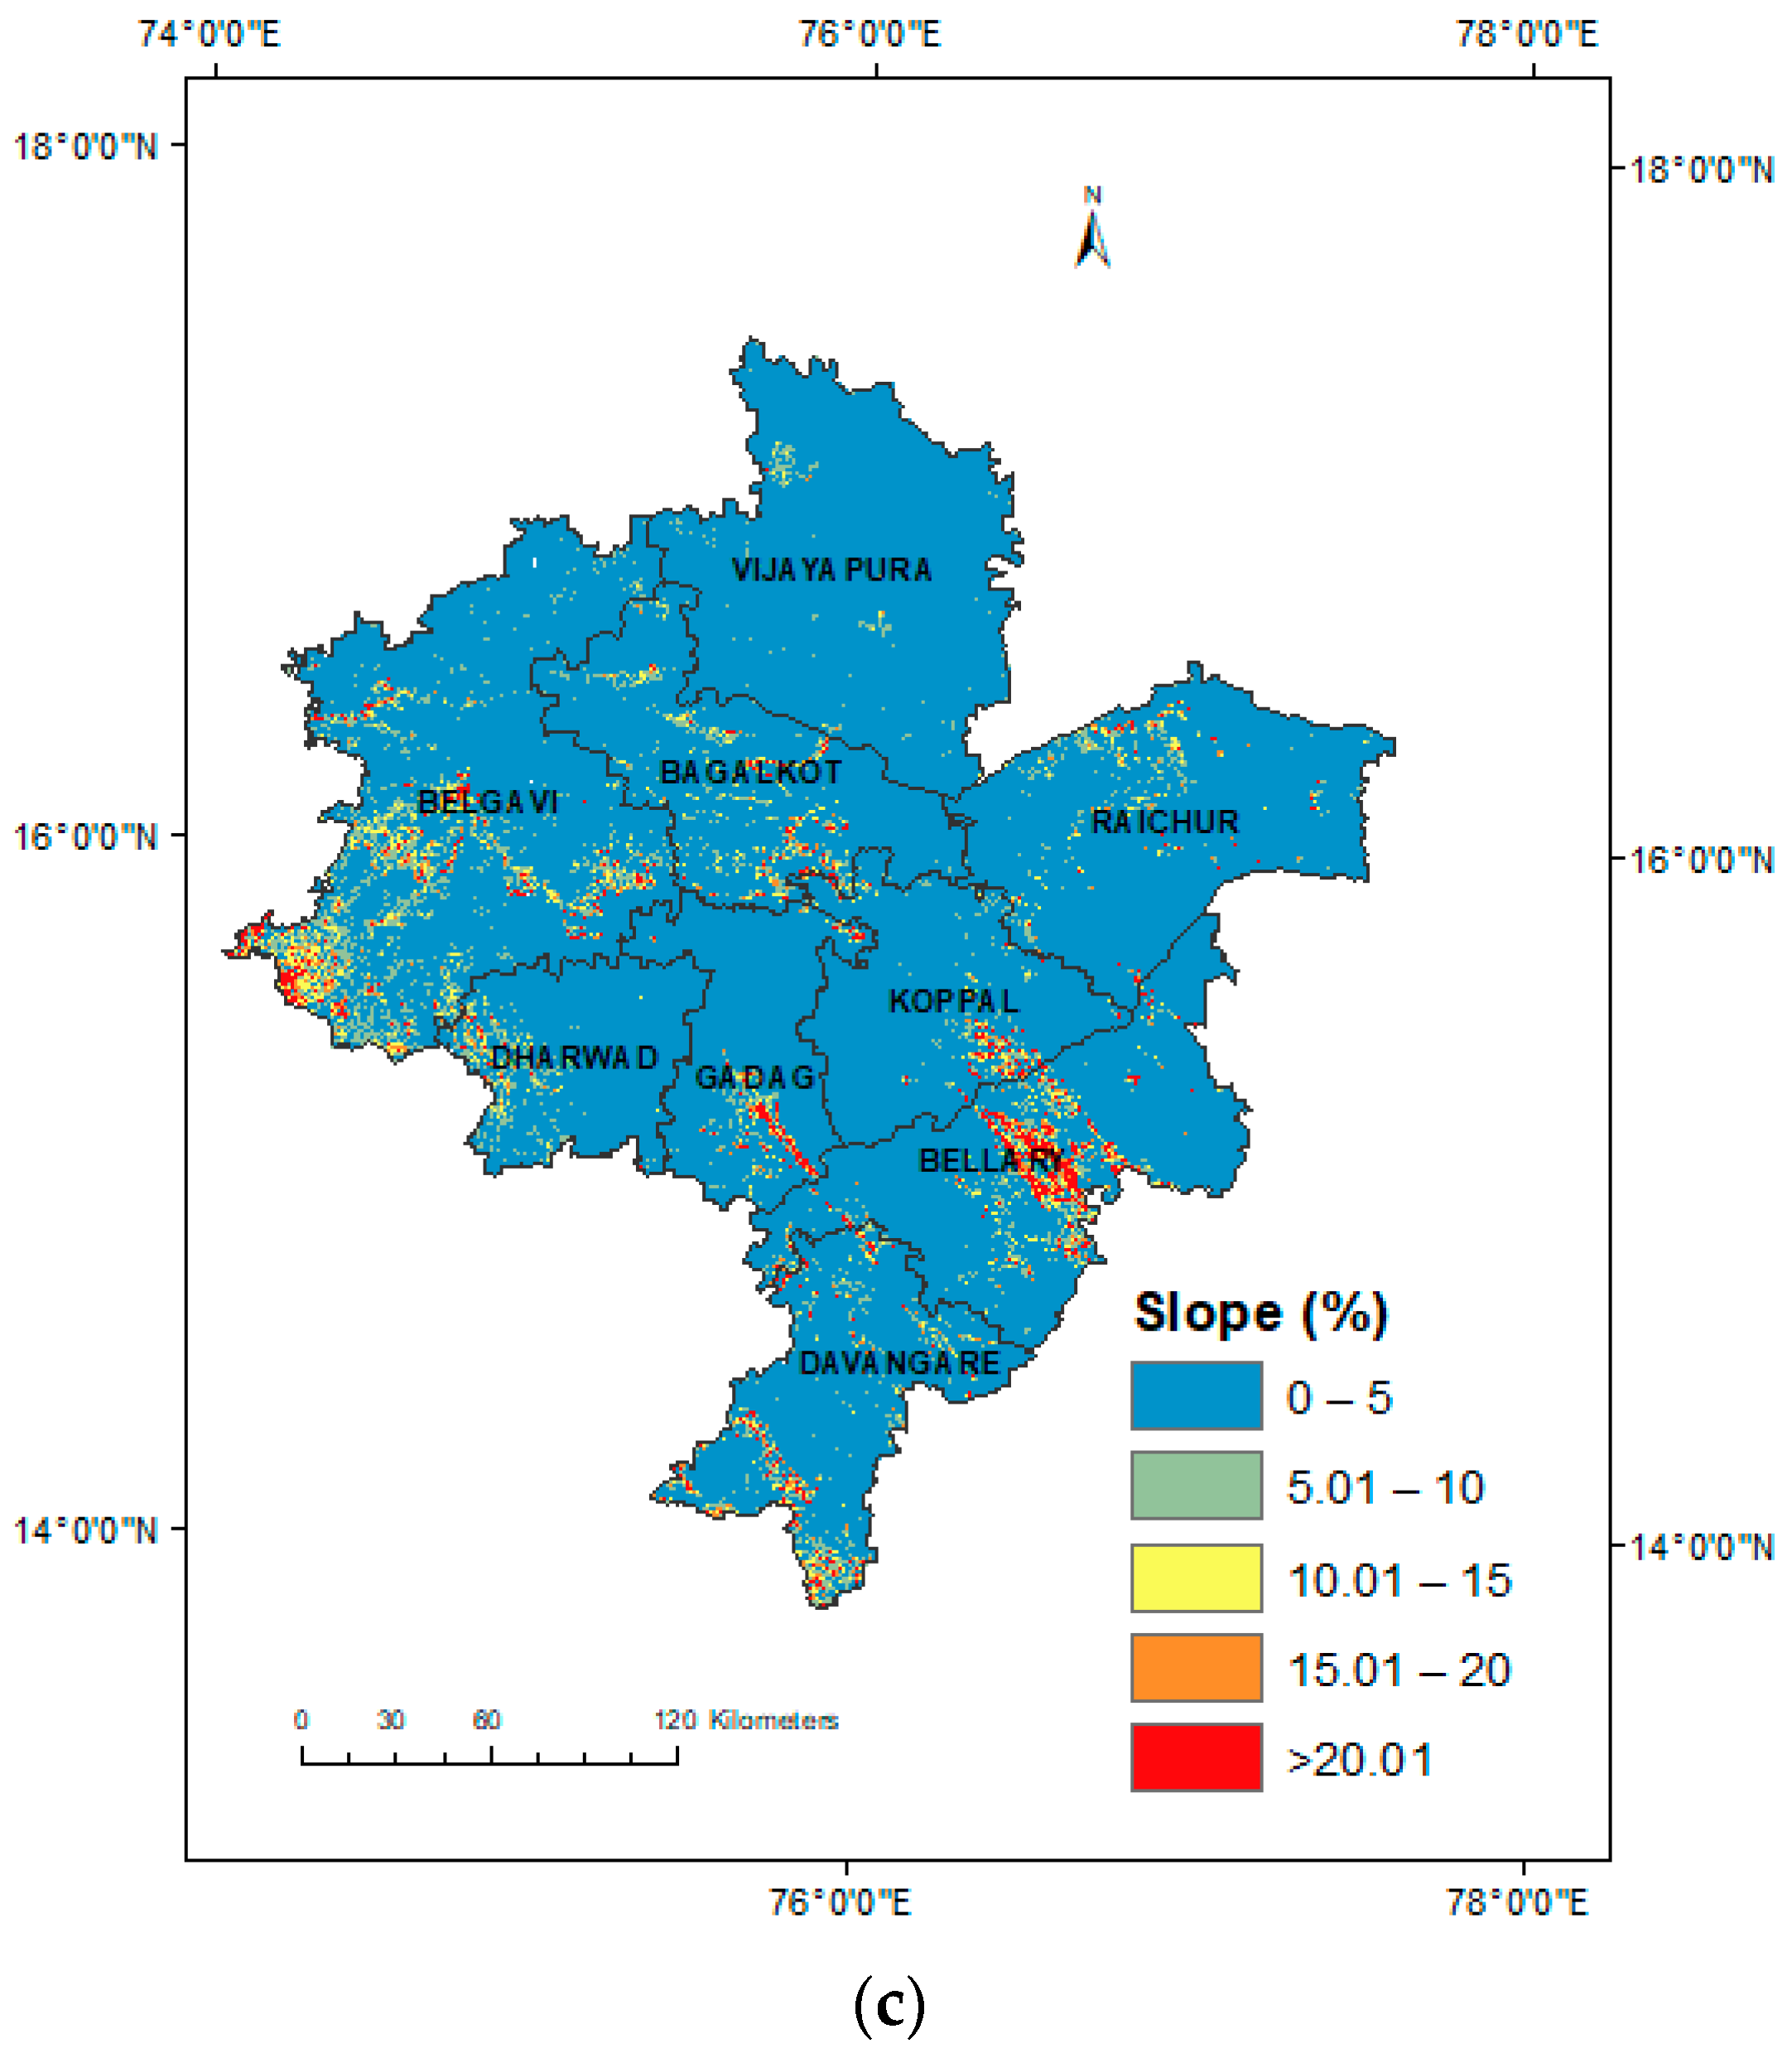
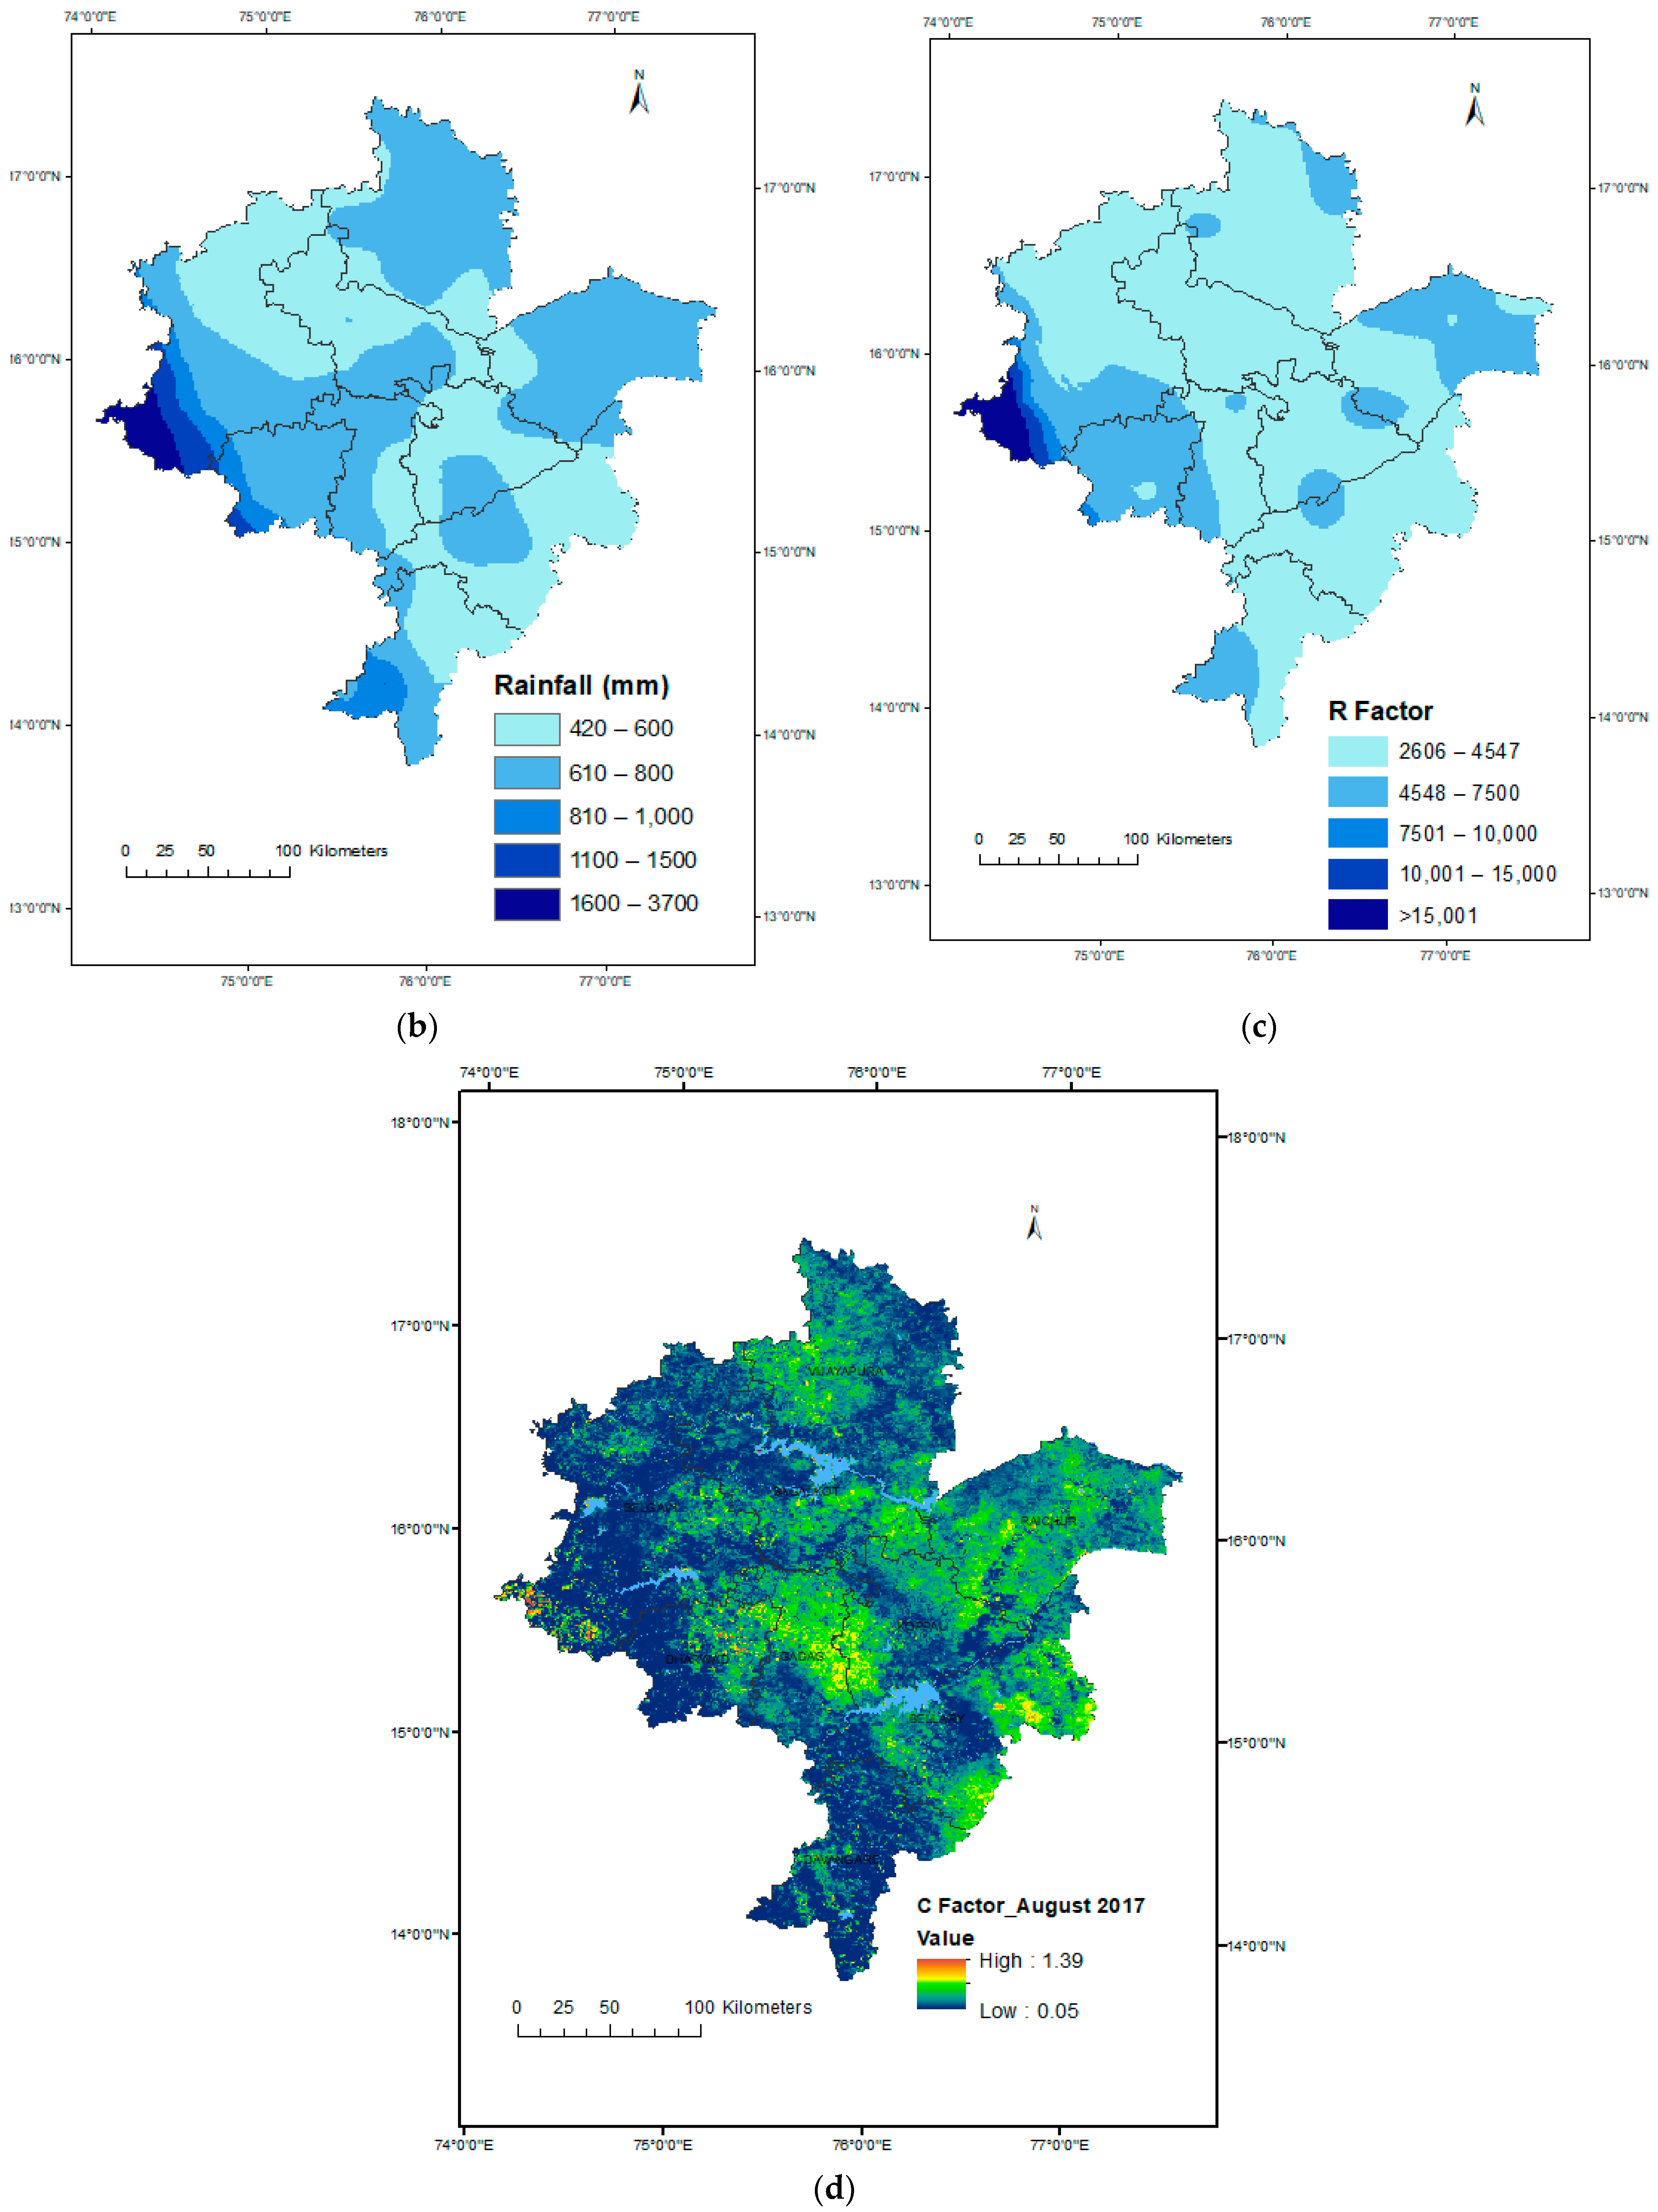
2.1. Study Area

The study area is located in Northern Karnataka, a part of the Krishna basin, which lies between 13° 47′ and 17° 30′ N and 74° 05′ and 77° 36′ E with an altitude range from 75 m to 1104 m above MSL (Figure 1). It is a dry zone and a semi-arid region including Vijayapura, Belgavi, Bagalkot, Gadag, Koppal, Bellary, Davengere, Raichur, and Dharwad districts of Karnataka covering an area of 67,884.59 km2. The mean annual rainfall of these regions ranged from 420 to 3700 mm with the few sub-districts of Belgavi and Dharwad with higher rainfall.
The main soil types in this area are shallow to very shallow black soils, medium deep to deep black soils, and red soils with clayey to loamy in texture (Figure 2a). The major crops grown are green gram, pearl millet, sunflower, pigeonpea, sorghum, chickpea, and rabi sorghum [45]. These districts have mainly agricultural land, current fallow, waste land, scrub land, and degraded forest (Figure 2b). Most of the area in the selected districts has a slope less than 5.0% (Figure 2c).
Different layers were prepared in GIS to estimate the soil loss. ASTER DEM (30 m resolution), the LULC map from the Remote Sensing Centre, rainfall grid data (0.25° × 0.25°) from the Indian Meteorological Department (IMD) for the period of 1951 to 2020, and MODIS NDVI and the soil map from the National Bureau of Soil Science and Land Use Planning (NBSS and LUP) were used. The flow accumulation map, slope map, drainage lines, and stream orders were generated from DEM.

2.2. Soil Erosion Estimation Using Revised Universal Soil Loss Equation (RUSLE)

The prediction of soil erosion using several models with different techniques is used in different regions across the world. In the present study, RUSLE was used for estimating the erosion [33,34]. The mean annual soil loss in the selected sub-districts was determined spatially and temporally using the GIS and RUSLE equation (Equation (1)), which depends on rainfall, soil, LULC, and topography. The required thematic layers were intersected in GIS and soil loss was estimated.
A = R K L S C P
where A = mean annual soil loss (t ha−1 y−1); R = erosivity factor (MJ mm ha−1 h−1 y−1) (Equation (2)); K = soil erodibility factor (t ha h ha−1 MJ−1 mm−1); LS = slope length steepness factor (Equation (3)); C = cover management factor; P = conservation practices factor. LS, C, and P are dimensionless factors.
The erosivity factor is one of the key factors in the USLE/RUSLE models for determination of soil loss from catchments [30]. The R factor is associated with the kinetic energy of a raindrop’s impact and is derived from the individual rainfall events, and it depicts the average annual values over multiple years. The equation for the R factor for daily soil loss developed at ICAR-CRIDA, Hyderabad was used [46].
The R factor was estimated for the period of 1951–2020 using the following equations:
R = i = 1 n j = 1 m E I 30 n × 1000 / 200.6
where R is the mean annual erosivity (MJ mm ha−1 h−1 y−1); i is the year; j is the days per year i; EI30 is the rainfall erosivity at 30 min per day (hundreds t cm ha−1 h−1).
E I 30 = 34.065   E I 1440 0.2695  
where EI1440 = erosion index per day (hundreds t cm ha−1 h−1).
E I 1440 = 3.856   P I 1440 0.0048  
where PI1440 = daily precipitation index, cm2h−1.
P I 1440 = ( R a i n f a l l ) 2 / 24  
where Rainfall is in cm.
The R value corresponding to each rainfall event was added to obtain the monthly and annual erosivity for 70 years.
The K factor was estimated based on the soil properties such as texture, structural stability, particle size distribution, water transmission characteristics, clay mineralogy, and organic matter content [47]. Generally, the K value is lower for sandy and clay soils because clay soils are not easily detachable and sandy soils have less runoff. Silt loamy soils have medium to high K values because these soil particles are not resistant to detachment and produce higher runoff. In the present study, the value of the K factor selected was 0.015 [48].
The LS factor [30] was derived from the flow accumulation and slope [46,49] using Equation (6)
L S = Flow   accumulation     cell   value 22.1 m ( 0.065 + 0.045 s + 0.0065 s 2 )
where s = slope in degrees and m is a constant depending on slope.
In the case of slopes ≤3, m is 0.3; for slopes between 3 and 5, m is 0.4; for slopes ≥5, m is 0.5.
The value of C ranges from 0 for a very well-maintained soil to 1.5 for a highly tilled and susceptible soil. In this study, the C factor was derived from MODIS NDVI using Equation (7) [50].
C = exp ( N D V I β N D V I )
where α and β are the parameters that determine the NDVI-C curve. The monthly images of NDVI were used to derive monthly C factors for normal and dry years during the selected period. The values of α and β were 2 and 1, respectively. The P factor was adopted based on the LULC and the conservation practices. The P factor ranged from 0 for good conservation practice to 1 for poor conservation practice.
The different thematic layers generated above were intersected in ARCGIS and soil loss was estimated spatially and temporally using RUSLE for the period of 70 years from 1951 to 2020. The observed soil loss data from the All India Coordinated Research Project for Dryland Agriculture, Vijayapura for the period from 2011 to 2015 were used for validation of the model (Figure 1c). The soil loss from high, medium, and low-rainfall regions during normal, above normal, and drought years were selected and analyzed to find the temporal variability. Among the districts selected, Belgavi was characterized with high, medium, and low-rainfall regions. The annual rainfall of these three rainfall regions was tabulated into different rainfall years. The years with an annual rainfall more than +19% were selected as above normal years, those between −9 and +19% as normal years, and those less than −19% as drought years [51]. Correspondingly, the erosivity and soil loss estimated were also categorized. The statistical significance of the identified trends in rainfall, erosivity, and soil loss was carried out with the Mann–Kendall trend test and Sen’s slope [52].

2.3. Prioritization of Vulnerable Areas

The spatial soil loss map and the catchments obtained using GIS were intersected and dissolved to obtain the catchment-wise soil loss. It is to be noted that the catchments with more soil loss needs top priority for taking up erosion control techniques [48]. The catchments affected with a soil loss of >15.0 t ha−1 y−1 need top priority for implementing erosion control measures followed with areas having a soil loss ranging from 10.0 to 15.0 t ha−1 y−1 and then from 5 to 10.0 t ha−1 y−1. Regions with a soil loss less than 5.0 t ha−1 y−1 also need small interventions for controlling erosion.

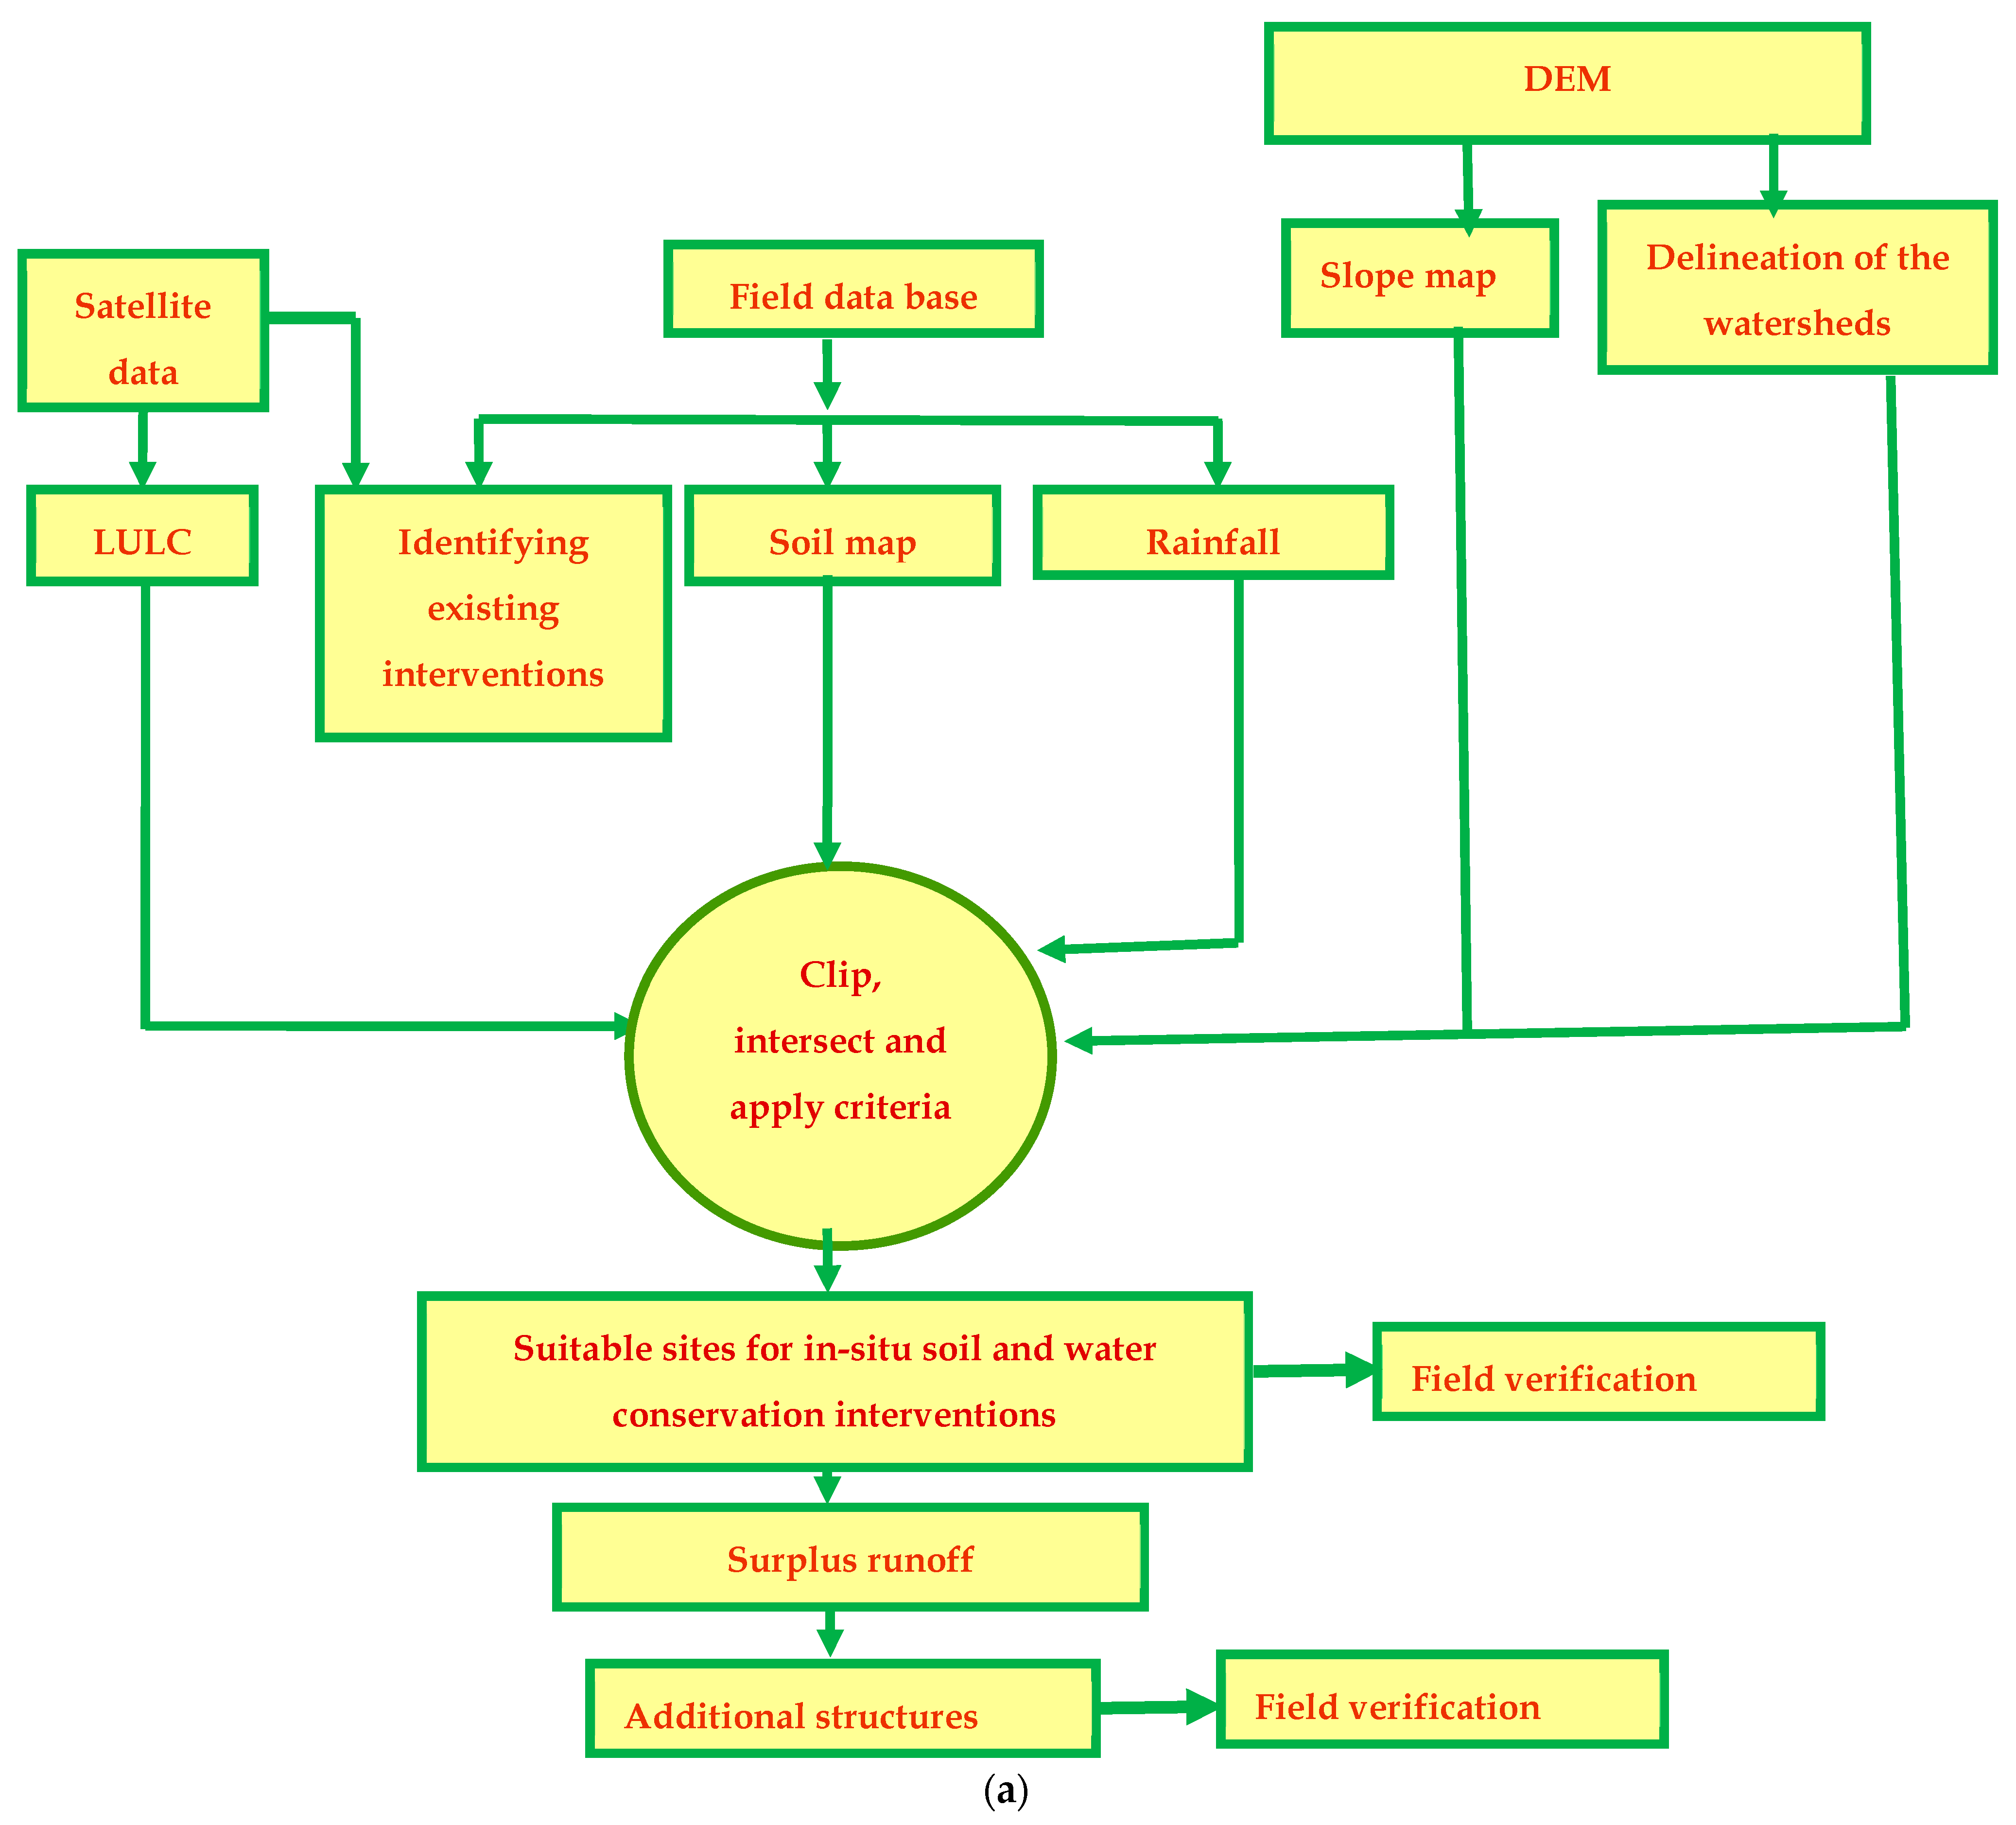
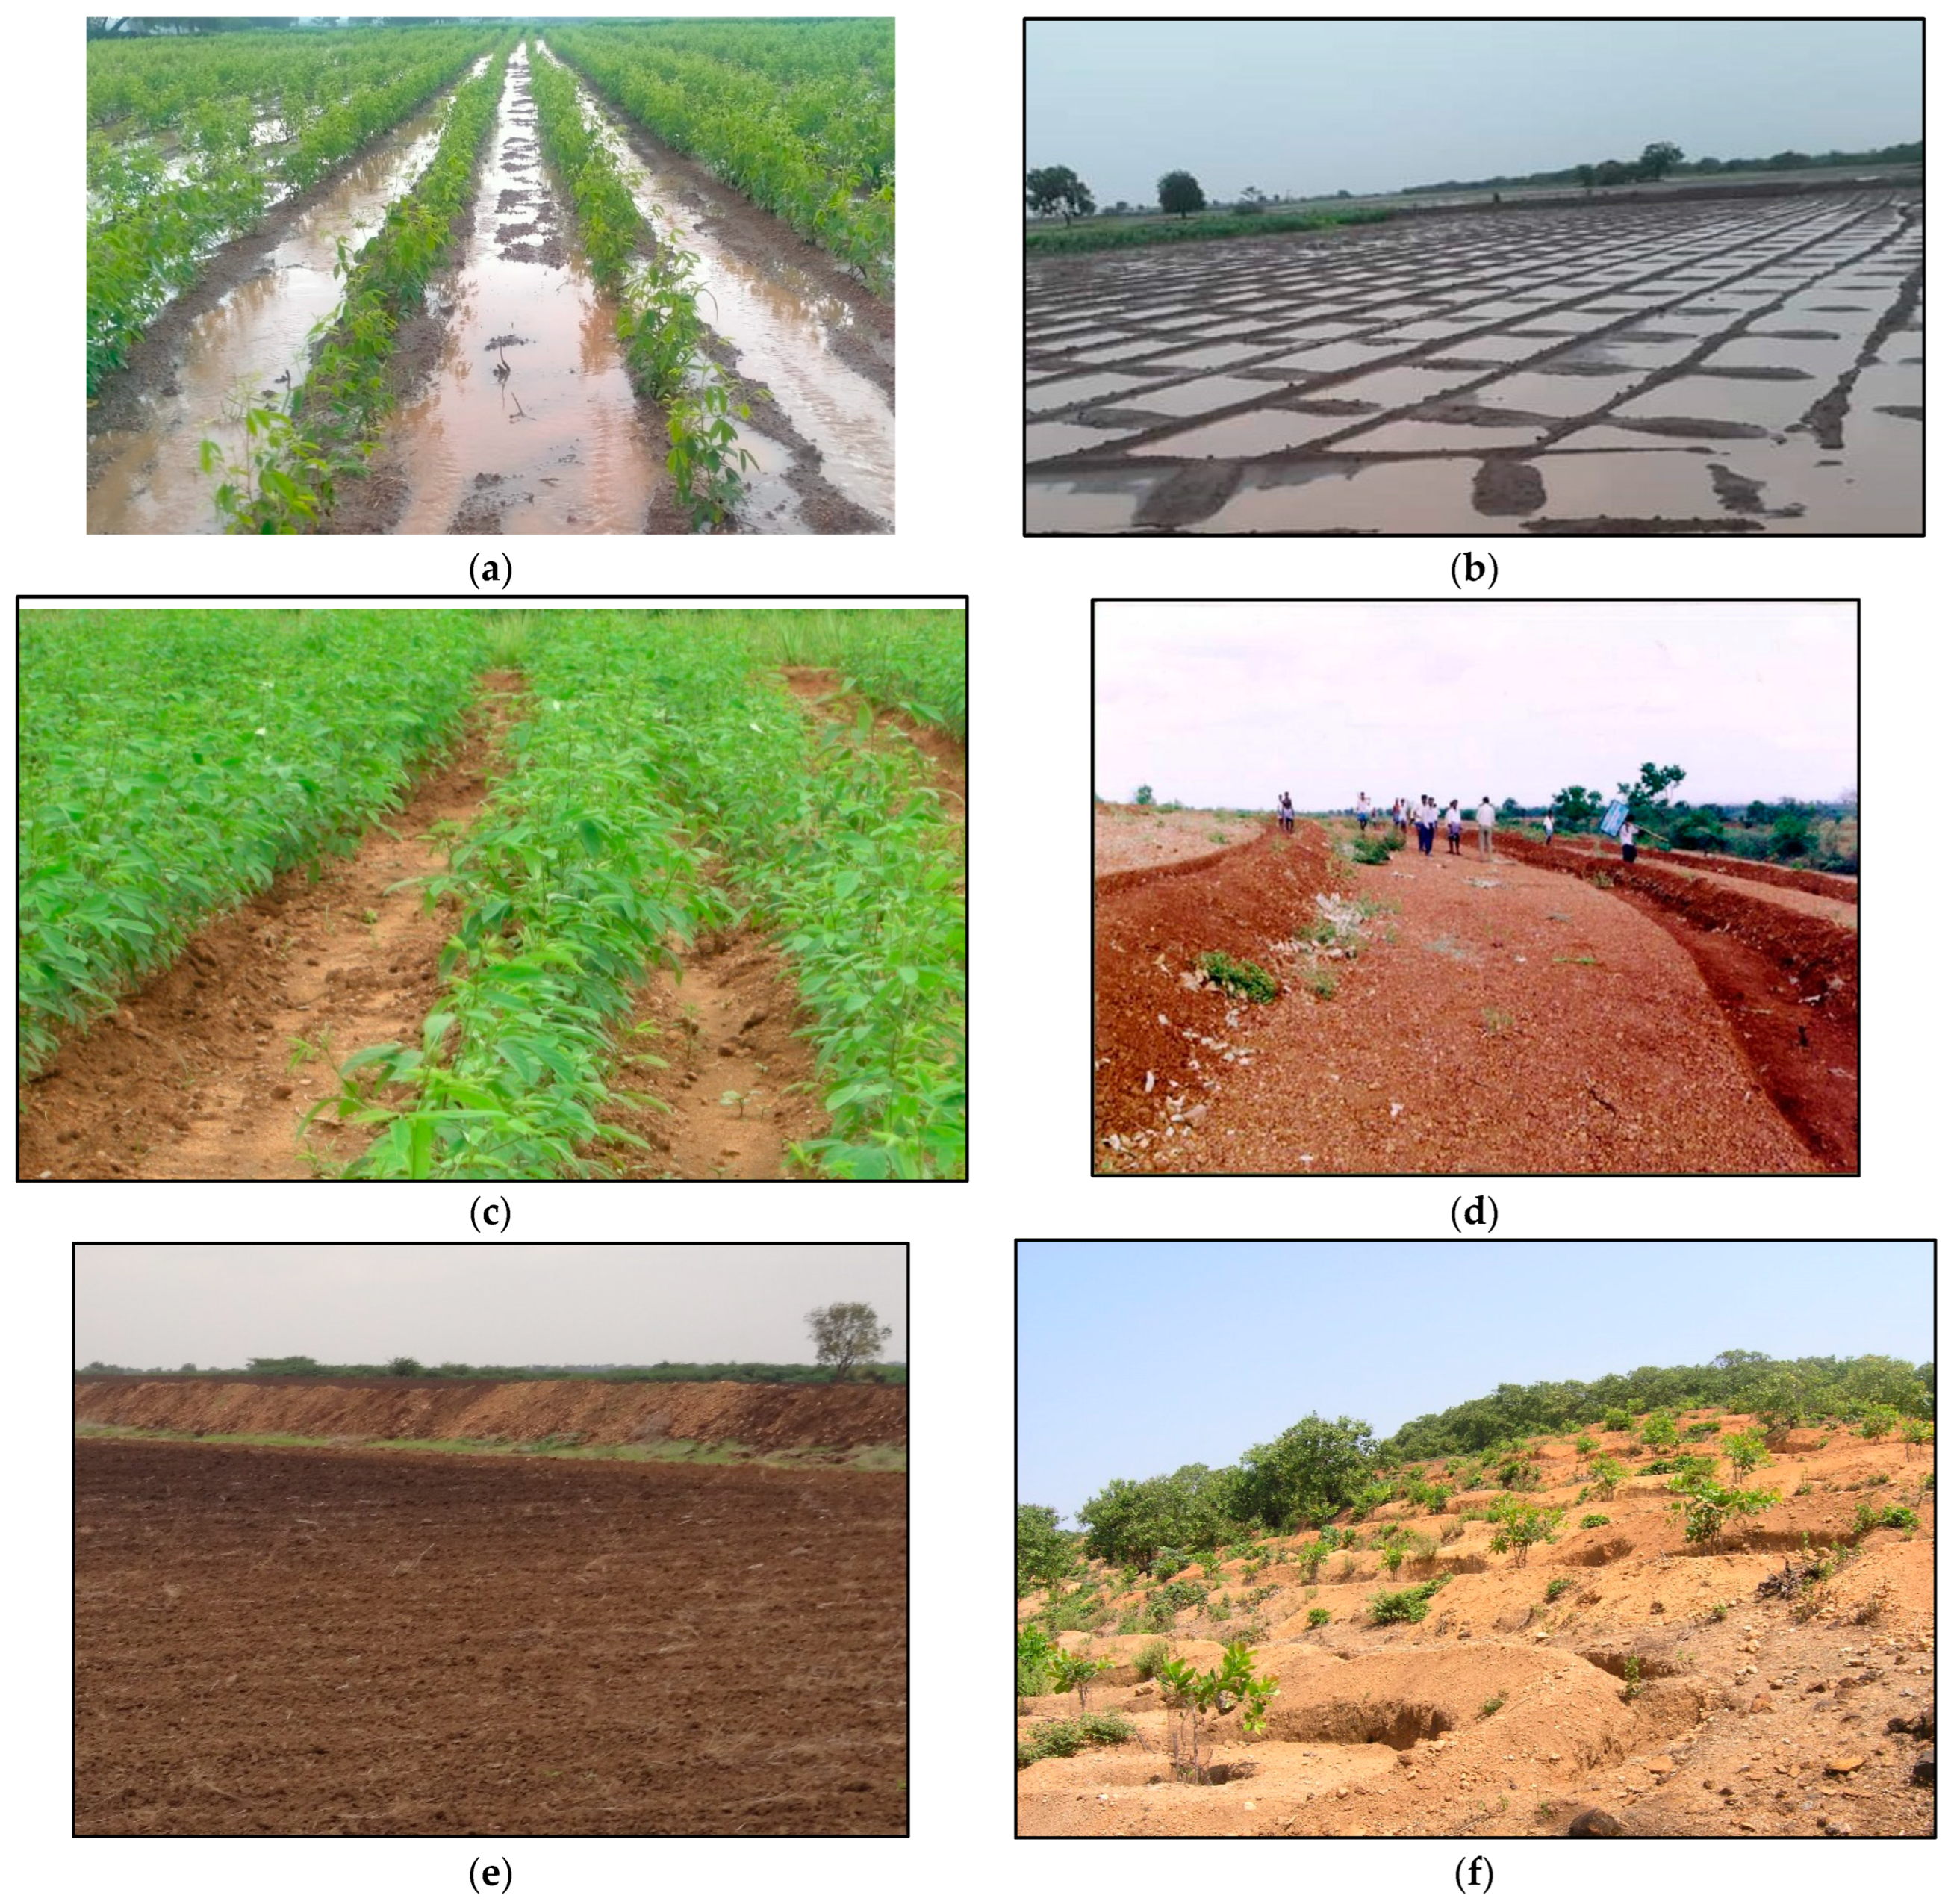
2.4. Determination of Location-Specific Interventions

To control the soil erosion from different vulnerable districts in the selected area, suitable sites for various soil and water conservation interventions were determined using geospatial techniques [53].
Thematic layers of slope, soil, rainfall, runoff potential, and LULC were intersected using GIS, and the criteria corresponding to selected interventions were used in GIS for finding the potential locations for various in situ interventions such as conservation furrow, adjusted contour/graded bunds, compartmental bunding, contour cultivation, small pits, broad bed furrow (BBF), ridge and furrow, and semi-circular bunds (Figure 3a and Table 1). Similarly, suitable locations for water-harvesting structures were also identified using the criteria provided in Table 2 [54] in GIS. The identified locations were exported to Google Earth and validated by recorded data, visual interpretations, as well as using ground truth.
Table 1. Criteria for planning selected in situ soil and water conservation interventions.
InterventionsSlope (%)Soil TypeRainfall (mm)Soil Depth (cm)
Ridge and furrow 2–15 (b)Loamy/loamy skeletal>350 (c) and <1000>50 (field crops)
Semi circular bunds 5–15 (b)exclude sandy soil (b)>200 and <4000 (b)100–150 (b) (tree crops)
Small pits 2–10 (b)exclude sandy soil (b)>350 and <4000>50 (b) (shrubs)
>10 0 (b) (tree crops)
Broad Bed Furrow (BBF) ≤3 (e)clayey and loamy soil>750100–150 (field crops)
Compartmental bunding ≤1 (e)clayey soil (e)>400 and < 750>50 (e) (field crops)
Conservation furrow ≤10 (c)exclude sandy soil (b)≤1500<100 (field crops)
Contour/graded bunds 1–6 (a)exclude deep clayey soil (a)>200 and <600 (c)<100 (c) (field and tree crops)
Contour cultivation ≤5 (d)exclude sandy soil>350 and <4000>100 (d) (field and tree crops)
Note(s): Source: Rejani et al. [53]; Rejani et al. [54]; a Shanwad et al. [55]; b Pauw et al. [56]; c Anschütz et al. [57]; d Kalgapurkar et al. [58]; e TNAU [59]; Rejani et al. [60].

3. Results

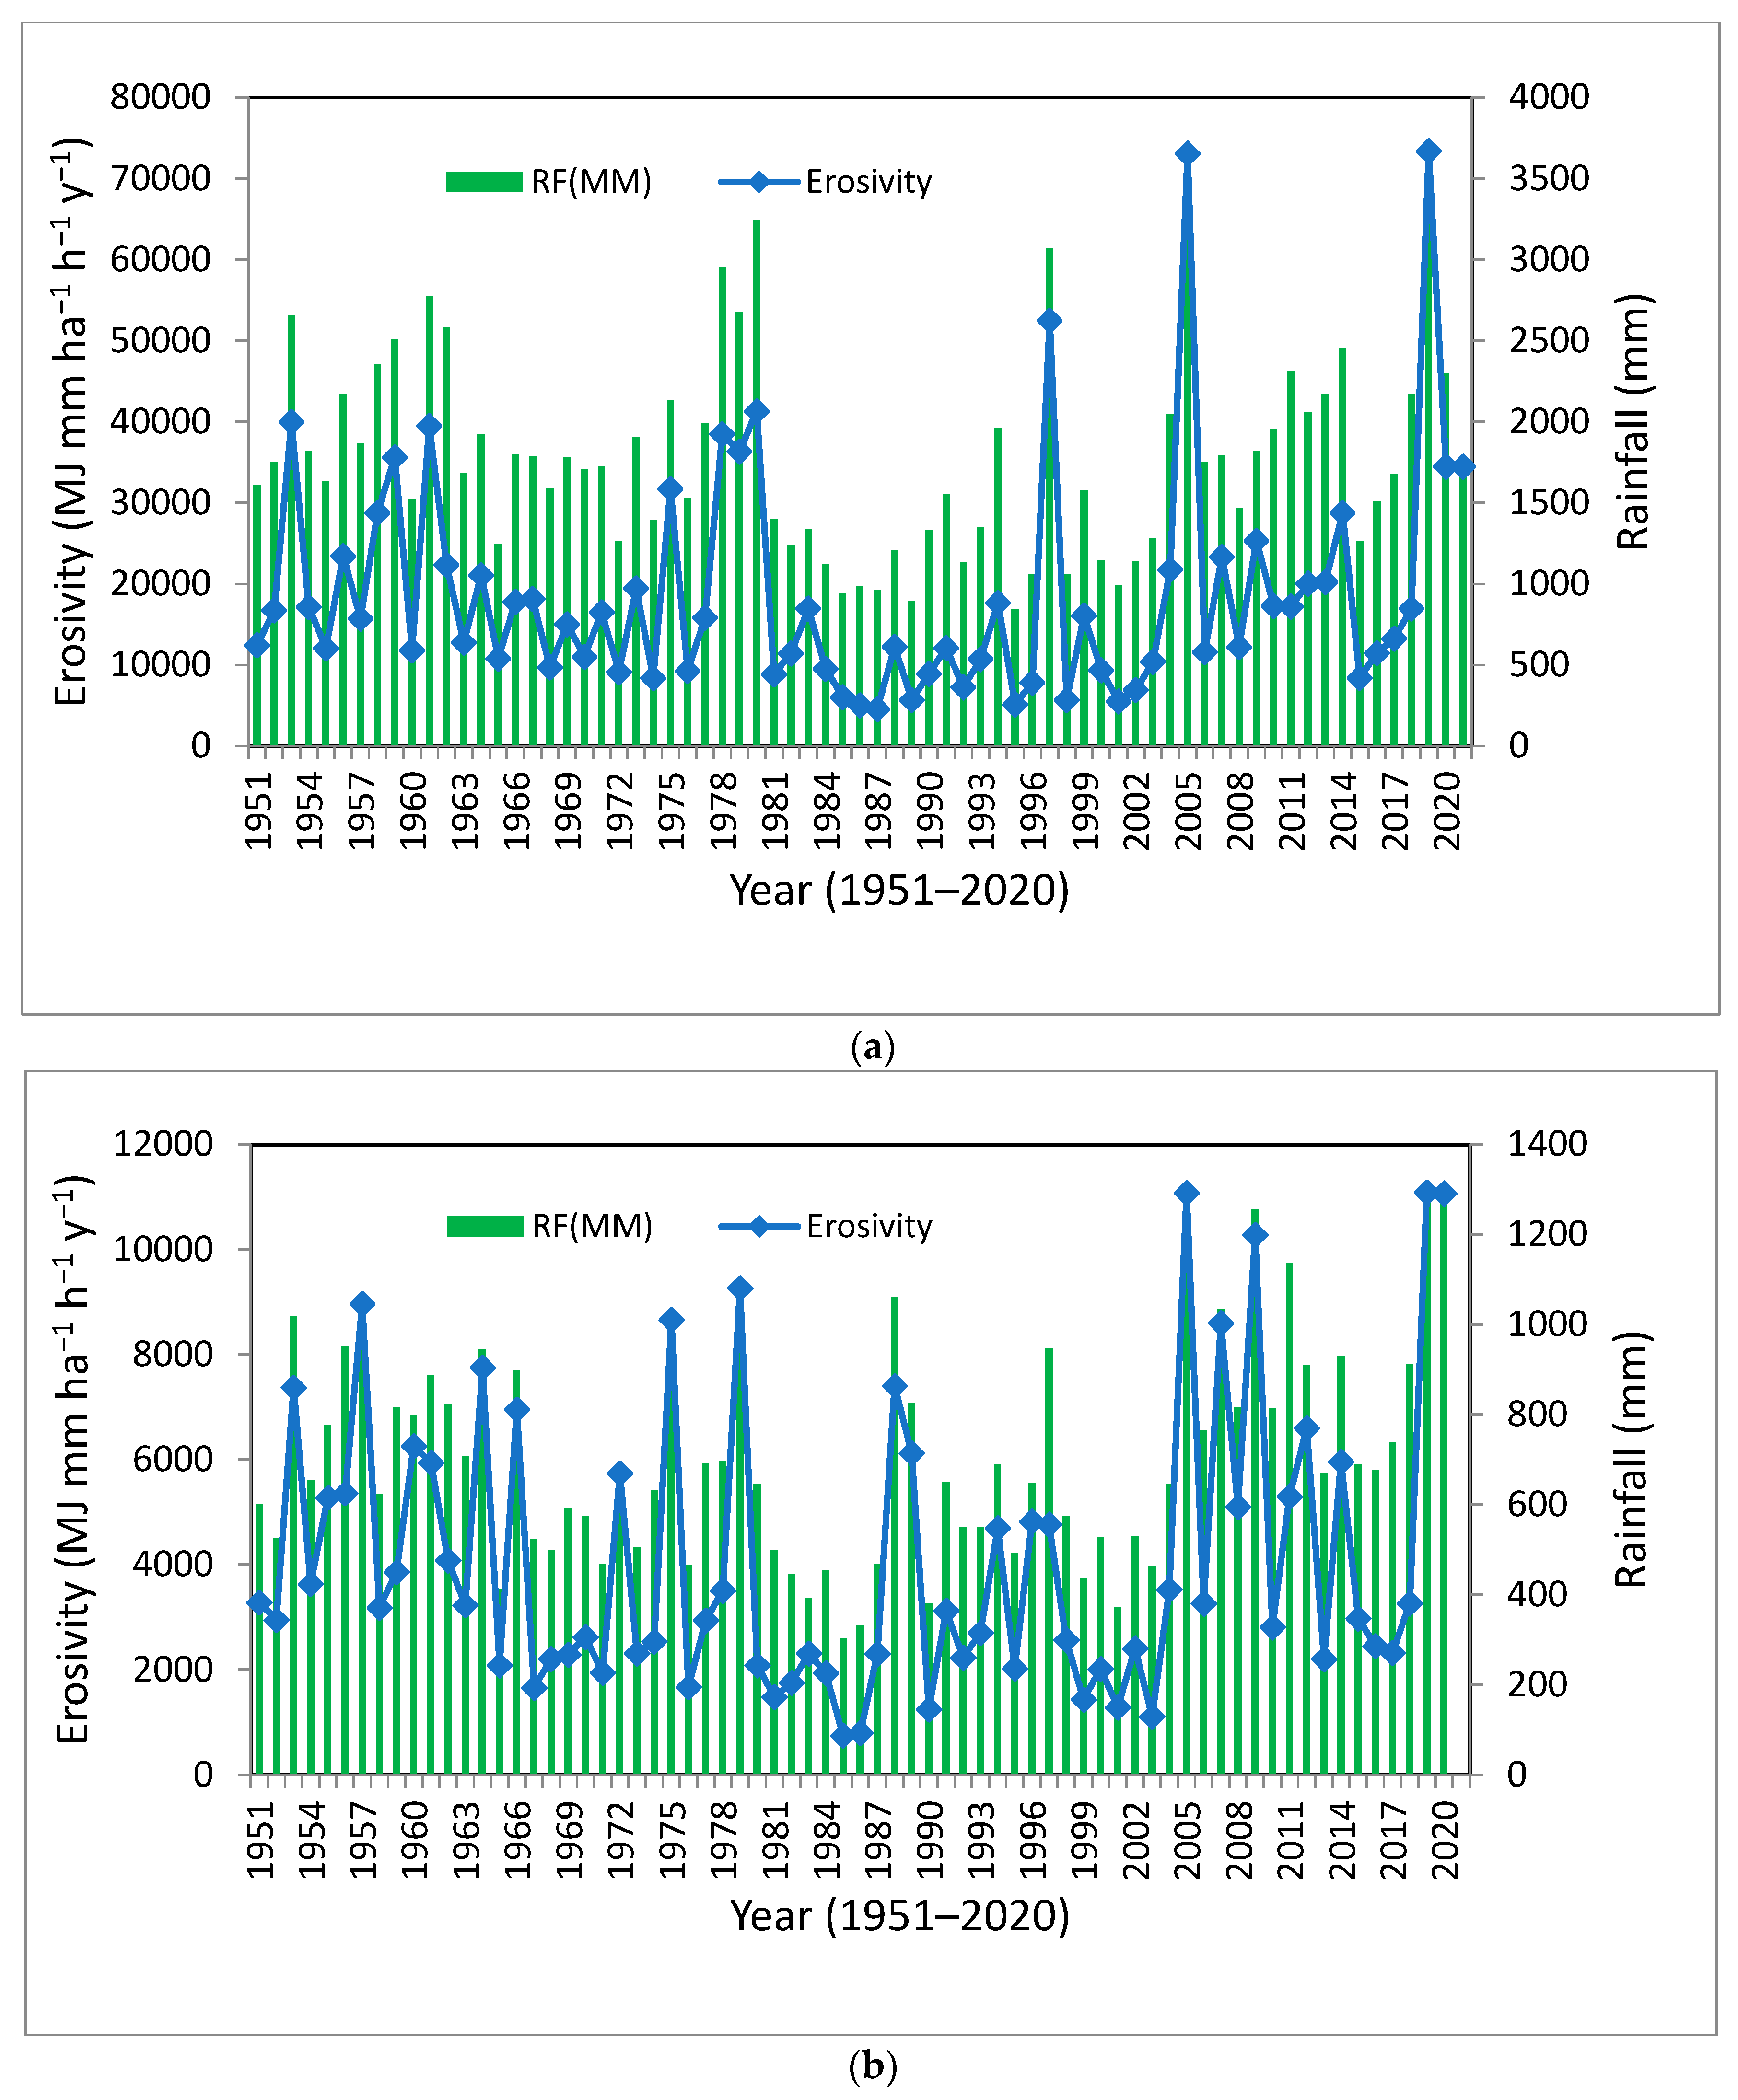
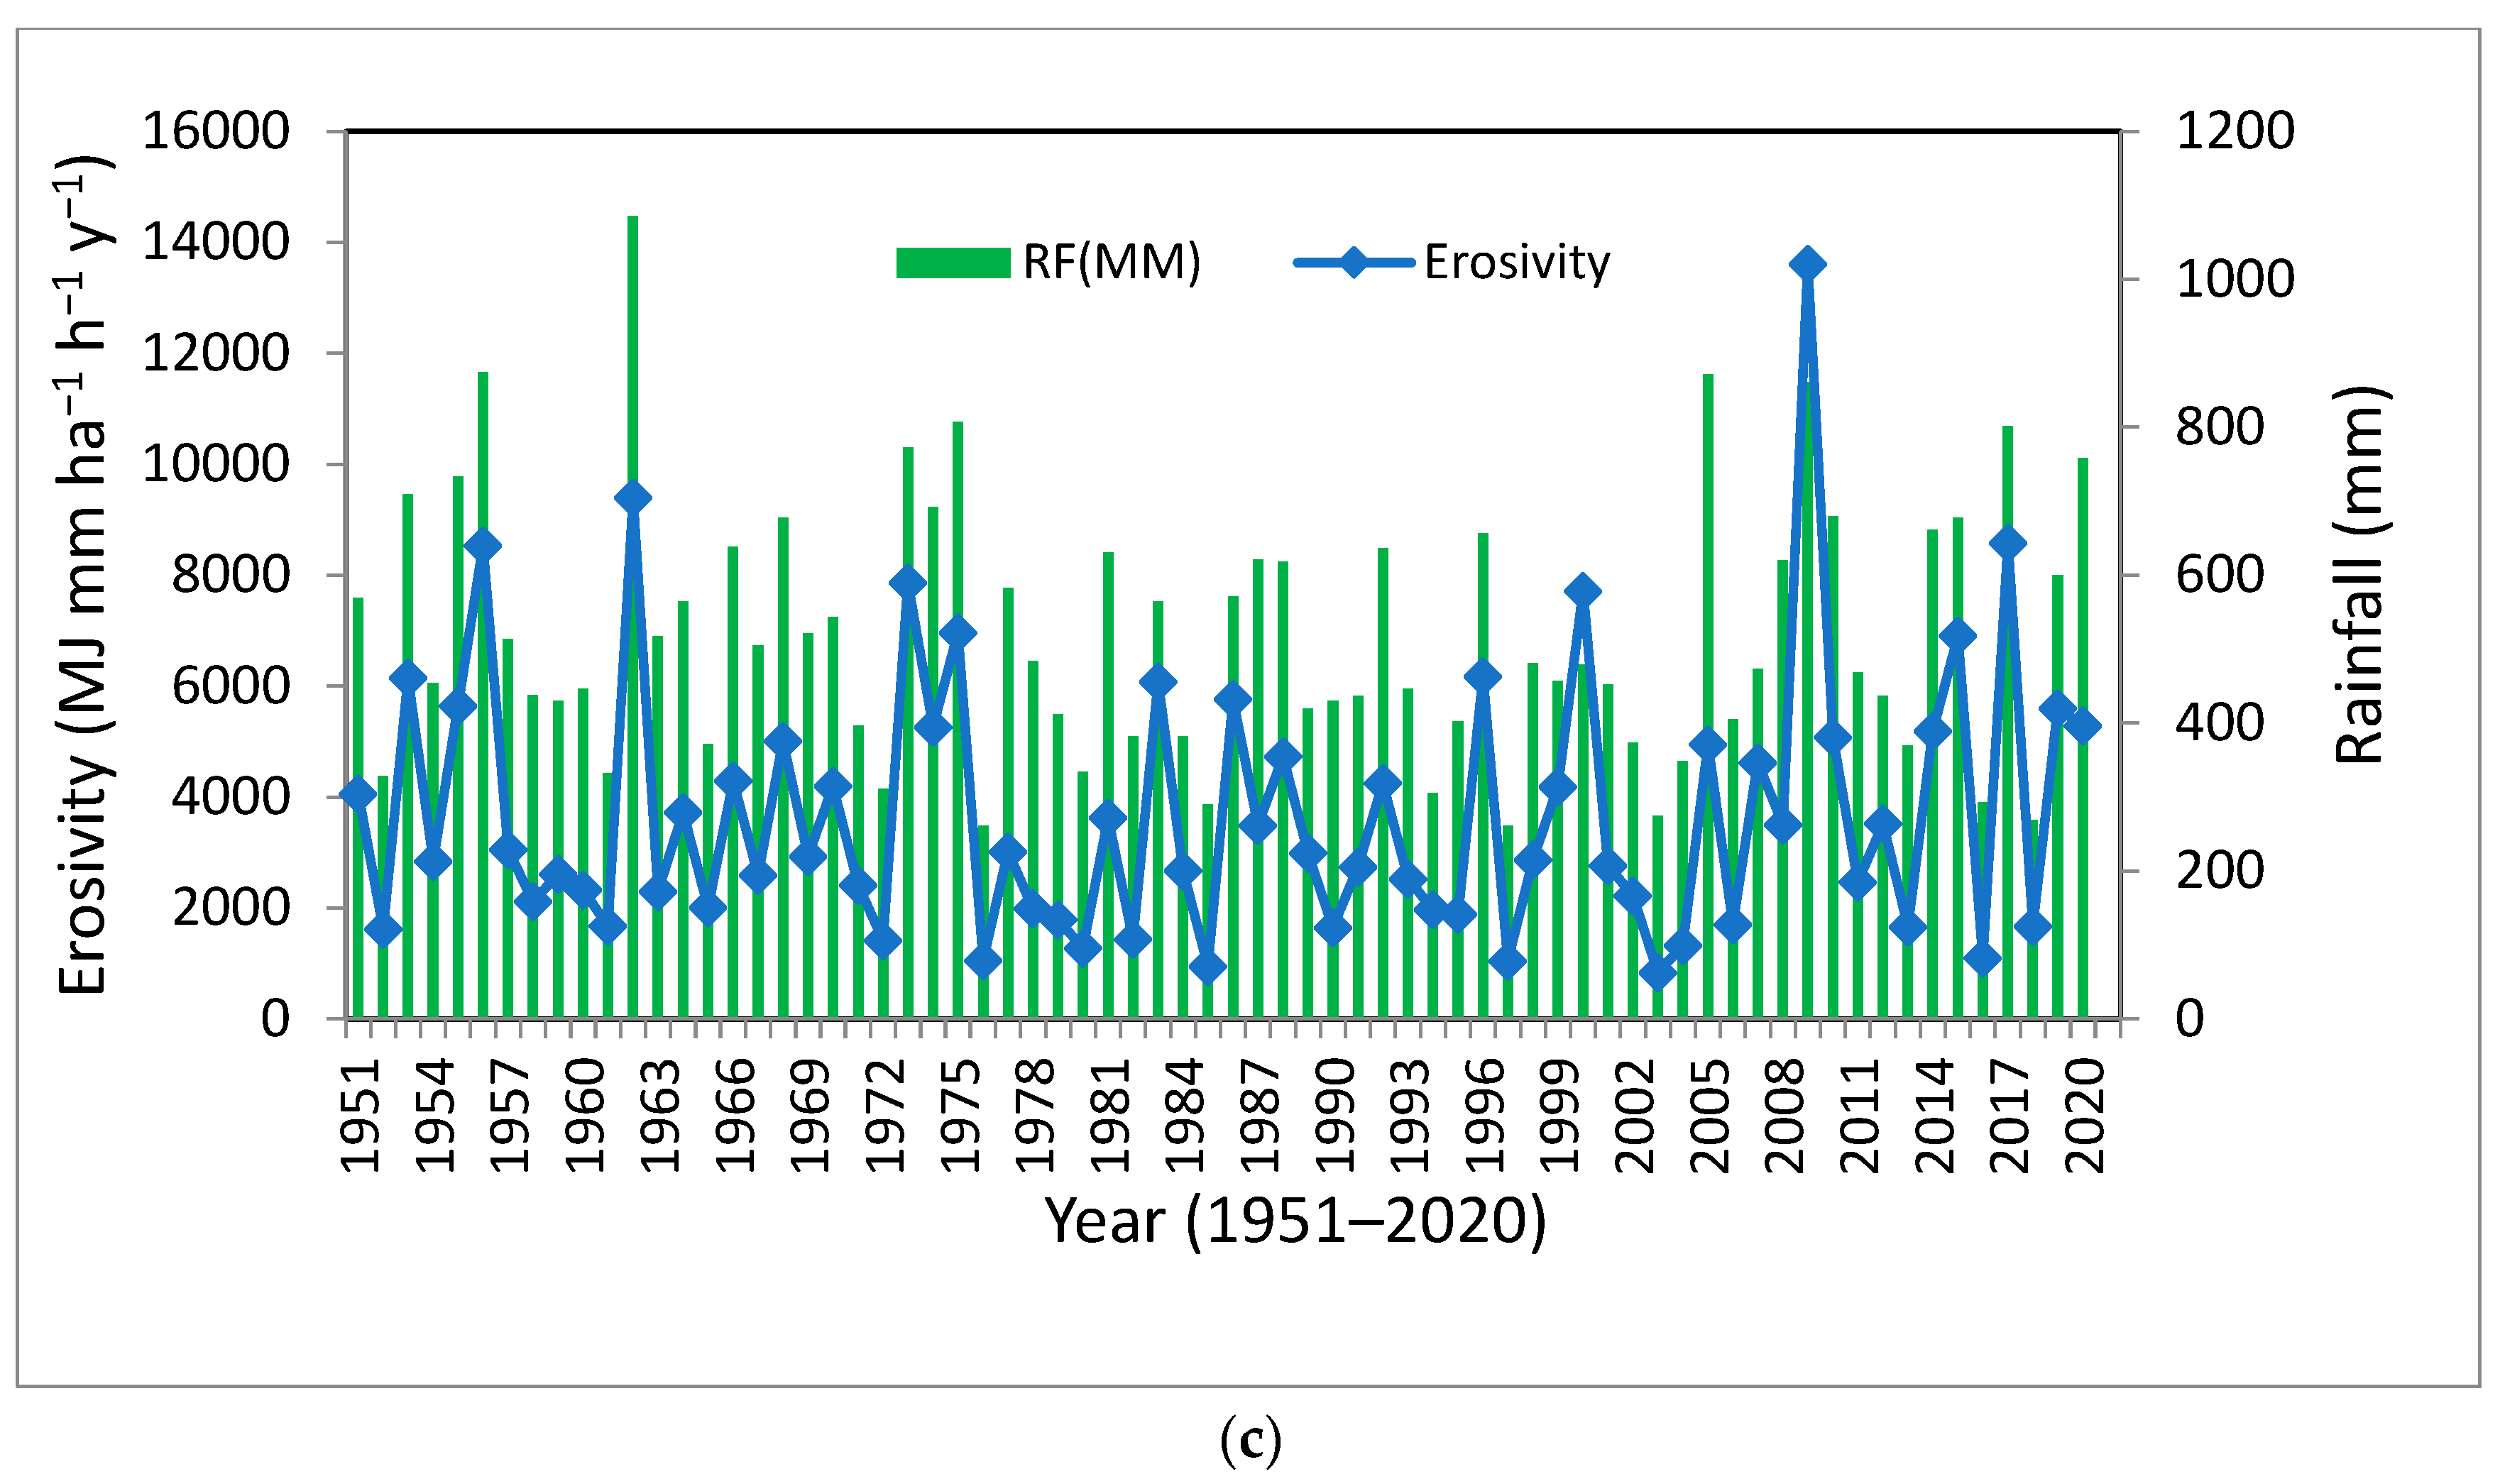
3.1. Rainfall, Erosivity, and Soil Loss in Northern Dry Zone of Karnataka

Rainfall and erosivity maps were generated from 148 grids of rainfall data (IMD) for 70 years from 1951 to 2020. The average annual rainfall varied spatially from 420 to 3700 mm and the R factor ranged from 2606 to >15,000 MJ mm ha−1 h−1 year−1 in the northern dry zone of Karnataka (Figure 3b,c). The years were classified into above normal, normal, and dry years based on rainfall and the corresponding C factor was used (Figure 3d). Soil loss was estimated spatially using RUSLE and GIS. The observed soil loss data for the period 2011 to 2015 were used for validation of the model (Figure 1c). A linear regression analysis of the measured and estimated soil loss was carried out and an R2 value of 0.89 was obtained, which shows a good match between the observed and simulated values (Figure 4a). Hence, this model could be successfully used for estimating the soil loss. The mean annual soil loss estimated varied from <2.5 t ha−1 y−1 to >15.0 t ha−1 y−1 and a major portion of the area (81.8%) had soil loss <10.0 t ha−1 y−1 (Figure 4b and Table 3).

3.2. Variability in Rainfall, Erosivity, and Soil Loss in Different Rainfall Regions

The temporal variability in rainfall, erosivity, and soil loss from high-, medium-, and low-rainfall areas of Belgavi district during above normal, normal, and drought years were assessed separately for the period of 1951 to 2020. In the case of high-rainfall areas, the annual rainfall for the period of 1951 to 2020 varied from 845 mm in 1995 to 3505 mm in 2019 with a mean annual value of 1783 mm. The erosivity varied from 4594 in 1987 to 73,407 in 2019 with a mean of 18,630 MJ mm ha−1 h−1 year−1 (Figure 5a). Even though rainfall was lowest in 1995, erosivity was lower in 1987 due to the low-intensity daily rainfall pattern. The topography of this region is undulating with a slope of more than 7.5% and LS factor of >2. The annual soil loss varied from 4.4 t in 1987 to 30.2 t in 2019 with a mean value of 17.9 t ha−1 y−1 (Figure 6).
The medium-rainfall area had rainfall ranging from 302 mm in 1985 to 1288 mm in 2019 with a mean annual rainfall of 742 mm. Similarly, the R factor varied from 746 in 1985 to 11,090 in 2019 with a mean of 5084 MJ mm ha−1 h−1 year−1 (Figure 5b). The slope was more than 5% with an LS factor of >0.5. Correspondingly, the soil loss varied from 1.1 t in 1985 to 16.3 t in 2019 with a mean value of 7.3 t ha−1 y−1 (Figure 6).
In the case low-rainfall regions, rainfall ranged from 260 mm in 1997 to 1084 mm in 1962 with a mean of 521 mm, and the erosivity factor varied from 838 in 2003 to 13,608 in 2009 with a mean R factor of 3737 MJ mm ha−1 h−1 year−1 (Figure 5c). These regions are generally flat with a slope less than 5% and an LS factor of <0.5. The annual soil loss from these low-rainfall regions was much less and varied from 0.1 t in 2003 to 1.4 t in 2009 with a mean soil loss of 0.4 t ha−1 y−1 (Figure 6). It is visible that considerable variability in rainfall, erosivity, and soil loss exists in high-, medium-, and low-rainfall regions in Belgavi district. Hence, the determination of soil loss spatially for planning and prioritizing interventions is very important for such areas.
The rainfall, erosivity, and soil loss were also analyzed separately for high-, medium-, and low-rainfall regions of Belgavi district during different rainfall years. Out of 70 years, low-rainfall regions experienced drought for 31% of the years with a rainfall of 260 to 419 mm, erosivity of 1047 to 2993 MJ mm ha−1 h−1 year−1, and soil loss of 0.1 to 0.3 t ha−1 y−1, and 39% of the years were normal with a rainfall of 430 to 618 mm, erosivity of 2608 to 4734 MJ mm ha−1 h−1 year−1, and soil loss of 0.3 to 0.5 t ha−1 y−1 (Table 4). The remaining 30% of the years were above normal with rainfall varying from 619 to 1085 mm, erosivity varying from 3504 to 9396 MJ mm ha−1 h−1 year−1, and soil loss varying from 0.37 to 0.99 t ha−1 y−1.
In medium-rainfall regions, out of 70 years, 36% of years were drought-predominant with rainfall from 302 to 574 mm, erosivity from 746 to 2563 MJ mm ha−1 h−1 year−1, and soil loss from 1.1 to 3.78 t ha−1 y−1, and 37% of the years were normal with rainfall from 594 to 826 mm, erosivity from 2290 to 6122 MJ mm ha−1 h−1 year−1, and soil loss from 3.4 to 6.5 t ha−1 y−1. The remaining 27% of the years were above normal with rainfall varying from 886 to 1288 mm, erosivity from 3267 to 11,090 MJ mm ha−1 h−1 year−1, and soil loss from 6.0 to 11.2 t ha−1 y−1 (Table 4).
In the case of high-rainfall regions, 33% of the years were drought years with rainfall varying from 846 to 1397 mm, erosivity from 5147 to 8860 MJ mm ha−1 h−1 year−1, and soil loss from 4.9 to 8.5 t ha−1 y−1, and 41% of the years were normal with rainfall varying from 1469 to 2060 mm, erosivity varying from 9290 to 25,327 MJ mm ha−1 h−1 year−1, and soil loss varying from 8.0 to 15.0 t ha−1 y−1. The remaining 26% of the years were above normal with rainfall varying from 2131 to 3505 mm, erosivity varying from 16,698 to 73,407 MJ mm ha−1 h−1 year−1, and soil loss varying from 16.3 to 30.2 t ha−1 y−1 (Table 4). The Mann–Kendall trend test and Sen’s slope showed no significant trend for rainfall, erosivity, and soil loss, but a slight increase in rainfall, erosivity, and soil loss was observed in low-, medium-, and high-rainfall regions during the 70-year period.

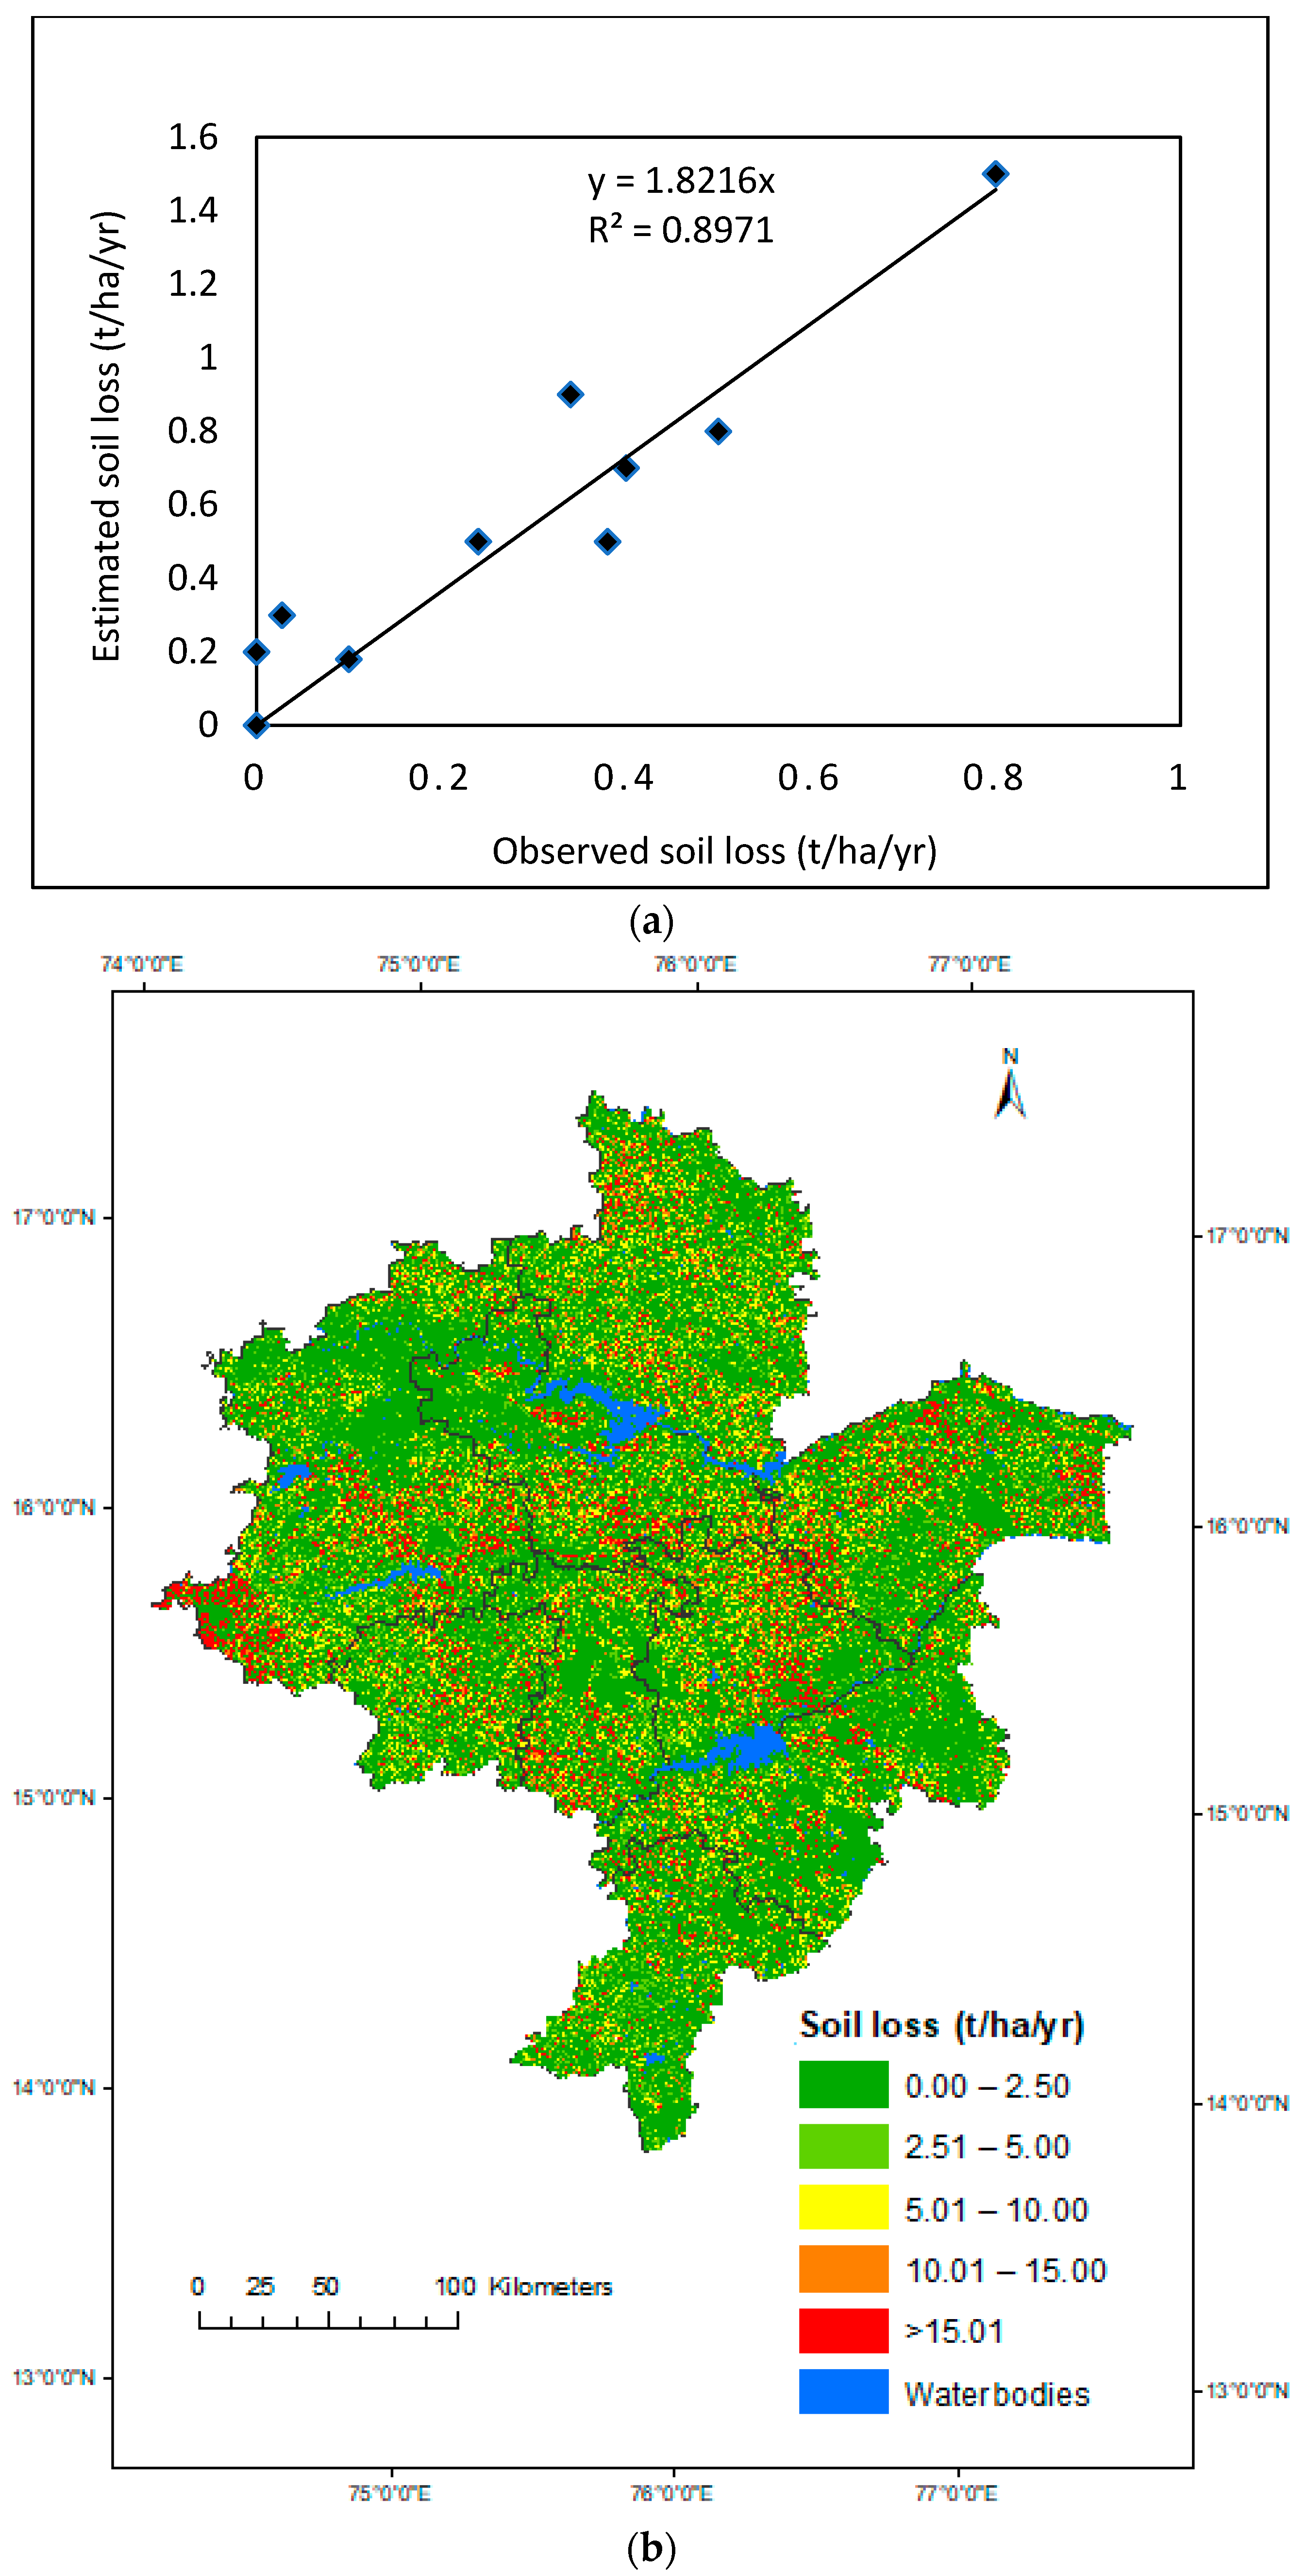
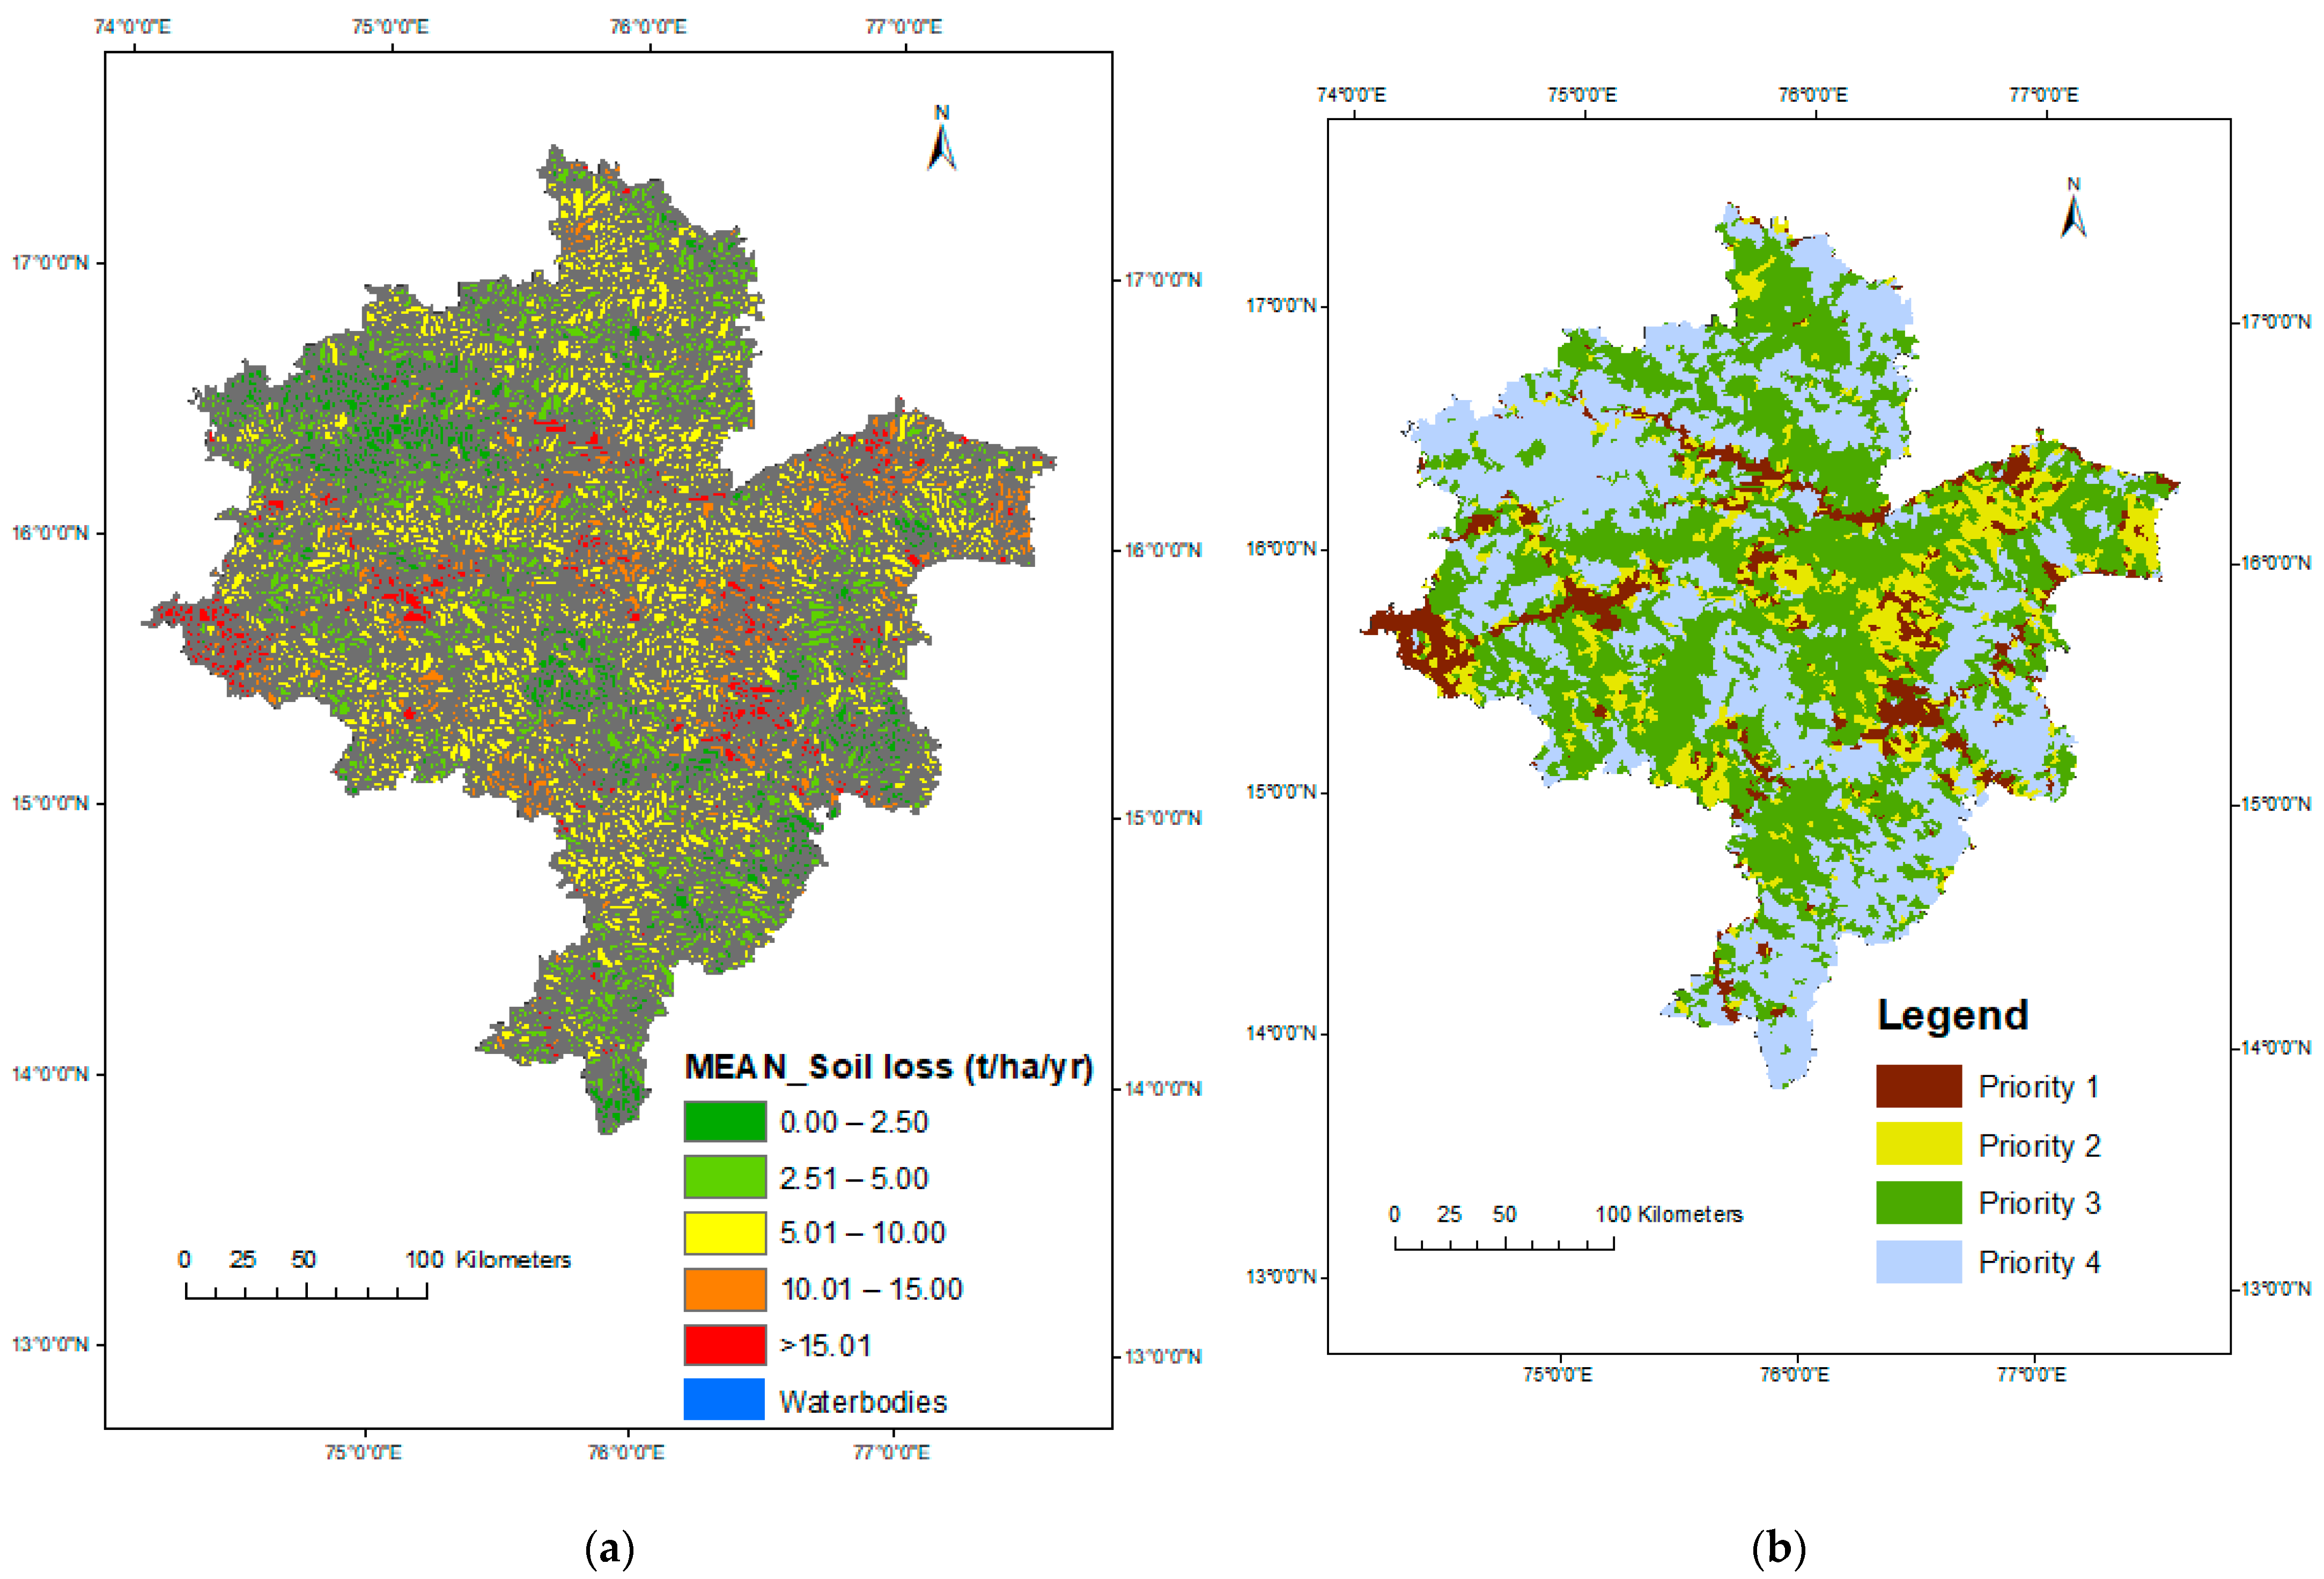
3.3. Prioritization of Vulnerable Areas

The spatial soil loss map after intersecting with the catchments in GIS was dissolved to obtain the catchment-wise soil loss. The catchments affected with more soil loss of >15.0 t ha−1 y−1 needs special priority for implementation of soil erosion control measures followed with areas with soil loss >10.0 to 15.0 t ha−1 y−1 (Figure 7a). Around 7.69% of the area with soil loss ≥15.0 t ha−1 y−1 (Priority 1) and 10.49% of the area with soil loss ranging from 10.0 to 15.0 t ha−1 y−1 (Priority 2) need top priority followed by 42.72% of the area under 5.0 to 10.0 t ha−1 y−1 category (Priority 3) (Table 3). It was found that 39.09% of the area with slight erosion with soil loss <5 t ha−1 y−1 (Figure 7b) also needs interventions for controlling erosion (Priority 4).

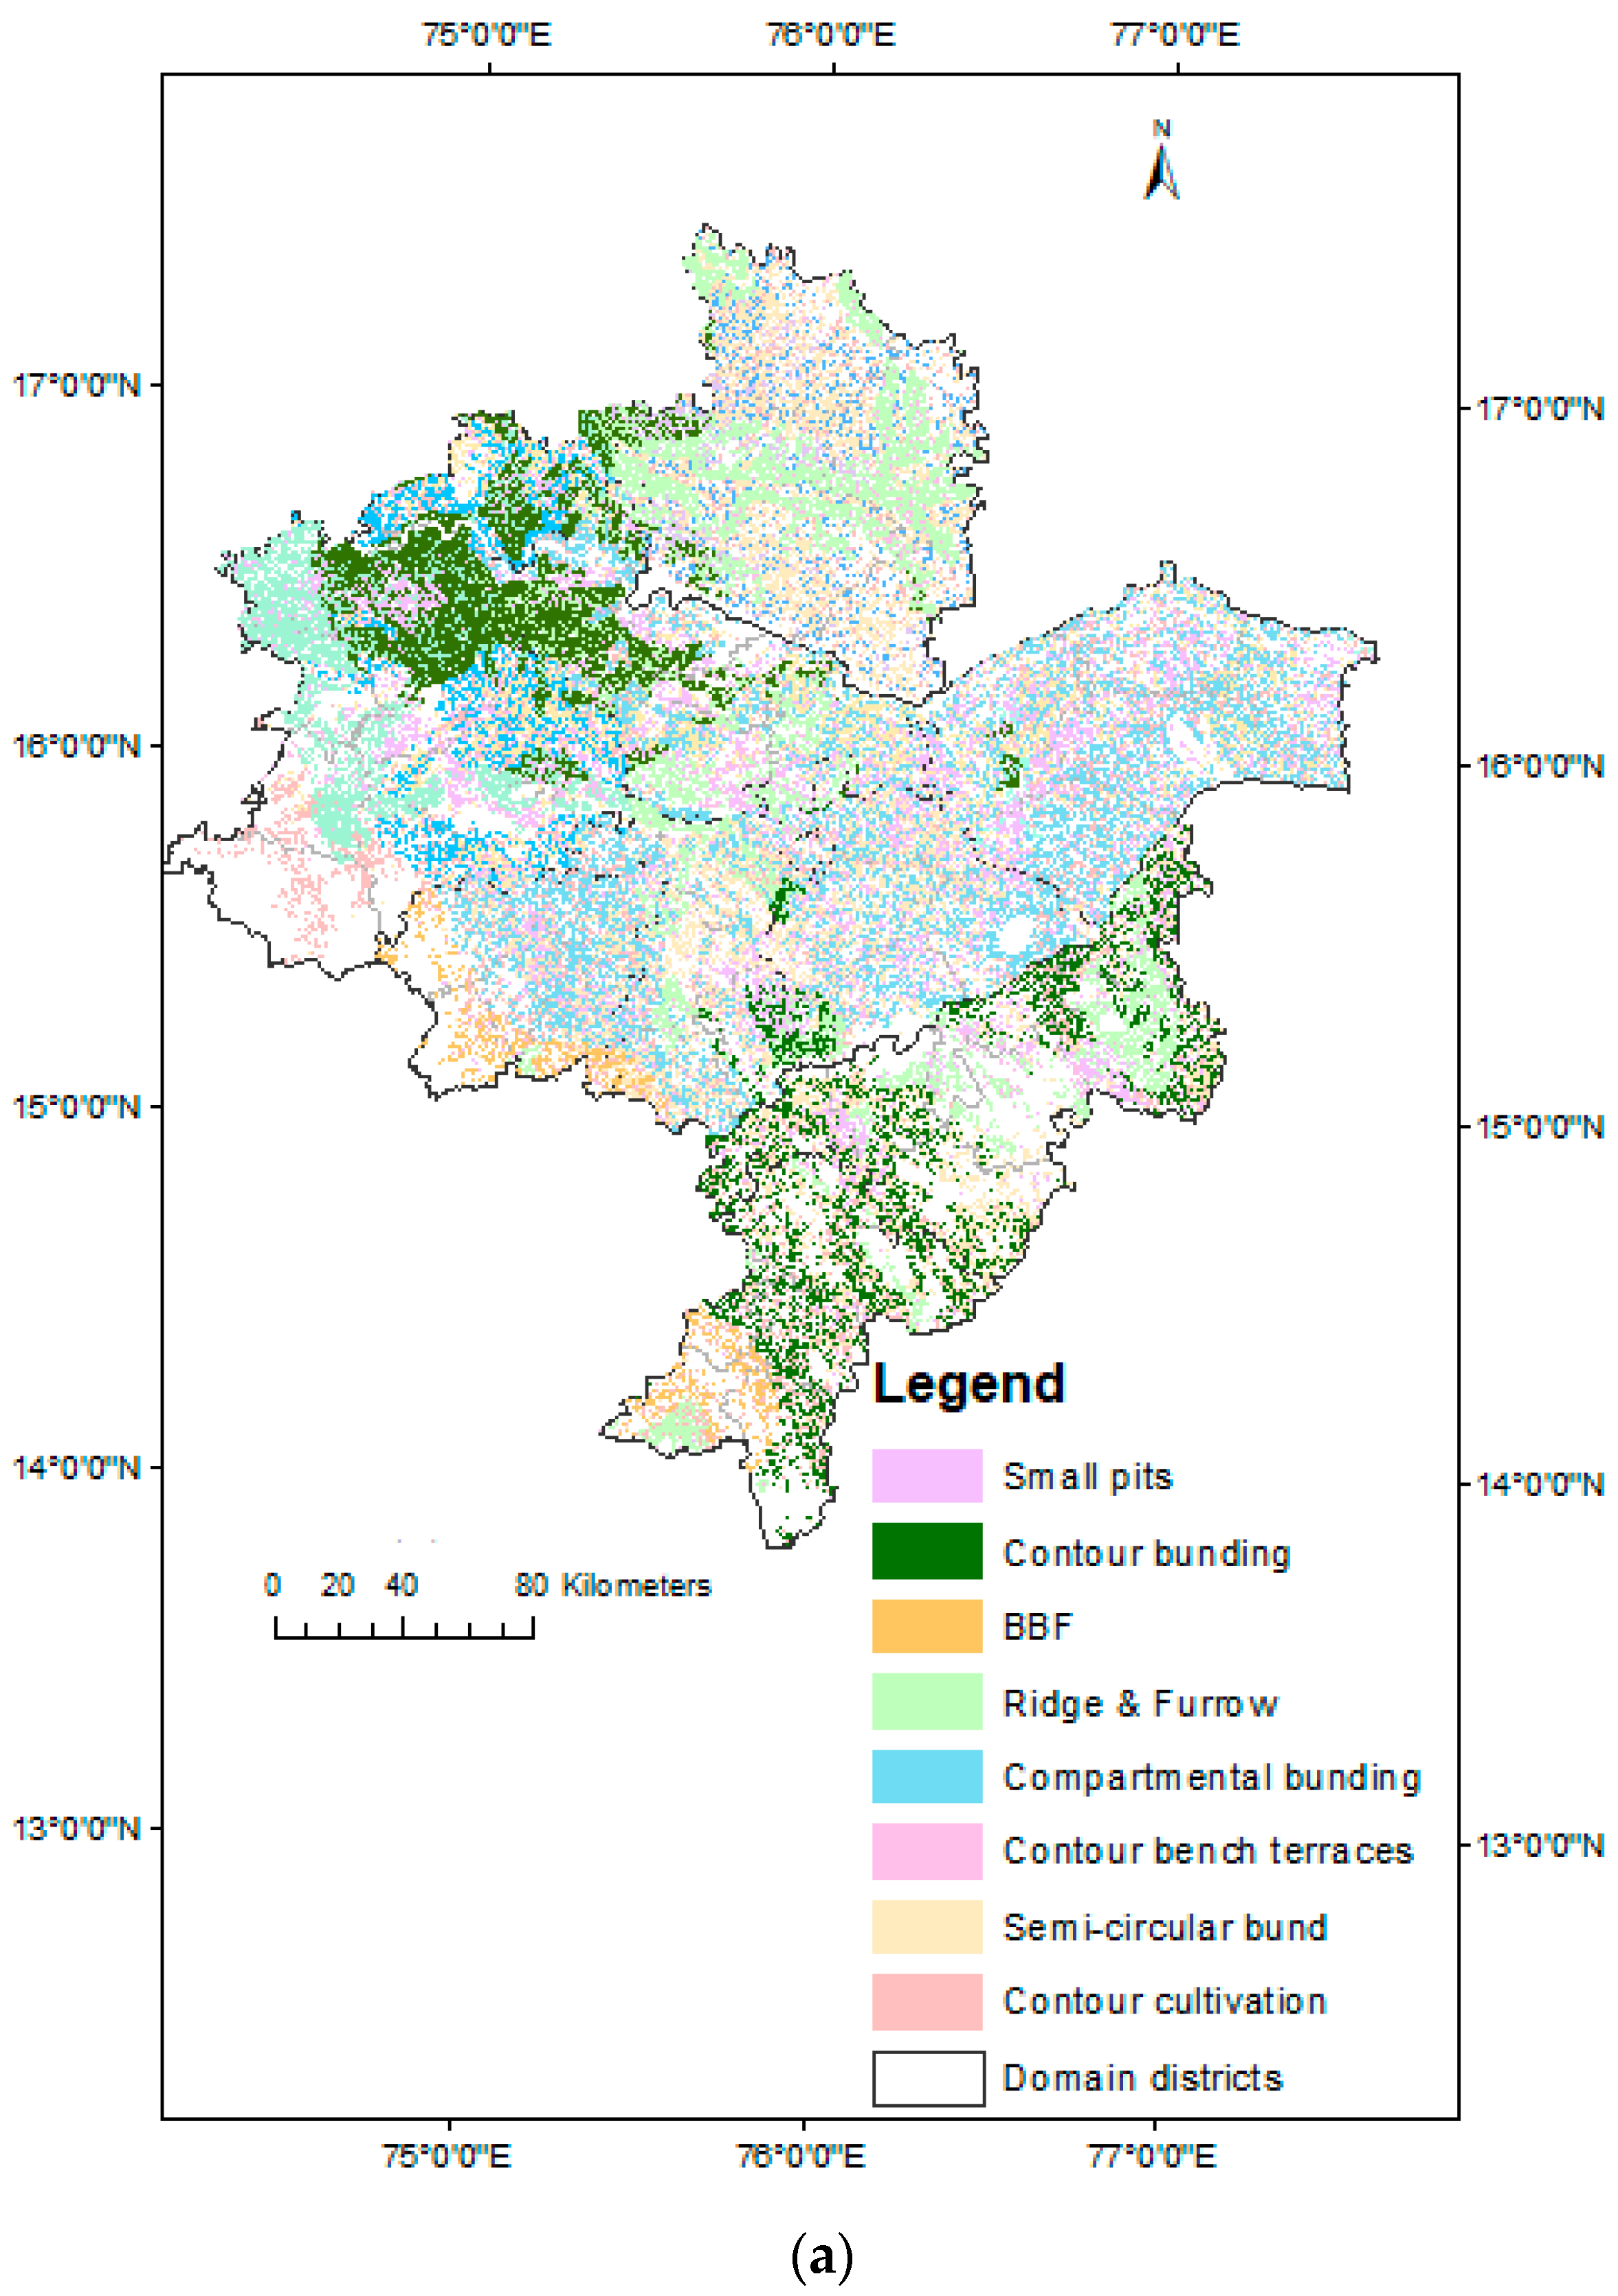
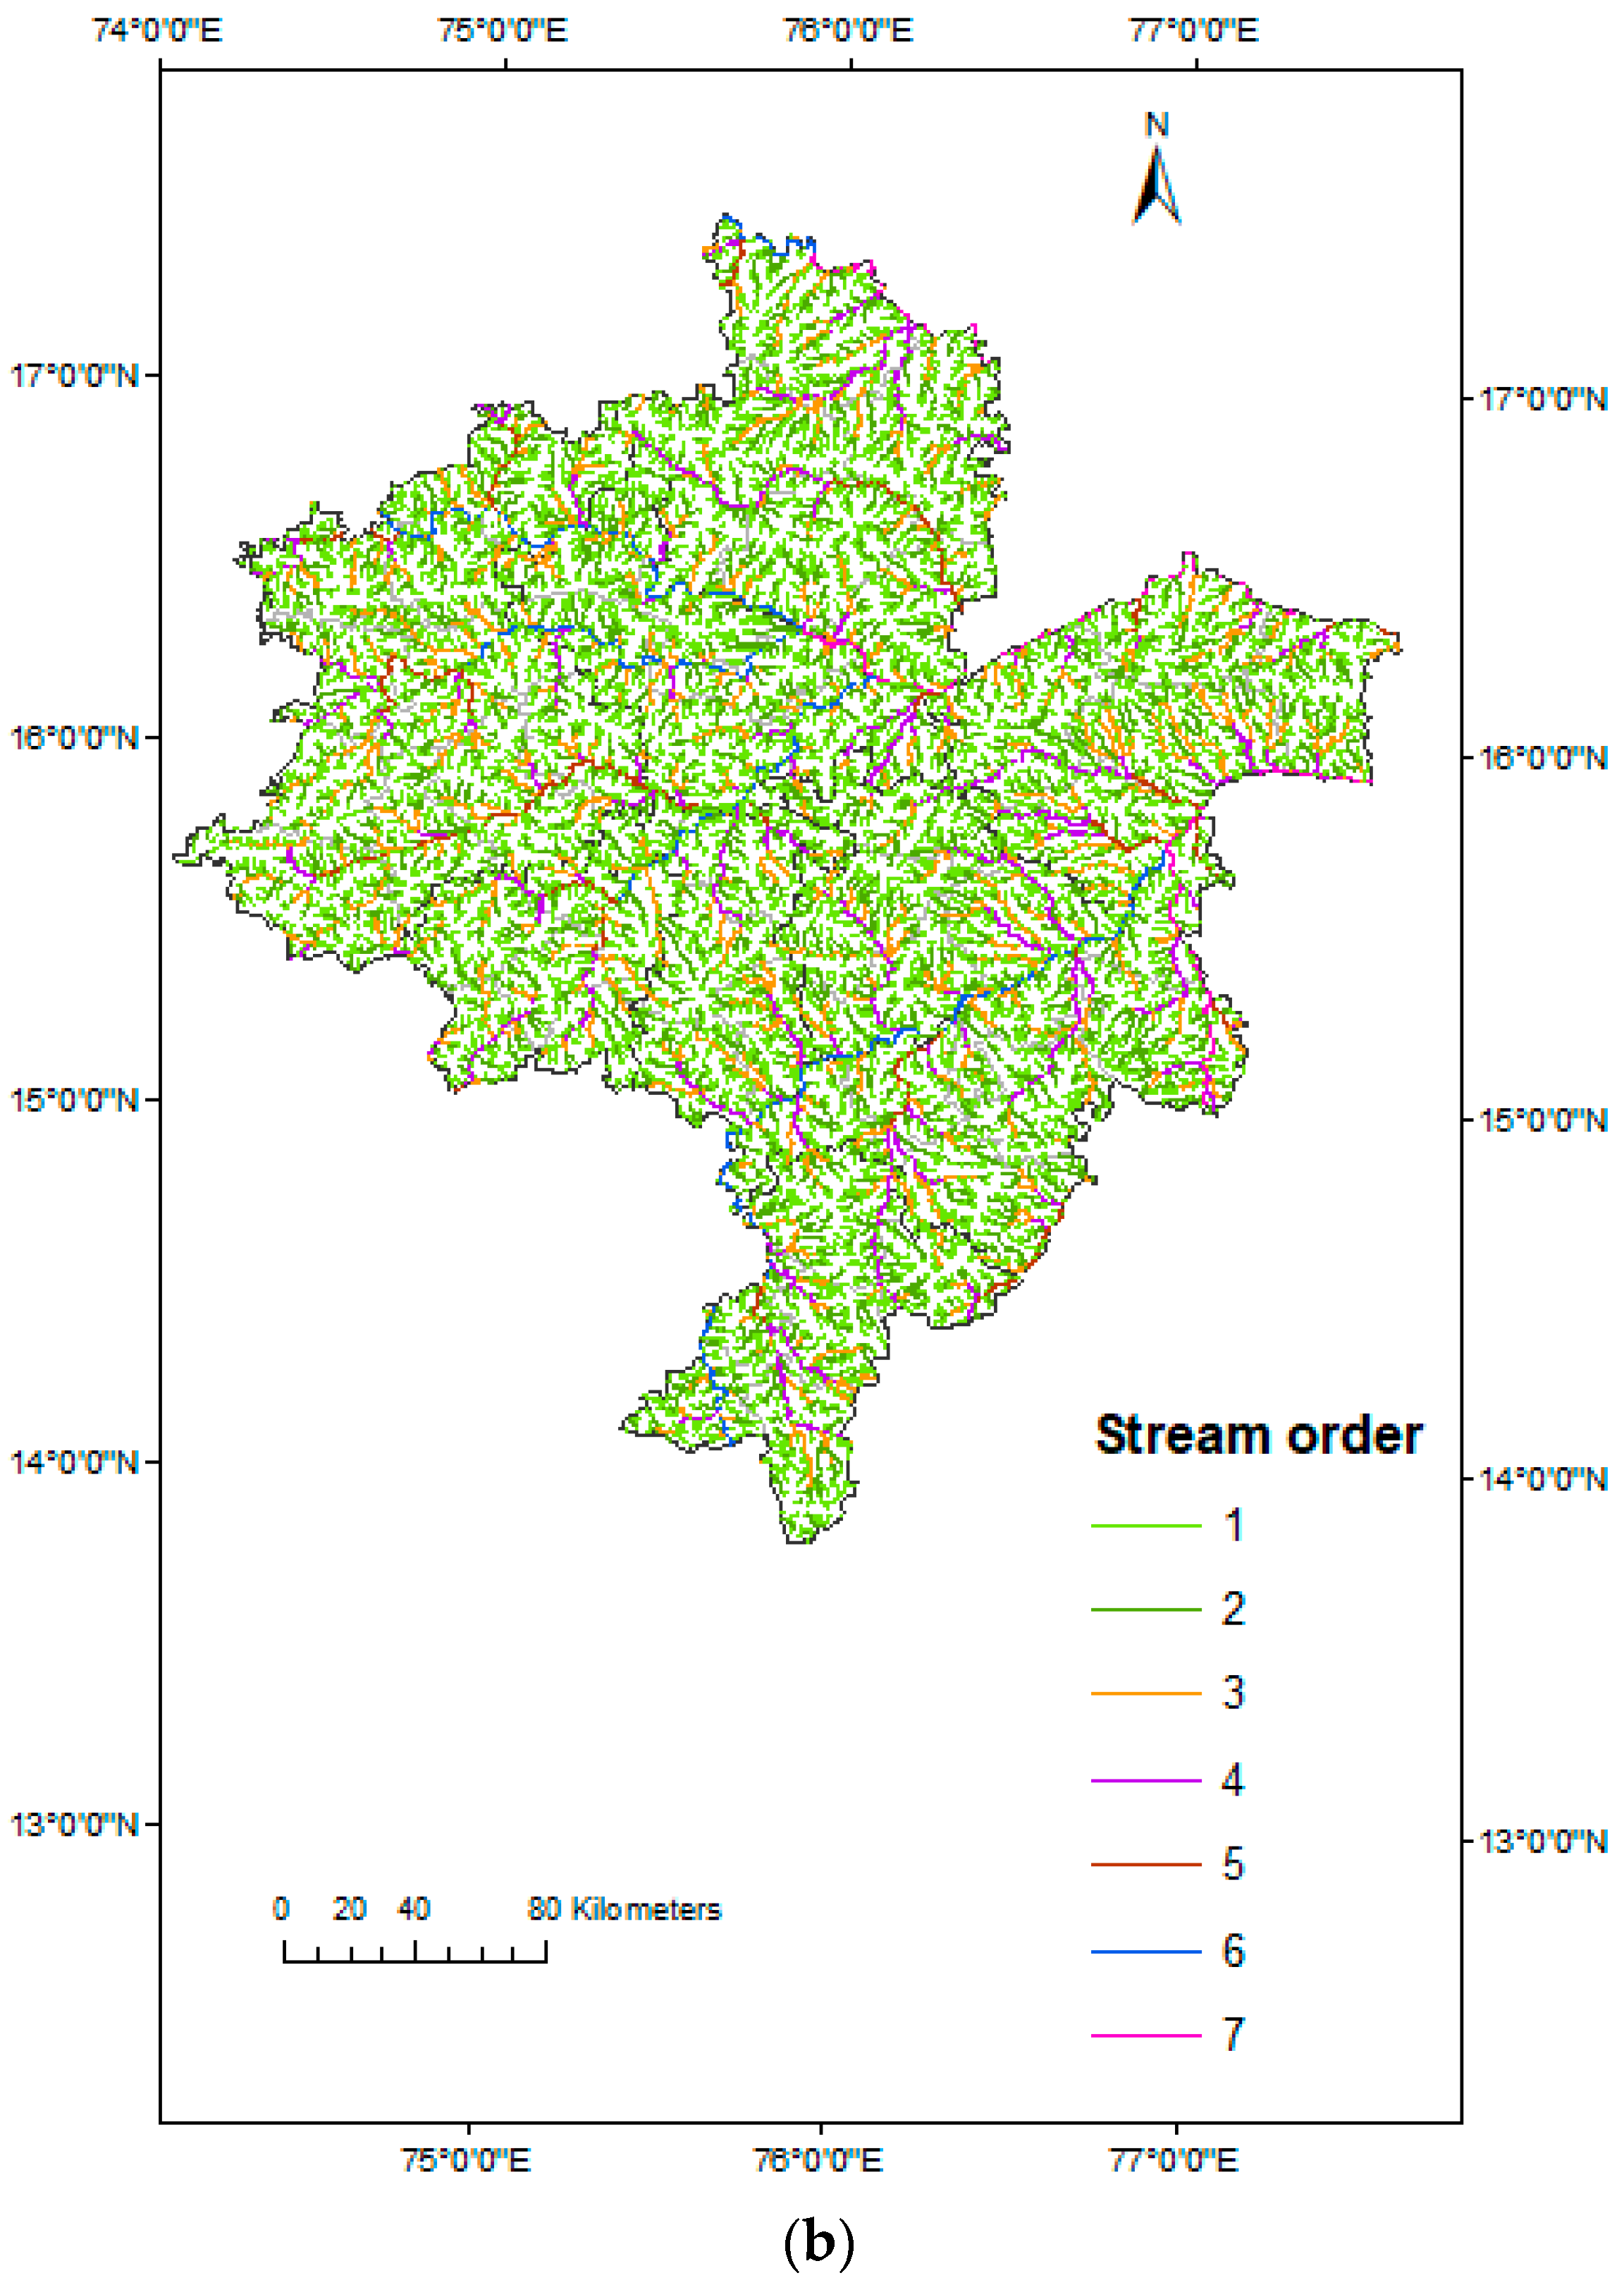
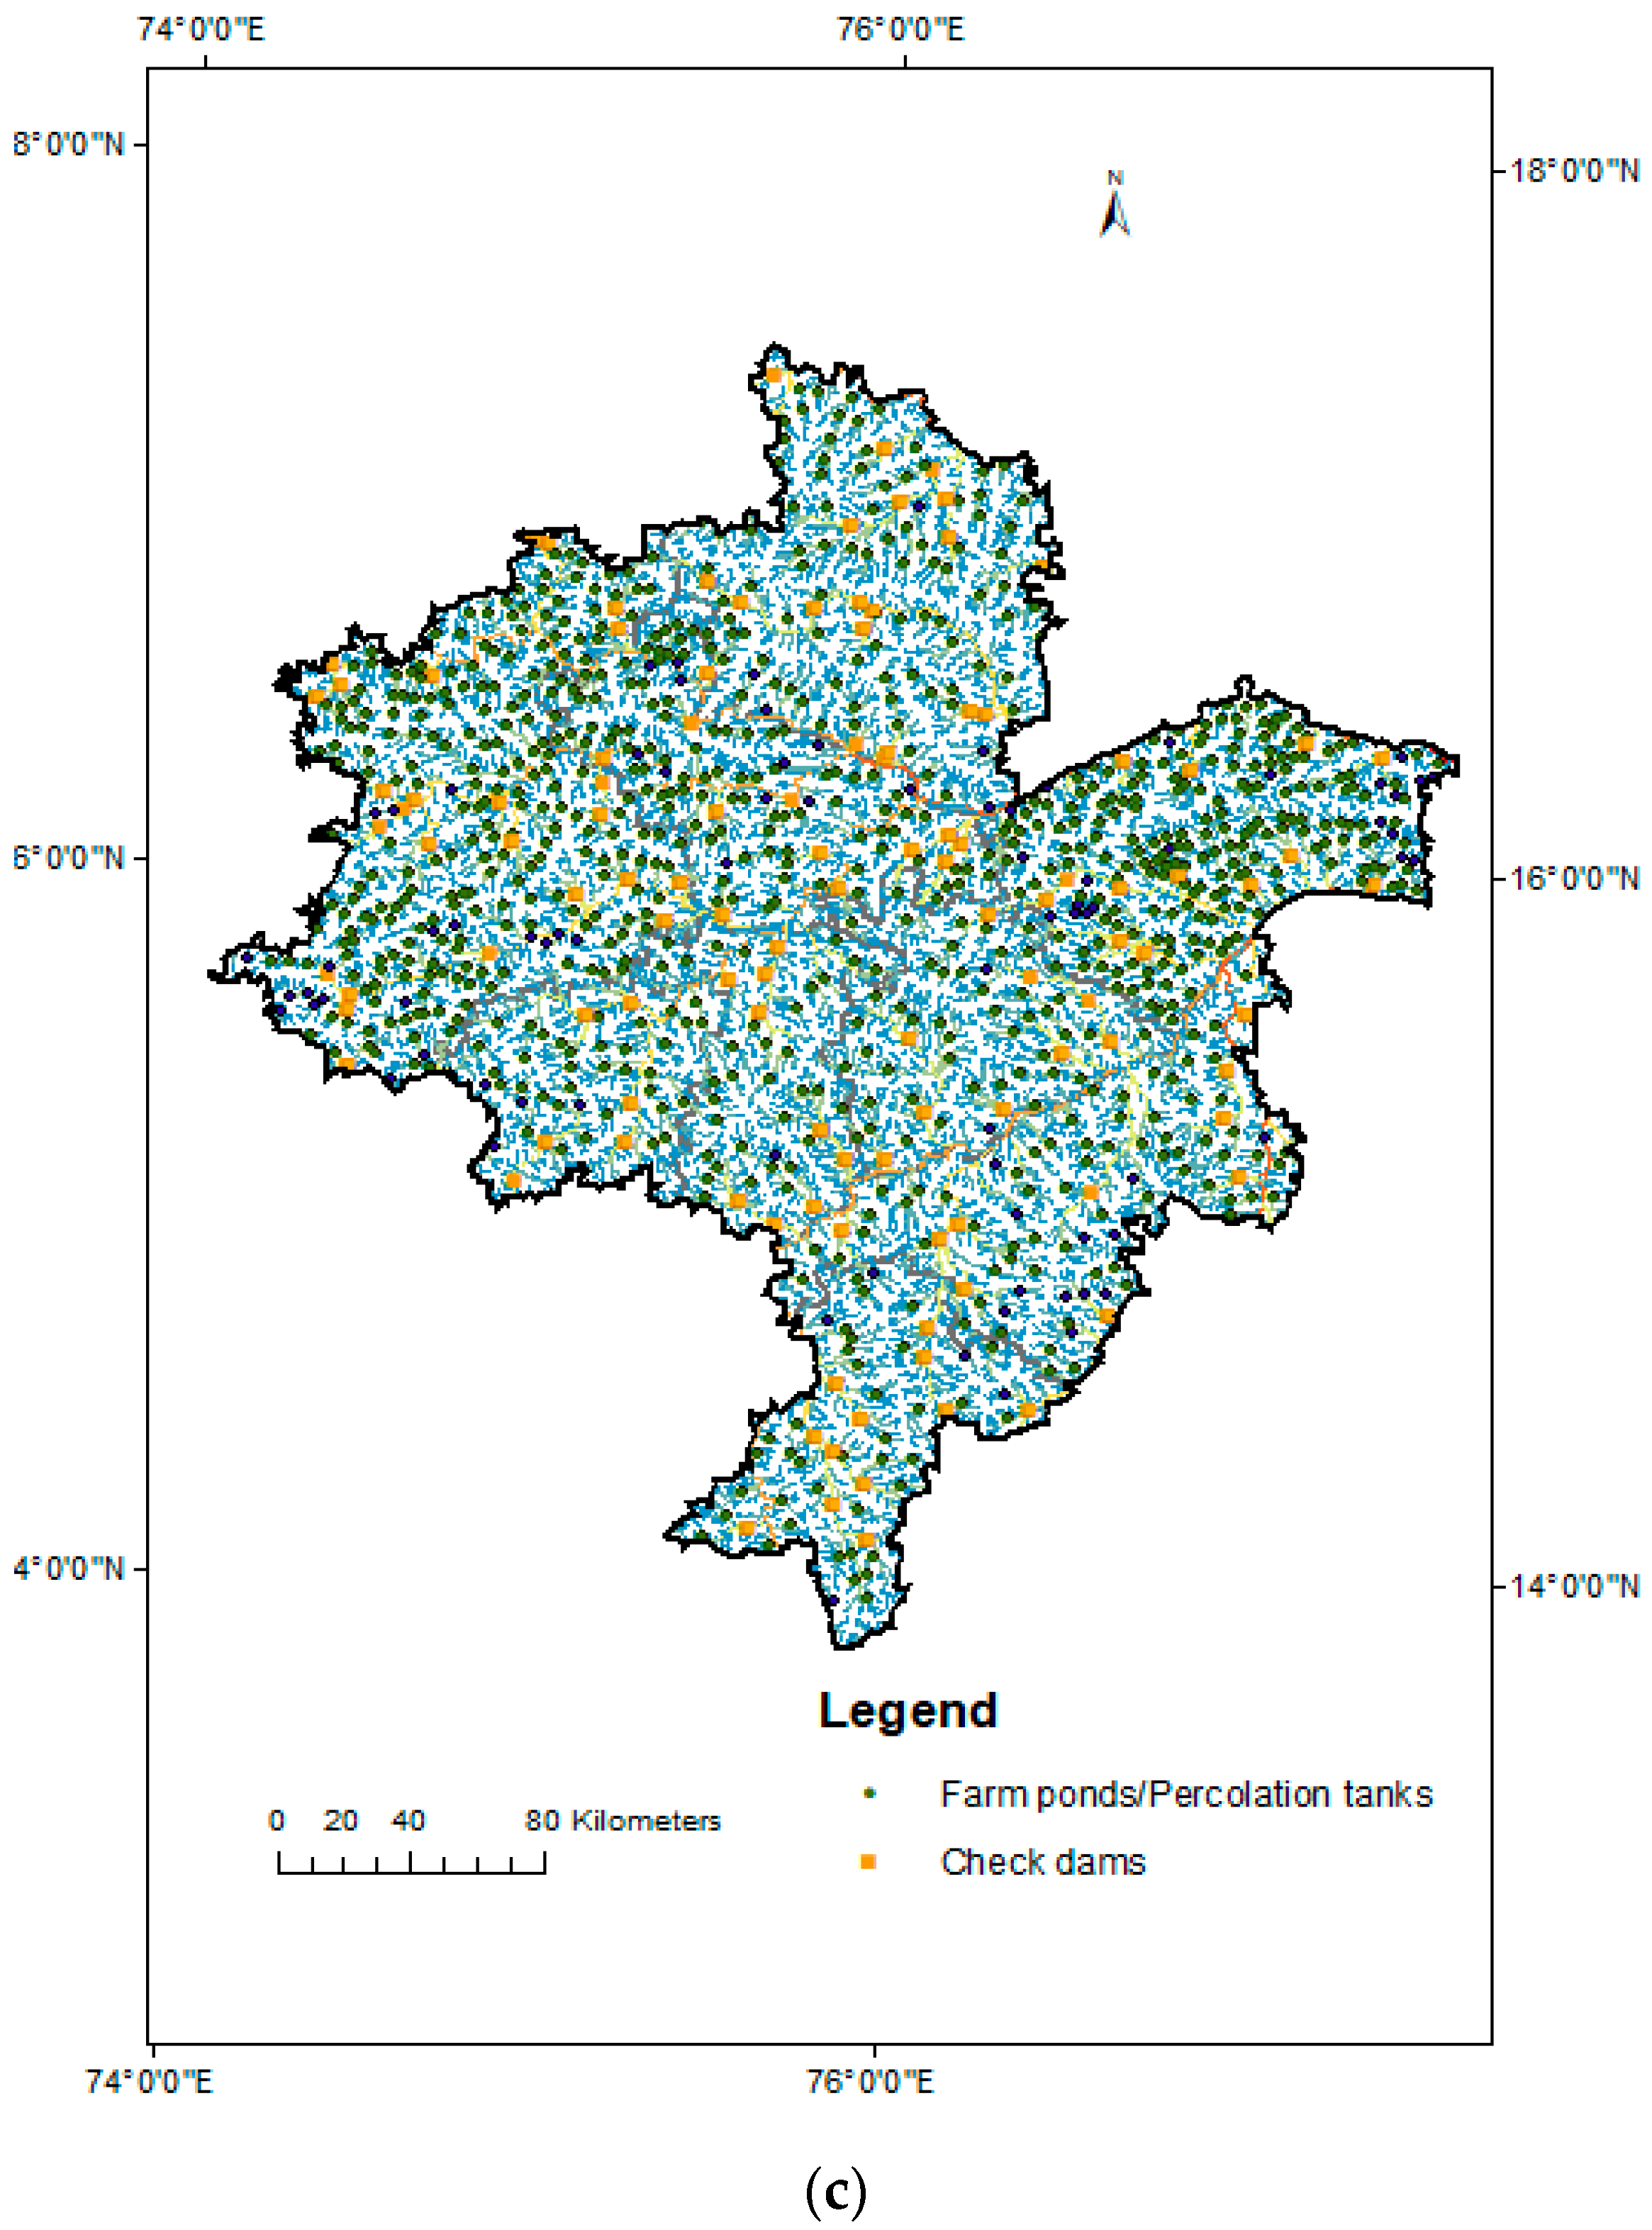
3.4. Suitable Locations for In Situ Moisture Conservation Measures and Water-Harvesting Structures

Much research has been performed in the past and has developed several soil and water conservation practices for Northern Karnataka. Out of those practices, the practices that were found better in terms of reducing soil and water loss and producing higher crop yields in multi-location trials were selected and recommended for the farmers to implement. Those practices being followed by farmers in the region were selected as a suitable practice for this specific region. The scope for expanding these practices/interventions for the whole region can be achieved using geospatial techniques.
The major soil and water conservation interventions generally followed in the study area includes broad bed furrow (BBF), compartmental bunding, conservation furrow, ridge and furrow, contour bunds, graded bunds, and semi-circular/crescent bunds (Figure 8a–f. Singh et al. [61] reported the impact of life-saving irrigation from water harvested in farm ponds, check dams, and community ponds for saving the crops from dry spells of more than 20 days in Northern Karnataka. It increased the crop yields by 25 to 54% more as compared to unirrigated fields. Similarly, the rejuvenation of percolation tanks and nala bunds under ICAR-NICRA enhanced the water storage and increased the groundwater recharge, which enhanced the groundwater level in nearby wells used for critical irrigation. In Northern Karnataka, adoption of trench-cum-bunds enhanced the soil moisture and increased the yield of pigeonpea, groundnut, and maize by 29, 25, and 31%, respectively. Similarly, field bunds/contour bunds in Kalburgi district minimized the erosion and increased the yield of pigeonpea by 2.0 q/ha, and compartmental bunding in Gadag, Belgavi, and Kalaburgi districts of Karnataka harvested the rainfall, conserved the moisture, increased the rainwater use efficiency, and increased the sorghum yield by 21 to 36%. Broad bed furrow (BBF) for groundnut in Chickaballapur district of Karnataka increased the rainwater use efficiency and economic water use efficiency by 18.7 to 85.5% as compared to flatbed sowing. Ridge and furrow for pigeonpea in Kalburgi of Karnataka saved the crops from 15 days of dry spells and increased pigeonpea yield by 3 q/ha as compared to farmers practices, whereas adoption of conservation furrow for green gram pigeonpea and maize pigeonpea intercropping in Gadag district of Karnataka increased the yields by 25 to 38% more as compared to flatbed sowing or farmers practices [61].
In order to expand the area under these interventions and to make the Northern Karnataka zone more sustainable, suitable in situ moisture conservation measures and water-harvesting structures were planned and prioritized using geospatial techniques. Among the selected in situ soil and water conservation interventions, conservation furrow and contour cultivation are very suitable for all nine districts followed by compartmental bunding and semi-circular bunds (Table 5).
Out of the total area, conservation furrow was found suitable for 49.2% of the area, contour cultivation for 24.3% of the area, and compartmental bunding and semi-circular bunds for 16.8 and 16.9% of the areas, respectively. BBF was found to be suitable for 24.8% of Vijayapura district and the ridge and furrow technique for 25.2% of Belgavi and 24.8% of Bagalkot districts. The suitability of conservation furrow varied from 36.0% in Bagalkot to 61.2% in Davengere, whereas contour cultivation varied from 16.3% in Vijayapura to 40.1% in Dharwad. Semi-circular bunds were found as preferable options for Vijayapura and Gadag districts, whereas compartmental bunding was preferable for Raichur, Koppal, and Dharwad districts. It was found that the ridge and furrow technique was suitable for 11.8% of the total area. Adjusted contour/graded bunds with terraces were suitable in 18.6% of Bagalkot, 15.5% of Belgavi, and 7.9% of Bellary area (Figure 9a) (Table 5). Further, suitable locations for water-harvesting/groundwater recharge structures such as farm ponds, percolation tanks, and check dams were determined using the stream order generated using GIS and the criteria available in Table 2 (Figure 9b,c) [54]. The identified locations were converted to *kml file and validated in Google Earth by visual interpretations, ground truth, and recorded data (Figure 9d and Table 6).

4. Discussion

4.1. Soil Loss Estimation Using RUSLE

In the present study, the RUSLE model and GIS were applied to determine the soil loss in the northern dry zone of Karnataka. RUSLE helps to predict the soil erosion from ungauged watersheds at a reasonable cost and better accuracy by considering the climatic conditions and heterogeneity of the soil. Though USLE/RUSLE is an empirical model, it is the model used worldwide in soil loss estimations because of its compatibility with GIS. The integrated application of remote sensing, GIS, and RUSLE makes soil loss estimation and its spatial distribution easier with better accuracy even in large catchments [6,42,62].
Generally, researchers use empirical equations with monthly or annual rainfall for estimating the erosivity factor [63,64,65]. Reddy et al. [48] used empirical equations with annual rainfall for estimating the R factor for Andhra Pradesh and Telangana in India. Demirci and Karaburun [63] used an empirical formula with monthly and annual average rainfall to estimate the R factor for Beiluo River Basin and the Buyukcekmece Lake watershed of northwest Turkey, respectively. Mohammed et al. [64] also used a similar empirical formula with monthly and annual average rainfall (216 to 541 mm) and determined the erosivity for Southern Syria as 374.1 ha−1 h−1 year−1, and soil loss was less than 5.0 t ha−1 y−1 for 95% of the area. Singh et al. [12] determined the annual erosivity for Maharashtra State of India from empirical equations using annual rainfall and found that the erosivity ranged from 301.5 to 1509.6 MJ mm ha−1 h−1 year−1 in 2011, and 80% of the area had a soil loss less than 10.0 t ha−1 y−1. In the present study, the R factor was estimated using empirical equations with daily rainfall developed at ICAR-CRIDA [46], the mean annual erosivity for 70 years varied spatially from 2606 to >15,000 MJ mm ha−1 h−1 year−1, and the average annual rainfall varied spatially from 420 to 3700 mm.
Many researchers used the C factor derived from NDVI for calculating the soil loss similar to the present study [66,67,68,69]. Toubal et al. [70] used RUSLE and found that the average annual soil loss in the Wadi Sahouat basin of North-West Algeria ranged from 0 to 255 t ha−1 y −1. The higher values were found in steep slopes greater than 25% and elevations from 600 and 1000 m. Erosion becomes more intense corresponding to the rainfall intensity and slope characteristics, which complies with the present study. Kumar et al. [71] used remote sensing and geographic information system based RUSLE modelling for estimation of soil loss in western Himalayas. Researchers proposed several conservation measures such as terraces, gabion [72], conservation tillage, contour ploughing, cover crops, and afforestation for enhancing productivity [73]. These soil conservation measures aim to reduce the runoff, trap topsoil, promote the formation of natural terraces, and finally reduce the sedimentation in drains and waterbodies [63,73]. Moisa et al. [74] estimated the annual soil loss using RUSLE for a Sub-basin in Western Ethiopia, and it ranged from 0 and 932.6 t ha−1 y −1 with a mean value of 83.7 t ha−1 y −1 and categorized 43.6% and 8.4% of the area as very severe and severe erosion type. Wang et al. [75] applied RUSLE to assess the erosion risk in mountain areas and its response to climate change in a region located in the southern side of Tibetan Plateau, determined the average soil loss as 29.1 t ha−1 y −1, and found a higher erosion in wet and cold years. In the present study, it was found that 39.09% of the area had a slight erosion of <5 t ha−1 y−1 followed by 42.72% of the area under 5.0 to 10.0 t ha−1 y−1, 10.49% of the area with 10.0 to 15.0 t ha−1 y−1, and 7.69% of the area with soil loss ≥15.0 t ha−1 y−1, and the study area covers low-, medium-, and high-rainfall regions with flat, medium, and high slopes. Based on the variation in soil loss, the vulnerable areas were prioritized for implementing the soil and water conservation interventions.

4.2. Planning Site-Specific Soil and Water Conservation Interventions

The planning and adoption of site-specific soil and water conservation practices in different sub-districts will help to control the runoff, soil loss, and nutrient loss from agricultural land, therefore minimizing the land degradation. This will lead to the conservation of moisture in the field and finally enhance the crop productivity. Previous research studies across the world proved that adoption of in situ interventions such as ridge and furrow, BBF, contour cultivation, compartmental bunding, and conservation furrow decreases the runoff velocity, enhances soil moisture, and recharges the groundwater [12,64,75]. Milkias et al. [76] reported that ridge and furrow, contour ridge, and tied ridge increased the soil moisture by 134.5, 128.5, and 121.8% and the grain yield of maize by 143.1, 131.4, and 121.1%, respectively, over the control treatment at Ethiopia. The studies by Qin et al. [77] showed that the integrated use of ridge and furrow planting with manure in northwest China increased the maize yield by 18% compared to flat planting. The prioritization of catchments based on soil loss will help the planners and policymakers to identify the erosion-prone areas for implementing the interventions on a priority basis [46,48], and the spatial maps of site-specific interventions generated in this study would enable the stakeholders to choose the best interventions for adoption. Many researchers used geospatial techniques for identifying suitable locations for water-harvesting and recharge structures with the aid of geospatial techniques [54,78,79], but limited studies are available for planning in situ moisture conservation interventions using these geospatial techniques [56]. Pauw et al. [56] integrated Expert Knowledge with GIS to find the potential for water harvesting. Raghavan et al. [80] estimated the runoff potential in Northern Karnataka using SCS-CN and GIS and classified the area based on runoff under the current scenario and climate change scenarios. Rejani et al. [53] developed a methodology for planning different in situ interventions suitable for Adilabad District of Telangana State using geospatial techniques. As the interventions are site-specific, a similar approach with different criteria was used in the present study to derive the maps of in situ soil and water interventions suitable for the sustainability of the northern dry zone of Karnataka.

5. Conclusions

Estimation of soil loss and planning of suitable interventions for in situ moisture conservation are of prime importance for the resilience of Northern Karnataka. Due to the insufficient data availability, soil loss was estimated sub-district-wise with the aid of RUSLE and GIS. For most of the region, soil loss was <10.0 t ha−1 y−1 and was estimated catchment-wise to prioritize the vulnerable areas. The results showed that 7.69% of the area with soil loss ≥15.0 t ha−1 y−1 needs top priority for planning interventions followed by 10.49% of the area with soil loss ranging from 10.0 to 15.0 t ha−1 y−1 and 42.72% of the area with 5.0 to10.0 t ha−1 y−1. In order to control erosion and to conserve the topsoil, suitable in situ moisture conservation measures and rainwater-harvesting/groundwater recharge structures were planned using geospatial techniques. Interventions such as conservation furrow and contour cultivation are very suitable for all the selected districts followed by compartmental bunding and semi-circular bunds. Similarly, adoption of suitable structures such as percolation tanks, farm ponds, and check dams is also essential for the sustainable water management of Northern Karnataka.

Author Contributions

R.R.: methodology and writing the manuscript draft; K.V.R.: interpreting the results; M.S.S., G.R.C., and K.A.G.: data collection and survey; K.S.R., M.O., M.P., and V.K.S.: supervised the study, and reviewed and edited the manuscript. All authors have read and agreed to the published version of the manuscript.

Funding

This research work was supported by funding from the Indian Council of Agricultural Research-National Innovations in Climate-Resilient Agriculture (ICAR-NICRA) at ICAR-Central Research Institute for Dryland Agriculture, Hyderabad (Grant number: 2–2(201)/17–18/NICRA).

Data Availability Statement

The datasets used and analyzed during the present study are available from the first author on reasonable request.

Acknowledgments

The authors acknowledge ICAR-NICRA for providing funding for undertaking this work. The authors express the gratitude to AICRPDA, Vijayapura Centre for providing the data, NBSS&LUP for soil map, and NRSC for the LULC maps.

Conflicts of Interest

The authors declare no conflict of interest.

References

  1. Pimentel, D.; Kounang, N. Ecology of soil erosion in ecosystems. Ecosystems 1998, 1, 416–426. [Google Scholar] [CrossRef]
  2. Borrelli, P.; Alewell, C.; Alvarez, P.; Anache, J.A.A.; Baartman, J.; Ballabio, C.; Bezak, N.; Biddoccu, M.; Cerdà, A.; Chalise, D.; et al. Soil erosion modelling: A global review and statistical analysis. Sci. Total Environ. 2021, 780, 146494. [Google Scholar] [CrossRef] [PubMed]
  3. Rickson, R.J.; Deeks, L.K.; Graves, A.; Harris, J.A.; Kibblewhite, M.G.; Sakrabani, R. Input constraints to food production: The impact of soil degradation. Food Secur. 2015, 7, 351–364. [Google Scholar] [CrossRef]
  4. Stefanidis, S.; Alexandridis, V.; Ghosal, K. Assessment of Water-Induced Soil Erosion as a Threat to Natura 2000 Protected Areas in Crete Island, Greece. Sustainability 2022, 14, 2738. [Google Scholar] [CrossRef]
  5. Köninger, J.; Panagos, P.; Jones, A.; Briones, M.J.I.; Orgiazzi, A. In defence of soil biodiversity: Towards an inclusive protection in the European Union. Biol. Conserv. 2022, 268, 109475. [Google Scholar] [CrossRef]
  6. Prasannakumar, V.; Shiny, R.; Geetha, N.; Vijith, H.J. Spatial prediction of soil erosion risk by remote sensing, GIS and RUSLE approach: A case study of Siruvani river watershed in Attapady valley, Kerala, India. Environ. Earth Sci. 2011, 64, 965–972. [Google Scholar] [CrossRef]
  7. Eswaran, H.; Lal, R.; Reich, P.F. Land degradation: An overview. In Response to Land Degradation; CRC Press: Boca Raton, FL, USA, 2019; pp. 20–35. [Google Scholar]
  8. Salifu, E.; Agyare, W.A.; Kyei-Baffour, N.; Dumedah, G. Estimation of Soil Erosion in Three Northern Regions of Ghana Using RUSLE in GIS Environment. Int. J. Appl. Geospat. Res. 2021, 12, 1–19. [Google Scholar] [CrossRef]
  9. Wynants, M.; Patrick, A.; Munishi, L.; Mtei, K.; Bodé, S.; Taylor, A.; Millward, G.; Roberts, N.; Gilvear, D.; Ndakidemi, P.; et al. Soil erosion and sediment transport in Tanzania: Part II—Sedimentological evidence of phased land degradation. Earth Surf. Process. Landf. 2021, 46, 3096–3111. [Google Scholar] [CrossRef]
  10. Panagos, P.; Borrelli, P.; Matthews, F.; Liakos, L.; Bezak, N.; Diodato, N.; Ballabio, C. Global rainfall erosivity projections for 2050 and 2070. J. Hydrol. 2022, 610, 127865. [Google Scholar] [CrossRef]
  11. Jain, S.K. Water resources management in India—Challenges and the way forward. Curr. Sci. 2019, 117, 00113891. [Google Scholar] [CrossRef]
  12. Singh, V.K.; Prasad, J.V.N.S.; Osman, M.; Ramana, D.B.V.; Nagasree, K.; Rejani, R.; Subbarao, A.V.M.; Srinivas, I.; Prabhakar, M.; Singh, L.; et al. Promising Climate Resilient Technologies for Maharashtra; ICAR—Central Research Institute for Dry Land Agriculture: Hyderabad, India, 2021; 105p. [Google Scholar]
  13. Vanwalleghem, T.; Gómez, J.A.; Amate, J.I.; de Molina, M.G.; Vanderlinden, K.; Guzmán, G.; Laguna, A.; Giráldez, J.V. Impact of historical land use and soil management change on soil erosion and agricultural sustainability during the Anthropocene. Anthropocene 2017, 17, 13–29. [Google Scholar] [CrossRef]
  14. Vente, J.D.; Poesen, J. Predicting soil erosion and sediment yield at the basin scale: Scale issues and semi-quantitative models. Earth Sci. Rev. 2005, 71, 95–125. [Google Scholar] [CrossRef]
  15. Tsufac, A.R.; Awazi, N.P.; Yerima, B.P. Characterization of agroforestry systems and their effectiveness in soil fertility enhancement in the south-west region of Cameroon. Curr. Res. Environ. Sustain. 2021, 3, 100024. [Google Scholar] [CrossRef]
  16. El-Naggar, A.; Lee, S.S.; Rinklebe, J.; Farooq, M.; Song, H.; Sarmah, A.K.; Zimmerman, A.R.; Ahmad, M.; Shaheen, S.M.; Ok, Y.S. Biochar application to low fertility soils: A review of current status, and future prospects. Geoderma 2019, 337, 536–554. [Google Scholar] [CrossRef]
  17. Zheng, H.; Liu, W.; Zheng, J.; Luo, Y.; Li, R.; Wang, H.; Qi, H. Effect of long-term tillage on soil aggregates and aggregate-associated carbon in black soil of Northeast China. PLoS ONE 2018, 13, e0199523. [Google Scholar] [CrossRef] [PubMed]
  18. Gao, X.; Li, H.; Zhao, X.; Ma, W.; Wu, P. Identifying a suitable revegetation technique for soil restoration on water-limited and degraded land: Considering both deep soil moisture deficit and soil organic carbon sequestration. Geoderma 2019, 319, 61–69. [Google Scholar] [CrossRef]
  19. Thaler, E.A.; Larsen, I.J.; Yu, Q. The extent of soil loss across the US Corn Belt. Proc. Natl. Acad. Sci. USA 2021, 118, e1922375118. [Google Scholar] [CrossRef]
  20. Bajirao, T.S.; Kumar, P. Geospatial technology for prioritization of Koyna River basin of India based on soil erosion rates using different approaches. Environ. Sci. Pollut. Res. 2021, 28, 35242–35265. [Google Scholar] [CrossRef]
  21. Ahmed, B.; Sihem, J.; Lakhdar, K. Chapter Spatial Estimation of Soil Erosion Risk Using RUSLE/GIS Techniques and Practices Conservation Suggested for Reducing Soil Erosion in Wadi Mina Catchment (Northwest, Algeria). 2021. Available online: https://library.oapen.org/handle/20.500.12657/49388 (accessed on 20 January 2022).
  22. Ramkumar, M.; Kumaraswamy, K.; James, R.A.; Suresh, M.; Sugantha, T.; Jayaraj, L.; Mathiyalagan, A.; Saraswathi, M.; Shyamala, J. Sand mining, channel bar dynamics and sediment textural properties of the Kaveri River, South India: Implications on flooding hazard and sustainability of the natural fluvial system. In Environmental Management of River Basin Ecosystems; Springer: Cham, Switzerland, 2015; pp. 283–318. [Google Scholar]
  23. Shojaei, S.; Kalantari, Z.; Rodrigo-Comino, J. Prediction of factors affecting activation of soil erosion by mathematical modeling at pedon scale under laboratory conditions. Sci. Rep. 2020, 10, 20163. [Google Scholar] [CrossRef]
  24. Vahabi, J.; Nikkami, D. Assessing dominant factors affecting soil erosion using a portable rainfall simulator. Int. J. Sediment. Res. 2008, 23, 376–386. [Google Scholar] [CrossRef]
  25. Biswas, H.; Raizada, A.; Kumar, S.; Mandal, D.; Srinivas, S.; Hegde, R.; Mishra, P.K. Soil erosion risk mapping for natural resource conservation planning in Karnataka Region, Southern India. Indian J. Soil Conserv. 2019, 47, 14–20. [Google Scholar]
  26. NAAS-ICAR. Degraded and Waste Lands of India: Status and Spatial Distribution; Directorate of Information and Publication of Agriculture, Indian Council of Agricultural Research: New Delhi, India, 2010; 158p. [Google Scholar]
  27. Shashidahra, K.K.; Reddy, B.S. Farmers perceptions and adaptation about changing climate and its variability in UKP area of Karnataka. Indian Res. J. Ext. Educ. 2012, 12, 196–201. [Google Scholar]
  28. Bashagaluke, J.B.; Logah, V.; Opoku, A.; Tuffour, H.O.; Sarkodie-Addo, J.; Quansah, C. Soil loss and run-off characteristics under different soil amendments and cropping systems in the semi-deciduous forest zone of Ghana. Soil Use Manag. 2019, 35, 617–629. [Google Scholar] [CrossRef]
  29. Borrelli, P.; Robinson, D.A.; Fleischer, L.R.; Lugato, E.; Ballabio, C.; Alewell, C.; Meusburger, K.; Modugno, S.; Schütt, B.; Ferro, V.; et al. An assessment of the global impact of 21st century land use change on soil erosion. Nat. Commun. 2017, 8, 2013. [Google Scholar] [CrossRef] [PubMed] [Green Version]
  30. Wischmeier, W.H.; Smith, D.D. Predicting Rainfall Erosion Losses: A Guide to Conservation Planning (No. 537); Department of Agriculture, Science and Education Administration: Washington, DC, USA, 1978. [Google Scholar]
  31. Wischmeier, W.H.; Smith, D.D. Predicting Rainfall-Erosion Losses from Cropland East of the Rocky Mountains: Guide for Selection of Practices for Soil and Water Conservation; Agricultural Research Service, US Department of Agriculture: Washington, DC, USA, 1965. [Google Scholar]
  32. Dabral, P.P.; Baithuri, N.; Pandey, A. Soil erosion assessment in a hilly catchment of North Eastern India using USLE, GIS and remote sensing. Water Resour. Manag. 2008, 22, 1783–1798. [Google Scholar] [CrossRef]
  33. Renard, K.G.; Foster, G.R.; Weesies, G.A.; McCool, D.K.; Yoder, D.C. Predicting soil erosion by water: A guide to conservation planning with the Revised Universal Soil Loss Equation (RUSLE). In Agriculture Handbook; USDA: Washington, DC, USA, 1997; Volume 703, pp. 25–28. [Google Scholar]
  34. Das, S.; Deb, P.; Bora, P.K.; Katre, P. Comparison of RUSLE and MMF soil loss models and evaluation of catchment scale best management practices for a mountainous watershed in India. Sustainability 2021, 13, 232. [Google Scholar] [CrossRef]
  35. Shen, Z.Y.; Gong, Y.W.; Li, Y.H.; Hong, Q.; Xu, L.; Liu, R.M. A comparison of WEPP and SWAT for modeling soil erosion of the Zhangjiachong Watershed in the Three Gorges Reservoir Area. Agric. Water Manag. 2019, 96, 1435–1442. [Google Scholar] [CrossRef]
  36. Goodrich, D.C.; Burns, I.S.; Unkrich, C.L.; Semmens, D.J.; Guertin, D.P.; Hernandez, M.; Yatheendradas, S.; Kennedy, J.R.; Levick, L.R. KINEROS2/AGWA: Model use, calibration, and validation. Trans. ASABE 2012, 55, 1561–1574. [Google Scholar] [CrossRef]
  37. Berberoglu, S.; Cilek, A.; Kirkby, M.; Irvine, B.; Donmez, C. Spatial and temporal evaluation of soil erosion in Turkey under climate change scenarios using the Pan-European Soil Erosion Risk Assessment (PESERA) model. Environ. Monit. Assess. 2020, 192, 491. [Google Scholar] [CrossRef]
  38. Iqbal, M.N.; Oweis, T.Y.; Ashraf, M.; Hussain, B.; Majid, A. Impact of land-use practices on sediment yield in the Dhrabi Watershed of Pakistan. J. Environ. Sci. Eng. 2012, 1, 406–420. [Google Scholar]
  39. Ahmadi, M.; Minaei, M.; Ebrahimi, O.; Nikseresht, M. Evaluation of WEPP and EPM for improved predictions of soil erosion in mountainous watersheds: A case study of Kangir River basin, Iran. Model. Earth Syst. Environ. 2020, 6, 2303–2315. [Google Scholar] [CrossRef]
  40. Smith, H.J. Application of empirical soil loss models in southern Africa: A review. South Afr. J. Plant Soil 1999, 16, 158–163. [Google Scholar] [CrossRef]
  41. Hardaha, M.K. Modeling Soil Erosion by Water in Ravine Lands: Greening for Livelihood and Environmental Security; Springer: Singapore, 2018; pp. 549–572. [Google Scholar]
  42. Prasannakumar, V.; Vijith, H.; Abinod, S.; Geetha, N.J. Estimation of soil erosion risk within a small mountainous sub-watershed in Kerala, India, using Revised Universal Soil Loss Equation (RUSLE) and geo-information technology. Geosci. Front. 2012, 3, 209–215. [Google Scholar] [CrossRef]
  43. Kinnell, P.I.A. AGNPS-UM: Applying the USLE-M within the agricultural non-point source pollution model. Environ. Model. Softw. 2000, 15, 331–341. [Google Scholar] [CrossRef]
  44. Ghosh, K.; De, S.K.; Bandyopadhyay, S.; Saha, S. Assessment of soil loss of the Dhalai river basin, Tripura, India using USLE. Int. J. Geosci. 2013, 4, 26505. [Google Scholar] [CrossRef] [Green Version]
  45. Chary, G.R.; Srinivasa Rao, C.H.; Gopinath, K.A.; Sikka, A.K.; Kandpal, B.; Bhaskar, S. Improved Agronomic Practices for Rainfed Crops in India; All India Coordinated Research Project for Dryland Agriculture; ICAR—Central Research Institute for Dryland Agriculture: Hyderabad, India, 2016; p. 292. [Google Scholar]
  46. Rejani, R.; Rao, K.V.; Osman, M.; Rao, C.S.; Reddy, K.S.; Chary, G.R.; Samuel, J. Spatial and temporal estimation of soil loss for the sustainable management of a wet semi-arid watershed cluster. Environ. Monit. Assess. 2016, 88, 143. [Google Scholar] [CrossRef]
  47. Lal, R.; Olson, K.R.; Norton, L.D. Evaluation of methods to study soil erosion-productivity relationships. J. Soil Water Conserv. 1994, 49, 586–590. [Google Scholar]
  48. Reddy, R.S.; Nalatwadmath, S.K.; Krishnan, P. Soil Erosion Andhra Pradesh. NBSS Publ. 2005, 114, 76. [Google Scholar]
  49. Tirkey, A.S.; Pandey, A.C.; Nathawat, M.S. Use of satellite data, GIS and RUSLE for estimation of average annual soil loss in Daltonganj watershed of Jharkhand (India). J. Remote Sens. Technol. 2013, 1, 20–30. [Google Scholar] [CrossRef]
  50. Van der Knijff, J.M.; Jones, R.J.A.; Montanarella, L. Soil Erosion Risk Assessment in Europe. 2000. Available online: http://eusoils.jrc.ec.europa.eu (accessed on 10 January 2015).
  51. Indian Meteorological Department (IMD). Frequently Asked Questions (FAQs) on Monsoon. Available online: https://mausam.imd.gov.in/imd_latest/monsoonfaq.pdf (accessed on 10 January 2022).
  52. Mondal, A.; Kundu, S.; Mukhopadhyay, A. Rainfall trend analysis by Mann-Kendall test: A case study of north-eastern part of Cuttack district, Orissa. Int. J. Geol. Earth Environ. Sci. 2012, 2, 70–78. [Google Scholar]
  53. Rejani, R.; Rao, K.V.; Osman, M.; Chary, G.R.; Reddy, K.S.; Rao, C.S. Location specific insitu soil and water conservation interventions for sustainable management of drylands. J. Agrometeorol. 2015, 17, 55–60. [Google Scholar] [CrossRef]
  54. Rejani, R.; Rao, K.V.; Srinivasa Rao, C.H.; Osman, M.; Sammi Reddy, K.; George, B.; Pratyusha Kranthi, G.S.; Chary, G.R.; Swamy, M.V.; Rao, P.J. Identification of potential rainwater-harvesting sites for the sustainable management of a semi-arid watershed. Irrig. Drain. 2017, 66, 227–237. [Google Scholar] [CrossRef]
  55. Shanwad, U.K.; Patil, V.C.; Gowda, H.H.; Dasog, G.S.; Shashidhar, K.S. Generation of water resources action plan for Medak Nala Watershed in India using Remote sensing and GIS technologies. Aust. J. Basic Appl. Sci. 2011, 5, 2209–2218. [Google Scholar]
  56. De Pauw, E.; Oweis, T.; Youssef, J. Integrating Expert Knowledge in GIS to Locate Biophysical Potential for Water Harvesting: Methodology and a Case Study for Syria; ICARDA: Aleppo, Syria, 2008; p. 59. [Google Scholar]
  57. Anschütz, J.; Kome, A.; Nederlof, M.; Neef, R.D.; Ven, T. Water Harvesting and Soil Moisture Retention. Agrodok 13; Stoas Digigrafi Printers: Wageningen, The Netherlands, 2003; p. 95. [Google Scholar]
  58. Kalgapurkar, A.; Mishra, P.K.; Tripathi, K.P. Applicability of RS and GIS in soil and water conservation measures. Indian J. Soil Conserv. 2012, 40, 190–196. [Google Scholar]
  59. TNAU. Dryland Agriculture—Soil and Water Conservation Measures. Available online: https://agritech.tnau.ac.in/agriculture/agri_majorareas_dryland_enggmeasures_bbf.html (accessed on 15 December 2021).
  60. Rejani, R.; Rao, K.V.; Reddy, K.S.; Usharani, B.; Chary, G.R.; Gopinath, K.A.; Patode, R.S.; Osman, M. Potential sites for different in-situ moisture conservation measures in Western Vidarbha zone of Maharashtra using geospatial techniques. Indian J. Soil Conserv. 2022, 50, 120–127. [Google Scholar]
  61. Singh, V.K.; Prasad, J.V.N.S.; Ramana, D.B.V.; Nagasree, K.; Rejani, R.; Venkatesh, G.; Reddy, D.V.S.; Venkatasubramanian, V.; Prabhakar, M.; Bhaskar, S.; et al. Promising Climate Resilient Technologies for Karnataka; ICAR—Central Research Institute for Dry Land Agriculture: Hyderabad, India, 2021; 87p. [Google Scholar]
  62. Farhan, Y.; Zregat, D.; Farhan, I. Spatial estimation of soil erosion risk using RUSLE approach, RS, and GIS techniques: A case study of Kufranja watershed, Northern Jordan. J. Water Resour. Prot. 2013, 5, 1247. [Google Scholar] [CrossRef] [Green Version]
  63. Demirci, A.; Karaburun, A. Estimation of soil erosion using RUSLE in a GIS framework: A case study in the Buyukcekmece Lake watershed, Northwest Turkey. Environ. Earth Sci. 2012, 66, 903–913. [Google Scholar] [CrossRef]
  64. Mohamadi, M.A.; Kavian, A. Effects of rainfall patterns on runoff and soil erosion in field plots. Int. Soil Water Conserv. Res. 2015, 3, 273–281. [Google Scholar] [CrossRef] [Green Version]
  65. Singh, V.; Nema, A.K.; Chouksey, A.; Kar, S.K.; Das, S. Spatiotemporal soil erosion assessment using RUSLE model on geospatial platform for Maharashtra state. Indian J. Soil Conserv. 2021, 49, 172–180. [Google Scholar]
  66. Alexakis, D.D.; Hadjimitsis, D.G.; Agapiou, A. Integrated use of remote sensing, GIS and precipitation data for the assessment of soil erosion rate in the catchment area of “Yialias” in Cyprus. Atmos. Res. 2013, 131, 108–124. [Google Scholar] [CrossRef]
  67. Dutta, S. Soil erosion, sediment yield and sedimentation of reservoir: A review. Model Earth Syst. Environ. 2016, 2, 123. [Google Scholar] [CrossRef] [Green Version]
  68. Abdo, H.; Salloum, J. Mapping the soil loss in Marqya basin: Syria using RUSLE model in GIS and RS techniques. Environ. Earth Sci. 2017, 76, 114. [Google Scholar] [CrossRef]
  69. Bai, Y.; Cui, H. An improved vegetation cover and management factor for RUSLE model in prediction of soil erosion. Environ. Sci. Pollut. Res. 2021, 28, 21132–21144. [Google Scholar] [CrossRef] [PubMed]
  70. Toubal, A.K.; Achite, M.; Ouillon, S.; Dehni, A. Soil erodibility mapping using the RUSLE model to prioritize erosion control in the Wadi Sahouat basin, North-West of Algeria. Environ. Monit. Assess. 2018, 190, 210. [Google Scholar] [CrossRef] [PubMed]
  71. Kumar, A.; Devi, M.; Deshmukh, B. Integrated remote sensing and geographic information system based RUSLE modelling for estimation of soil loss in western Himalaya. India Water Resour. Manag. 2014, 28, 3307–3317. [Google Scholar] [CrossRef]
  72. Kumar, S.; Kushwaha, S.P. Modelling soil erosion risk based on RUSLE-3D using GIS in a Shivalik sub-watershed. J. Earth Sys. Sci. 2013, 122, 389–398. [Google Scholar] [CrossRef] [Green Version]
  73. Blanco, H.; Lal, R. Principles of Soil Conservation and Management; Springer: Dordrecht, The Netherlands, 2010; ISBN 978-1-4020-8708-0. [Google Scholar] [CrossRef]
  74. Moisa, M.B.; Dejene, I.N.; Merga, B.B.; Gemeda, D.O. Soil loss estimation and prioritization using geographic information systems and the RUSLE model: A case study of the Anger River Sub-basin, Western Ethiopia. J. Water Clim. Change 2022, 433, 1170–1184. [Google Scholar] [CrossRef]
  75. Wang, F.; Jiang, Z.R.; Li, X.J. Application of veliveria zizanioides to soil and water conservation in Shenzhen. Res. Soil Water Conserv. 2006, 1, 142–143. [Google Scholar]
  76. Milkias, A.; Tadesse, T.; Zeleke, H. Evaluating the effects of in-situ rainwater harvesting techniques on soil moisture conservation and grain yield of maize (Zea mays L.) in Fedis district, Eastern Hararghe, Ethiopia. Turk. J. Agric. Food Sci. Technol. 2018, 6, 1129–1133. [Google Scholar] [CrossRef] [Green Version]
  77. Qin, A.; Fang, Y.; Ning, D.; Liu, Z.; Zhao, B.; Xiao, J.; Duan, A.; Yong, B. Incorporation of manure into ridge and furrow planting system boosts yields of maize by optimizing soil moisture and improving photosynthesis. Agronomy 2019, 9, 865. [Google Scholar] [CrossRef]
  78. Ramakrishnan, D.; Durga Rao, K.H.; Tiwari, K.C. Delineation of potential sites for water harvesting structures through remote sensing and GIS techniques: A case study of Kali watershed, Gujarat, India. Geocarto Int. 2008, 23, 95–108. [Google Scholar] [CrossRef]
  79. Ramakrishnan, D.; Bandyopadhyay, A.; Kusuma, K.N. SCS-CN and GIS-based approach for identifying potential water harvesting sites in the Kali Watershed, Mahi River Basin, India. J. Earth Syst. Sci. 2009, 118, 355–368. [Google Scholar] [CrossRef] [Green Version]
  80. Raghavan, R.; Rao, K.V.; Shirahatti, M.S.; Srinivas, D.K.; Reddy, K.S.; Chary, G.R.; Gopinath, K.A.; Osman, M.; Prabhakar, M.; Singh, V.K. Assessment of Spatial and Temporal Variations in Runoff Potential under Changing Climatic Scenarios in Northern Part of Karnataka in India Using Geospatial Techniques. Sustainability 2022, 14, 3969. [Google Scholar] [CrossRef]
Figure 1. (ac) Location map and gauging stations of northern dry zone of Karnataka in Krishna basin of India.
Water 14 03623 g001aWater 14 03623 g001b
Figure 2. (a) Soil map, (b) land use land cover map, and (c) slope map of northern dry zone of Karnataka.
Water 14 03623 g002aWater 14 03623 g002b
Figure 3. (a). Flow chart depicting the planning of soil and water conservation interventions. (b,c) Rainfall and erosivity (R factor) in the study area. (d) C factor map for the selected area during August 2017.
Water 14 03623 g003aWater 14 03623 g003b
Figure 4. (a). Observed vs. estimated soil loss in northern dry zone of Karnataka. (b). Mean annual soil loss in northern dry zone of Karnataka.
Water 14 03623 g004
Figure 5. (a). Variation in rainfall and erosivity in high-rainfall area. (b). Variation in rainfall and erosivity in medium-rainfall area. (c). Variation in rainfall and erosivity in low-rainfall area.
Water 14 03623 g005aWater 14 03623 g005b
Figure 6. Temporal variation in soil loss at low, medium and high-rainfall areas of Belgavi district.
Water 14 03623 g006
Figure 7. (a). Catchment-wise soil loss in the study area. (b). Prioritization for implementing soil erosion control measures.
Water 14 03623 g007
Figure 8. Soil and water conservation interventions existing in Karnataka. (a) Broad bed furrow (BBF), (b) compartmental bunding, (c) conservation furrow, (d) contour bunds, (e) graded bunds, and (f) semi-circular/crescent bunds.
Water 14 03623 g008
Figure 9. (a) Suitable in situ interventions identified for northern dry zone of Karnataka. (b) Stream order map of the study area. (c) Potential locations for water-harvesting/recharge structures identified for northern dry zone of Karnataka. (d) Validation of potential locations for water-harvesting/recharge structures.
Water 14 03623 g009aWater 14 03623 g009bWater 14 03623 g009cWater 14 03623 g009d
Table 2. Site selection criteria for the planning of water-harvesting/groundwater recharge structures.
StructureSlope (%)Stream OrderCatchment Area (ha)Annual Rainfall (mm)
Farm ponds (lined/unlined) ≤51–2 and other potential area >1–2>500
Check dams ≤15 3–425>700
Percolation tanks (Light sandy soil)≤10 1–425–40>700
Note(s): Source: Rejani et al. [53]; Rejani et al. [54]; Rejani et al. [60].
Table 3. Quantification of average annual soil loss at northern dry zone of Karnataka (1951 to 2020).
Erosion CategoryArea under Each Category (ha)% Area under Each CategoryRate of Soil Loss (t ha−1 y−1)
Low erosion783,53711.62≤2.5
Slight erosion1,851,84727.472.51 to 5.0
Moderate erosion2,880,11142.725.01 to 10.0
High erosion707,43410.4910.01 to 15.0
Very high erosion212,6073.1515.01 to 20.0
Severe erosion306,0894.54>20.01
Table 4. Temporal variation in rainfall, erosivity, and soil loss for high, medium and low-rainfall regions of Belgavi district during drought, normal, and above normal years during 1951 to 2020.
ParametersLow-Rainfall RegionMedium-Rainfall RegionHigh-Rainfall Region
Drought YearNormal YearAbove Normal YearDrought YearNormal YearAbove Normal YearDrought YearNormal YearAbove Normal Year
% of Years
(1951 to 2020)
313930363727334126
Mean annual rainfall (mm)260 to 419430 to 618619 to 1085302 to 574594 to 826886 to 1288846 to 13971469 to 20602131 to 3505
Mean erosivity
(MJ mm ha−1 h−1 year−1)
1047 to 29932608 to 47343504 to 9396746 to 25632290 to 61223267 to 11,0905147 to 88609290 to 25,32716,698 to 73,407
Mean annual soil loss
(t ha−1 year−1)
0.1 to 0.320.3 to 0.50.37 to 0.991.1 to 3.783.4 to 6.56.0 to 11.24.9 to 8.58.0 to 15.016.3 to 30.2
Table 5. Prioritization of different in situ interventions for northern dry zone of Karnataka.
DistrictsDistrict AreaSuitable Area (% of District Area) for Different In Situ Interventions
Small PitsAdjusted Contour/Graded BundsRidge and FurrowCompartmental
Bunding
Contour CultivationSemi-Circular BundsConservation FurrowBroad Bed Furrow (BBF)
Belgavi1,340,860.86.115.525.210.919.110.235.26.1
Davengere595,480.61.82.24.219.835.98.961.25.2
Bellary845,086.36.87.910.318.717.314.643.80.0
Vijayapura1,052,237.94.63.18.68.616.331.747.424.8
Raichur845,494.514.20.61.626.433.613.061.60.0
Koppal557,498.713.83.55.622.924.022.055.60.0
Dharwad428,481.35.10.01.422.740.111.076.58.2
Gadag465,183.07.73.610.519.230.325.351.11.3
Bagalkot658,136.89.018.624.814.219.615.836.00.0
Total678,8459.87.57.111.816.824.316.949.26.1
Table 6. Validation of different in situ interventions in different villages of northern dry zone of Karnataka.
SI.No.Name of the VillageLatitudeLongitudeSoil and Water Conservation Interventions Implemented
1.Vijayapura16° 49′75° 43′In situ moisture conservation measures (compartment bunds, BBF, ridges and furrows, contour and graded bunds), farm ponds and percolation tanks
2.Kavalagi, Vijayapura 16° 48′75° 45′In situ moisture conservation measures (compartment bunds, BBF, ridges and furrows), farm ponds
3.Honnutagi, Vijayapura16° 45′75° 50′In situ conservation measures (compartment bunds, BBF, furrows and ridges, graded bunds), farm ponds
4.Hegdyal, Vijayapura16° 44′75° 49′In situ moisture conservation measures (compartment bunds, BBF, ridges and furrows), farm ponds
5.Honwad, Vijayapura16° 48′75° 25′In situ moisture conservation measures (compartment bunds, BBF, ridges and furrows, graded bunds), farm ponds
6.Hullur, Gadag15° 44′75° 40′In situ moisture conservation measures (compartment bunds, BBF, ridges and furrows, graded bunds), farm ponds
Note(s): Source, AICRPDA Centre, Vijayapura.
Publisher’s Note: MDPI stays neutral with regard to jurisdictional claims in published maps and institutional affiliations.

