Article

Advancing Sustainability Through Industrial Symbiosis: A Technoeconomic Approach Using Material Flow Cost Accounting and Cost–Benefit Analysis

1
CIRCE—Technology Center for Energy Resources and Consumption, Parque Empresarial Dinamiza, 50018 Zaragoza, Spain
2
RISE Research Institutes of Sweden, SE-412 58 Göteborg, Sweden
3
Grupo Fertiberia, 28036 Madrid, Spain
4
Research Institute for Energy and Resource Efficiency of Aragón (ENERGAIA), University of Zaragoza, Campus Río Ebro, 50018 Zaragoza, Spain
5
CEMEX, 28027 Madrid, Spain
*
Author to whom correspondence should be addressed.
Sustainability 2025, 17(6), 2730; https://doi.org/10.3390/su17062730
Submission received: 4 February 2025 / Revised: 10 March 2025 / Accepted: 14 March 2025 / Published: 19 March 2025
(This article belongs to the Section Economic and Business Aspects of Sustainability)

Abstract

:
Industrial symbiosis (IS) involves transferring waste materials and/or energy flows between stakeholders to enhance resource efficiency and reduce environmental impacts. The success of these transactions depends on supply–demand matching, technical feasibility of waste integration into industrial processes, economic savings, and compliance with legal and environmental regulations. This paper presents a methodology for the technoeconomic assessment of IS projects, integrating material flow cost accounting (MFCA) and cost–benefit analysis (CBA) incorporating CAPEX and OPEX considerations. MFCA, traditionally used to identify hidden costs from inefficiencies, is adapted here to assess resource utilisation across industry networks. The methodology is applied to two real-world demo cases: a novel fertiliser production process in Escombreras (Spain), where IS focuses on process optimisation and by-product valorisation, and an IS process design in Frövi (Sweden), where CO2 and residual energy flows are exchanged between industrial sectors. The results demonstrate the potential of MFCA-CBA integration to enhance decision making in IS implementation. In Spain, process optimisation led to a 50% reduction in operating costs, whereas, in Sweden, CO2 reutilisation resulted in a 30% increase in resource efficiency. These findings highlight the economic and environmental benefits of IS and provide insights into cost allocation and pricing strategies.

1. Introduction

Industrial symbiosis (IS) solutions represent a key factor to boost circular economy models [1]. IS exchanges often involve the integration of different resource types, such as energy, water, power, carbon, by-products, or wastes [2]. Under certain circumstances, IS solutions may have a very positive impact on the overall waste and emissions reduction at the industrial park level [3] and may potentially represent a favourable business case scenario [4] for the involved stakeholders.
IS has been successfully implemented in various industrial sectors across the globe, with significant adoption in Europe, Asia, and North America [5]. The European Union actively supports IS through policies such as the EU Green Deal and the Circular Economy Action Plan [6]. Similarly, China has integrated IS principles into Eco-Industrial Parks (EIPs) to optimise waste valorisation and energy recovery [7].
IS is most commonly applied in energy-intensive industries, such as cement, chemicals, and metallurgy, where by-products like waste heat, CO2, and secondary raw materials are exchanged between companies [8,9]. Other sectors, including food processing and textiles, have also adopted IS strategies to improve waste management and valorisation, particularly in Europe and South America [10]. Despite its advantages, the global diffusion of IS remains uneven, with economic, regulatory, and technical challenges limiting widespread adoption in some regions [11].
Given the potentially high costs of waste management [12] (i.e., transportation, landfilling, and development of recycling/valorisation strategies) and the increasingly restricting legislation related to their emission [13], which imposes severe penalties on companies exceeding the permitted emission rates, IS emerges as a necessary long-term strategy for both sustainability and economic viability for stakeholders.
Waste management plays a crucial role in achieving the Sustainable Development Goals (SDGs) [14], particularly SDG 12 (Responsible Consumption and Production) and SDG 13 (Climate Action). Globally, inadequate waste disposal contributes to nearly a billion tonnes of CO2-equivalent emissions annually [15]. Furthermore, approximately 2 billion tonnes of municipal solid waste was generated worldwide in 2020 [16], with projections indicating a 70% increase by 2050 if no effective waste management strategies are implemented [17]. For companies, integrating efficient waste management strategies into industrial processes not only ensures regulatory compliance but also reduces operational costs and enhances resource efficiency, aligning with the principles of industrial symbiosis [18]. By facilitating the exchange and valorisation of waste streams, IS contributes directly to these sustainability objectives while promoting economic and environmental benefits [19].
Despite the growing interest in IS, there is still a lack of standardised frameworks capable of simultaneously assessing environmental and economic benefits. Existing methodologies tend to evaluate these aspects separately, making it difficult for industry stakeholders to identify cost-effective and sustainable symbiotic opportunities. A comprehensive approach that integrates both dimensions is needed to ensure that IS initiatives are not only environmentally beneficial but also financially viable.
However, the need to upgrade waste flows for their use as raw materials in other processes often requires investments in technological solutions for their treatment and enhancement [20,21]. Together with this, the varying interests of different companies and site-specific regulations hinder the implementation of several IS relations [22]. Furthermore, the available methodologies to assess the technoeconomic viability of IS solutions are frequently uncertain [23], given that each IS framework and solution has its specific characteristics. This hinders the adoption of generic tools [24] and methods [25] and the establishment of general guidelines to evaluate potential IS opportunities and assess price exchange agreements [26].
The problem addressed in this research is the lack of standardised methodologies for assessing the technoeconomic feasibility of industrial symbiosis (IS) initiatives. Current tools often focus on either environmental (e.g., LCA) or financial aspects (e.g., CBA) but fail to integrate both dimensions comprehensively. Additionally, uncertainties in waste valorisation costs, regulatory constraints, and the variability of IS partnerships create significant barriers to implementation. This study proposes an integrated approach combining material flow cost accounting (MFCA) with CBA to enhance decision making and facilitate the adoption of IS solutions.
This work aims to bridge this gap by developing a comprehensive framework that integrates MFCA and CBA to support decision making in IS implementations. By applying this methodology to two different symbiosis systems—one focused on process optimisation and by-product valorisation (Escombreras, Spain) and another on intersectoral reuse of CO2 and energy flows (Frövi, Sweden)—we assess its effectiveness in quantifying economic and environmental trade-offs, enabling more informed and sustainable industrial strategies.
Typically, a cost–benefit analysis (CBA) for industrial processes consists of the estimation of capital costs (CAPEX), operating costs (OPEX), and revenue based on technical and financial input parameters [27]. The main uses are the evaluation of the economic feasibility of the process [28] under a certain set of assumptions, identifying research and development (R&D) targets with the greatest potential to improve profitability, and quantifying uncertainty and potential risks [29].
Nevertheless, since IS solutions emerge from the need to valorise waste streams and avoid emissions or landfilling [30] and involve the exchange of waste, energy, and material streams among stakeholders, the sole analysis of CAPEX and OPEX for new industrial processes is not sufficient to assess their viability [31]. Apart from these expenditures, the stakeholders should fully identify and quantify the cost of the waste streams they produce, i.e., which processes are generating a waste stream and the incurred costs in monetary units for disposing of the waste stream. For this purpose, a holistic analysis of the product’s lifecycle should be considered to quantify the monetary value of the waste disposal (transport and landfilling) or valorisation using the best available techniques. In this scenario, material flow cost accounting (MFCA), which is a powerful tool employed by organisations to evaluate and track production inefficiencies, product losses, and hidden costs, emerges as a complementary resource to assess the viability of IS opportunities, as it helps to set the cost of waste material flows. MFCA not only allows waste stream owners (typically process industries) to quantify and allocate costs to their waste flows but also provides potential users of these waste streams with a structured approach to assess their economic viability and integration into new processes.
Specifically, MFCA is a tool for quantifying material and energy flows in processes or production lines in both physical and monetary units [32]. MFCA reveals the hidden costs (such as system costs, labour costs, waste management costs, and other environmental costs) of production inefficiencies and losses by putting in place an information system to track and monitor the nonproduct output (NPO) costs as well as other environmental costs. Organisations can identify the focus areas to be addressed, including essential material/energy flows, and determine what improvements and saving opportunities exist in those areas [33]. In IS, the advantage of MFCA is that it provides an overview of how the input–output efficiency of a group of industries and how the utilisation has been carried out. Furthermore, considering the technology to be applied, one can estimate the inputs and outputs of a potential industrial process or facility and assess its feasibility for implementation within an existing industry.
The outcome of this paper is, thus, the adoption of a hybrid methodology based on the traditional cost–benefit analysis (CBA) complemented by an MFCA analysis for the technoeconomic characterisation of two different IS scenarios and the evaluation of its potentials and limitations, so that it can serve as a guideline for the technoeconomic assessment of further IS scenarios.
The structure of this paper is organised as follows: Section 2 provides an overview of industrial symbiosis and its connection to MFCA in assessing resource efficiency. Section 3 defines the scope of this study and outlines the planned strategy, explaining how IS and MFCA are integrated into the analysis. Section 4 describes the MFCA methodology applied to IS, detailing its principles and implementation. Section 5 introduces the case studies under examination, illustrating real-world applications of IS. Section 6 presents the MFCA results, emphasising key performance indicators and the technoeconomic feasibility of IS solutions. Finally, Section 7 discusses the main findings, implications, and limitations, offering insights for future research and industrial applications.

2. MFCA, CAPEX, and OPEX Within Industrial Symbiosis: State of the Art

Material flow cost accounting (MFCA) has been extensively studied, focusing on its development [34], applications across various industries [35], and its integration with environmental management systems [36]. These studies have demonstrated MFCA’s effectiveness in identifying inefficiencies and improving resource utilisation.
While MFCA has been widely applied to improve cost allocation and resource management, its combination with cost–benefit analysis (CBA) in the context of industrial symbiosis remains an area of growing interest. Some studies have examined the economic aspects of industrial symbiosis [22,23,37,38], particularly regarding financial benefits from resource exchanges and waste valorisation. However, the integration of MFCA with comprehensive CAPEX and OPEX evaluations is still required to properly assess the financial viability of symbiotic industrial networks. Moreover, recent studies suggest that integrating MFCA with ISO 14052 [39] could extend its applicability beyond individual production processes, enabling a systemic approach to resource efficiency across multiple interconnected industries [40,41]. This integration enhances decision making by providing a structured framework for assessing cost flows and resource management beyond isolated company-level evaluations.
This study aims to bridge this gap by developing a methodology that combines MFCA with detailed CAPEX and OPEX analyses to evaluate industrial symbiosis opportunities. By doing so, it seeks to provide a more holistic understanding of the economic and environmental benefits achievable through industrial symbiosis, thereby offering a valuable tool for decision makers in pursuing sustainable industrial development.
The integration of MFCA with CAPEX and OPEX analyses is crucial for a comprehensive assessment of industrial symbiosis initiatives. MFCA provides detailed insights into material and energy flows, highlighting inefficiencies and potential cost savings. However, without considering the capital and operational expenditures associated with implementing symbiotic exchanges, the financial feasibility of such initiatives remains uncertain. Incorporating CAPEX and OPEX analyses allows for a thorough evaluation of the investments required and the operational costs involved, ensuring that the proposed symbiotic relationships are both economically viable and environmentally beneficial.
Moreover, existing studies often focus on the environmental benefits of industrial symbiosis, such as waste reduction and resource conservation, without adequately addressing the economic implications. By integrating MFCA with CAPEX and OPEX analyses, this research offers a dual perspective, evaluating both the economic and environmental outcomes of industrial symbiosis. This holistic approach enables stakeholders to make informed decisions, balancing sustainability goals with financial considerations, and facilitates the adoption of industrial symbiosis practices on a broader scale.
To contextualise this research within the existing literature, Table 1 summarises key studies that have explored related methodologies, their focus areas, limitations, and contributions of the analysed study to advancing this field. The articles included in Table 1 were selected based on literature screening, ensuring a representative overview of the most relevant approaches in the field.
Building on the existing literature, our study contributes by developing a comprehensive methodology that integrates MFCA with detailed CAPEX and OPEX analyses within the framework of industrial symbiosis. This approach enables a thorough technoeconomic assessment of symbiotic interactions, providing a holistic understanding of the financial viability and potential cost savings achievable through industrial symbiosis. By applying this integrated methodology to real-world case studies, our research offers practical insights and guidelines for decision makers aiming to implement economically sustainable industrial symbiosis initiatives. This work addresses the identified gap in the literature by combining MFCA with CAPEX and OPEX evaluations, thereby advancing the field and supporting the pursuit of sustainable industrial development.

3. Scope of the Current Work and Strategy Planned

3.1. Model Background

Material flow cost accounting (MFCA) is a method developed from material flow analysis in the 1990s [49]. MFCA has been successfully implemented for over 20 years by several companies, particularly in Japan [50,51] and Germany [52]. In 2011, an ISO standard for MFCA was released by the International Standardization Organization [33]. Complementary standards include ISO 14052 [39], which focuses on supply chain applications, and ISO 14053 [53], providing guidance on MFCA implementation. As part of the ISO 14000 family, which focuses on Environmental Management Accounting, MFCA complements life cycle assessment (LCA) methodologies, offering a perspective for understanding the financial implications of resource inefficiencies [34].
Apart from being adopted in industry for achieving cost savings through resource efficiency, MFCA is also discussed and developed in different directions within the research community. One area of significant potential lies in its application to IS, as proposed by [54], who suggested the development of an Environmental Management Information System that adapts modularly to different companies and fosters IS development. MFCA, when integrated with other tools like LCA, plays a key role in this framework [34,39]. Additionally, MFCA supports decision making by highlighting opportunities to improve resource efficiency within processes and among stakeholders [55,56,57].

3.2. Model Description and Adaptation for IS Assessment

MFCA implementations change depending on specific contexts of its application (i.e., how a specific company is implementing this type of thinking) [58,59]. However, there are fundamental elements relevant for any use, particularly when extended to IS scenarios [58]. Traditionally, MFCA has been employed to assess existing production inefficiencies and waste-related costs in industrial processes. However, in this study, we extend its application to evaluate prospectivity, analysing potential future scenarios and alternative system designs. This approach allows us to explore how MFCA can support decision making in IS initiatives by integrating expected changes in waste and resource flows. Below, the essential aspects of the strategy planned in this work are outlined.

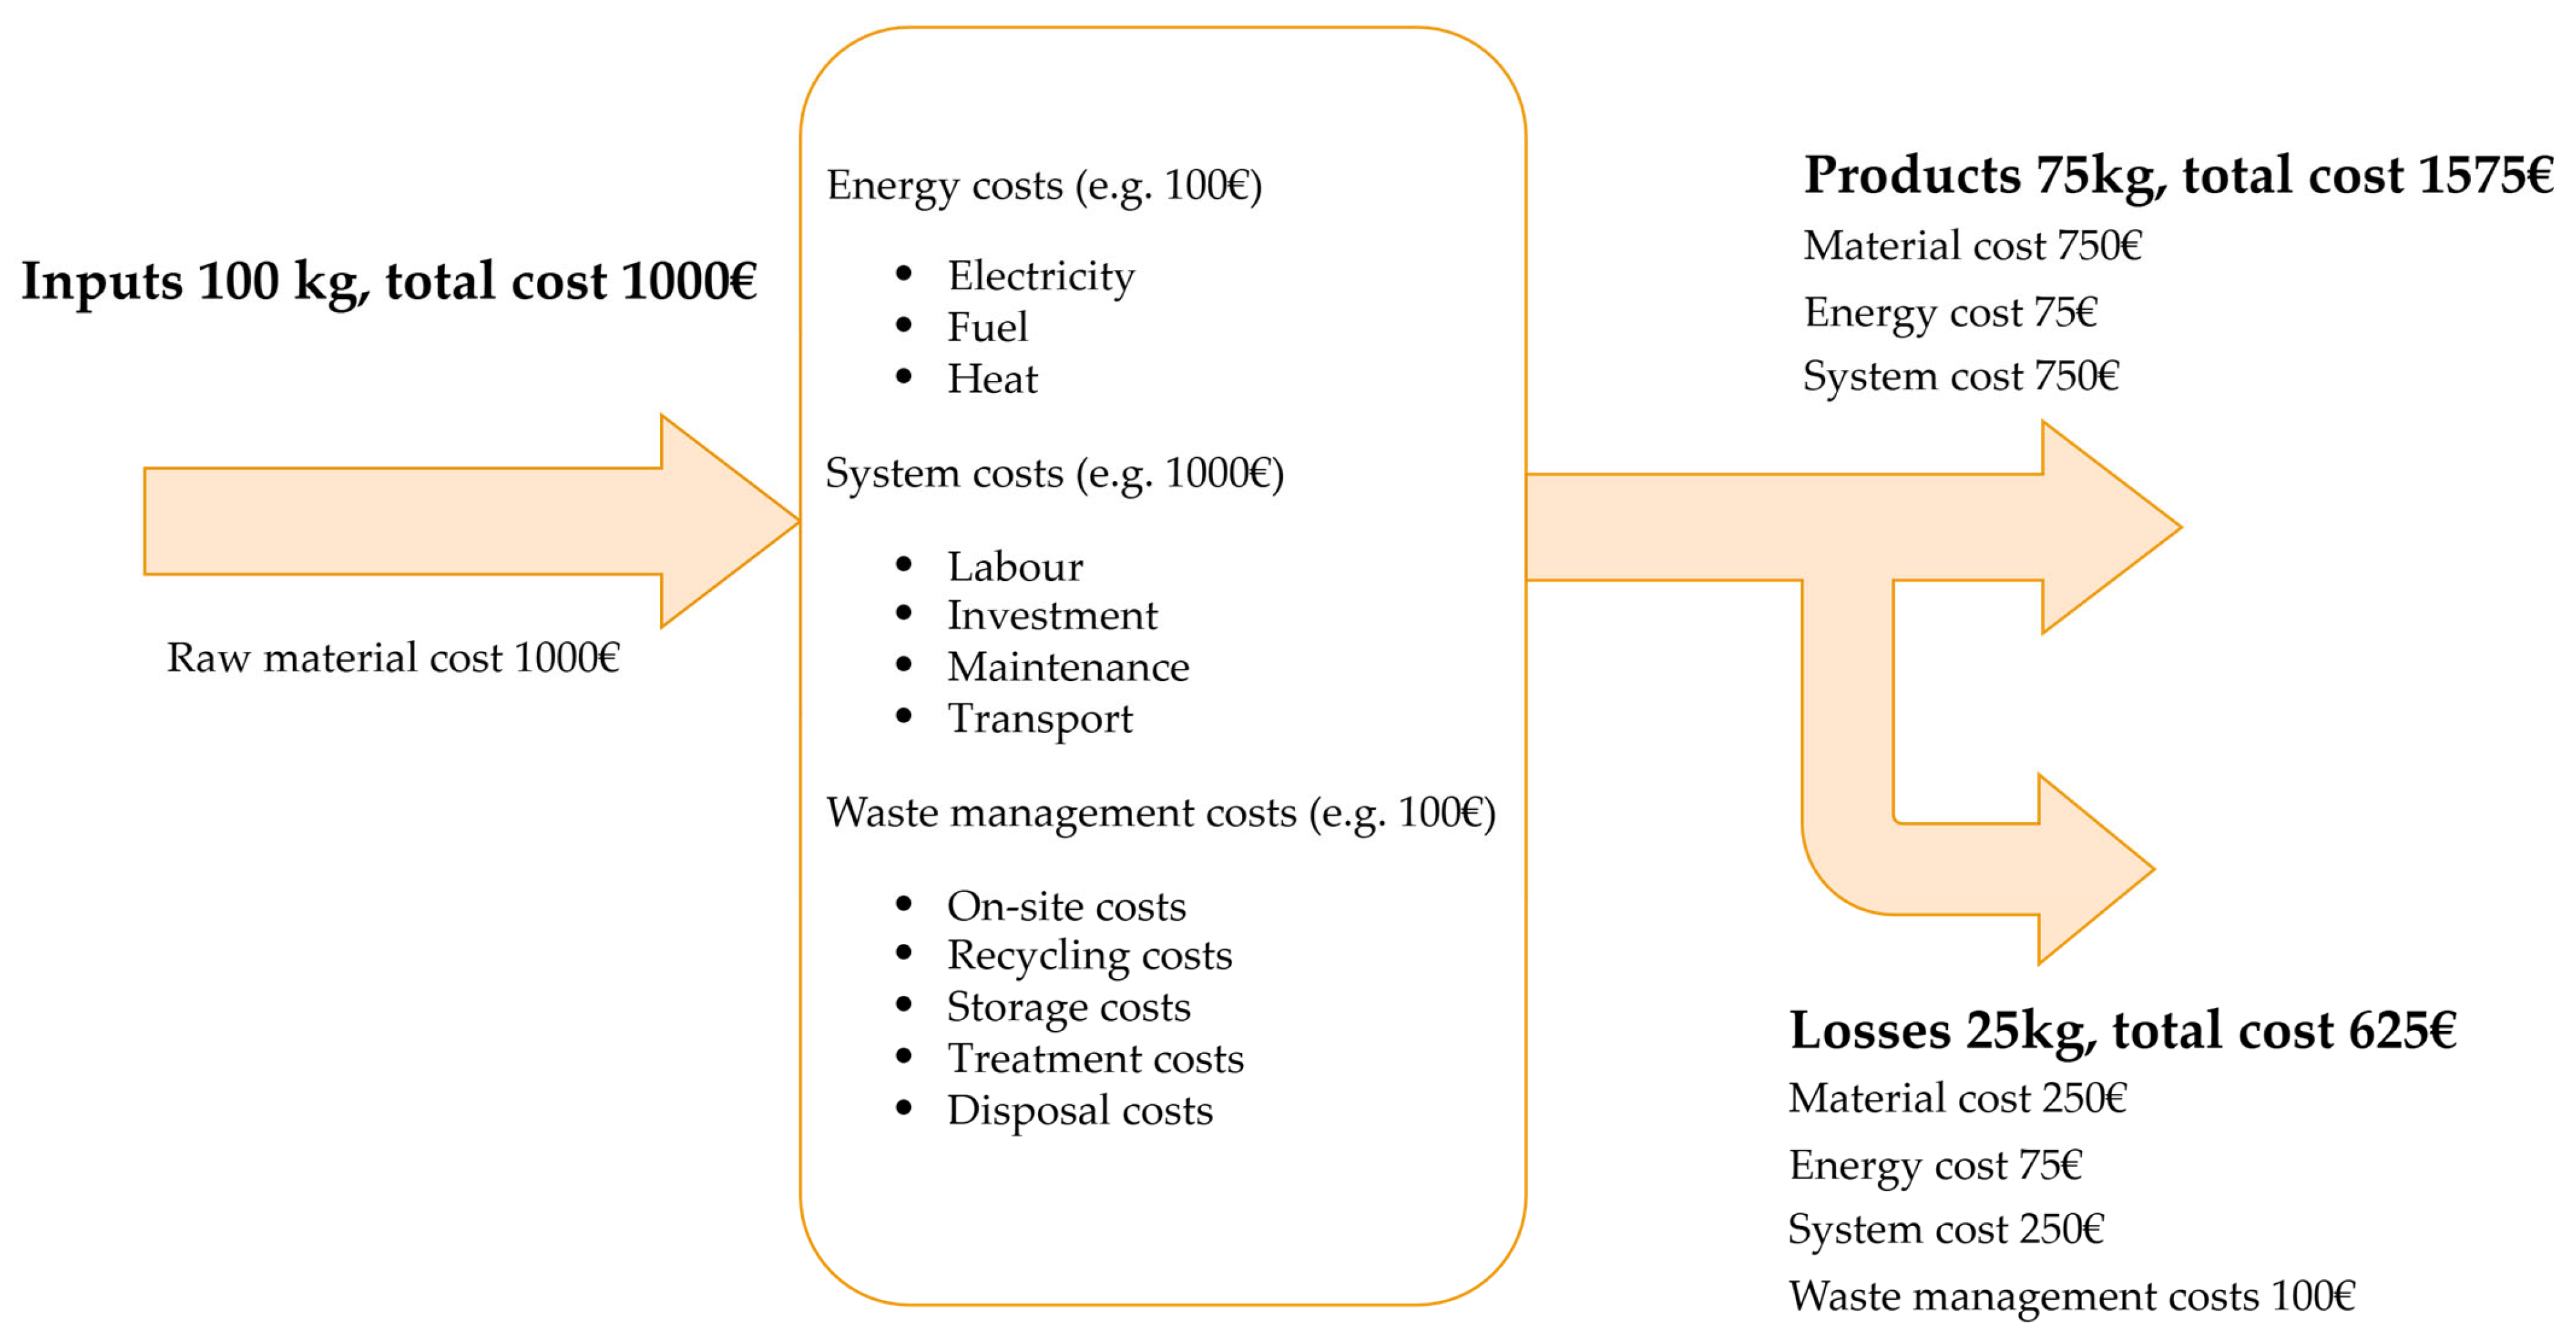
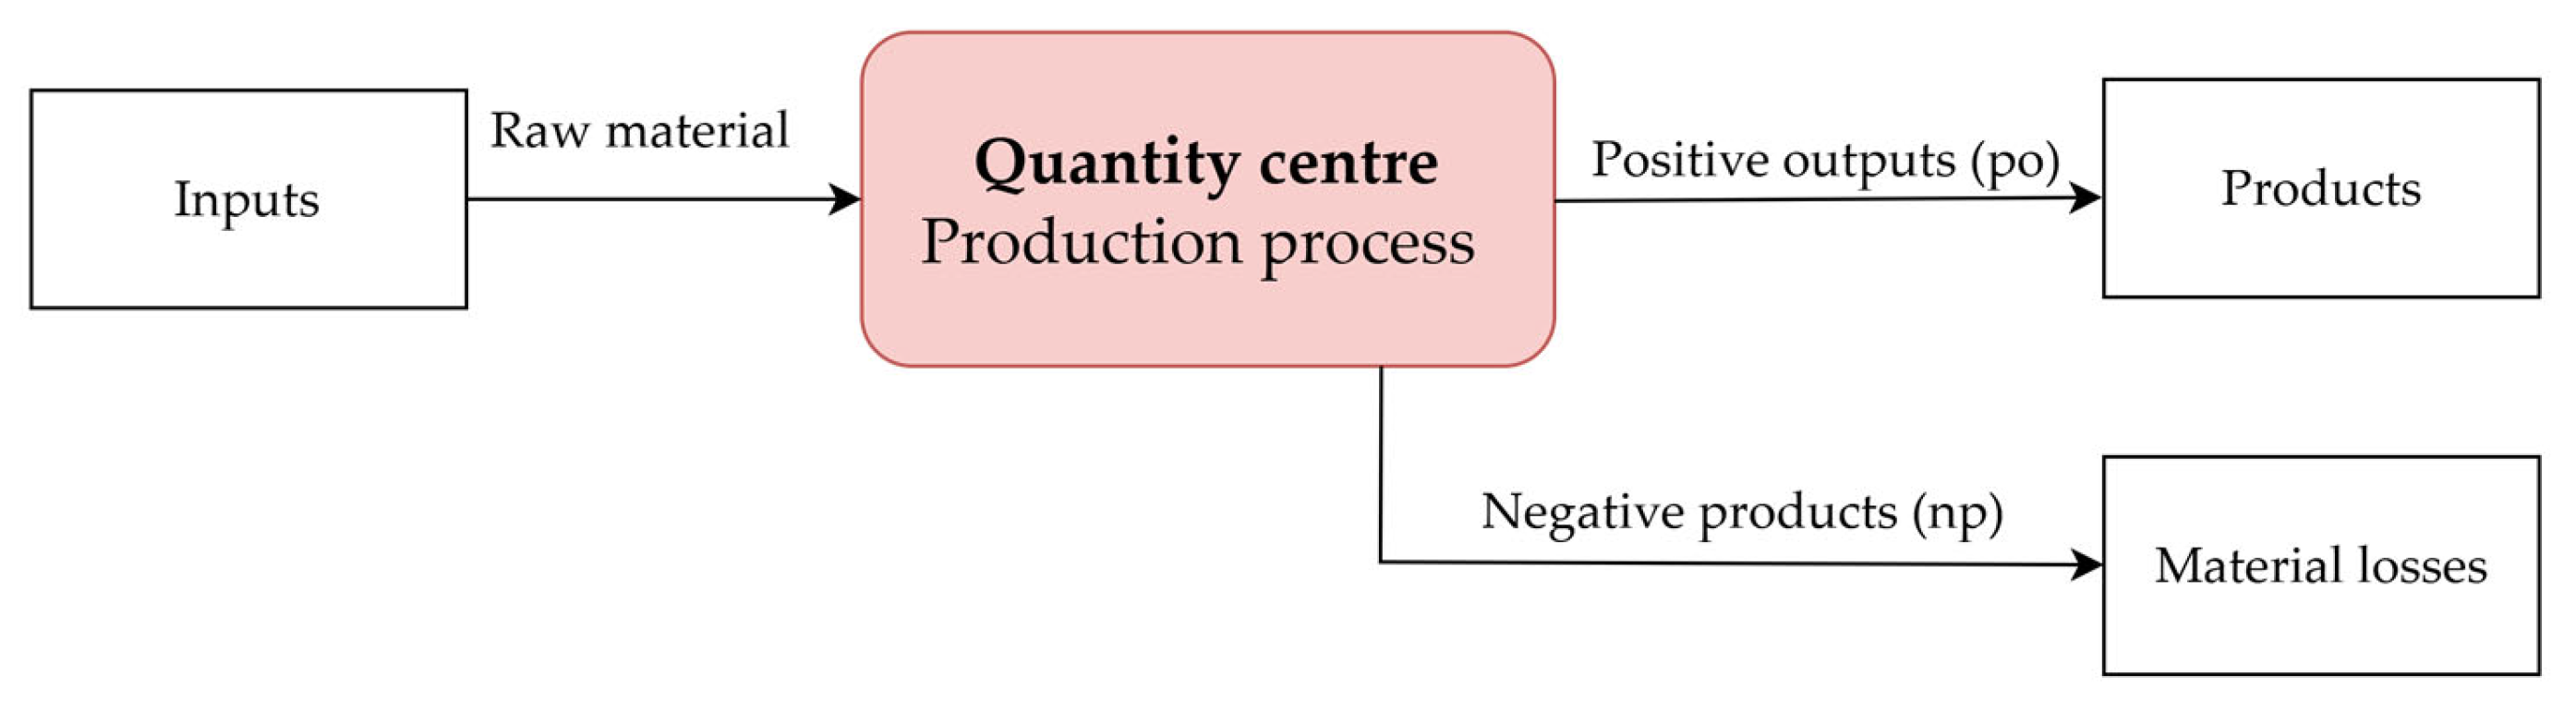
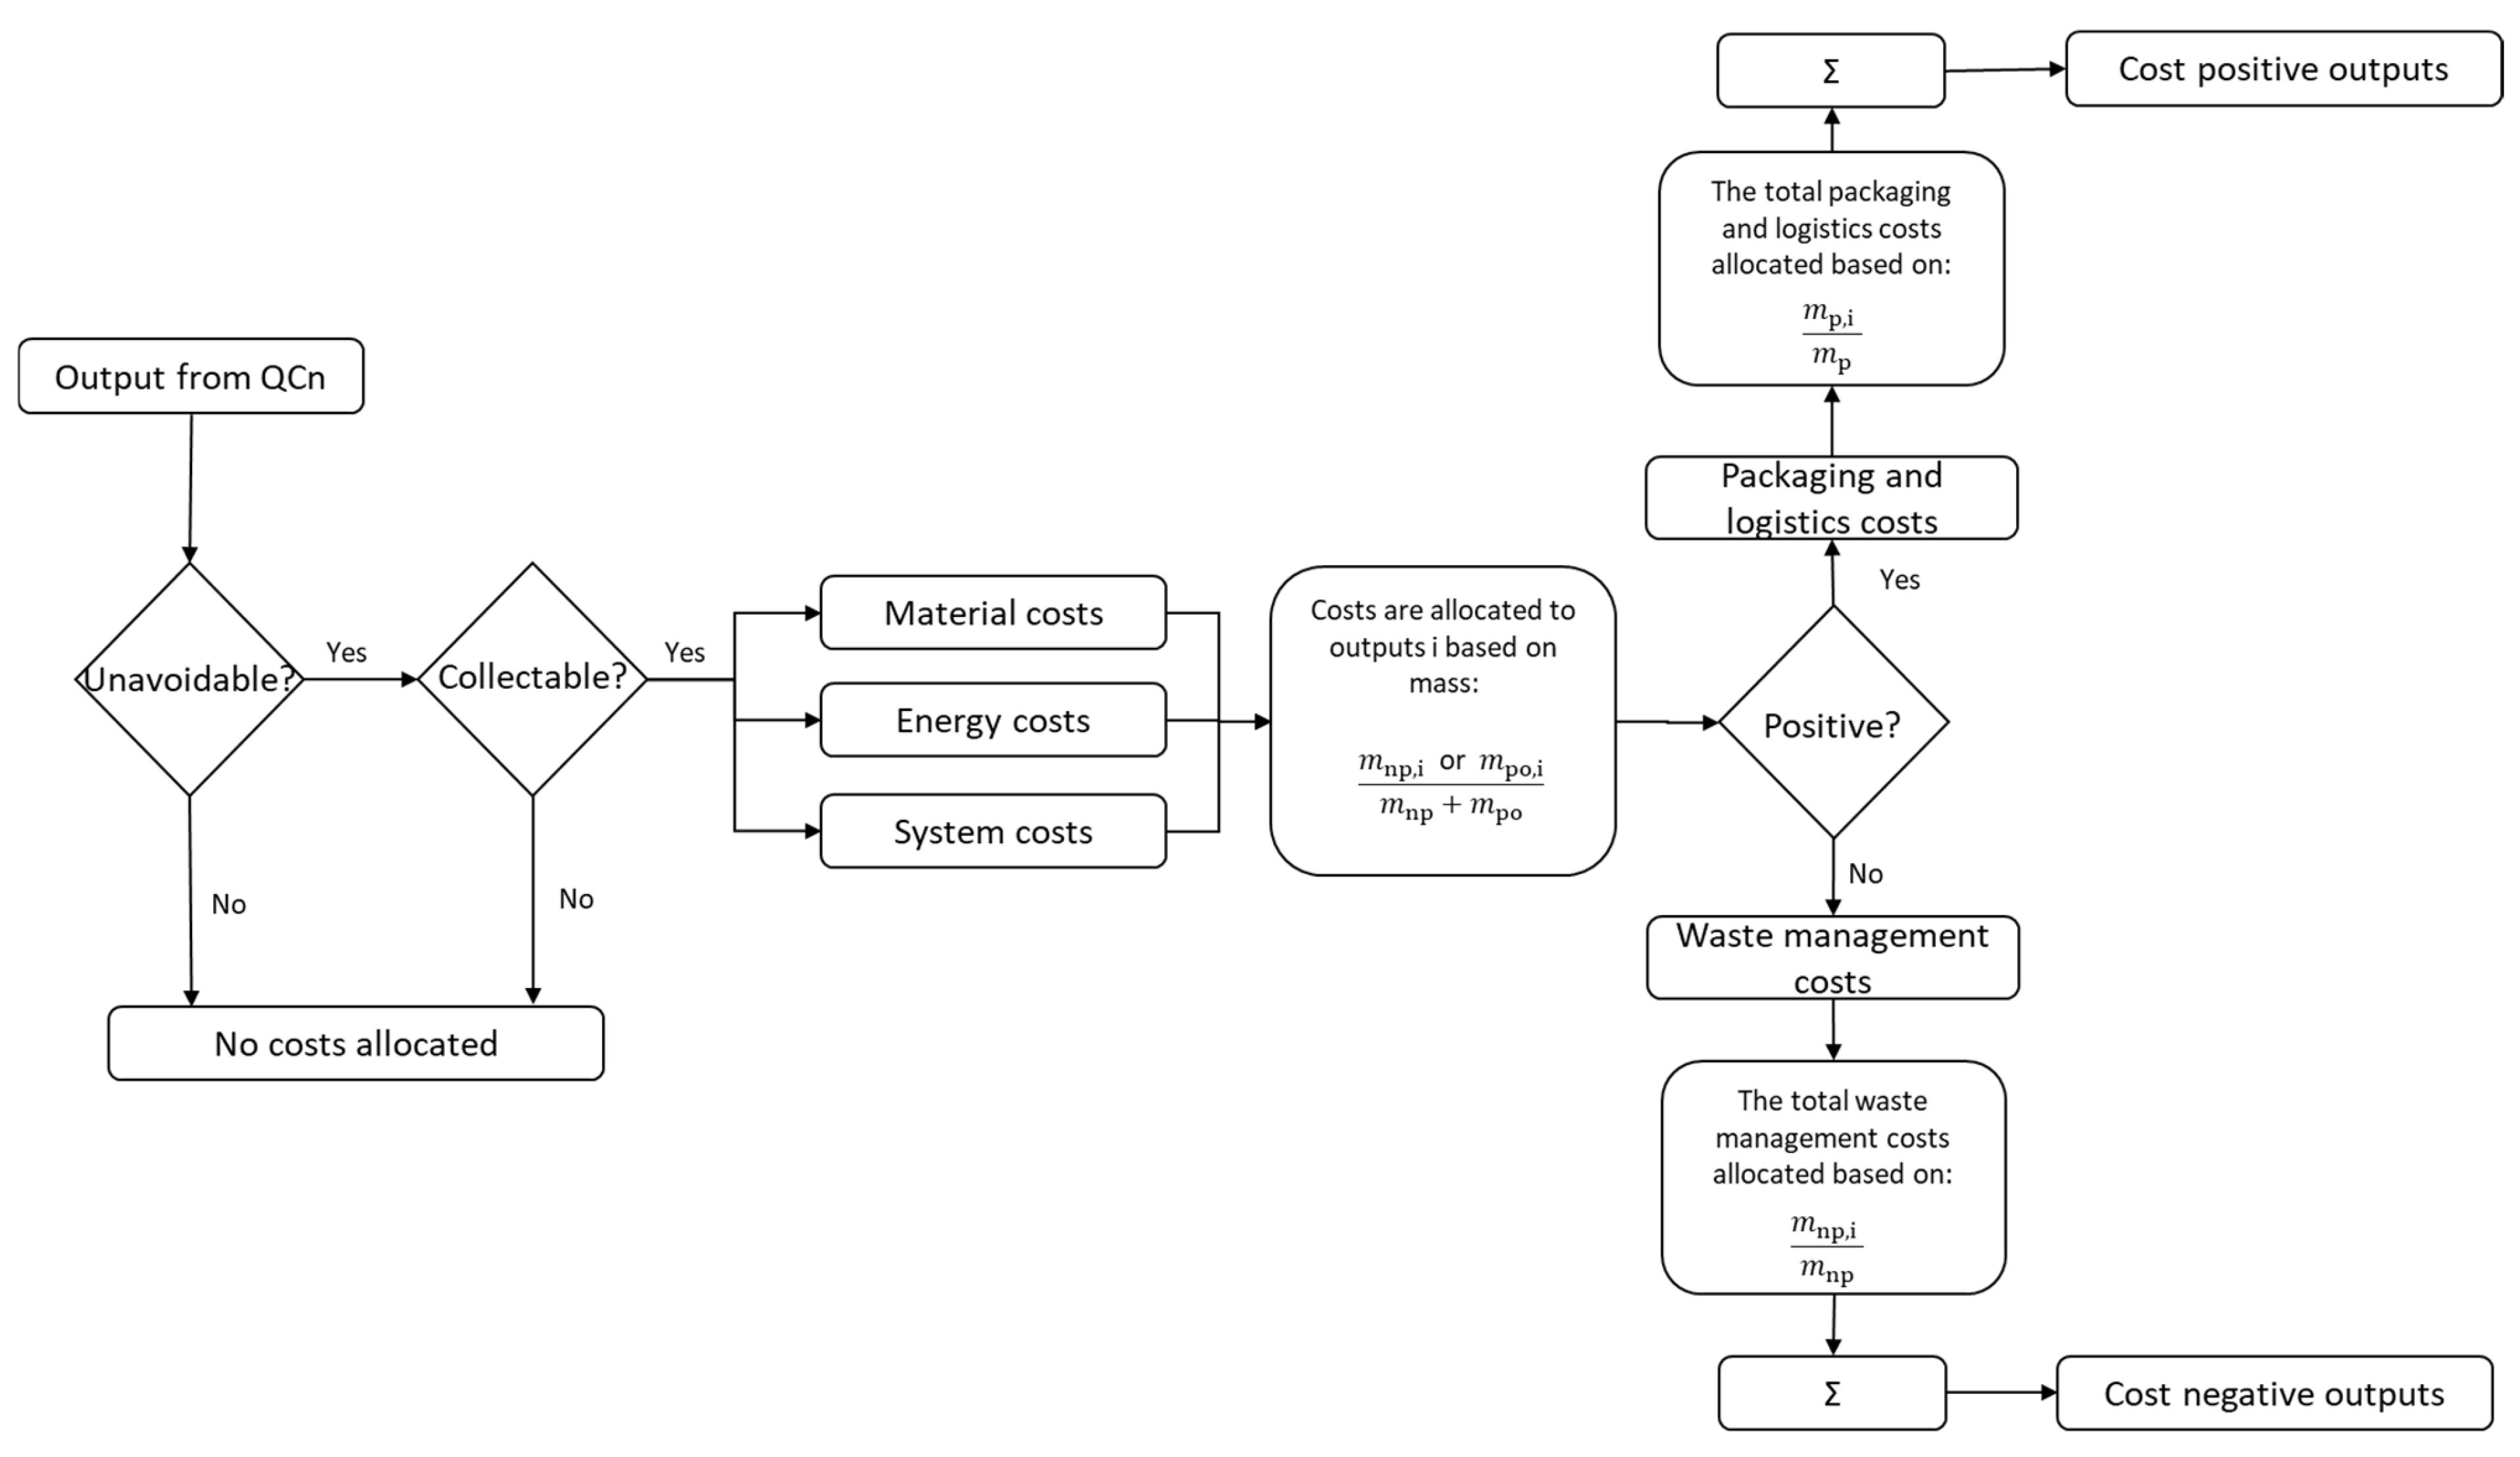
3.2.1. Quantity Centres

Defining and using quantity centres (QCs) is crucial in MFCA [33]. These are segments of a process—such as unit operations or storage points—where material and energy flows are analysed, as shown in Figure 1. They form the basis for quantifying inflows, assigning costs (e.g., labour, depreciation, maintenance, and waste management), and allocating these costs to the process outputs [59].
For IS applications, QCs can be defined at the company level rather than focusing solely on individual production units, ensuring alignment with the requirements of system-wide analysis. Instead of restricting QCs to individual processes or production steps, companies in an IS network can be considered QCs themselves, each representing a distinct node in the overall resource flow. This allows for a broader evaluation of material, energy, and waste exchanges within the network.
To accommodate multi-company symbiotic interactions, the MFCA methodology is adapted by incorporating inter-company flows into the analysis. This means that inputs and outputs are no longer confined within a single entity but extend across companies, tracking the transfer of materials, by-products, or energy. For instance, waste heat from one company may serve as an energy input for another, and this exchange must be quantified both in physical terms (e.g., MJ of energy transferred) and economic terms (e.g., cost savings for the receiving company and avoided disposal costs for the provider). By structuring the analysis at the company level, it is possible to evaluate the economic and environmental efficiency of IS networks holistically, rather than assessing individual processes in isolation.

3.2.2. Allocation Methods

Within each QC, costs are allocated between positive outputs (products or intermediates) and negative outputs (losses) (Figure 2). These costs encompass material, energy, system-related, and waste management categories (Figure 1). Allocation methods must consider the specific IS context, with options including mass-based, quality-based, or value-based distributions. Selection will be informed by the nature of the symbiotic network and expert judgment.

3.2.3. From Material and Energy Balance to Cost Balance

Similar to LCA, MFCA uses material and energy balances as a basis for cost calculations. Costs not directly tied to specific flows—such as facility-wide energy costs—are allocated using appropriate criteria tailored to the IS context. These criteria depend on the type of resource exchange and the relationships between participating industries. For instance, energy costs might be distributed based on the proportion of heat or electricity consumed by each symbiotic partner, while waste treatment costs could be assigned based on the volume or hazardous nature of the waste exchanged. In cases where by-products replace virgin materials in another process, cost allocation may follow a mass-based, quality-based, or value-based distribution, depending on the contractual agreements and economic valuation of the exchange. This methodology enables detailed tracking of cost propagation through interconnected processes within symbiotic networks.

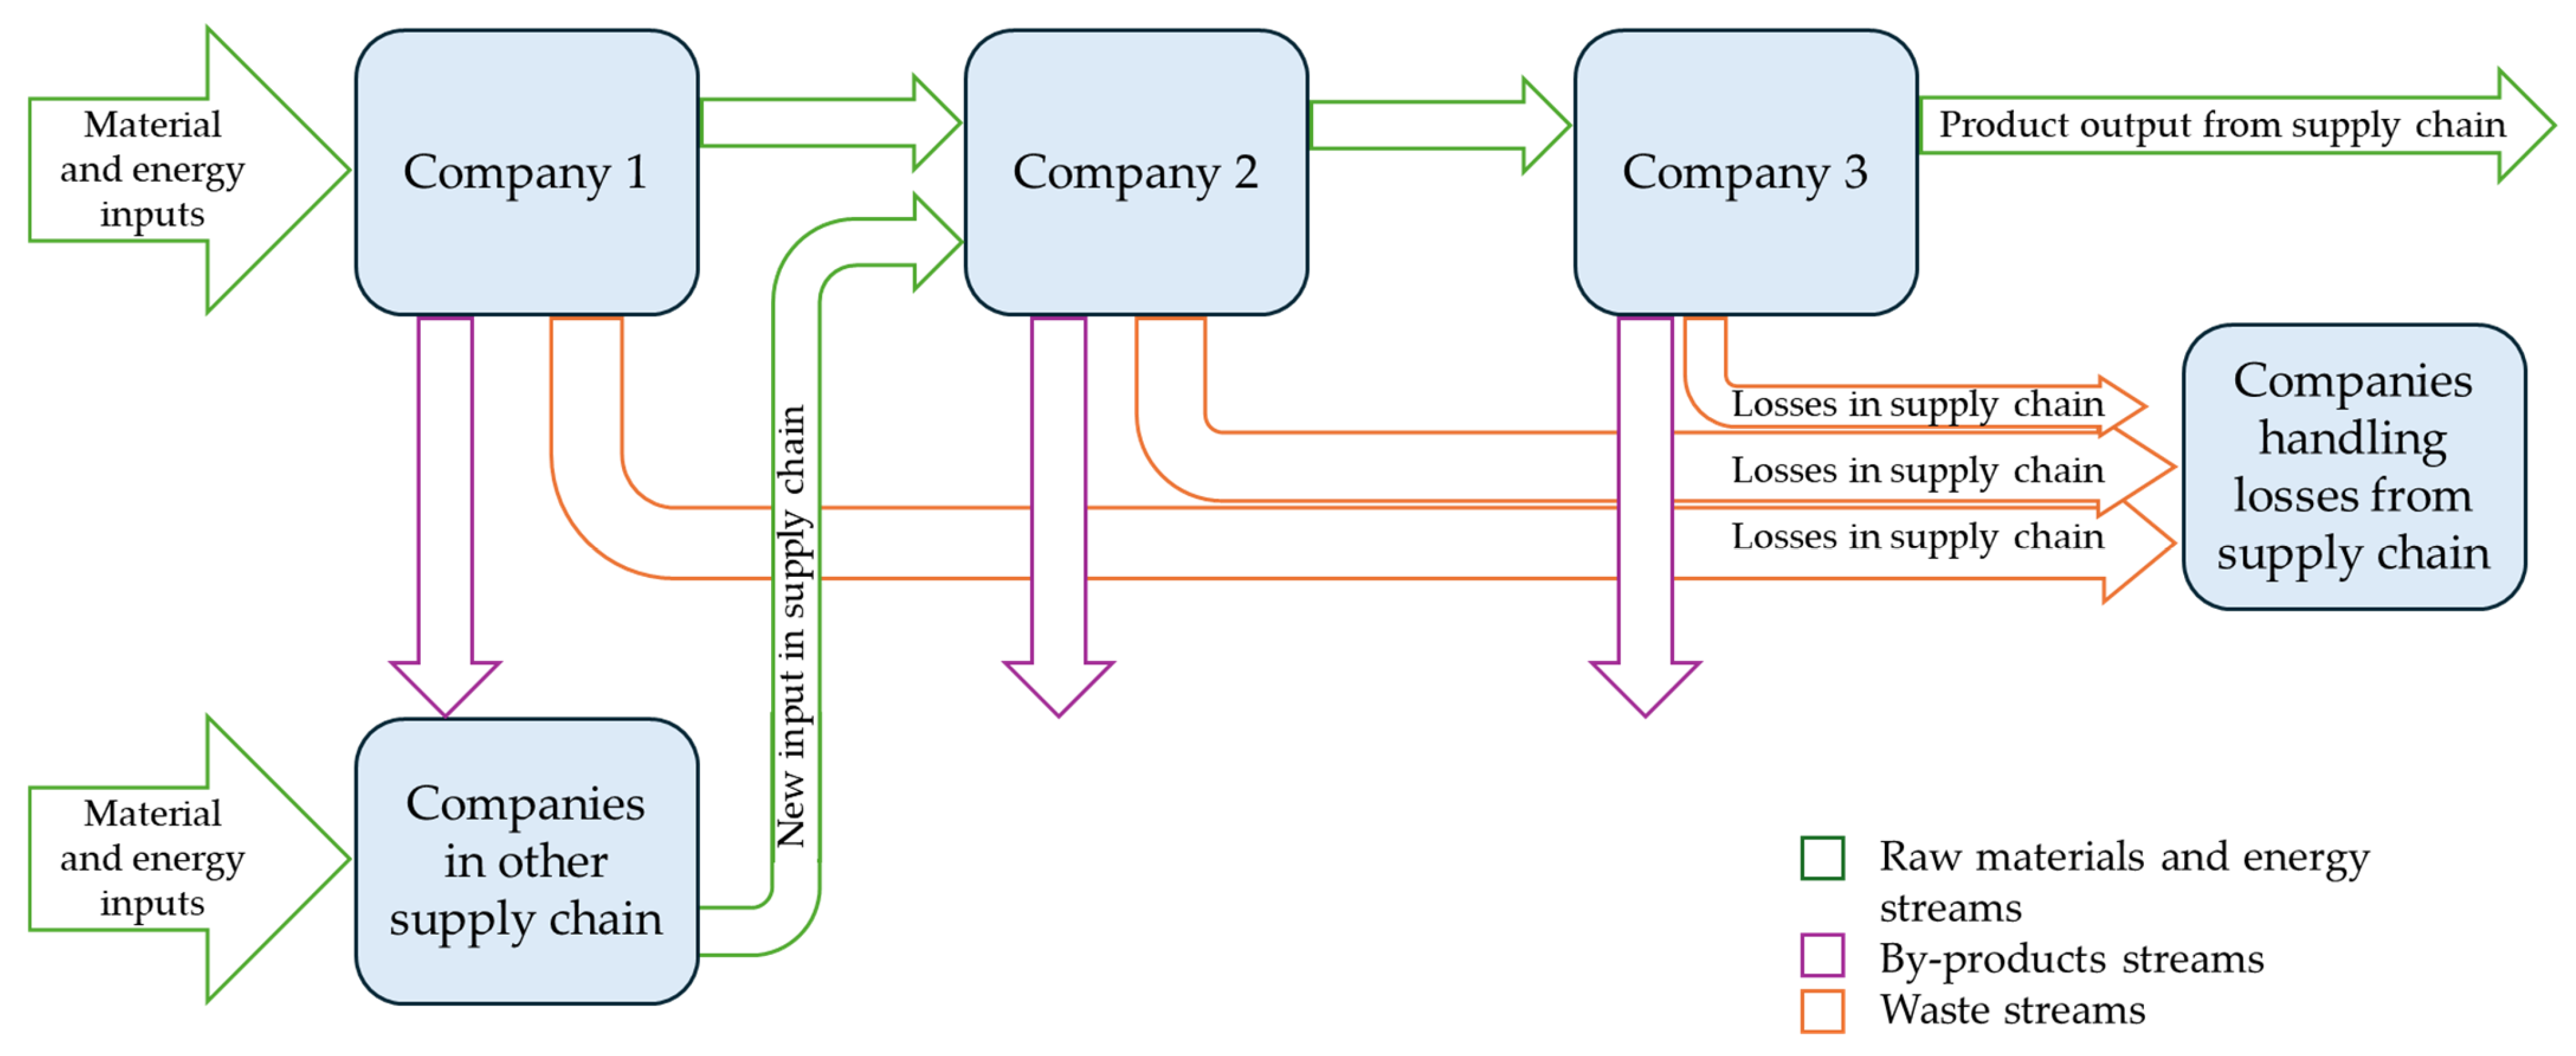
3.2.4. Expanding from Single Organisations to Interlinked Systems

Finally, a fundamental aspect of the MFCA approach which is relevant for IS scenarios is the use of the method at multiple layers of detail. Supply chain approaches for MFCA are described in the ISO 14052 standard [39] and can be used to assess the efficiency of input virgin materials to final products in a supply chain, thus creating a larger understanding of how one company’s work with resource efficiency can be connected to other actors’ decision making and strategies. Adding a symbiosis layer to this implies also connecting different supply chains and building integrated understanding of how costs flow between companies and what effect changes in, e.g., quality of raw materials in one company in one supply chain will affect the costs at other positions in that supply chain. If this is the case, the quantity centres in MFCA may involve entire companies rather than specific production processes or sets of processes within an individual company, as shown in Figure 3.

4. MFCA Methodology on IS

The methodology outlined in this section will be applied to two industrial symbiosis (IS) case studies: the Escombreras Valley (Spain) and Frövi (Sweden). It provides a structured framework for analysing and quantifying material and energy flows, assessing technoeconomic impacts, and guiding waste exchange pricing in IS systems. This approach aims to detect and trace overall losses through current and proposed processes, quantify the impact of IS actions on waste reduction, and ensure mutual economic benefits for stakeholders involved.
The experimental procedure for implementing the MFCA methodology is as follows:
  • Definition of the baseline configurations: identify the targeted processes impacted by IS actions at each demo site. For Escombreras, this includes processes within the fertiliser production chain, while, in Frövi, the focus is on utilising residual heat from the pulp and paper industry for heating a tomato greenhouse to reduce fossil fuel consumption. Check existing piping and instrumentation diagrams (P&IDs) for current processes and collect historical data where available. Set process boundaries to limit the scope of analysis to processes affected by IS upgrades. Characterise target streams in terms of material and energy flows, composition, temperature, and pressure.
  • Establishment of a block diagram: develop a diagram that includes all relevant process units and the material and energy flow connections between them. This will serve as the foundation for both demo sites to visualise their unique process interconnections.
  • Definition of quantity centres (QC): group process units into QCs that represent specific roles in the overall process. In Escombreras, QCs may include fertiliser production units, while, in Frövi, they may involve heat recovery systems and greenhouse operations.
  • Matching of flows, units, and streams characterisation: develop a matching matrix linking inflows and outflows to their corresponding processes or control units. This matrix allows for calculating losses and inefficiencies in each process stage, tailored to the operational characteristics of each demo site.
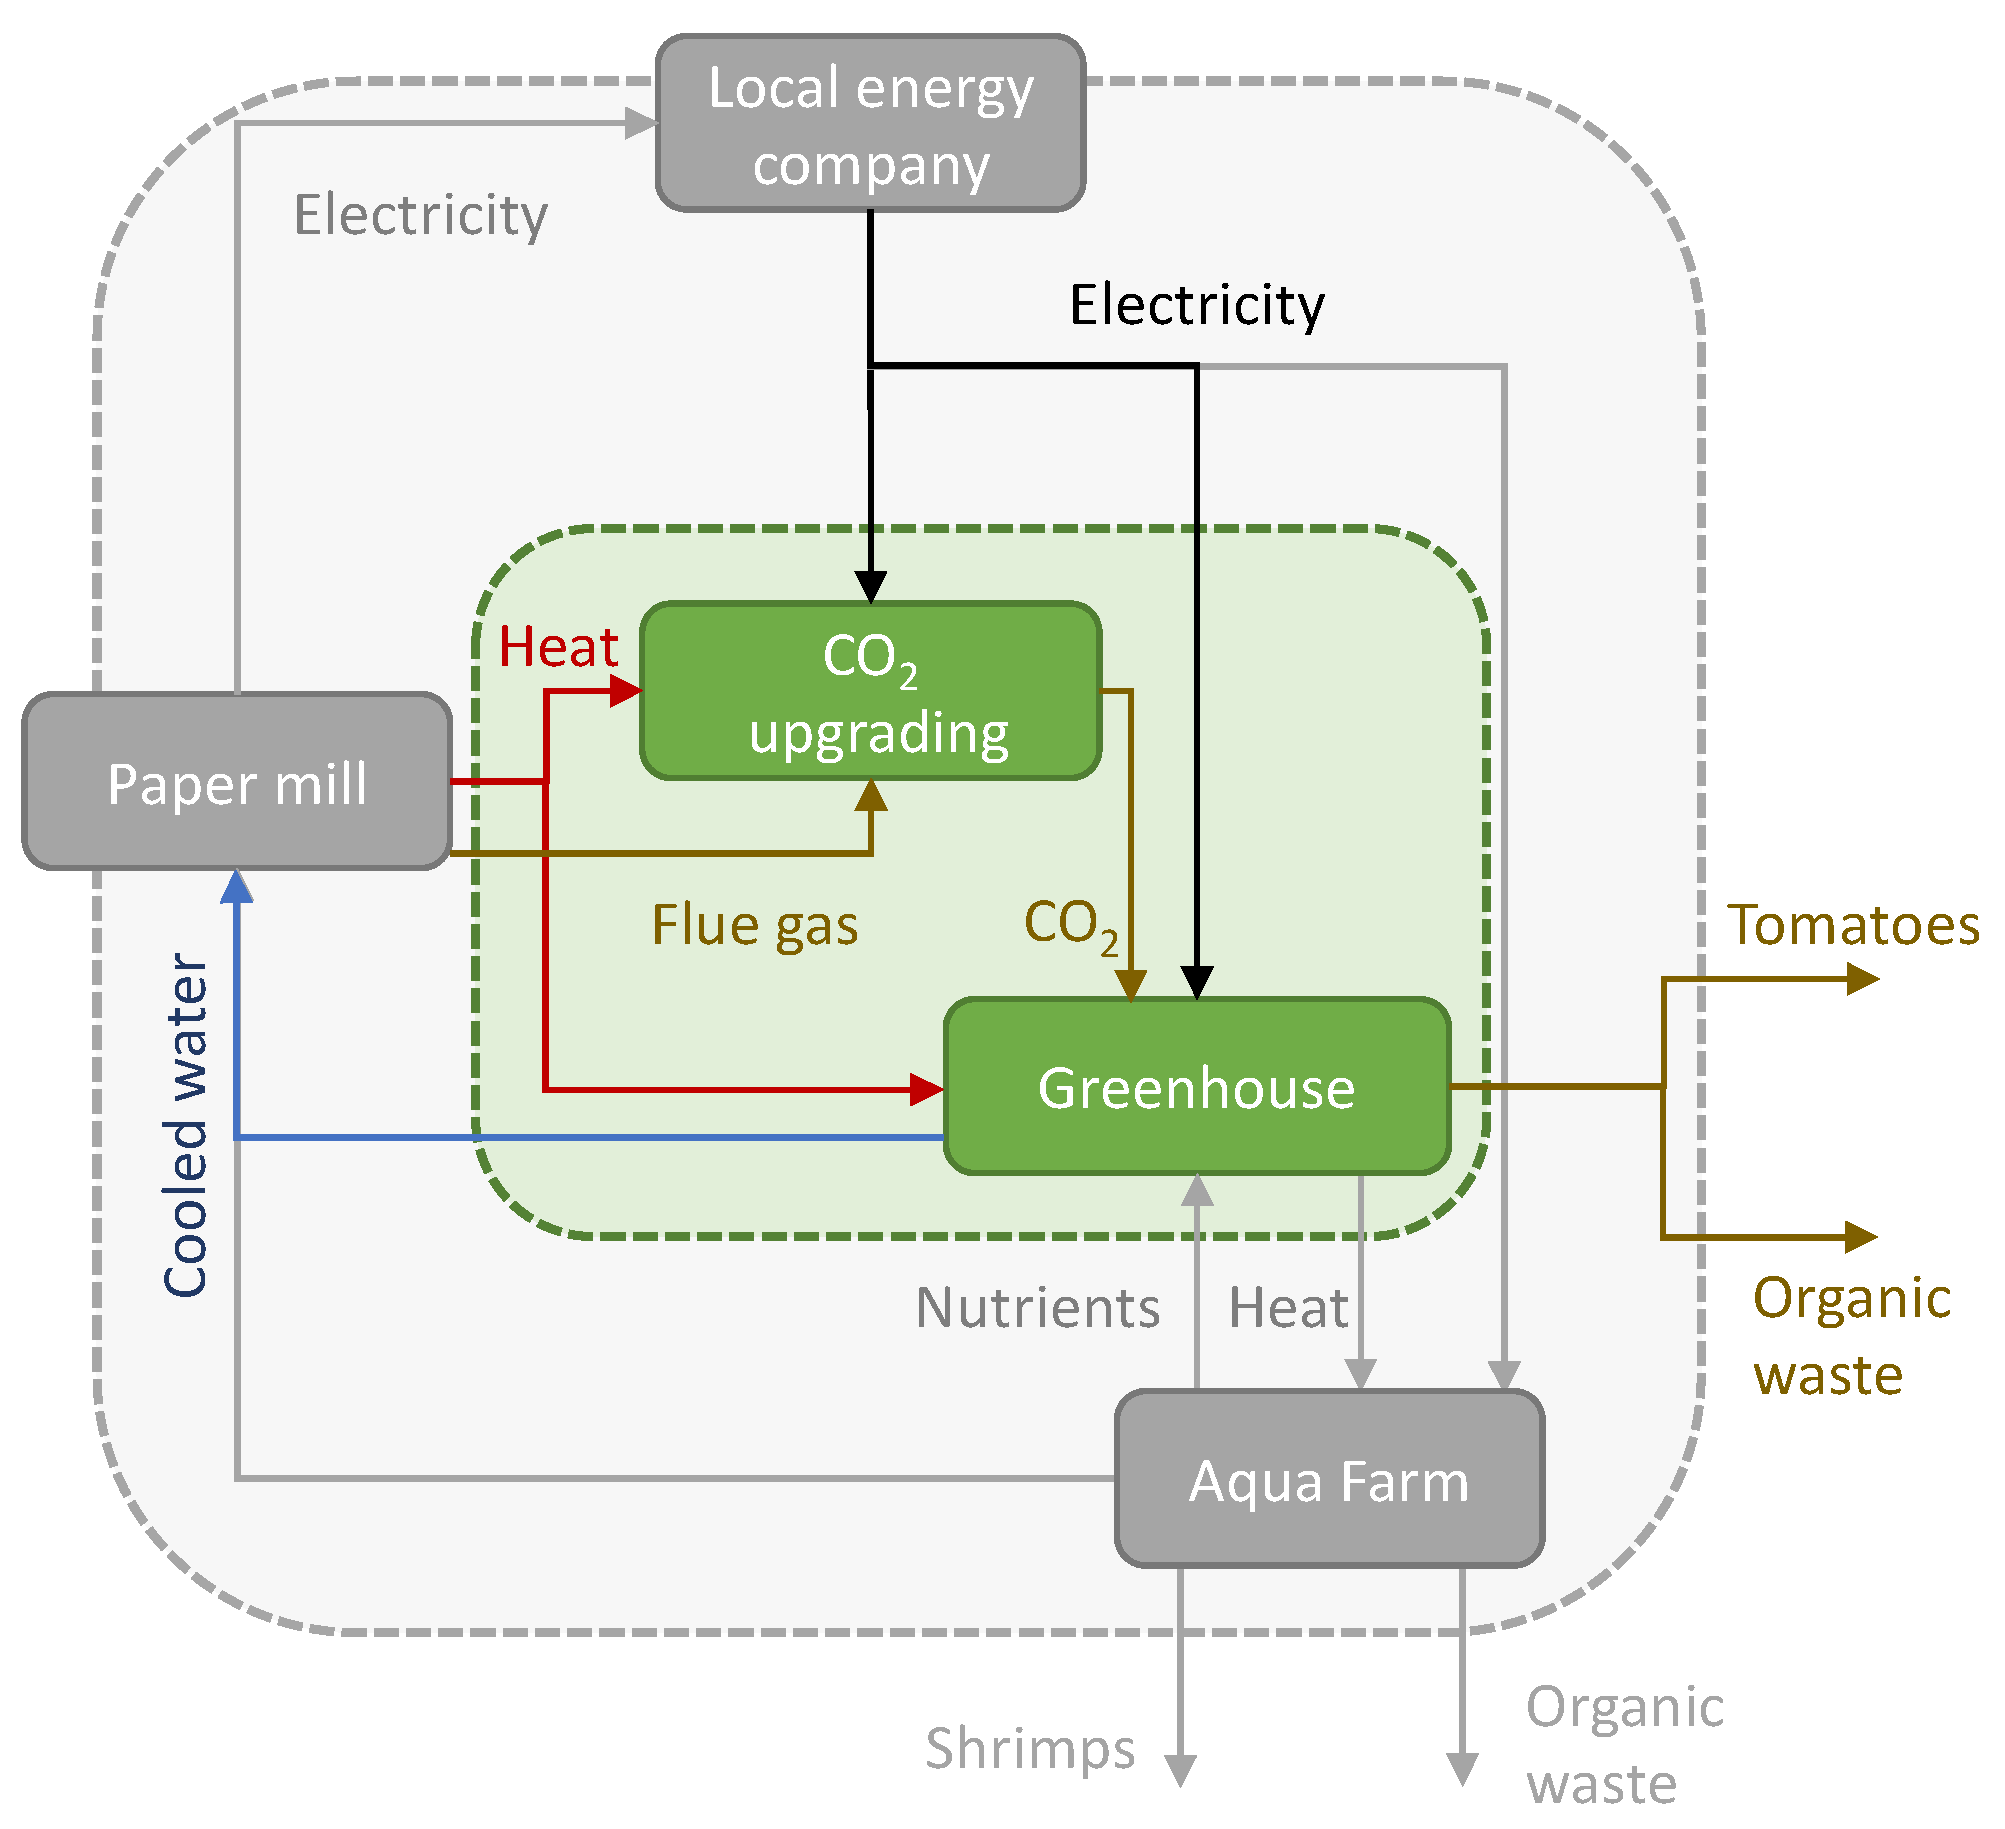
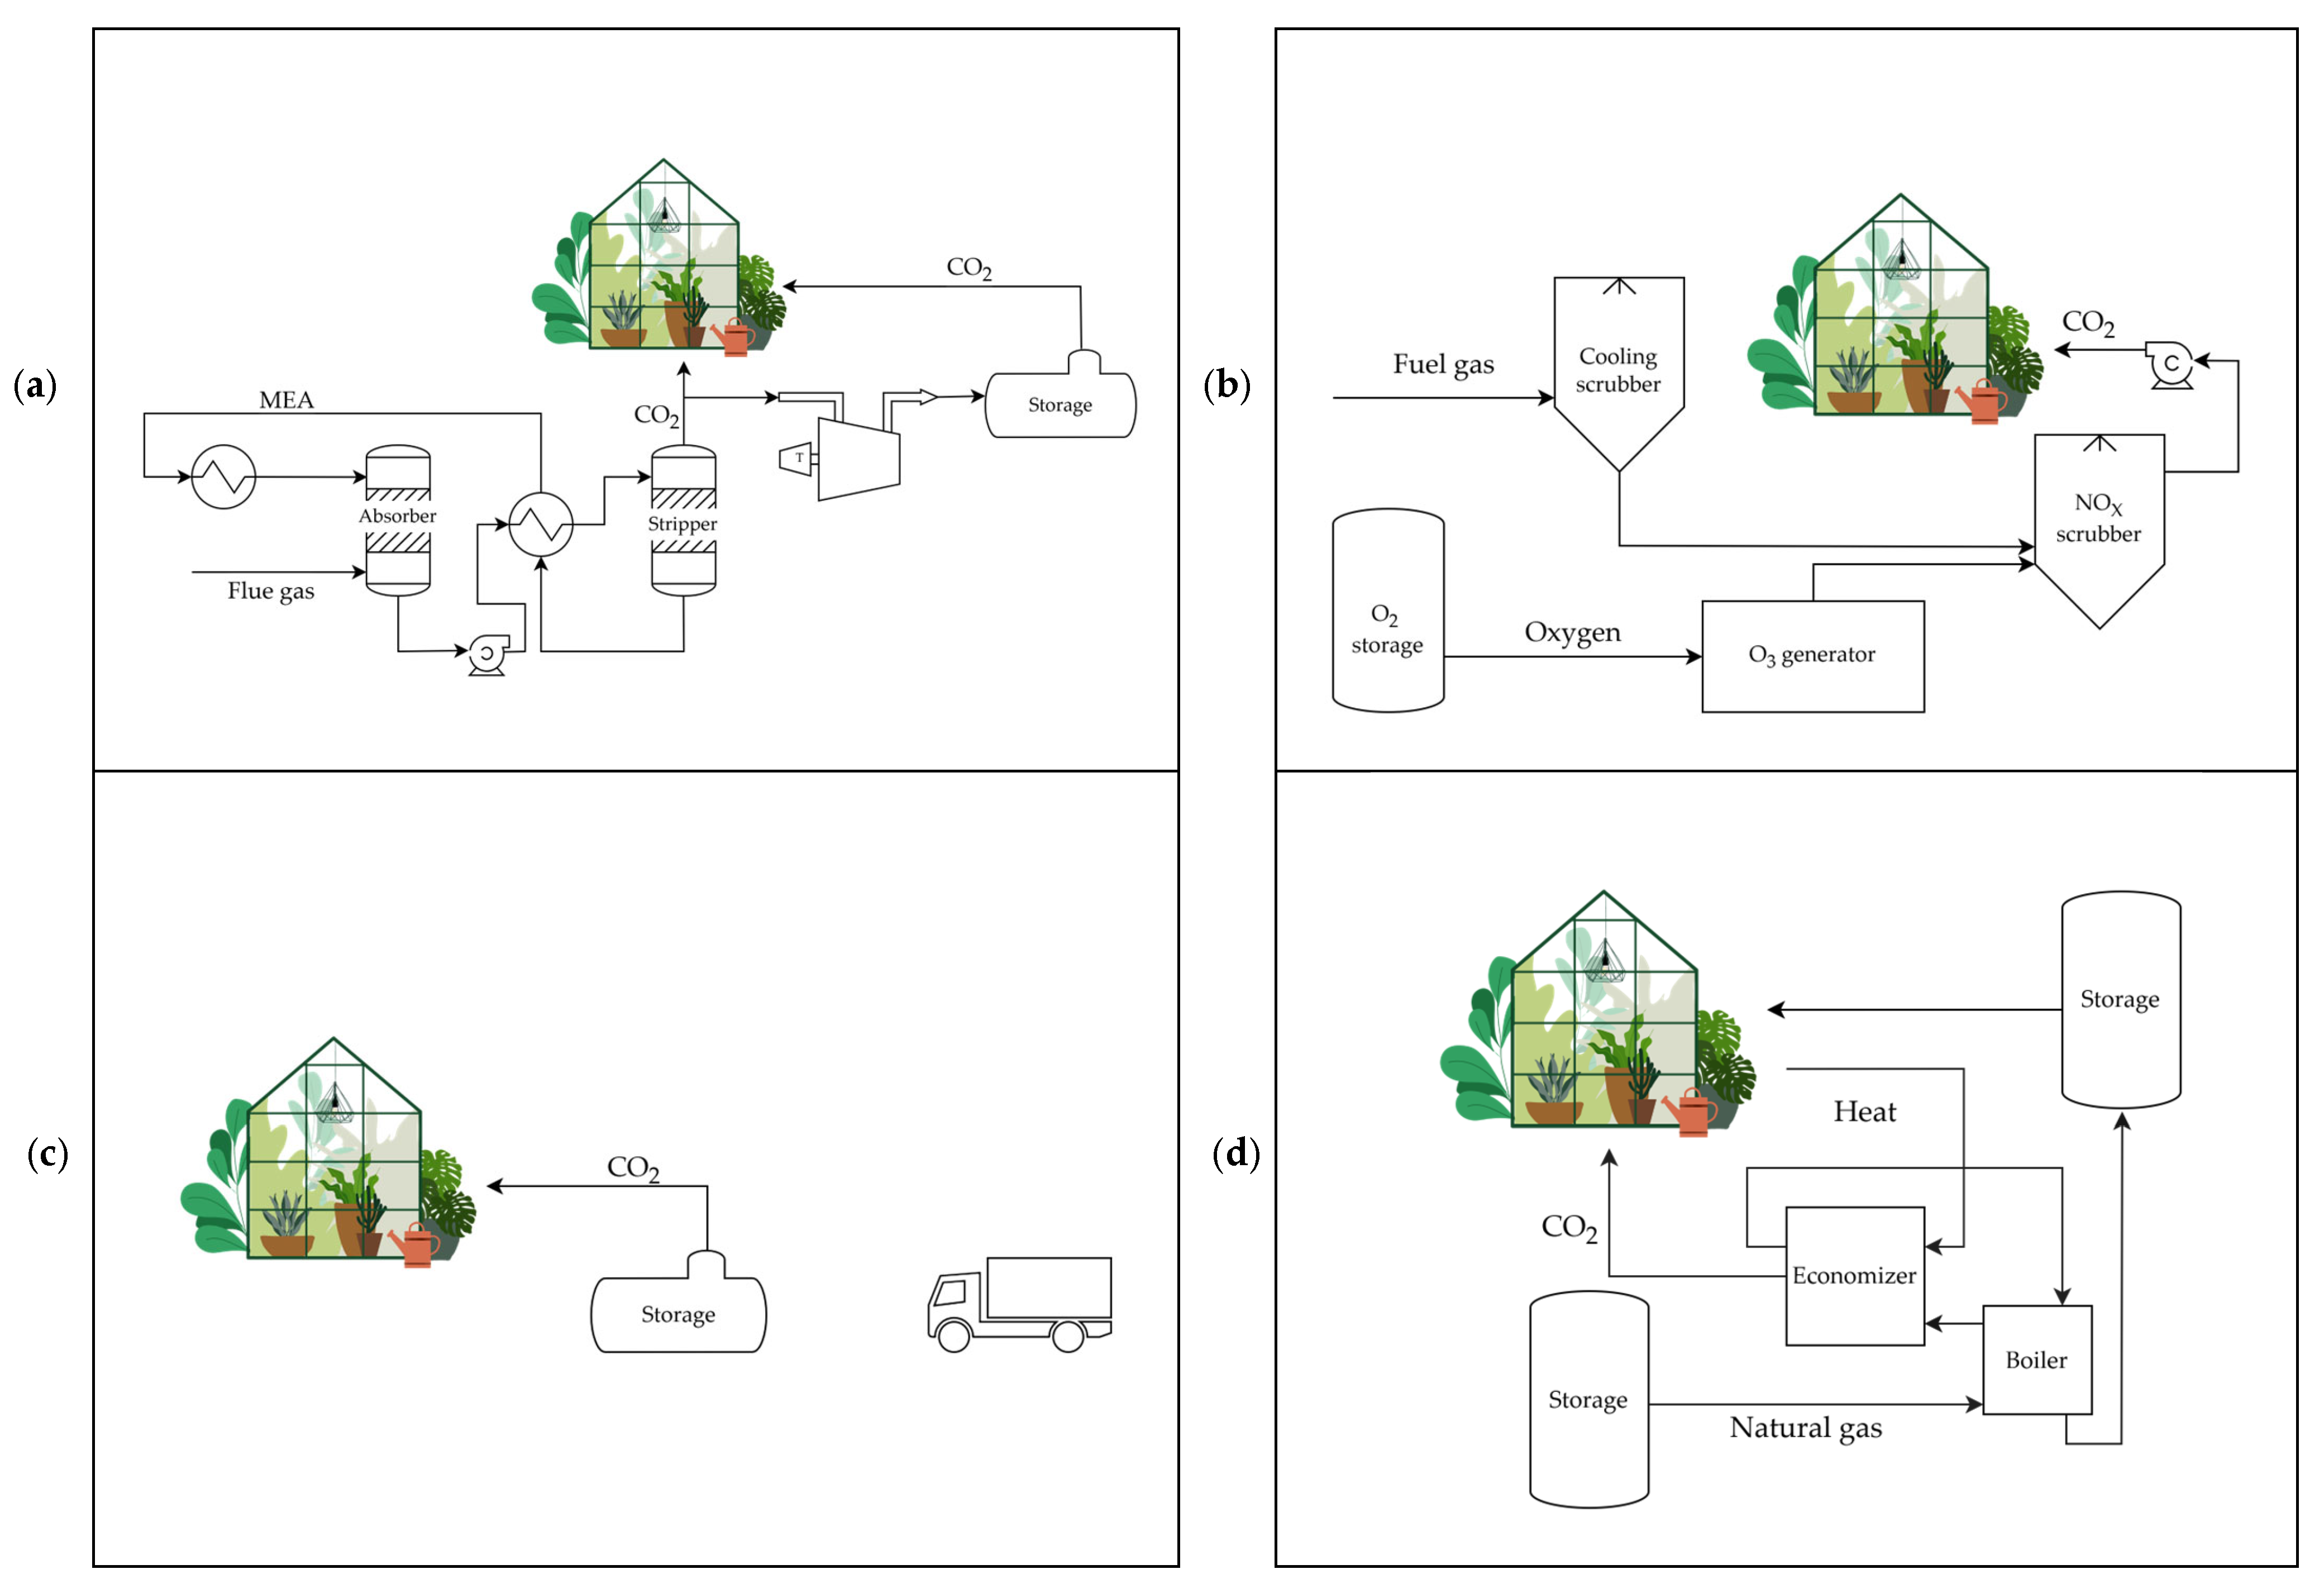
  • Identification of waste streams: use the matching matrix to identify two key outputs: (a) material losses, calculated through mass balances for each substance in a control unit. (b) Energy balances, including electrical contributions (e.g., pumping and stirring) and thermal contributions (e.g., heating and refrigeration). In Frövi, this step focused on capturing the thermal energy flow from industrial processes to the greenhouse.
  • Transformation of material loss and energy inputs into monetary units: convert material losses and energy consumption into monetary values. For Escombreras, this may include electricity costs for fertiliser production, while, in Frövi, it involves calculating the monetary value of residual heat compared to the cost of fossil fuels that would otherwise be required for greenhouse heating.
  • Characterisation of the IS solution: repeat steps 1 to 6 for the proposed IS scenarios, incorporating necessary assumptions. In Escombreras, this might involve optimising fertiliser by-products, while, in Frövi, it focuses on integrating residual heat into the greenhouse heating systems, considering potential investments in heat transfer infrastructure.
  • Reporting of MFCA results: present results using Sankey diagrams to visualise material and energy flows and their associated costs. The diagrams will highlight the cost proportions for QCs, material losses, and energy flows, aiding stakeholders in understanding process efficiency improvements.
  • Calculation of CAPEX and OPEX for the processes involved in both current and IS solutions: assess the capital and operational expenditures for both the baseline and IS scenarios. In Escombreras, this might include only partially amortised equipment, whereas, in Frövi, new investments in heat exchange and transfer systems could be evaluated.
  • Establishment of guidelines for waste materials and energy exchange pricing: couple MFCA results with traditional cost–benefit analyses (CBA) to establish pricing guidelines for waste and energy exchanges. For Frövi, this step includes evaluating the economic benefits of residual heat utilisation versus conventional fossil fuel heating costs, ensuring mutually beneficial agreements for all stakeholders involved.

5. Overview of IS Case Studies

Spain and Sweden were intentionally selected as case studies to explore IS feasibility under different industrial conditions. Spain’s industrial landscape, particularly in the chemical sector, faces challenges related to high energy consumption and by-product management, with IS playing a key role in optimising resource use within existing production processes. In contrast, Sweden’s regulatory framework actively promotes industrial decarbonisation and waste valorisation, creating an environment conducive to designing new IS frameworks from the outset. These differences provide complementary insights into IS implementation, allowing us to assess how symbiosis can be applied both as an incremental improvement in existing industries and as a planned strategy in emerging IS networks.

5.1. Spanish Demo-Site Description

The IS activities at Escombreras valley, Spain, are based on the process upgrades carried out at the industrial site of Química del Estroncio (QSr), a fertiliser company within the Fertiberia Group. QSr is specialised in the production of a wide range of fertilisers and industrial products, with its primary focus on manufacturing strontium-based salts. Recently, the production of potassium nitrate (KNO3) has been gaining strategic importance due to its increasing market demand [60]. The existing production facilities allow the production of different fertilisers to be adapted based on their seasonal demand.
The current KNO3 production is limited by several factors:
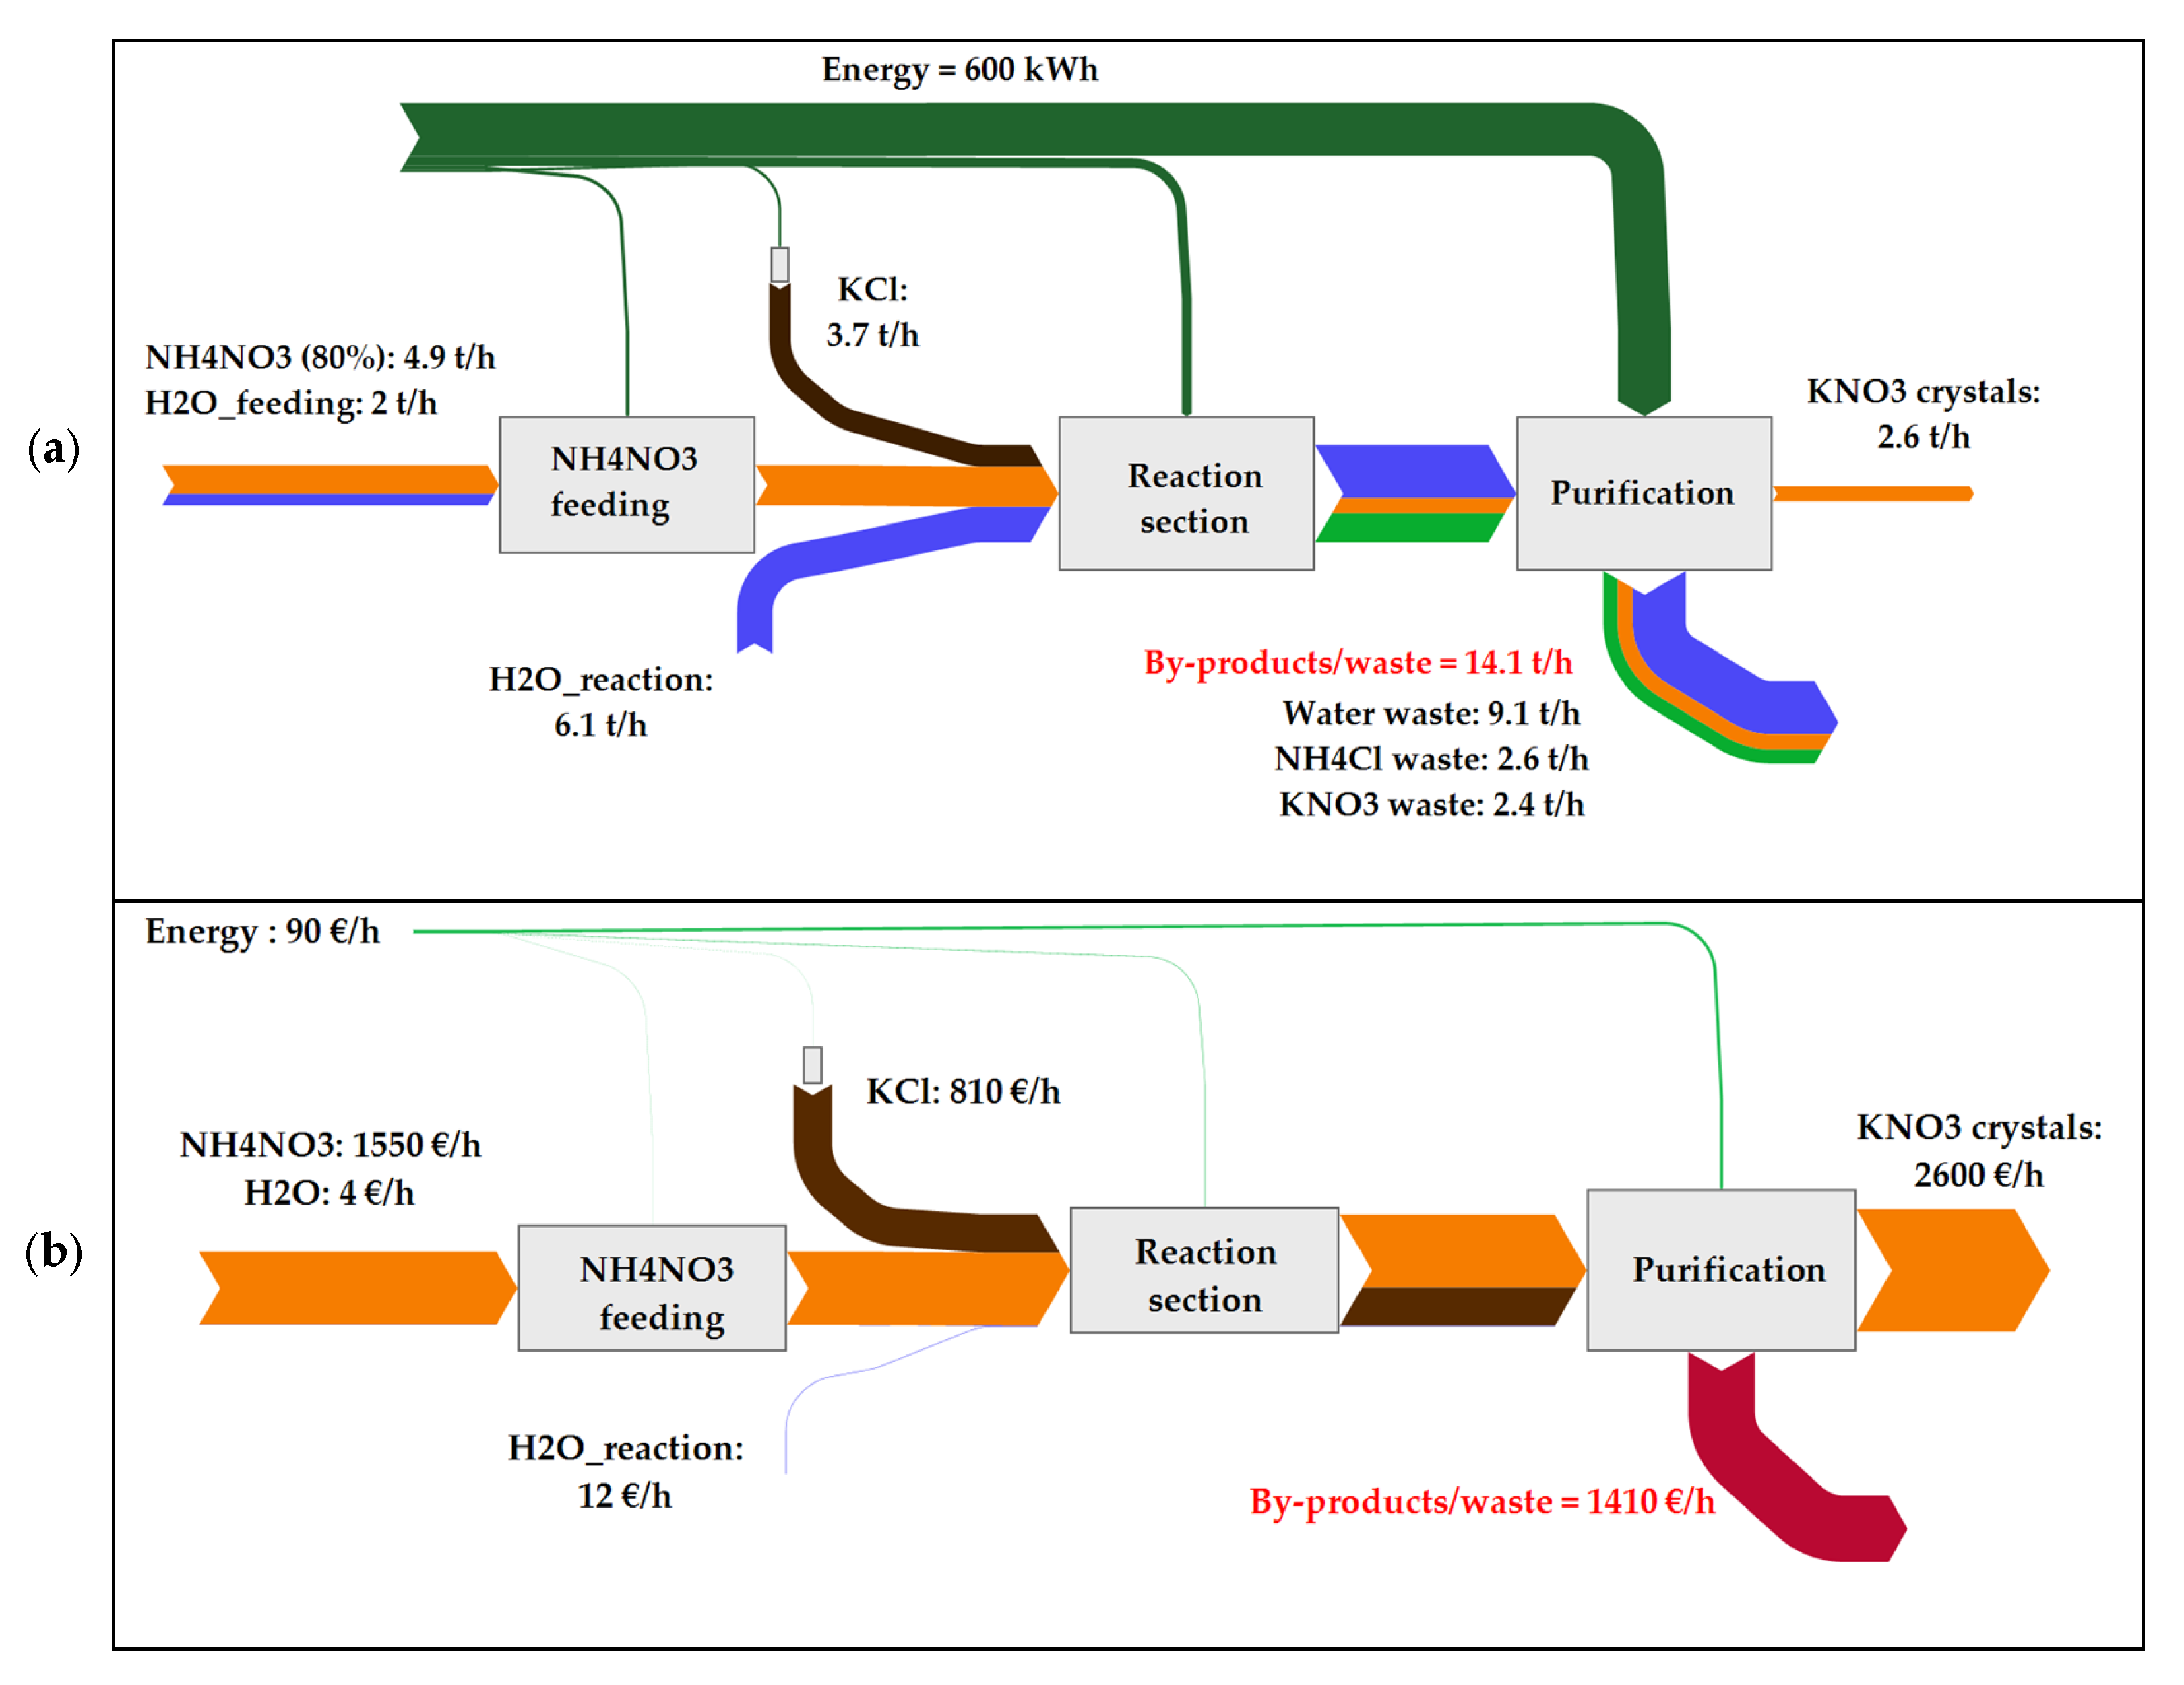
  • High aqueous dilution requirements: the process requires a significant dilution ratio of KNO3 to H2O (1:5), which hinders efficiency.
  • Elevated energy consumption: the pumping and cooling of the highly diluted product stream demand substantial energy input, mainly for the separation of KNO3 from the by-product (NH4Cl).
  • Generation of a low-value by-product: ammonium chloride (NH4Cl) is produced as a by-product of the reaction of ammonium nitrate (NH4NO3) and potassium chloride (KCl), offering little to no commercial value.
  • Wastewater challenges: the production of strontium salts generates calcium chloride (CaCl2) as a secondary by-product due to the use of hydrochloric acid (HCl) in leaching operations. This CaCl2 is partially discharged in wastewater, where it interacts with sulphate salts from neighbouring industries, forming calcium sulphate (CaSO4) and causing clogging issues in the general wastewater discharge system.
To address these challenges, the proposed process upgrade focuses on (a) significantly reducing water and energy usage, (b) eliminating the generation and handling of ammonium chloride by-products, and (c) recovering waste hydrochloric acid (HCl) for reuse in mineral leaching operations.
The upgraded process will incorporate three advanced technologies, along with the integration of waste flows from neighbouring industries, including sulphuric acid (H2SO4), CO2, and glycerine-rich streams, to intensify the KNO3 production process (Figure 4). These innovations aim to improve resource efficiency, minimise waste, and enhance the overall sustainability of the production system (Figure 5).

5.2. Swedish Demo-Site Description

At the initial stage, the Swedish case study intended to showcase a regenerative industrial approach where low-grade residual heat and CO2 from a pulp and paper mill would be used as inputs to produce both tomatoes in a 100,000 m2 greenhouse and shrimp in a land-based aquaculture facility. The value of reusing heat and CO2 is that environmental impacts are reduced. For example, the conventional use of primary resoruces such as natural gas for tomato production is avoided. Locally produced tomatoes and shrimp also reduce transportation needs and enhance resilience by shortening food production value chains. From a systems perspective, the Swedish IS case presents both challenges and benefits, but these are beyond the scope of this paper.
The greenhouse facility studied was under construction between 2022 and 2024, with groundwork commenced in February 2022 and operation starting in May 2024, demonstrating the use of low-grade waste heat for ambient heating, while the CO2 recycling resulted instead in the project gaining insights into the limitations and alternatives for recycling CO2 from flue gases in connection to a pulp and paper facility. Early in the project development, the shrimp farm was removed for reasons not further elaborated in this paper. The greenhouse, however, is one of the largest in Sweden at 10 ha; for comparison, the total area for Swedish tomato production was 460,000 m2 in 2020 [61]. The boundary conditions of the case study are depicted in Figure 6.
The symbiosis site was facilitated by the company WA3RM. WA3RM led the work with the symbiosis and connected the companies running the greenhouse with the paper mill. In contrast to the Spanish case study, the Swedish case presented in this article is prospective and includes the greenhouse, CO2 recycling, and heat recovery. The grey areas in Figure 6 and beyond could be included in an extended MFCA of the symbiosis but, since these areas were not part of the project, these are excluded from the current assessment. Data from various sources with varying degrees of accuracy have been used for a preliminary assessment, including waste stream measurements, Aspen plus simulations, expertise from growers and suppliers, and literature reviews.
The hypothesis of this case study was that MFCA could be used as a structured approach to assess cost flows between actors in a symbiosis network during the early design phase. This could be linked to other standardised methods for impact and cost assessments, such as LCA and LCC, serving as a first step for stakeholders to develop a more detailed internal MFCA approach for operational use. The MFCA elaborated here is thus focused on symbiosis connections, which implies that it is an approach focusing on mass and energy flows suitable for symbiotic exchange. The assessment of suitability in the Swedish case study was performed by first classifying the negative products (residuals) as either avoidable or unavoidable [62], where only unavoidable negative products were deemed suitable for symbiotic exchange. If a residual stream was deemed avoidable, it should be subject to internal efficiency improvements instead of symbiotic exchange. In a second step, the selection was also screened based on practical potential for collecting and transferring the flow to a receiving actor. The classification was particularly relevant in this case due to the methodological approach adopted, which focused on optimising material and energy flows in the symbiosis. In contrast, in the Spanish case study, the analysis primarily relied on a cost–benefit assessment (CBA) complemented by MFCA but did not explicitly distinguish between avoidable and unavoidable negative products. This difference in approach was based on the specific objectives and data availability in each case.
The concept of unavoidable waste has gained policy momentum, e.g., the British government is aiming for zero avoidable waste by 2050 [63]. According to Iacovidou et al. [62], inherent characteristics or design principles considered necessary can be seen as unavoidable. Based on this, for the Swedish case, tomato plant residues (e.g., roots, leaves, and stems) are classified as unavoidable negative products, as they are an inherent part of the cultivation process. However, different management strategies exist for their valorisation, such as composting or bioenergy recovery. Conversely, water evaporation and vented CO2 are considered unavoidable negative products, even though alternative greenhouse designs (e.g., closed greenhouse systems) could significantly reduce these losses. These products are, however, not partially relevant for symbiotic exchange since they are vented off in the greenhouse and cannot be collected. Thus, they are excluded from the analysis. Leached nutrients and pesticides are excluded from the analysis since they have a limited effect on the cost flows of the current system design.
In Figure 7, the method for calculating the costs for positive and negative outputs is visualised. The costs associated with each material input are allocated between positive outputs (either product or intermediate) and negative products. The allocation is based on the mass fraction of total positive and negative unavoidable and collectable outputs. This implies that all allocated costs in the system will end up in the unavoidable outputs and, thus, will give an indication of the potential for increasing symbiotic exchanges and the allocated production costs for different symbiotic residual flows. For the symbiotic MFCA, allocation methods could also be based on, e.g., estimated market prices for the different output streams. Also, if the derived allocated production costs for different outputs are high, this would indicate that a more detailed internal MFCA should be conducted to investigate where the main costs and inefficiencies are located in the system.
The sum of all system costs and the sum of all energy costs of quantity centre n (QCn) were allocated between the positive outputs and the unavoidable negative products. Additionally, waste management costs for each QC were allocated between negative products.
Since CO2 can be added to a symbiotic greenhouse in multiple ways, various cases have been assessed in this analysis (Figure 8), with two options (A and B) for obtaining CO2 from the neighbouring paper mill in an IS collaboration. In Option A, the CO2 is provided by using a carbon capture utilisation (CCU) technique, whereas, in Option B, the CO2 is provided by cleaning the industry flue gases with a scrubber. In Option C, the CO2 is provided by an external supplier. In Option D, the CO2 to the greenhouse is provided by a natural gas boiler, without an IS collaboration. This is a common way of providing electricty, heat, and CO2 at existing greenhouses in Europe and is thus used as a reference.
Inputs used in the assessment are historical data on temperature and flow of the residual heat, composition of the flue gases, and local climate data. Additionally, an algorithm was developed to capture the general CO2 supply strategy commonly used by tomato growers. As illustrated in Figure 9, the algorithm is based on solar irradiance levels, which determine the required CO2 concentration (500–800 ppm) in the greenhouse. It also incorporates data from growers regarding the correlation between solar irradiance and CO2 levels, plant photosynthetic uptake, air exchange rates, and correction factors. This approach allows dynamic adjustments of CO2 supply to optimise plant growth and resource efficiency. For economic inputs, market prices were used, except for flue gases and residual heat, which were estimated using the cost-plus price setting method. This method is based on the expenditures of recycling the resource (OPEX and CAPEX) per unit delivered together with an agreed margin.
Alternative system designs may introduce new unavoidable negative products that can affect resource efficiency negatively. Comparing alternatives side by side helps identify the most resource-efficient option.

6. MFCA Results

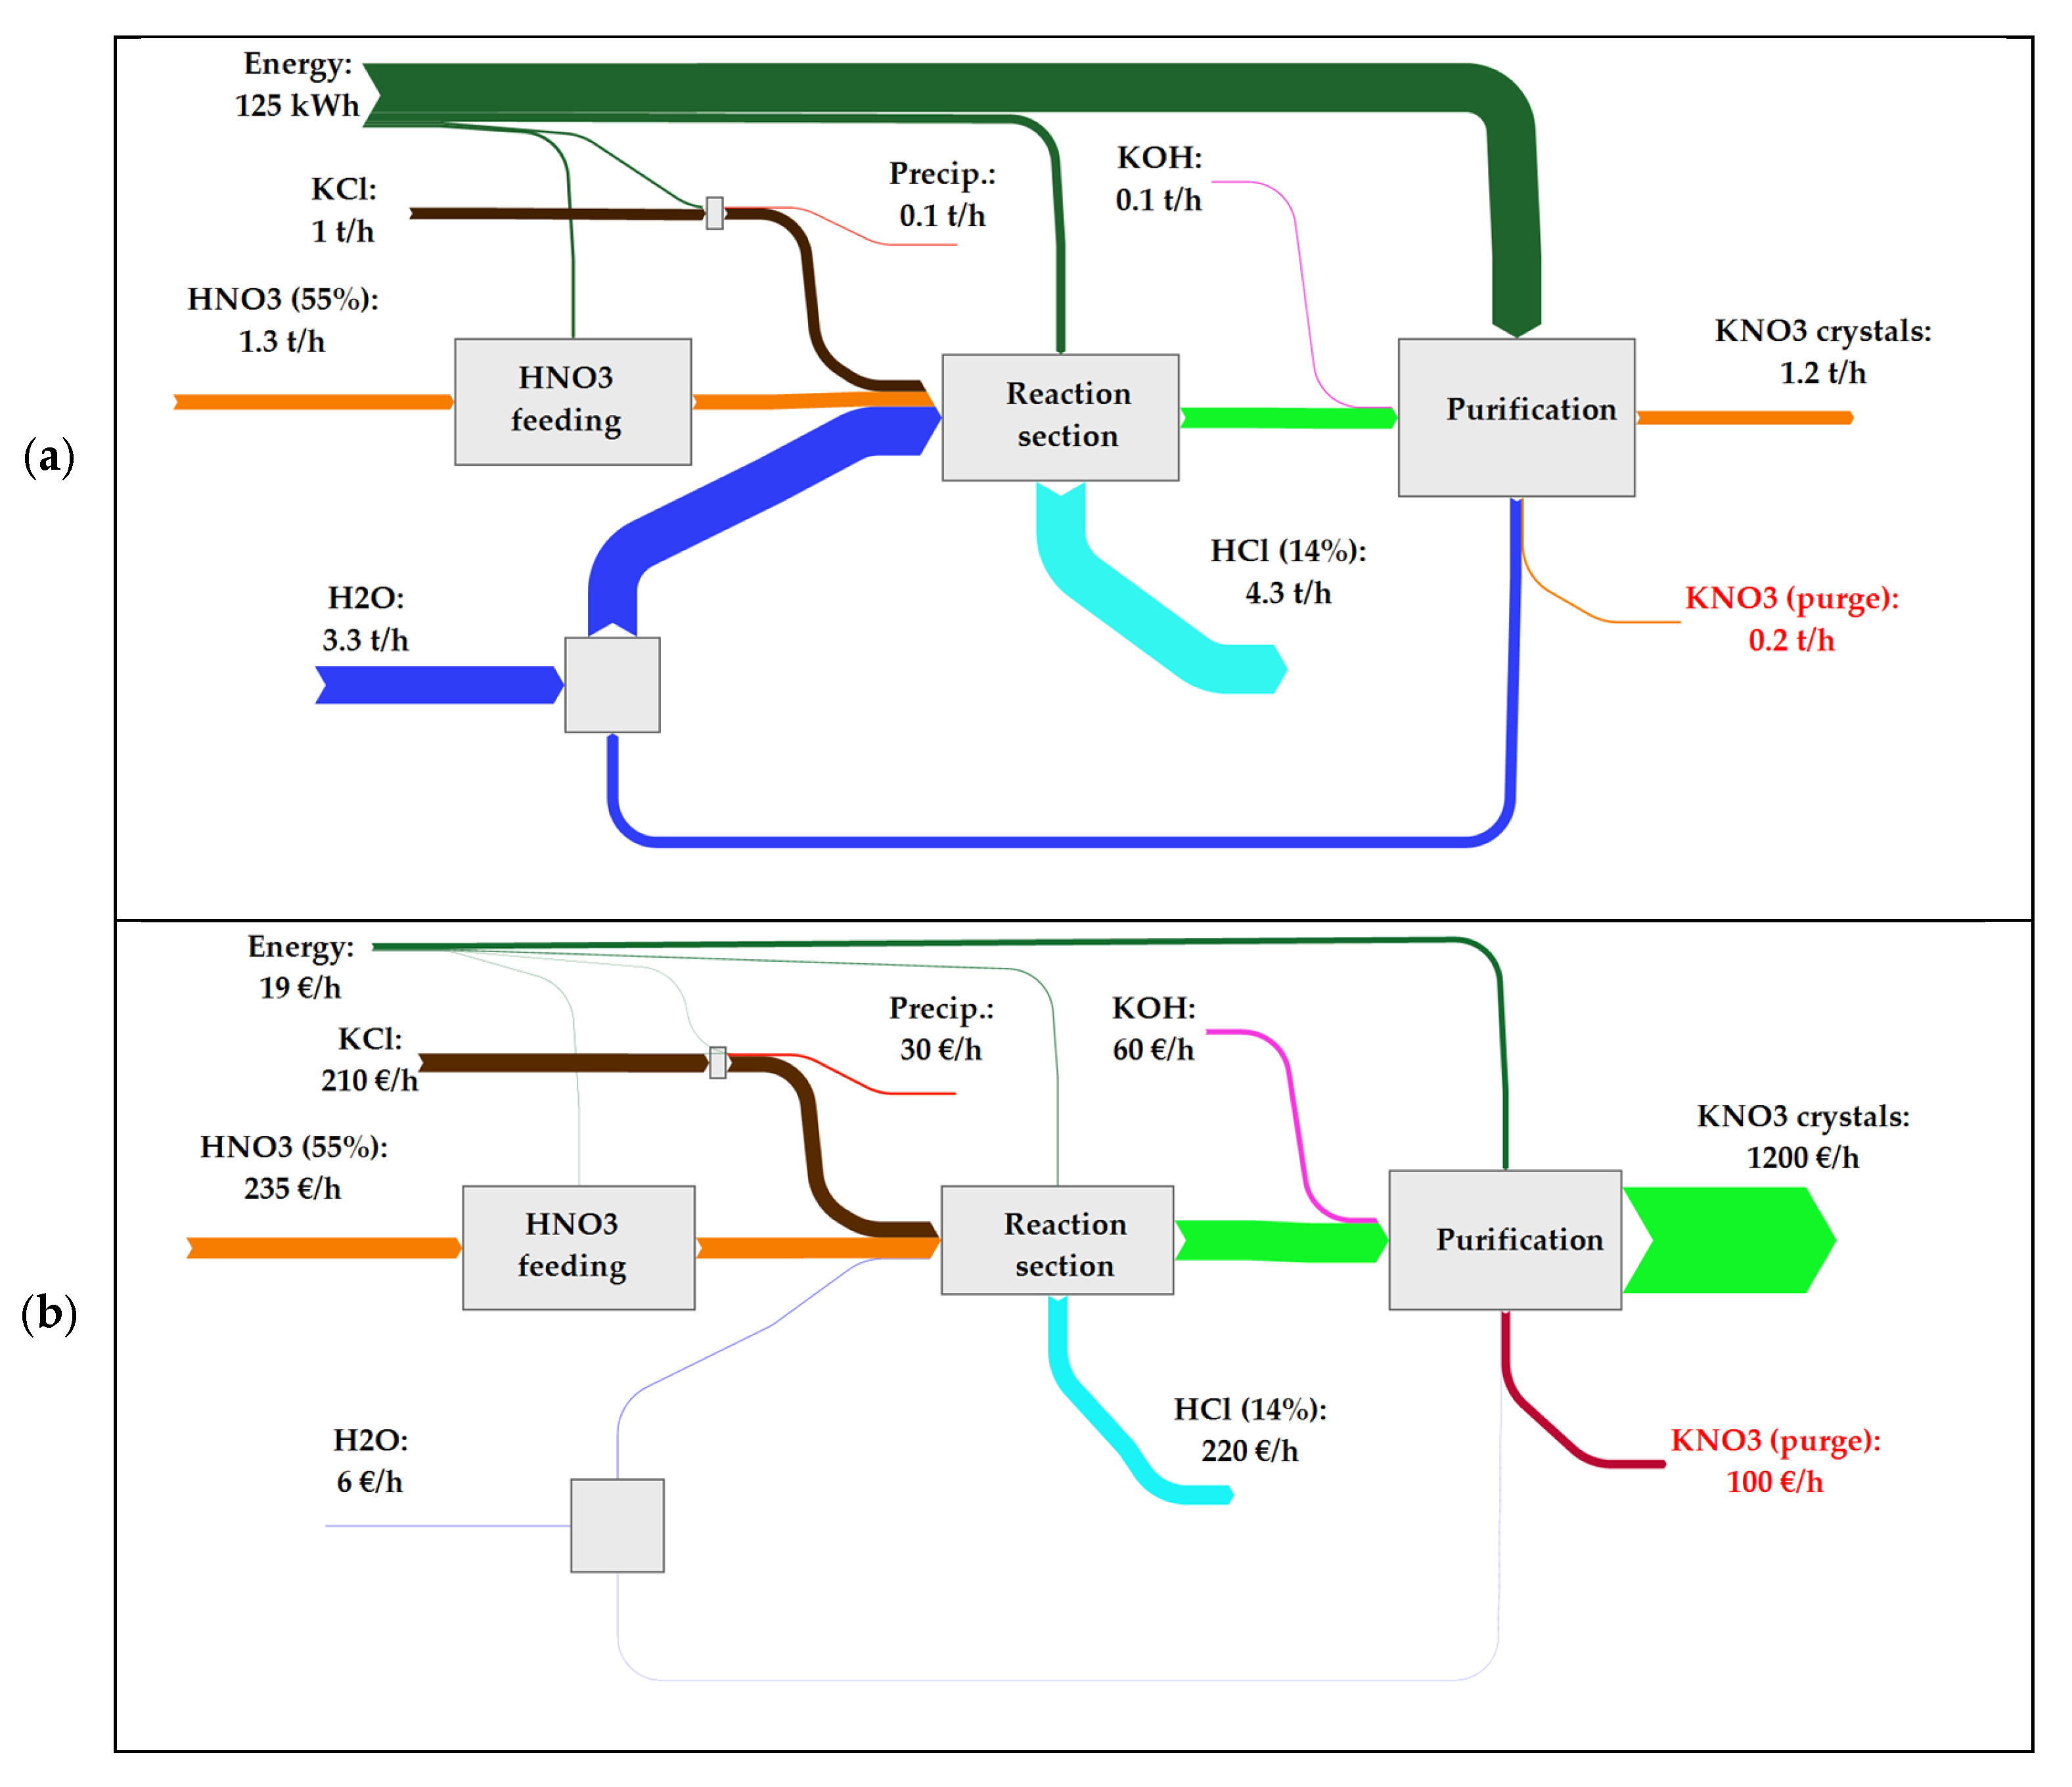
6.1. Baseline: Spanish Pre-IS Scenario

The first step in the analysis is to simplify the system in its main stages and establish a representative flow diagram or, alternatively, the most representative QC that allows a comparison to be established between the current and IS solution scenarios. In this case, this phase was found to be especially difficult as the overall production plant is complex and the information regarding the baseline is much more detailed than that available for the IS solution scenario. The stages analysed and the energy and material flows are showcased in Figure 10a. The adopted solution involved system division into reactants feeding, reaction, and purification sections, since these can be readily identified at both pre- and post-IS process schemes. In the Sankey diagram of Figure 10a, it is observed that the energy input to run the current KNO3 production plant exceeds 230 kWh/tKNO3, with the main contributors being fluid pumping, tank stirring, and heating/refrigeration operations. The purification section, which includes reaction mixture refrigeration, KNO3 concentration, crystallisation, and centrifuging, holds more than 70% of the process energy requirements. The current plant capacity is nearly 2.6 tKNO3/h in crystal form and, for this purpose, more than 16 t of reactants and diluting water are employed.
Due to the high dilution required and the type of reactants used, there is a very important aqueous by-product flow generation containing both dissolved KNO3 and NH4Cl salts. The KNO3 content is essentially determined by the solubility of the salt in water at the pressure and temperature conditions attained at the crystalliser outlet, whereas NH4Cl is the by-product of the reaction between NH4NO3 and KCl salts. As such, roughly 14 t/h of dissolved KNO3 by-product with NH4Cl impurities are generated, which can either be sold as liquid-phase fertiliser or further processed to recover valuable KNO3. It is of remark that NH4Cl has low to noncommercial value. Currently, this by-product is sold below its actual production cost. Moreover, this also implies a significant efficiency loss in the KNO3 production process, as nearly half of the produced KNO3 is lost in solution with NH4Cl. Specifically, for each ton of KNO3 produced, aproximately 0.5 t remains as pure salt, while the other 0.5 t is carried away in the by-product stream, resulting in an overall efficiency of about 50%.
Once a rough estimation of the mass balances of the KNO3 production plant is ready, the cost of each feedstock, energy input, product, and waste can be quantified. Figure 10b shows the tentative costs of all energy and mass input and output flows involved in the KNO3 production process. The values shown are intended to be representative or, at least, to provide a realistic order of magnitude for each flow cost. However, due to the market price fluctuations as a result of the events taking place worldwide in the last two years and, particularly, in the latest six months, the presented cost allocation is fraught with uncertainty. For instance, the selected electricity price (0.15 EUR/kWh) is an average value within the EU zone along the second semester of 2021 for nonhousehold consumers [64]. At the reporting date, this value is probably obsolete. Furthermore, energy-intensive companies such as this fertiliser plant have specifically negotiated prices for the energy usage, which may be significantly different from the averages used here. Similarly, the price of KCl (220 EUR/t) and NH4NO3 (314 EUR/t) raw materials were selected based on 2021 market price standards [65,66]. To illustrate the extent of the price fluctuation, the KCl price by June 2022 exceeds 532 EUR/t, which represents a 175% increase with respect to the market price of the same salt by December 2021.
To address this volatility, sensitivity analyses were performed to evaluate the impact of different price scenarios on the results, considering both historical trends and projected market variations. However, price fluctuations remain an inherent limitation in MFCA and CBA methodologies, as they depend on external economic factors beyond the control of the analysis. Future studies could integrate real-time price indexing or forecast models to improve the adaptability of cost assessments and provide more dynamic economic evaluations of IS scenarios.
Similarly, the price of NH4NO3 increased by more than 200% in the first quarter of 2022. As such, the selling price of the KNO3 crystals that was set at 1 EUR/kg in this study based on prepandemic available data can be considered obsolete. The by-product price was calculated to be roughly 100 EUR/t, which is the sum of the prices of KNO3, NH4Cl, and water in the real proportions of the mixture. The estimated costs, including energy input, feedstocks, and by-products (when considered as waste), reach approximately 2700 EUR/h under the baseline assumptions of 2021. This value was obtained considering an average price of raw materials and energy prior to the extreme market fluctuations observed in 2022.
If by-products are considered as secondary raw materials instead of waste, their economic valuation would shift from a cost-based disposal approach to a potential revenue stream. In this case, their market value, demand, and feasibility of reuse would need to be assessed, which could significantly impact the overall economic balance of the IS scenario. Under this alternative approach, the cost allocation strategy would need to be revised to ensure that the benefits from by-product valorisation are correctly accounted for.
Consequently, if the updated price trends are applied, OPEX could be considered as EUR 2700/2.6 = EUR 1350/tKNO3 (excluding labor), which is very similar to the benefits of KNO3 crystal selling at a given cost of 1 EUR/kg. While price volatility remains a challenge in economic assessments, future studies could incorporate real-time price indexing or forecast models to improve the adaptability of cost evaluations in IS scenarios.

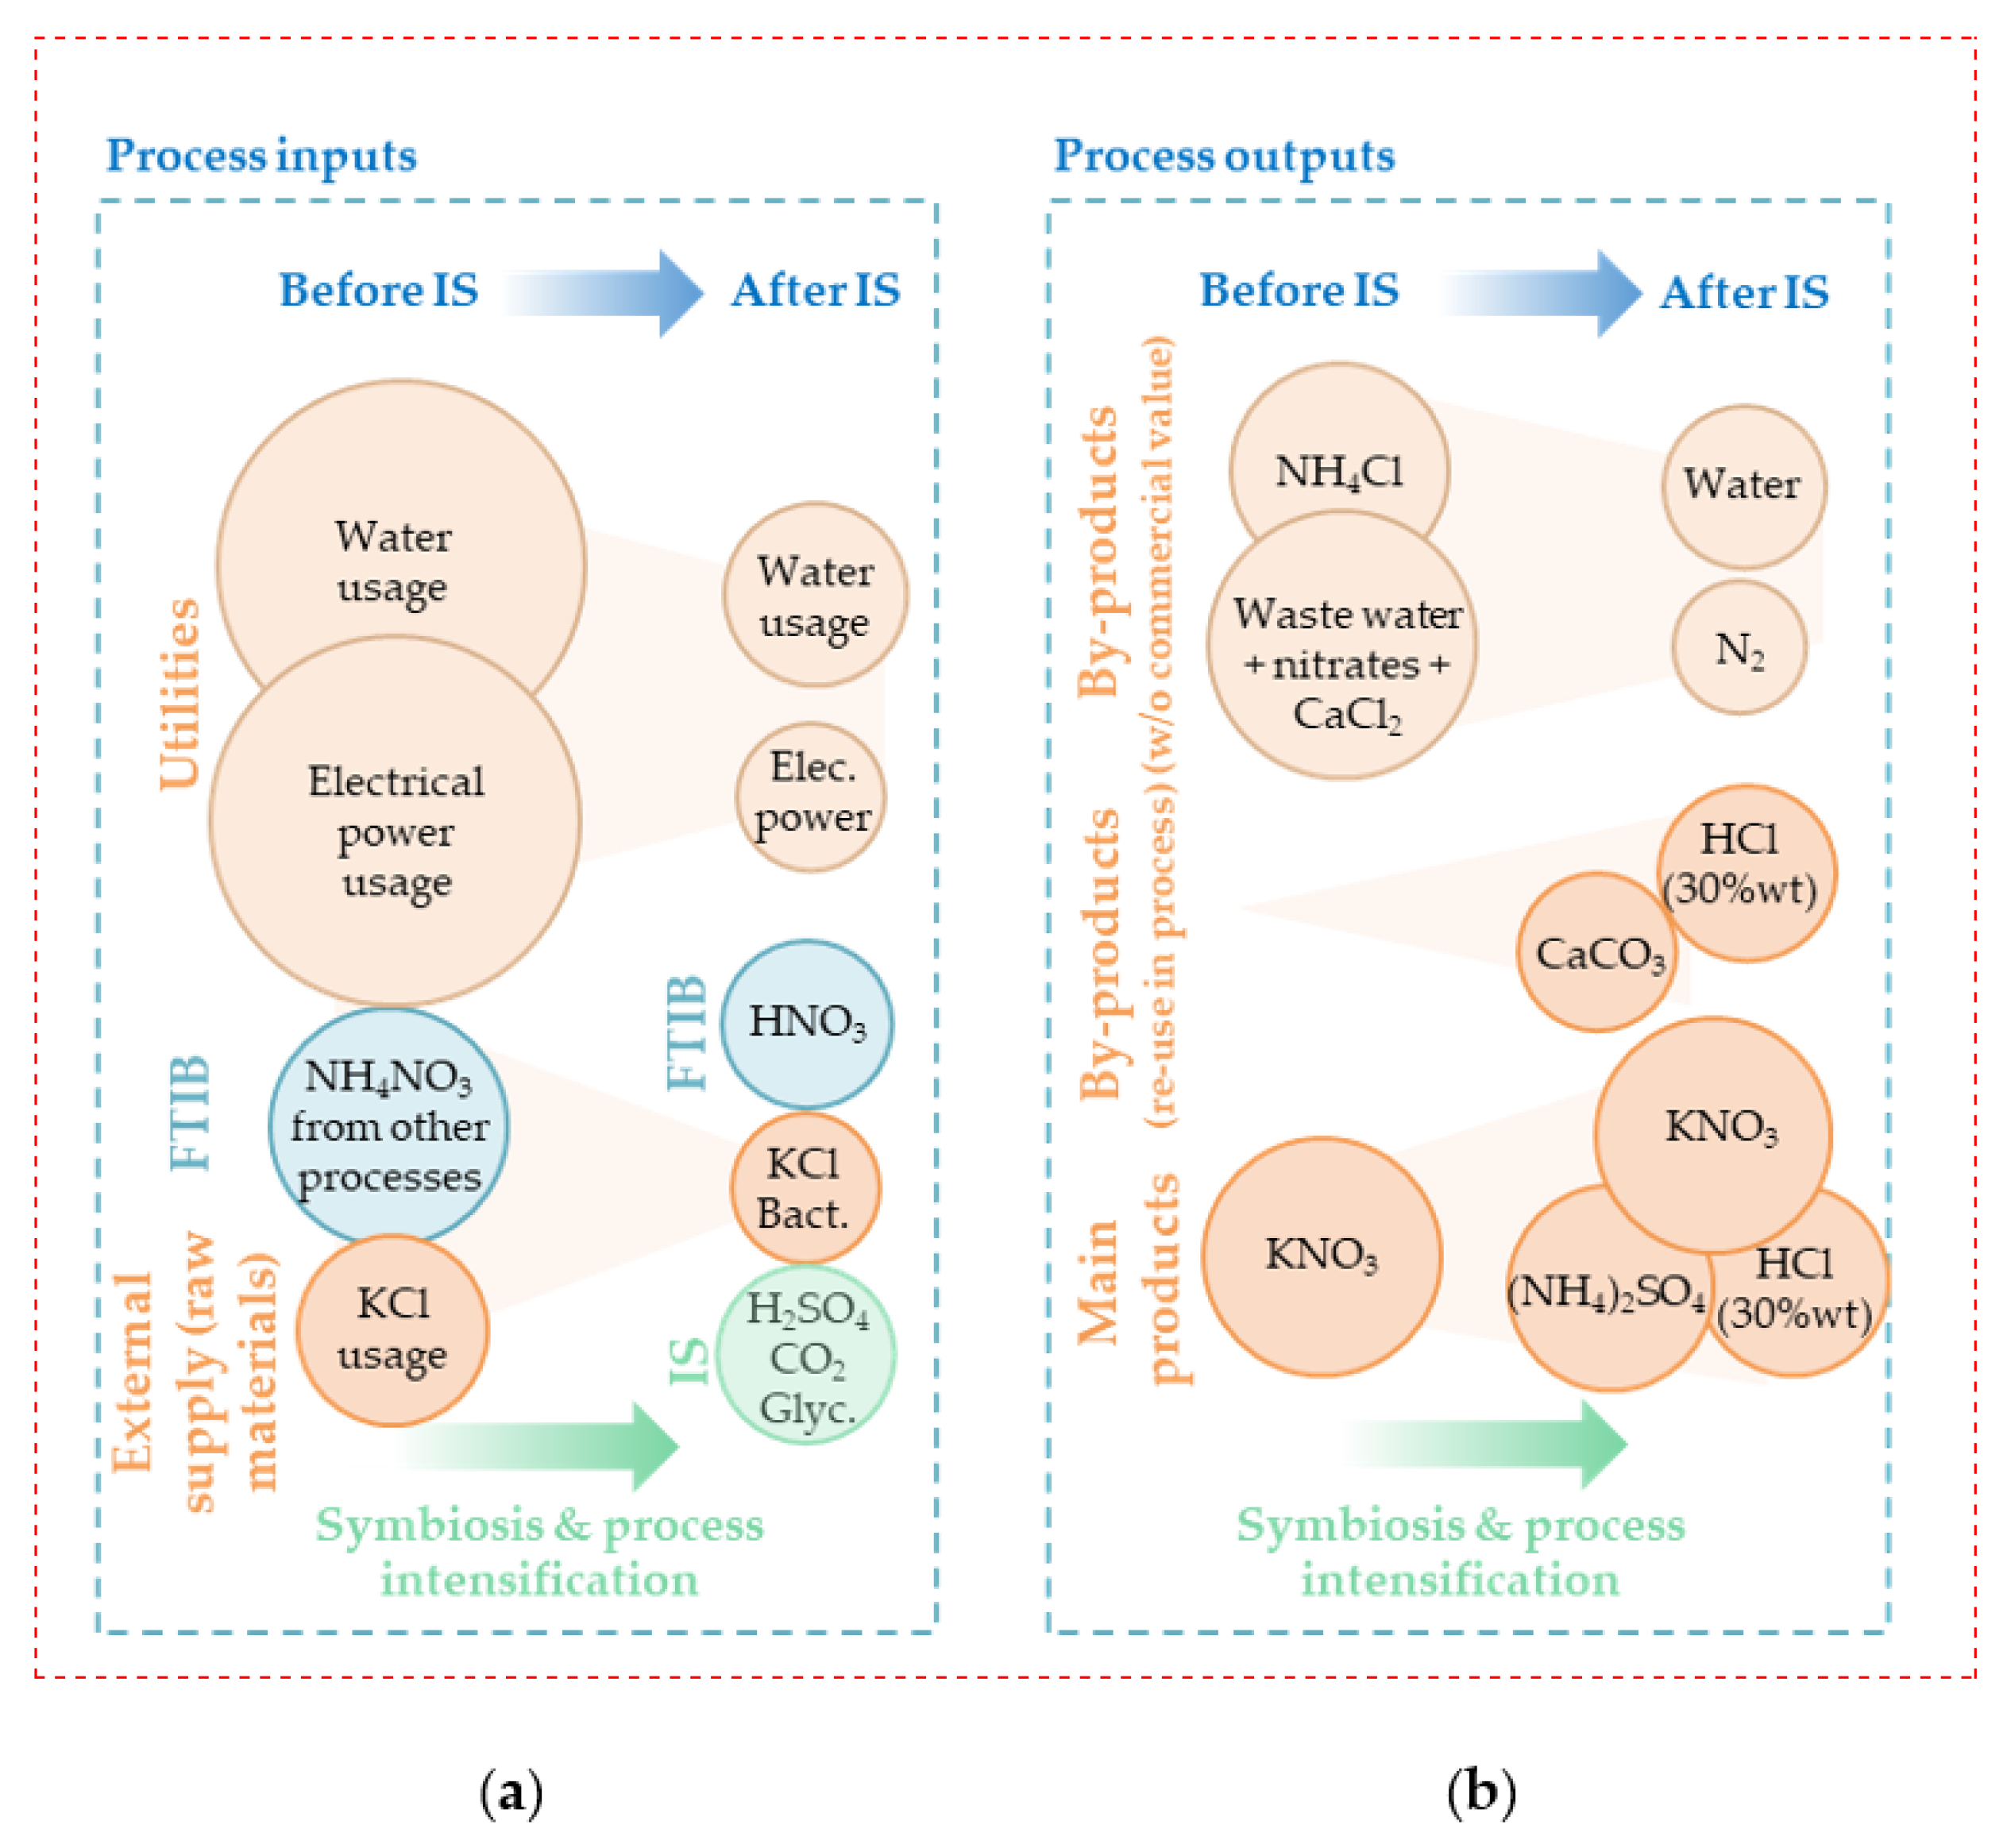
6.2. CORALIS: Spanish Post-IS Scenario

In terms of the MFCA analysis, the “post-IS scenario” considers the KNO3 production plant upgrade described in Section 3.1. The mass and energy flow diagram of the new demo plant is presented in Figure 11a. The demo plant capacity is expected to provide up to 1.2 t of KNO3 crystals per hour (8000 t/year) with a drastically reduced wastewater generation and energy consumption. Essentially, the resin mobility feature of the new reactor avoids cleaning steps and, thus, strongly reduces waste generation. The energy input per ton of crystal salt drops down to 125 kWh (104 kWh/tKNO3) and the usage of raw materials also decreases to a significant extent. The production of NH4Cl is avoided. Diluted HCl (14 wt. %) is produced instead, which may be purified and recovered in the further stages, as described in Section 3.1. The costs allocated for each of the flows were obtained from the same sources, adopting the same assumptions as those indicated in Section 3.2. Figure 11b shows the flow cost diagram of the proposed post-IS solution.
In this case, the big numbers indicate that the additive cost of feedstocks, electricity, water, and waste flows may potentially represent an OPEX (excluding labour) of roughly between 880 EUR/h and 800 EUR/tKNO3. Considering an estimated resins reactor plant cost of EUR 4.7 M (again, referring to the 2021 cost of raw materials for reactor construction) and a fixed KNO3 crystal price of 1 EUR/kg, the investment would potentially have a payback period of 2.9 years and a 4-year return of investment of roughly 36% (excluding staff effort per unit flow rate).
The payback period (PBP) is calculated as follows:
PBP = CAPEX Annual Net Benefit ,
Substituting the given values:
PBP = 4.7   M ( 8000   t / year   ·   800   / t ) ,  
Similarly, the return on investment (ROI) over 4 years is estimated as:
ROI = Net Profit CAPEX ,
Replacing with the corresponding values:
ROI = ( 8000   t / year · 800   / t · 4 year ) 4.7   M 4.7   M   ·   100 = 36 % ,
These figures are indicative and should be updated whenever the investment is made, considering potential market fluctuations in raw material costs and energy prices.
The previous scenario considers that nearly 4.3 t/h of a diluted HCl flow (14 wt. %) with nitrate impurities having a cost allocation of roughly 50 EUR/t are wasted and not recovered again for production purposes. However, as described in Section 3.1, two different options are being considered to denitrify and purify this HCl-based by-product. For the biological degradation of nitrates with bacteria, being glycerine supplied from neighbouring companies, the estimated CAPEX is around EUR 0.5 M, based on cost evaluation carried out by Fertiberia Group, taking into account process equipment, installation cost, civil infrastructure, and auxiliaries services and utilities.
Given the 2021 market price for concentrated technical-graded HCl (around 125 EUR/t) [67] and the fact that the waste flow from the KNO3 production process may potentially generate 1.6 t/h of concentrated and nitrate-free HCl solution (30 wt. %), this output is not explicitly represented in Figure 11a, but it is derived from an estimation of recovery from the 4.3 t/h of HCl (14 wt. %) after the concentration step. The potential savings in HCl acquisition for mineral leaching purposes may exceed EUR 1.3 M per year. However, the lack of CAPEX estimations for the last integration at the current project stage does not allow us to estimate the maximum OPEX of both the denitrification and HCl recovery pilot plants for a favourable business case scenario. Nevertheless, it is expected that these process improvements will lead to a reduction in raw material consumption due to higher reaction efficiency, improved selectivity, and the elimination of NH₄Cl formation.
Additionally, the recovery of HCl further reduces the need for virgin acid inputs, optimising overall material usage. Therefore, it is also impossible to establish a price range at this point for the potentially incorporated waste flows from the neighbouring providers (i.e., glycerine, CO2, and H2SO4).

6.3. CORALIS Swedish Demo Site

The mass and energy flows for the four different cases are visualised as a Sankey diagram in Figure 12. As can be seen in the figure, there is a large need for electricity and heating in the greenhouse system, and the other large input is the CO2 needed for plant growth. Even though the material flows are similar for all four cases, the need for energy in alternative A for the carbon capture is apparent. Also, the alternative with a natural gas boiler will supply both heat and CO2 to the greenhouse.
The problem with only analysing mass and energy flows is of course that they say nothing about costs and quality of the inputs and outputs. The costs for input flows be-tween the four alternatives are shown in Figure 13. Clearly, alternatives B and C have low-er input costs than the other two cases. It is also shown in this assessment that the only negative product identified (the green parts of the tomato plants) could be seen as a viable option for improvement to increase the resource efficiency of the process. This system is small but is a good example of the principles, even though the MFCA would most likely be more valuable in production systems that are more complex.
As the width of the arrows between QCs represents the cost flow in relation to each other, the figure shows that the greatest cost for the tomatoes is electricity consumption (blue flow in Figure 13). The model also indicates significant costs associated with tomato plant residues.
To explore the potential for increased symbiotic exchange, the monetary efficiency (costs allocated to positive products/total costs) was used to make more detailed comparisons. This metric is defined as:
Monetary Efficiency = Costs allocated to all positive products Total costs ,
which quantifies the proportion of total costs effectively used for producing valuable outputs in the industrial symbiosis system. Given the simple case in this paper and that there are only two product flows that are fixed in size for all cases, the monetary efficiency will be the same for all cases, approximately 70%. This suggests a 30% potential for increasing the utilisation of residual outputs in the system through symbiotic exchanges.
The differences between the resulting Sankey diagrams for the alternative system de-signs were challenging to clearly distinguish. Thus, allocated production costs for various positive and negative products in the system serve as a key metric in MFCA. For the greenhouse, the allocated production costs, in EUR/kg, are shown in Table 2. These costs are sensitive to the CAPEX and OPEX inputs in the assessment and should thus be presented with uncertainty intervals and include more in-depth sensitivity analyses. In this paper, fixed numbers based on the MFCA from Figure 13 have been used and do not represent any real cost estimates performed in the Swedish case study. Allocated production costs can be compared with typical selling prices for these types of products, showcasing a potential benefit of symbiosis-oriented MFCA for business agreements between actors in a symbiosis network. Highlighting allocated production costs can be used as a means to verify that residual streams are used for suitable receiving processes and can also indicate the potential need to address internal efficiency measures in industrial facilities if the allocated production costs are too high to find any feasible collaborations.
The results by themselves do not provide an answer to the next step of the Swedish case study; rather, the intention in this paper is to showcase how MFCA can be used in symbiotic exchanges and to increase motivation to reduce the gap between the fields of business management and industrial ecology by including symbiosis-focused metrics for capturing resource efficiency into the portfolio of KPIs that decision makers can use when evaluating different alternatives and to find new ways to improve the process to become more resource-efficient and to highlight possible extensions of the IS.
A downside of the MFCA method is that it is static. It normally uses an average timestep (usually yearly production data) and does not include variations in, e.g., electricity prices. This is particularly relevant for highly dynamic processes like the production of tomatoes in a greenhouse, since potentially profitable flexibility in production is not included in the analysis. Therefore, its alignment and utility to the technoeconomic assessment of IS solutions and, specifically, to the pricing of exchanged waste materials requires further study. Still, MFCA adoption can give a clear overview on the waste streams generation by any industrial activity and can allocate a cost to each waste flow based on the cost of the individual components in the effluent mixture. It is important to note that most waste flows require investment for upgrading. It also holds true that not all waste flows can be sold or even employed without additional costs by an external receiver.

7. Conclusions

Policymakers and industry stakeholders should consider incorporating material flow cost accounting (MFCA) into regulatory frameworks for industrial symbiosis (IS) implementation. This would facilitate cost-sharing agreements, incentivise waste valorisation, and help to align resource efficiency with sustainability goals. Additionally, standardisation of IS frameworks across industries is a priority to enhance scalability and adoption. Policymakers should also explore collaborative efforts between industries to optimise waste and resource exchanges, leveraging MFCA insights for better decision making at the system level.

7.1. General

Material flow cost accounting (MFCA) has proven to be a valuable tool for identifying and allocating costs associated with material and energy flows in process upgrades, including waste flows. By estimating the cost of diluted reagent streams containing impurities, MFCA considers factors such as the market price of pure components, the residual cost of upgraded flows ready for reuse, and the CAPEX and OPEX associated with employing the best available technology for upgrading. This is specifically useful when implementing IS solutions.
However, the costs allocated to waste flows do not always correspond to their actual residual value. Many waste flows, particularly those with low or no potential for upgrading or direct use, have negligible residual value despite significant allocated costs, as these represent the monetary value of individual components dispersed within the waste.
Integrating the MFCA methodology with ISO 14052 into industrial symbiosis (IS) implies a shift toward a more systemic, multi-layered approach to resource efficiency and cost management. This integration involves not just optimising individual supply chains but connecting multiple supply chains and actors into a cohesive network, fostering collaboration and shared responsibility. This implies:
  • Holistic resource flow management: MFCA applied across interconnected supply chains enables a comprehensive understanding of how resource inputs, waste outputs, and costs are distributed across multiple companies in a symbiotic network. This fosters shared accountability for resource efficiency.
  • Dynamic cost and resource modelling: integrating MFCA with IS requires new models to dynamically track how changes in one company (e.g., raw material quality or process efficiency) ripple across the network, influencing costs and performance at different points.
  • Redefinition of quantity centres: quantity centres in MFCA would expand beyond processes or departments to include entire companies or clusters of companies, requiring new frameworks to map and manage these broader interactions.
  • Collaborative decision making: IS layers demand collective strategies for resource sharing, waste valorisation, and cost distribution, supported by MFCA insights that highlight mutual benefits and shared risks.
  • Alignment with circular economy goals: by identifying opportunities to reuse waste, reduce virgin material use, and optimise shared resources, this integration positions MFCA and ISO 14052 as critical tools for achieving circular economy objectives.
Compared to other methods, such as life cycle assessment (LCA), material flow analysis (MFA), and cost–benefit analysis (CBA), MFCA offers a structured and quantifiable approach for assigning economic value to material and energy losses. While LCA focuses primarily on environmental impact without directly addressing financial implications and MFA tracks material flows but lacks economic evaluation, MFCA integrates both material flow tracking and cost allocation, making it a powerful tool for identifying inefficiencies and optimising costs in IS networks. Additionally, unlike traditional CBA, which primarily assesses feasibility based on CAPEX and OPEX without accounting for hidden inefficiencies in material usage, MFCA helps quantify and visualise economic losses from waste generation, offering a more granular perspective on resource efficiency. This capability makes MFCA particularly advantageous for designing IS strategies that require precise cost allocation and resource optimisation.
While MFCA offers a structured, ISO-standardised approach for evaluating waste generation costs, its application as a standalone methodology is insufficient to address the complexities of pricing IS materials and energy exchanges. To complement MFCA, traditional economic indicators such as ROI, PBP, and NPV should be integrated with CAPEX and OPEX analyses of upgraded installations. These additional considerations help establish a technical price framework for waste flow exchange.
The implementation of MFCA-inspired methodologies requires collaboration and trust among IS stakeholders, involving extensive data collection and cross-departmental discussions to ensure a holistic understanding of business operations. The methodology’s complexity is directly tied to the degree of detail required for waste characterisation and pricing. Ultimately, while MFCA provides valuable insights for identifying opportunities to reduce waste and improve resource efficiency, it is primarily an accounting tool. Its utility lies in characterising existing systems, evaluating ongoing changes, and establishing a technical baseline for decision making.

7.2. On This Work

The dual application of MFCA and CBA proved particularly effective in assessing the IS scenario in Escombreras, where pre- and post-IS configurations could be well characterised in terms of waste flow sources and process inputs/outputs. The well-defined waste streams and direct material substitutions facilitated a robust MFCA application, enabling a clear economic assessment of material losses and resource efficiency improvements.
In contrast, the Swedish case study posed additional challenges for MFCA due to the complexity of system interactions, particularly in the waste heat exchange process. Unlike material flows, energy flows (such as waste heat) lack intrinsic mass, making it difficult to directly allocate costs and track inefficiencies using MFCA’s traditional framework. This limitation required complementing MFCA with CBA to establish a clearer economic differentiation between design alternatives. Additionally, uncertainties related to fluctuating energy prices and the valuation of waste heat as a secondary resource further complicated cost allocation and scenario comparison.
A key challenge in both case studies was accurately allocating costs to waste flows and pricing mass and energy exchanges, especially given market price fluctuations for feedstocks, energy, and fuels. However, in the Swedish case, the lack of standardised pricing mechanisms for waste heat introduced additional uncertainty, highlighting the need for hybrid assessment methods that integrate MFCA with broader economic modelling approaches.
Comparing our findings with those from Walz and Guenther et al. [42], who analysed 73 case studies on MFCA implementation, we observe similar trends in waste reduction and cost allocation improvements. Their study reports that MFCA applications led to an average 10% reduction in material losses in various industrial processes, including pressing, heat treatment, and plating. In our Spanish case study, the IS implementation allowed for an estimated 50% reduction in the loss of KNO₃, a significantly higher figure due to process re-engineering and integration of waste valorisation streams. Similarly, our Swedish case study highlights an estimated 30% potential increase in resource efficiency within the symbiotic greenhouse system, aligning with Walz and Guenther’s observation that MFCA enhances material efficiency when applied at the system level. However, our study extends beyond their analysis by demonstrating the importance of integrating MFCA with technoeconomic models to address pricing challenges in symbiotic exchanges.
The use of MFCA is valuable as an intermediate step between preliminary assessments and more advanced studies, such as LCA, providing faster evaluations and leveraging available (though sometimes limited) information to drive progress in industrial symbiosis.
A key strength of the MFCA approach in industrial symbiosis is its adaptability to multiple levels of detail, as outlined in ISO 14052, which facilitates the assessment of resource efficiency across supply chains. Future research should explore expanding ISO 14052 to include multi-chain symbiosis, modelling cost flows across interconnected companies, and exploring “quantity centers” at broader levels, such as industrial clusters. Pilot studies, integration of circular economy metrics, as well as developing IS-specific standards and evaluating global symbiosis networks will further optimise its application.
Future research should integrate Monte Carlo simulations to enhance the robustness of technoeconomic assessments by accounting for uncertainties in cost evolution. Additionally, agent-based modelling or system dynamics approaches could be used to analyse long-term interactions between IS stakeholders and assess how material and energy exchanges evolve under different market conditions. These advanced methodologies would help improve decision-making frameworks by incorporating dynamic cost fluctuations and risk assessments into IS evaluations.
Further practical case studies should be conducted to validate the effectiveness of this methodology in advancing industrial symbiosis. These studies are essential for identifying real-world applications, refining methodologies, and demonstrating the tangible benefits of integrating MFCA within IS initiatives.
Industrial symbiosis not only enhances resource efficiency and economic viability but also plays a crucial role in advancing sustainability. By minimising waste, reducing reliance on virgin materials, and fostering collaborative resource-sharing networks, IS contributes to climate change mitigation and aligns with key global sustainability frameworks, including the Circular Economy Action Plan and the United Nations Sustainable Development Goals (SDGs).

7.3. Practical Recommendations and Future Research Directions

7.3.1. Practical Recommendations for Policymakers and Industry Practitioners

Policymakers should consider integrating material flow cost accounting (MFCA) into industrial symbiosis (IS) frameworks, encouraging the adoption of cost-sharing agreements among industries for waste valorisation, and promoting collaborative resource networks. Financial incentives or tax benefits for companies adopting resource-efficient technologies could also be offered to facilitate MFCA adoption. Furthermore, the integration of MFCA into national and international circular economy strategies, such as the EU Green Deal and Circular Economy Action Plan, should be accelerated. Policymakers can further drive sustainability by providing financial support to industries transitioning to a circular economy and fostering government-led waste valorisation projects.
In addition, industry stakeholders, particularly in developing regions, would greatly benefit from capacity-building programs focused on MFCA and IS strategies. These initiatives could include workshops, webinars, and collaborations with research institutions to increase awareness of the economic and environmental advantages of MFCA. Governments can play a crucial role in facilitating these efforts by fostering partnerships between industry, academia, and public institutions.

7.3.2. Future Research Directions Beyond MFCA and ISO 14052

Looking ahead, future research should focus on improving the dynamic modelling of IS systems. Although MFCA provides valuable insights into the economic feasibility of IS, its application remains limited by its static nature. To address this limitation, researchers should explore incorporating Monte Carlo simulations, agent-based models, and system dynamics to capture real-time fluctuations in cost and material/energy flows. These dynamic approaches would offer a more nuanced and comprehensive evaluation of IS systems, considering cost volatility and long-term uncertainty.
Moreover, future studies should expand the application of MFCA to new industries that have not yet fully embraced IS practices, such as food production, textiles, and electronics. The research should also investigate multi-level IS networks, where enterprises of all sizes collaborate, and explore the integration of MFCA within multi-industry supply chains. This would require new methodologies to evaluate cross-industry and cross-geographic exchanges, providing a more holistic view of resource optimisation across diverse sectors.
In the context of global IS expansion, standardisation of IS practices will be crucial. Future research should focus on establishing universal standards for waste exchange pricing, material accounting methodologies, and sustainability metrics. Creating international IS databases to compare various solutions and identify best practices could help streamline the global adoption of IS practices.
The impact of digitalisation and Industry 4.0 technologies on IS should also be explored in future research. Technologies such as IoT, digital twins, and big data analytics can enhance resource flow tracking, real-time monitoring, and decision making, facilitating the scaling of IS operations. By incorporating digital tools, industries can optimise the management of IS exchanges more effectively.
Lastly, long-term evaluations of IS systems are needed to understand their evolution under different economic and regulatory environments. Future research should investigate how IS networks can be scaled and integrated into national economic policies, as well as their potential impact on national GDP, employment, and climate goals. This would provide valuable insights into the broader implications of IS and its role in sustainable economic development.

Author Contributions

Conceptualisation, H.L., I.J. and L.V.; methodology, H.L., I.J., L.V. and M.G.-P.; validation, E.W., M.V., F.G.P., S.A. and R.F.; formal analysis, H.L.; investigation, I.J., L.V. and M.G.-P.; writing—original draft preparation, H.L., I.J., L.V. and M.G.-P.; writing—review and editing, H.L., I.J., L.V., E.W., M.V., S.A., M.G.-P., R.F. and F.G.P. All authors have read and agreed to the published version of the manuscript.

Funding

This research received funding from the European Union’s Horizon 2020 Research and Innovation Programme under Grant Agreement no. 958337, CORALIS project (Creation Of new value chain Relations through novel Approaches facilitating Long-term Industrial Symbiosis, https://www.coralis-h2020.eu/ (accessed on 10 March 2025)).

Institutional Review Board Statement

Not applicable.

Informed Consent Statement

Not applicable.

Data Availability Statement

Data are contained within the article.

Acknowledgments

The authors declare no conflicts of interest. All authors participated in this study as part of the CORALIS project, funded by the European Union’s Horizon 2020 Research and Innovation Programme. The commercial affiliations of some authors did not influence the design of the study, analysis, interpretation, writing of the manuscript, or the decision to publish the results.

Conflicts of Interest

The authors declare no conflicts of interest. The commercial affiliations of some authors did not influence the design of the study, data collection, analysis, interpretation, writing of the manuscript, or the decision to publish the results.

Abbreviations

The following abbreviations are used in this manuscript:
MFCAMaterial Flow Cost Accounting
CBACost–Benefit Analysis
CAPEXCapital Expenditures
OPEXOperational Expenditures
LCALife Cycle Assessment
ISIndustrial Symbiosis
EIPsEco-Industrial Parks
CO2Carbon Dioxide
SDGsSustainable Development Goals
P&IDsPiping and Instrumentation Diagrams
NPONon-Product Output
QCQuantity Centres
ROIReturn on Investment
PBPPayback Period

References

  1. Ghisellini, P.; Cialani, C.; Ulgiati, S. A review on circular economy: The expected transition to a balanced interplay of envi-ronmental and economic systems. J. Clean Prod. 2016, 114, 11–32. [Google Scholar] [CrossRef]
  2. Shi, L.; Chertow, M. Organizational Boundary Change in Industrial Symbiosis: Revisiting the Guitang Group in China. Sustainability 2017, 9, 1085. [Google Scholar] [CrossRef]
  3. Haskins, C. Multidisciplinary investigation of eco-industrial parks. Syst. Eng. 2006, 9, 313–330. [Google Scholar] [CrossRef]
  4. Cervo, H.; Ogé, S.; Maqbool, A.S.; Mendez Alva, F.; Lessard, L.; Bredimas, A.; Ferrasse, J.-H.; Van Eetvelde, G. A Case Study of Industrial Symbiosis in the Humber Region Using the EPOS Methodology. Sustainability 2019, 11, 6940. [Google Scholar] [CrossRef]
  5. Chertow, M.; Park, J. Scholarship and Practice in Industrial Symbiosis: 1989–2014. In Taking Stock of Industrial Ecology; Clift, R., Druckman, A., Eds.; Springer International Publishing: Cham, Switzerland, 2016; pp. 87–116. [Google Scholar] [CrossRef]
  6. Veugelers, R.; Tagliapietra, S.; Trasi, C. Green Industrial Policy in Europe: Past, Present, and Prospects. J. Ind. Compet. Trade 2024, 24, 4. [Google Scholar] [CrossRef]
  7. Huang, B.; Yong, G.; Zhao, J.; Domenech, T.; Liu, Z.; Chiu, S.F.; McDowall, W.; Bleischwitz, R.; Liu, J.; Yao, Y. Review of the development of China’s Eco-industrial Park standard system. Resour. Conserv. Recycl. 2019, 140, 137–144. [Google Scholar] [CrossRef]
  8. Mendez-Alva, F.; Cervo, H.; Krese, G.; Van Eetvelde, G. Industrial symbiosis profiles in energy-intensive industries: Sectoral insights from open databases. J. Clean. Prod. 2021, 314, 128031. [Google Scholar] [CrossRef]
  9. Demartini, M.; Tonelli, F.; Govindan, K. An investigation into modelling approaches for industrial symbiosis: A literature review and research agenda. Clean. Logist. Supply Chain. 2022, 3, 100020. [Google Scholar] [CrossRef]
  10. Yadav, V.S.; Majumdar, A. Mitigating the barriers of industrial symbiosis for waste management: An integrated decision-making framework for the textile and clothing industry. Waste Manag. Res. 2024, 42, 544–555. [Google Scholar] [CrossRef]
  11. Boom-Cárcamo, E.; Peñabaena-Niebles, R. Analysis of the Development of Industrial Symbiosis in Emerging and Frontier Market Countries: Barriers and Drivers. Sustainability 2022, 14, 4223. [Google Scholar] [CrossRef]
  12. Cárcamo, E.A.B.; Peñabaena-Niebles, R. Opportunities and challenges for the waste management in emerging and frontier countries through industrial symbiosis. J. Clean. Prod. 2022, 363, 132607. [Google Scholar] [CrossRef]
  13. Mazzanti, M.; Zoboli, R. Waste generation, waste disposal and policy effectiveness: Evidence on decoupling from the European Union. Resour. Conserv. Recycl. 2008, 52, 1221–1234. [Google Scholar] [CrossRef]
  14. Mishra, M.; Desul, S.; Santos, C.A.G.; Mishra, S.K.; Kamal, A.H.M.; Goswami, S.; Kalumba, A.M.; Biswal, R.; Goswami, S.; Baral, K. A bibliometric analysis of sustainable development goals (SDGs): A review of progress, challenges, and opportunities. Environ. Dev. Sustain. 2024, 26, 11101–11143. [Google Scholar] [CrossRef]
  15. Salvador, R.W.; Doong, R.-A. Simultaneous achievement of energy recovery and carbon sequestration through municipal solid waste management: A review. Chemosphere 2024, 361, 142478. [Google Scholar] [CrossRef]
  16. Gautam, M.; Agrawal, M. Greenhouse Gas Emissions from Municipal Solid Waste Management: A Review of Global Scenario. In Carbon Footprint Case Studies: Municipal Solid Waste Management, Sustainable Road Transport and Carbon Sequestration; Muthu, S.S., Ed.; Springer: Singapore, 2021; pp. 123–160. [Google Scholar] [CrossRef]
  17. United Nations Environment Programme and International Solid Waste Association, Beyond an Age of Waste Turning Rubbish into a Resource. 2024. Available online: https://wedocs.unep.org/20.500.11822/44939 (accessed on 10 March 2025).
  18. Ellen Macarthur Foundation. How the Circular Economy Tackles Climate Change. 2021. Available online: https://www.ellenmacarthurfoundation.org/completing-the-picture (accessed on 10 March 2025).
  19. Smith, A. Systemic Analysis of Circular Economy Principles in Agricultural Waste Management and Their Synergy with National Sustainable Development Objectives. 2025. Available online: https://neobibliotheca.com/index.php/TASCCDC/article/view/n-2025-02-07 (accessed on 10 March 2025).
  20. Cottes, M.; Mainardis, M.; Simeoni, P. Assessing the Techno-Economic Feasibility of Waste Electric and Electronic Equipment Treatment Plant: A Multi-Decisional Modeling Approach. Sustainability 2023, 15, 16248. [Google Scholar] [CrossRef]
  21. Geng, Y.; Doberstein, B. Developing the circular economy in China: Challenges and opportunities for achieving ‘leapfrog development. Int. J. Sustain. Dev. World Ecol. 2008, 15, 231–239. [Google Scholar] [CrossRef]
  22. Henriques, J.; Ferrão, P.; Castro, R.; Azevedo, J. Industrial Symbiosis: A Sectoral Analysis on Enablers and Barriers. Sustainability 2021, 13, 1723. [Google Scholar] [CrossRef]
  23. Cisi, M.; Napoli, R. Economic evaluation framework for Industrial Symbiosis through network lenses: A systematic literature review. Eur. J. Soc. Impact Circ. Econ. 2024, 5, 1–27. [Google Scholar] [CrossRef]
  24. Lawal, M.; Alwi, S.R.W.; Manan, Z.A.; Ho, W.S. Industrial symbiosis tools—A review. J. Clean. Prod. 2021, 280, 124327. [Google Scholar] [CrossRef]
  25. Ramírez-Rodríguez, L.C.; Ormazabal, M.; Jaca, C. Mapping sustainability assessment methods through the industrial symbiosis life cycle for a circular economy. Sustain. Prod. Consum. 2024, 50, 253–267. [Google Scholar] [CrossRef]
  26. Sacchi, R.; Ramsheva, Y.K. The effect of price regulation on the performances of industrial symbiosis: A case study on district heating. Int. J. Sustain. Energy Plan. Manag. 2017, 14, 39–56. [Google Scholar] [CrossRef]
  27. Mishan, E.Q.E.J. Cost-Benefit Analysis, 6th ed.; Routledge: London, UK, 2020; Available online: https://www.taylorfrancis.com/books/mono/10.4324/9781351029780/cost-benefit-analysis-euston-quah-mishan (accessed on 16 January 2025).
  28. Hansjürgens, B. Economic valuation through cost-benefit analysis—Possibilities and limitations. Toxicology 2004, 205, 241–252. [Google Scholar] [CrossRef] [PubMed]
  29. Reniers, G.; Talarico, L.; Paltrinieri, N. Chapter 16—Cost-Benefit Analysis of Safety Measures. In Dynamic Risk Analysis in the Chemical and Petroleum Industry; Paltrinieri, N., Khan, F., Eds.; Butterworth-Heinemann: Oxford, UK, 2016; pp. 195–205. [Google Scholar] [CrossRef]
  30. Loizidou, M. Waste Management and Symbiosis for Waste Valorization. Waste Biomass Valoriz. 2015, 6, 623–624. [Google Scholar] [CrossRef]
  31. Tsagkari, M.; Couturier, J.-L.; Kokossis, A.; Dubois, J.-L. Early-Stage Capital Cost Estimation of Biorefinery Processes: A Comparative Study of Heuristic Techniques. ChemSusChem 2016, 9, 2284–2297. [Google Scholar] [CrossRef]
  32. Environmental Industries Office. Material Flow Cost Accounting: MFCA Case Examples; Ministry of Economy, Trade and Industry: Tokyo, Japan, 2010. [Google Scholar]
  33. ISO 14051:2011; Environmental Management—Material Flow Cost Accounting—General Framework. International Organization for Standardization: Geneva, Switzerland, 2011.
  34. Kokubu, K.; Tachikawa, H. Material Flow Cost Accounting: Significance and Practical Approach∗. In Handbook of Sustainable Engineering; Kauffman, J., Lee, K.-M., Eds.; Springer: Dordrecht, The Netherlands, 2013; pp. 351–369. [Google Scholar] [CrossRef]
  35. Kasemset, C.; Chernsupornchai, J.; Palaud, W. Application of MFCA in waste reduction: Case study on a small textile factory in Thailand. J. Clean Prod. 2015, 108, 1342–1351. [Google Scholar] [CrossRef]
  36. Christ, K.L.; Burritt, R.L. ISO 14051: A new era for MFCA implementation and research. Rev. De Contab.-Span. Account. Rev. 2016, 19, 1–9. [Google Scholar] [CrossRef]
  37. Faria, E.; Caldeira-Pires, A.; Barreto, C. Social, economic, and institutional configurations of the industrial symbiosis process: A comparative analysis of the literature and a proposed theoretical and analytical framework. Sustainability 2021, 13, 7123. [Google Scholar] [CrossRef]
  38. Jacobsen, N.B. Applications and Implementation Industrial Symbiosis in Kalundborg, Denmark. A Quantitative Assessment of Economic and Environmental Aspects. 2006. Available online: https://onlinelibrary.wiley.com/doi/abs/10.1162/108819806775545411 (accessed on 10 March 2025).
  39. ISO 14052:2017; Environmental Management—Material Flow Cost Accounting—Guidance for Practical Implementation in a Supply Chain. International Organization for Standardization: Geneva, Switzerland, 2017.
  40. Schaltegger, S.; Christ, K.L.; Wenzig, J.; Burritt, R.L. Corporate sustainability management accounting and multi-level links for sustainability—A systematic review. Int. J. Manag. Rev. 2022, 24, 480–500. [Google Scholar] [CrossRef]
  41. Huang, S.Y.; Chiu, A.A.; Chao, P.C.; Wang, N. The Application of Material Flow Cost Accounting in Waste Reduction. Sus-tainability 2019, 11, 1270. [Google Scholar] [CrossRef]
  42. Walz, M.; Guenther, E. What effects does material flow cost accounting have for companies?: Evidence from a case studies analysis. J. Ind. Ecol. 2021, 25, 593–613. [Google Scholar] [CrossRef]
  43. Qu, L.; Wang, Z.; Sun, C.; Yin, L. Application of ABB in environmental management accounting: Incorporating MFCA into the budget process. Front. Environ. Sci. 2022, 10, 963903. [Google Scholar] [CrossRef]
  44. Lütje, A.; Leber, S.; Scholten, J.; Wohlgemuth, V. Web Tool for the Identification of Industrial Symbioses in Industrial Parks. In Advances and New Trends in Environmental Informatics; Kamilaris, A., Wohlgemuth, V., Karatzas, K., Athanasiadis, I.N., Eds.; Springer International Publishing: Cham, Switzerland, 2021; pp. 19–34. [Google Scholar]
  45. Yazdanpanah, V.; Yazan, D.M.; Zijm, W.H.M. Dynamics and Allocation of Transaction Cost in Multiagent Industrial Symbiosis. CoRR 020. Available online: https://arxiv.org/abs/2010.01361 (accessed on 10 March 2025).
  46. Dekamin, M.; Sadeghimofrad, T.; Ahmadloo, A. Energy, economic, and environmental (3E) assessment of the major greenhouse crops: MFCA-LCA approach. Environ. Sci. Pollut. Res. 2024, 31, 21894–21912. [Google Scholar] [CrossRef] [PubMed]
  47. Amicarelli, V.; Roe, B.E.; Bux, C. Measuring Food Loss and Waste Costs in the Italian Potato Chip Industry Using Material Flow Cost Accounting. Agriculture 2022, 12, 523. [Google Scholar] [CrossRef]
  48. Zeng, H.; Zhou, Z.; Xiao, X. MFCA extension from a life cycle perspective: Methodical refinements and use case. Resour. Policy 2021, 74, 101507. [Google Scholar] [CrossRef]
  49. Wagner, B. A report on the origins of Material Flow Cost Accounting (MFCA) research activities. J. Clean Prod. 2015, 108, 1255–1261. [Google Scholar] [CrossRef]
  50. Nishitani, K.; Kokubu, K.; Wu, Q.; Kitada, H.; Guenther, E.; Guenther, T. Material flow cost accounting (MFCA) for the circular economy: An empirical study of the triadic relationship between MFCA, environmental performance, and the economic performance of Japanese companies. J. Environ. Manag. 2022, 303, 114219. [Google Scholar] [CrossRef]
  51. Montag, L. Roadmap to a Circular Economy by 2030: A Comparative Review of Circular Business Model Visions in Germany and Japan. Sustainability 2023, 15, 5374. [Google Scholar] [CrossRef]
  52. Schmidt, M. The interpretation and extension of Material Flow Cost Accounting (MFCA) in the context of environmental material flow analysis. J. Clean Prod. 2015, 108, 1310–1319. [Google Scholar] [CrossRef]
  53. ISO 14053:2021; Environmental Management—Material Flow Cost Accounting—Guidance for Phased Implementation in Organizations. International Organization for Standardization: Geneva, Switzerland, 2021.
  54. Lütje, A.; Möller, A.; Wohlgemuth, V. A Preliminary Concept for an IT-Supported Industrial Symbiosis (IS) Tool Using Extended Material Flow Cost Accounting (MFCA)—Impulses for Environmental Management Information Systems (EMIS). In Advances and New Trends in Environmental Informatics; Bungartz, H.-J., Kranzlmüller, D., Weinberg, V., Weismüller, J., Wohlgemuth, V., Eds.; Springer International Publishing: Cham, Switzerland, 2018; pp. 167–181. [Google Scholar]
  55. Walls, C.; Putri, A.R.K.; Beck, G. Material Flow Cost Accounting as a Resource-Saving Tool for Emerging Recycling Technologies. Clean Technol. 2023, 5, 652–674. [Google Scholar] [CrossRef]
  56. Maulana, Y.; Dendi, P.; Rahmawati, T. Material Flow Cost Accounting to Enhance Sustainable Development: A Green Accounting Perspective. J. Ris. Akunt. Terpadu 2024, 17. [Google Scholar] [CrossRef]
  57. Christ, K.L.; Burritt, R.L. Water management accounting: A framework for corporate practice. Clean Prod. 2017, 152, 379–386. [Google Scholar] [CrossRef]
  58. Patricio, J.; Kalmykova, Y.; Rosado, L.; Cohen, J.; Westin, A.; Gil, J. Method for identifying industrial symbiosis opportunities. Resour. Conserv. Recycl. 2022, 185, 106437. [Google Scholar] [CrossRef]
  59. Rieckhof, R.; Bergmann, A.; Guenther, E. Interrelating material flow cost accounting with management control systems to introduce resource efficiency into strategy. J. Clean Prod. 2015, 108, 1262–1278. [Google Scholar] [CrossRef]
  60. Zion Market Research. Potassium Nitrate Market Industry Perspective. Available online: https://www.zionmarketresearch.com/report/potassium-nitrate-market (accessed on 6 December 2024).
  61. Trädgårdsproduktion, J. The Swedish Board of Agriculture. 2020. Available online: https://jordbruksverket.se/om-jordbruksverket/jordbruksverkets-officiella-statistik/jordbruksverkets-statistikrapporter/statistik/2021-06-29-tradgardsproduktion-2020 (accessed on 16 January 2025).
  62. Iacovidou, E.; Velenturf, A.P.M.; Purnell, P. Quality of resources: A typology for supporting transitions towards resource efficiency using the single-use plastic bottle as an example. Sci. Total Environ. 2019, 647, 441–448. [Google Scholar] [CrossRef]
  63. Velenturf, A.P.M.; Purnell, P.; Tregent, M.; Ferguson, J.; Holmes, A. Co-Producing a Vision and Approach for the Transition towards a Circular Economy: Perspectives from Government Partners. Sustainability 2018, 10, 1401. [Google Scholar] [CrossRef]
  64. Eurostat. Electricity Prices for Non-Household Consumers. Available online: https://ec.europa.eu/eurostat/statistics-explained/index.php?title=Electricity_price_statistics#Electricity_prices_for_non-household_consumers (accessed on 16 January 2025).
  65. Indexmundi. Commodity Price Indices: Potassium Chloride. 2022. Available online: https://www.indexmundi.com/commodities/?commodity=potassium-chloride&months=60&currency=eur (accessed on 16 January 2025).
  66. AHDB. Fertiliser Prices. Available online: https://ahdb.org.uk/GB-fertiliser-prices (accessed on 16 January 2025).
  67. Procurement Resource. Hydrochloric Acid Price Trend. Available online: https://www.procurementresource.com/resource-center/hydrochloric-acid-price-trends (accessed on 16 January 2025).
Figure 1. Quantity centres in MFCA, including examples of costs and material flows relevant for the analysis.
Sustainability 17 02730 g001
Figure 2. Generic overview of inputs and outputs from a QC. Positive outputs on the left-hand side refer to intermediates from a previous QC.
Sustainability 17 02730 g002
Figure 3. Integration of MFCA assessments between companies within a supply chain and between supply chains.
Sustainability 17 02730 g003
Figure 4. (a) KNO3 production process scheme baseline and (b) production process scheme after IS implementation.
Sustainability 17 02730 g004
Figure 5. (a) Use of resources and product generation (a) before and (b) after implementing IS actions.
Sustainability 17 02730 g005
Figure 6. Overview of the Swedish case study at design phase. The green box illustrates the boundary conditions of the present paper, whereas the industrial symbiosis is shown in grey.
Sustainability 17 02730 g006
Figure 7. Cost allocation method for positive outputs and negative products.
Sustainability 17 02730 g007
Figure 8. Schematic overview of amine-based CO2 capture and storage (a), with scrubbing (b), CO2 provided by an external supplier (c), and natural gas boiler (d).
Sustainability 17 02730 g008
Figure 9. Chart for evaluating CO2 demand for a 10 ha greenhouse in the Swedish case study.
Sustainability 17 02730 g009
Figure 10. Sankey diagram of mass and energy (a) and the cost (b) flows for KNO3 production baseline.
Sustainability 17 02730 g010
Figure 11. Sankey diagram of mass and energy (a) and the cost (b) flows for KNO3 production after IS implementation.
Sustainability 17 02730 g011
Figure 12. Sankey diagrams for mass and energy flows in the different cases shown in Figure 8. (a) Carbon Capture Utilization (CCU) scenario: CO₂ is captured from the neighbouring paper mill using a CCU technique. (b) Flue gas cleaning scenario: CO2 is obtained by cleaning the industry’s flue gases with a scrubber. (c) External supplier scenario: CO2 is provided by an external supplier instead of an industrial symbiosis collaboration. (d) Natural gas boiler scenario: CO2, heat, and electricity are supplied through a natural gas boiler.
Sustainability 17 02730 g012aSustainability 17 02730 g012b
Figure 13. Sankey diagrams for cost flows for the four different cases shown in Figure 8. (a) Carbon Capture Utilization (CCU) scenario: CO2 is captured from the neighbouring paper mill using a CCU technique. (b) Flue gas cleaning scenario: CO2 is obtained by cleaning the industry’s flue gases with a scrubber. (c) External supplier scenario: CO2 is provided by an external supplier instead of an industrial symbiosis collaboration. (d) Natural gas boiler scenario: CO2, heat, and electricity are supplied through a natural gas boiler.
Sustainability 17 02730 g013
Table 1. Summary of key studies on MFCA and industrial symbiosis.
ReferenceMethodologyFocus AreasLimitationsRemarks
[42]Meta-analysis of 73 MFCA case studiesEffects and challenges of MFCA implementation in companiesLimited data availability may affect reliability; potential reporting bias in case study selectionProvides a broad synthesis of MFCA applications, highlighting common benefits and challenges. Offers practical insights for companies considering MFCA adoption and serves as a foundation for further research.
[43]MFCA-ABB (Activity-Based Budgeting)Integration of MFCA into budgeting for forecasting resource use, product output, and waste generation in manufacturingPrimarily applied to a single case study (liquor production), limiting generalisability; MFCA is traditionally ex-post, requiring further validation for predictive useExpands MFCA from reporting to proactive planning, enabling environmental–economic budgeting. Demonstrates the potential for adapting conventional management accounting tools to sustainability-focused decision making.
[44]Development of a web tool for identifying industrial symbiosisIdentification of potential synergies in industrial parksFocuses on the development phase; lacks extensive field applicationIntroduces a web-based tool aimed at facilitating the discovery of industrial symbiosis opportunities, potentially integrating MFCA data for enhanced decision making.
[45]Multiagent simulation of transaction costs in industrial symbiosisAnalysis of transaction cost dynamics in symbiotic networksTheoretical model; requires empirical validationProvides insights into the economic interactions within industrial symbiosis networks, which could be complemented by MFCA for a comprehensive economic assessment.
[46]Integration of LCA and MFCAEconomic, energy, and environmental (3E) sustainability of greenhouse crop production (cucumber, tomato, and bell pepper)LCA alone does not account for economic losses from resource inefficiencies; reliance on subsidies may distort economic feasibilityMFCA complements LCA by quantifying the economic impact of waste and inefficiencies
[47]MFCAEconomic and environmental impacts of food loss and waste in the Italian salty snack sector before and during COVID-19Focuses on a specific food sector (potato chips), limiting generalisabilityDemonstrates MFCA’s potential to quantify economic losses from waste and inefficiencies, supporting circular economy strategies and food waste management policies
[48]MFCA-LCA integrated modelLifecycle extension of MFCA, integrating environmental damage valuation and cost accountingLacks empirical validation beyond the case study; theoretical framework still developingExpands MFCA applicability by incorporating lifecycle assessment, offering a more comprehensive sustainability evaluation for decision making in enterprises.
Table 2. Allocated production costs for positive and negative products for the four cases shown in Figure 8.
OptionAllocated Production Cost for TomatoesAllocated Production Cost
for Plant Residues
A1.30 EUR/kg1.33 EUR/kg
B1.04 EUR/kg1.07 EUR/kg
C1.07 EUR/kg1.10 EUR/kg
D1.23 EUR/kg1.26 EUR/kg
Disclaimer/Publisher’s Note: The statements, opinions and data contained in all publications are solely those of the individual author(s) and contributor(s) and not of MDPI and/or the editor(s). MDPI and/or the editor(s) disclaim responsibility for any injury to people or property resulting from any ideas, methods, instructions or products referred to in the content.

