Article

The Productivity and Nutrient Use Efficiency of Rice–Rice–Black Gram Cropping Sequence Are Influenced by Location Specific Nutrient Management

1
Department of Agronomy, Centurion University of Technology and Management, Odisha 761211, India
2
Department of Agronomy, Palli Siksha Bhavana, Visva-Bharati, Sriniketan 731204, India
3
International Plant Nutrition Institute, South Asia (East India and Bangladesh) Program, India and African Plant Nutrition Institute, Benguerir 43150, Morocco
4
Department of Agriculture, Government of West Bengal, Burdwan 713128, India
5
Department of Biological Sciences, Faculty of Science, King Abdulaziz University, Jeddah 21577, Saudi Arabia
6
Department of Agronomy, Bangladesh Wheat and Maize Research Institute, Dinajpur 5200, Bangladesh
7
Department of Biology, College of Science, Taif University, P.O. Box 11099, Taif 21944, Saudi Arabia
8
Department of Agronomy, Faculty of Agriculture, Kafrelsheikh University, Kafr El-Shaikh 33516, Egypt
*
Authors to whom correspondence should be addressed.
Sustainability 2021, 13(6), 3222; https://doi.org/10.3390/su13063222
Submission received: 31 January 2021 / Revised: 3 March 2021 / Accepted: 9 March 2021 / Published: 15 March 2021

Abstract

:
Nutrient management is critical for rice farming because the crop is grown under diverse conditions, and in most cases, the existing nutrient management practices fail to achieve an attainable yield target. During recent years site specific nutrient management gained importance for a target yield with maximum nutrient use efficiency. Sufficient research work has not been carried out in this direction so far in the rice–rice–pulse (black gram) sequential cropping system under the red and lateritic belt of West Bengal, India. A multi-locational field experiment was conducted from July 2013 to June 2015 at three different locations, namely, Guskara (Burdwan district) and Benuriya (Birbhum district) villages in farmers’ fields and at the university farm of Visva-Bharati, Sriniketan, West Bengal, India. The performance of nutrients was tested by providing ample doses of N, P, K, S, and Zn compared to the omission of these nutrients. The growth parameters, such as crop biomass production, leaf area index, and number of tillers, and yield attributes and yield were influenced by nutrient management treatments. Application of 100% of N, P, K, S, and Zn resulted in its superiority to other nutrient management options studied, and a similar trend was also noted with the treatment in the expression of nutrient use efficiency (NUE) and nutrient response (NR). The available N, P, K, S, and Zn contents in soil increased steadily due to the increase in fertilizer application. The study concluded that optimization of NPK in the rice–rice–pulse cropping system on target yield along with need-based S and Zn application was beneficial for higher productivity.

1. Introduction

Nutrient management is critical for profitable rice farming in Asia because fertilizers incur the second-highest input cost after labor. A study in seven major irrigated rice areas in six Asian countries showed that fertilizers represented 11 to 28% of the annual costs for farmers producing rice [1]. Fertilizers must be applied by adopting the 4R rule, that is, right source, rate, time, and place for enhancement of efficiency of nutrients applied by increasing yield. Substantial portions of added fertilizer N are often lost from rice soils as gases through ammonia volatilization and nitrification–denitrification, especially when nitrogenous fertilizer is applied at rates and times synchronized with the demand of the rice crop for supplemental N [2]. In India, rice is grown in the largest area in the world, with the second-largest production (112.9 Mt) next to China [3]. Rice occupies 43.7 Mha, and it is about one-fourth of the total cropped area, and more than 40 percent of food grain production [4]. At the current rate of population growth in India, the requirement for rice is estimated to be around 150 million tons within the next fifty years. To make India self-sufficient in rice, the productivity needs to be improved to a greater extent, compared to the existing condition. Food security in India (with a population of 1.6 billion by 2050, the country requires 450 Mt of food grain production) is a challenge [5], and the options available are very limited.
Among the various possible genetic approaches to achieve this target, the use of hybrid rice is the most feasible and readily adaptable one, which can increase food production by 15% to 20% [6]. The commercial success of hybrid rice in China has clearly demonstrated the potential of this technology to satisfy the demands for rice. Efforts to develop and use hybrid rice technology in India, Indian Council of Agricultural Research (ICAR) took the initiative in 1989, with the launch of a mission-oriented project. Within a short period of seven years, half a dozen hybrids from public and private sectors were made available for commercial cultivation. In India, the area under hybrid rice was 2 million hectares, i.e., approximately 5% of the total rice area in 2011–2012.
Growing high yield varieties (HYV) is commonly observed for rice cultivation, especially in the states of eastern India. West Bengal is a leading rice growing state with an area, production, and productivity of 5.15 m ha, 15.09 m ton, and 2933 kg ha-1, respectively (2017–2018) [4]. Out of the total rice areas in West Bengal, more than 90% is planted under HYVs, and nearly 5% is covered by hybrid rice. In rice cultivation, high analysis chemical fertilizers are mainly applied to provide three primary nutrients, namely nitrogen (N), phosphorus (P), and potassium (K). However, these fertilizers are not applied in a balanced manner as per the supplier’s recommendations. The farmers are more inclined towards N application which results in imbalanced fertilization. Balanced NPK nutrition is critical for producing maximum rice yield as it promotes vigorous and early plant growth and the development of strong root systems, profuse tillering, flowering, fruiting, and many other biochemical processes in the plant. This practice resulted in a deficiency of some other nutrients, including micronutrients, in the rice-based cropping system [7]. Micronutrient deficiency in rice is usually mentioned as a “hidden hunger” because its symptoms are hard to watch unless deficient plants are directly compared to sufficient plants [8].
In this context, site specific nutrient management (SSNM) may be considered as an alternative to a recommended need based fertilizer use across the rice production system as suggested by the International Rice Research Institute (IRRI) [9,10,11,12]. The hybrids and HYVs of rice are responsive to higher doses of nutrients in enhancing yield [13]. Rice responds well to added nitrogenous fertilizers to enhance productivity, but nitrogen use efficiency in rice is as low as 30–40%. P and K fertilizers are also important in rice cultivation. The responses of N, P, and K may be assessed by the “Omission Plots” trial techniques where a specific nutrient is going to be omitted to assess the soil’s inherent nutrient supply capacity. Therefore, there is a need for a study with the continuous omission of N, P, and K nutrients from selected plots. Compared to farmers’ practice, improved nutrient management can boost rice productivity. Buresh et al. [14] carried out field trials on omission plot techniques across the Philippines and noted yield improvement with the application of N, P, and K. The soil test-based approach improved harvest index increased the recovery efficiency of N and K and the corresponding economic benefits from rice cultivation. The N, P, and K rates for a given yield target were determined based on the previous studies for rice [10,15,16]. Kharif rice followed by boro rice followed by pulses is a very common cropping system in different districts of West Bengal. However, there is no specific nutrient management plan related to this rice–rice–pulse (pre-kharif black gram) cropping system. Further, the nutrient use efficiency has recently gained more attention with rising fertilizer costs and continued concern over environmental impairment. Nutrient use efficiency can be viewed from different perspectives based on yield and removal of nutrients. The most common expression of the efficiency of fertilizer nutrient is defined as the percentage of fertilizer recovered in aboveground plant biomass during the growing season. In general, N, P, and K are considered to estimate nutrient use efficiency. However, P and K can be viewed over the long term, while N efficiency is regarded on a short-term basis because of its transient nature. But where there is potential for building soil reserves, long-term N efficiency is appropriate because soil balance also affects N balance. Hence, a multi-location (both the on-station and on-farm) experiment was carried out to optimize nutrients (N, P, K, S, and Zn) with consideration of nutrient balance and nutrient use efficiency for sustaining productivity of the system and generation of awareness among the farmers about improved nutrient management practice in the rice–rice–pulse cropping system.

2. Materials and Methods

2.1. Site Characteristics

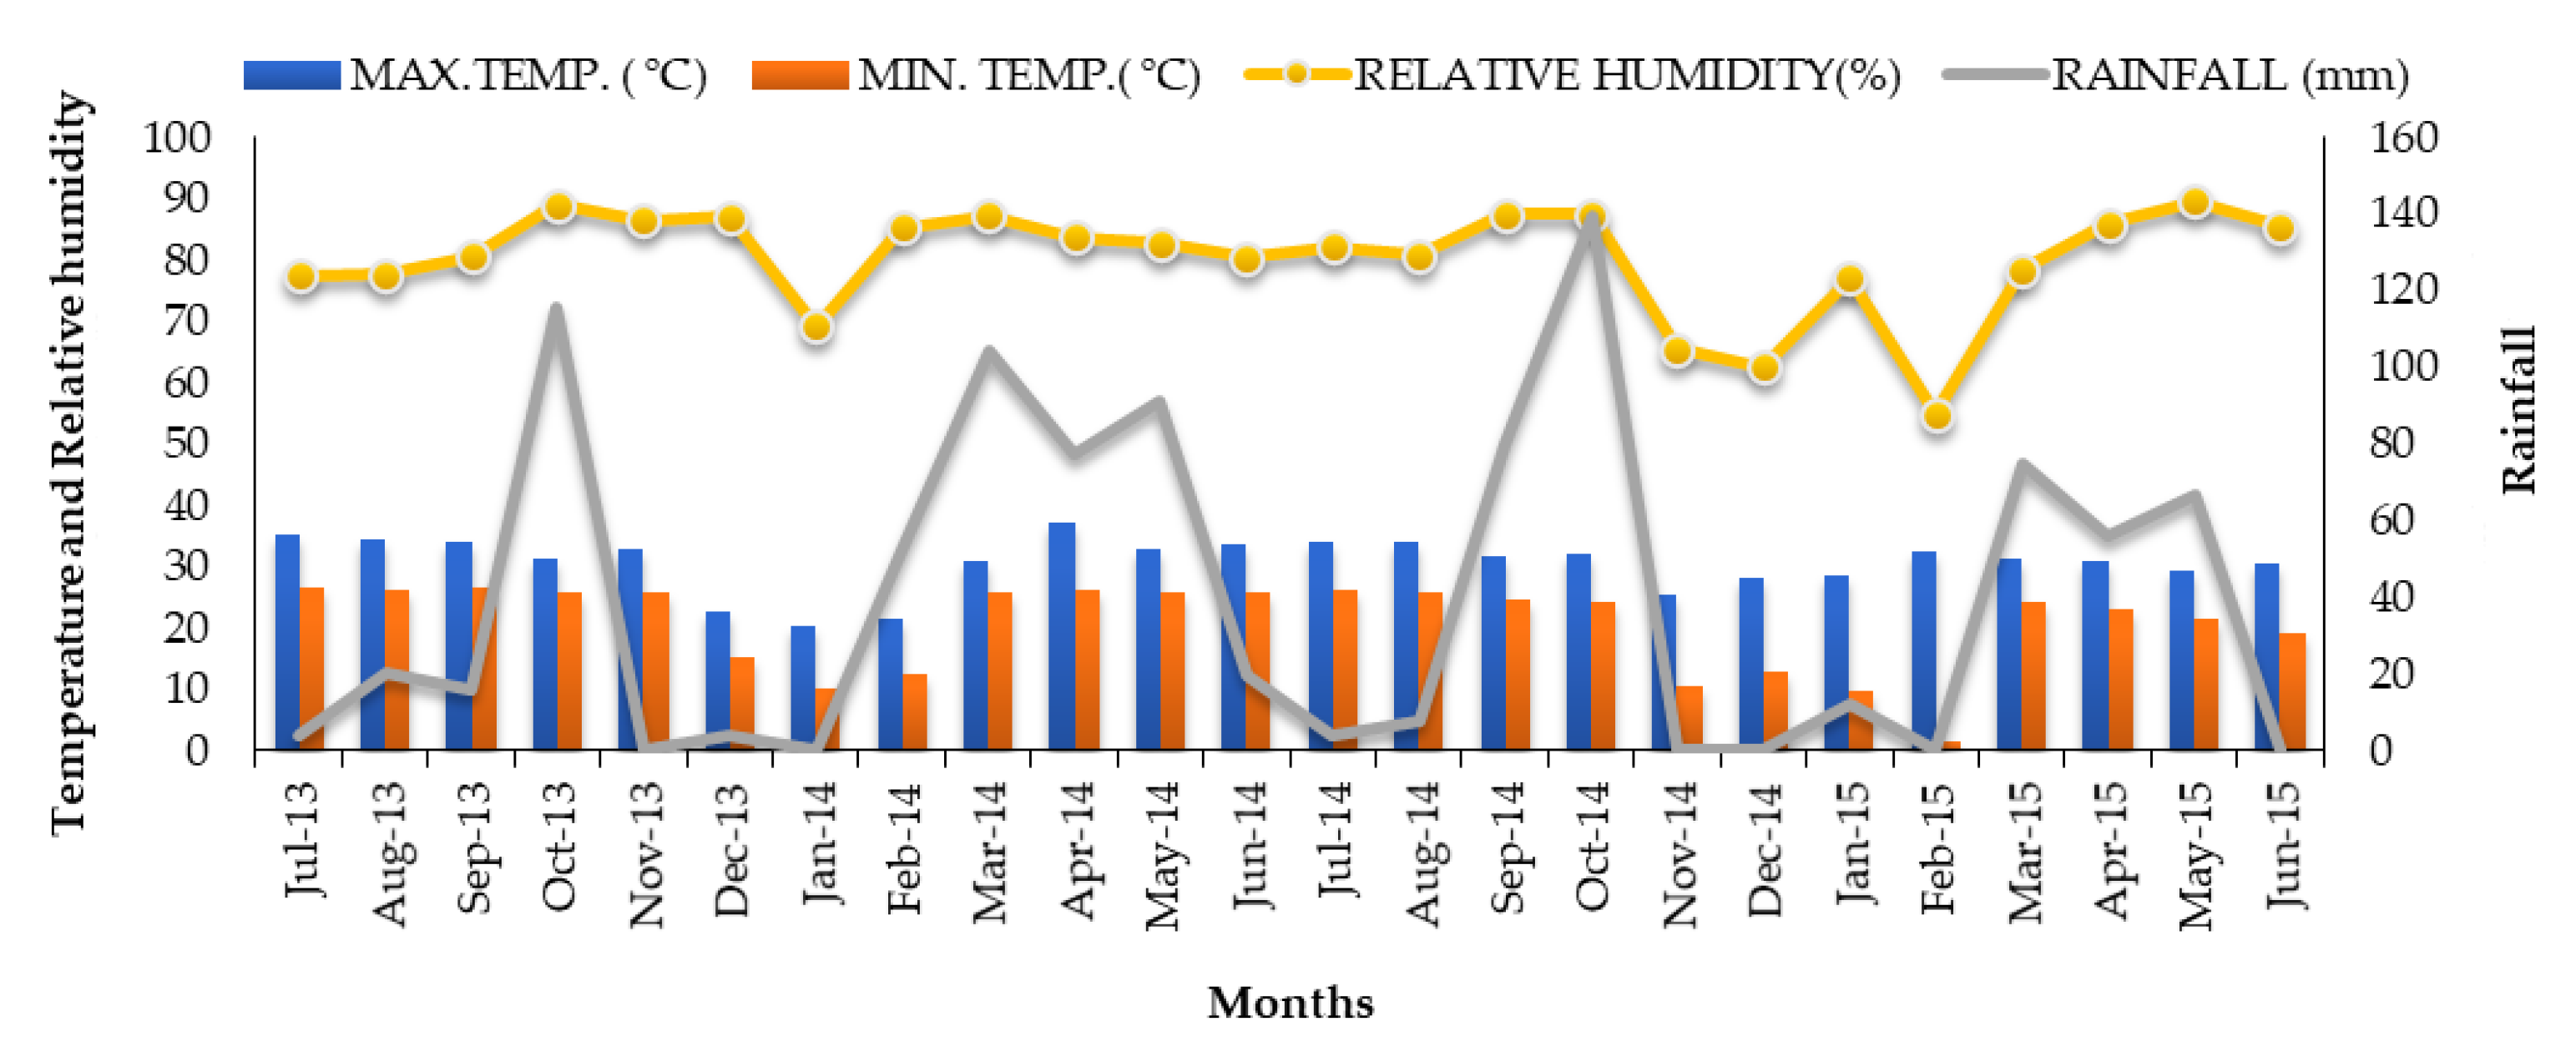
The field experiment was conducted at three different locations, namely, Guskara (Burdwan, 23°54′ N and 87°67′ E) and Benuriya (Birbhum district, 23°66′ N and 87°62′ E) villages in farmers’ fields and at a university farm of Visva-Bharati, Sriniketan, (23°66′ N and 87°65′ E) West Bengal, India under the typical Ultisols of the red and lateritic belt. The climate is sub-tropical, greatly influenced by hot, dry summers and cold winters. It falls in the region of the southwest monsoon, and monsoon rains generally start from the end of June and continue up to the middle of October.
The mean average annual rainfall is 1377 mm, out of which nearly 80–90% is received between June and October. The meteorological data related to the weather conditions prevailing during crop seasons (July 2013 to June 2015) with respect to rainfall, relative humidity, and temperature obtained from the agro-meteorological advisory services of the university is presented in Figure 1. The initial soil fertility status, particularly pH, organic carbon content (%), available N (kg ha−1), available P2O5 (kg ha−1), available K2O (kg ha−1), available S (kg ha−1), and available Zn (mg kg−1) was estimated in the laboratory at the beginning of the experiment (Table 1 and Table 2).
Table 1. Soil testing methodology.
ParticularsMethod Followed
pHDetermined with the help of pH meter in 1:2.5 ratio of soil water suspension [17]
Available nitrogen (kg ha−1)Alkaline permanganate method [18]
Available phosphorous (kg ha−1)Brays method No.1 [19]
Available potassium (kg ha−1)Flame photometer method [20]
Zinc (mg kg−1)Diethylenetriaminepentaacetate(DTPA) extractable Zn estimation by Atomic Absorption Soectroscopy (AAS) [21]
Sulfur (kg ha−1)Turbid metric method [22]
Table 2. Initial soil fertility status (July 2013).
ParametersSoil Test Values
GuskaraBenuriyaUniversity Farm
Textural classSandy loamSandy loamSandy loam
Sand (%)66.069.872.5
Silt (%)23.217.317.7
Clay (%)16.712.911.7
Soil pH5.125.305.11
Electrical conductivity (EC) (dS m−1)0.260.220.20
Organic carbon (%)0.350.330.32
Available N (kg ha−1)240.6229.2210.6
Available P (kg ha−1)12.2211.611.2
Available K (kg ha−1)120.0121.1120.5
Available Zn (mg kg −1)0.320.280.30
Available S (kg ha−1)17.517.917.7

2.2. Experimental Treatments and Design

The experiment was conducted for two years (six cropping seasons) during 2013–2014 and 2014–2015. The experiment was laid out in a Randomized Block Design with nine treatments (10 m × 10 m plots) and replicated thrice. The following treatments were set: T1: ample dose of N, P, K, S, and Zn; T2: P, K, S, and Zn, T3: N, K, S, and Zn; T4: N, P, S, and Zn; T5: N, P, K, and Zn; T6: N, P, K, and S, T7: local variety under the unfertilized check; T8: local variety under ample fertilizer; T9: control (without any fertilizer). The dose of nutrients in T1 was 150:60:70 kg ha−1 of N:P2O5:K2O and 200:80:90 kg ha−1 of N:P2O5:K2O in the kharif and boro seasons, respectively. In the case of T2: P, K, S, and Zn were applied with an ample dose, and N omitted. In T3: N, K, S, and Zn were applied with an ample dose, P omitted, and the same manner was applied for remaining treatments up to T6. But, in T7 (local variety ‘Kabirajsal’ in was taken in kharif and HYV ‘IR 36′ in boro) as unfertilized control (without any fertilizer) and in T9 (where HYV and hybrid were considered as ‘MTU 7029′ and ‘Arize Tej’ during the kharif and boro seasons, respectively) with ample dose of fertilizer as applied in T1. However, in T8, local variety ‘Kabirajsal’ in kharif and HYV ‘IR 36′ in boro were considered with ample dose of fertilizer as per the recommendations (T1) respectively). The ample dose of N, P, and K were calculated based on yield targets that were 5 t ha−1 and 7 t ha−1 in the kharif and boro seasons, respectively.

2.3. Experimental Procedure

The fertilizers were applied in the plots after layout as per treatments. The sources of fertilizers for nitrogen, phosphorus, and potash were urea, diammonium phosphate (DAP), and muriate of potash (MOP), respectively. The S was applied at 30 kg ha−1 through bentonite-S (90% S) and Zn at 3 kg ha−1 through Zn-Ethylenediamine tetraacetic acid (EDTA) (12% Zn) in rice as the basal dose during both seasons. After basal application, the top dressing of the remaining nitrogen was applied in two equal splits at maximum tillering and panicle initiation stages during both seasons. The HYV of kharif rice was ‘MTU 7029′ and hybrid of the boro season was ‘Arize Tej’ for the treatments T1 to T6 and T9, but for T7 and T8, the local variety of rice ‘Kabirajsal’ was taken during the kharif season and HYV IR 36 was chosen during the boro season. The black gram cultivar ‘Sarada’ was grown with residual soil fertility, after the harvest of hybrid boro rice (Table 3). The crops were irrigated as and when required. The weeds were removed manually at 20 and 40 days after transplanting (DAT). Plant protection measures were taken as per recommended protocols of the university.

2.4. Measurements and Analytical Procedures

2.4.1. Growth and Yield Attributes

The second rows from the border of each side of a plot were destructively sampled to record biometric observations, such as dry matter accumulation, number of tillers, and leaf area index (LAI). To determine yield attributes, five plants of each plot were randomly selected and marked. At maturity, these five plants were harvested, dried and their yield attributes were recorded. To determine dry matter accumulation, rice plants were cut at ground level from each plot randomly as destructive samples. Plants of each plot were dried in a hot air oven, kept at 65 °C for 48 h until constant weights were obtained. The dry weights were recorded and used for the determination of dry matter accumulation. The representative green leaves were taken randomly from destructive samples, and their areas were recorded by leaf area meter. The leaves were then dried in a hot air oven at 80 °C for 10 h until constant weights were obtained, and then weights were recorded. The ratio of leaf area weight−1 of these leaves was used to measure the leaf area indices. Since LAI is the area of leaf surface per unit of the land surface [23], it (LAI) was obtained by multiplying this ratio of area and weight with the dry weight of green leaf produced per unit area (square meter) of the land surface. The Leaf Area Index (LAI) during the period of 60 DAT was determined with the following formula (Equation (1)) [24].
Leaf   area   index   =   leaf   area ground   area

2.4.2. Collection and Analysis of Plant and Soil Samples

The crops were harvested manually from the whole plot (net area of 100 m2). Grain and straw sub-samples were drawn from each treatment plot after recording the yields. Further, plant samples were chopped into small pieces and washed in acidified detergent solution, and finally rinsed three times in deionized water. These plant samples were dried in a forced-air circulation oven at 65 °C to bring a constant weight. The samples were then pulverized in a wiring blender, which was cleaned with a hairbrush after each sample, and digested in di-acid (9:4 v/v) of nitric acid (HNO3)/perchloric acid (HClO4). The nutrient (N, P, K, S, and Zn) concentration in plant samples was determined by the methods (Table 1) as described by Subbiah and Asija [18]. For N content, grain and straw samples were digested in concentrated H2SO4-salicylic acid mixture and digestion mixture (potassium sulfate 400 parts, copper sulfate 20 parts, mercuric oxide 3 parts, selenium powder 1 part) and measured by following the micro-Kjeldahl method [18]. For estimation of P and K in plant samples, the vanadate molybdate method and flame photometer method [17] were used. The filtered sample was used for zinc (Zn) estimation with the help of atomic absorption spectrophotometer by adopting DTPA extractable Zn estimation method [21]. Sulfur in whole plant parts and seeds was estimated by the Turbid Metric Method by using a spectrophotometer at 490 λnm, and the concentration was expressed in percentage [22].
Five soil sub-samples (0–15 cm) from each plot were collected before the growing of rice during kharif 2013 (initial soil sample) and after the harvest of the crop in the rabi season of 2015 (post-harvest) using stainless steel tube augers. Initial soil samples were taken from 15cm topsoil. After uniform mixing of sub-samples, representative soil samples were air dried and ground to pass through a 2-mm stainless steel sieve for determination of different soil parameters by standard methods as mentioned in Table 1. The initial soil fertility has been mentioned in Table 2.

2.4.3. Calculation of Nutrient Indices

The agronomic efficiency (AE), physiological efficiency (PE), and nutrient response (NR) were calculated using the equations described by Ray et al. [25] as given below:
AE   ( kg   kg 1   nutrient ) = Gf     Go Na
where Gf is the economic (grain) yield of the fertilized plot (kg) and Go is the economic yield of the nutrient omitted plot (kg), and Na is the quantity of nutrient applied (kg).
PE   =   Gf     Go   Ntf Nto  
where Ntf is the nutrient accumulation by straw/stover and economic product in the fertilized plot (kg) and Nto is the nutrient accumulation by straw/stover and economic product in the nutrient omitted plot (kg).
NR   ( Kg   ha 1 ) = Gf     Go   .  

2.5. Calculations and Statistical Analysis

The experimental data were analyzed statistically by using analysis of variance (ANOVA). The standard error of means (SEm±) and critical difference at 5% probability level of significance (CD, p ≤ 0.05) [26]. The Excel software (Microsoft Office Home and Student version 2019-en-us, Microsoft Inc., Redmond, Washington, (USA) was used for statistical analysis and drawing graphs and figures.

3. Results and Discussion

3.1. Growth Parameters of Crops under Rice–Rice–Black Gram Cropping System

The pooled data of two years study are presented in Table 4 to show the impact of nutrient management on biomass production (gm−2) of kharif and boro rice. The observations showed a positive and favorable effect of nutrient management on improving biomass production of rice in different treatments under the study at various locations. The mean data of multi-locational trial indicated that treatments T1 and T8 with ample doses of nutrients (N, P, K, S, and Zn) registered significantly higher biomass yield compared to the same varieties/hybrid receiving omission nutrient doses (omission –N, –P, –K, –Zn, –S, and control) during different seasons. The maximum effect of omission was observed in N omission treatment (T2) followed by P (T3), K (T4), and other nutrients.
The data on tiller number (m−2) and leaf area index (LAI) of kharif and boro rice revealed that the nutrient management practices influenced the above growth parameters (Table 5 and Table 6). The treatments T1 and T8 with ample doses of nutrients (N, P, K, S, and Zn) registered significantly higher values of the number of tillers at 90 days after transplanting (DAT) and LAI at 60 DAT than treatments with the omission of N, P, K, Zn, and S and unfertilized control. Application of an ample dose of nutrients assured proper nutrition through uptake and metabolism, which were reflected in the enhancement of growth characters, such as biomass production, number of tillers, and leaf area index. Earlier, Buresh et al. [27] and Shankar et al. [28] noticed that increasing the level of nutrient application influenced the growth parameters of rice significantly.

3.2. Yield Attributes of Crops under Rice–Rice–Black Gram Cropping System

The pooled data on yield attributes of rice grown during both seasons clearly indicated that nutrient management treatments influenced panicle m−2, number of grains panicle−1, and test weight (Table 7, Table 8 and Table 9). The data of multi-locational trials revealed that treatments T1 and T8 with an ample dose of nutrients (N, P, K, S, and Zn) registered significantly more panicle m−2 than the same varieties/hybrid grown with omission plots (omission –N, –P, –K, –Zn, –S, and control) during different seasons. A similar type of observation was recorded with the number of grains panicle−1. The maximum effect of omission was observed in the treatment where N was omitted (T2), which was closely followed by the omission of P (T3) and K (T4) and other nutrients (namely S and Zn). In the case of test weight of rice varieties/hybrid grown in different seasons, much variation was not noted within treatments, and it was nonsignificant. The test weight is a genetic character that may or may not be influenced by nutrient levels. Similar observations on yield attributes of rice were noticed by earlier researchers [7,12,28].

3.3. Yield of Crops under Rice–Rice–Black Gram Cropping System

The yield data of the rice–rice–pulse (Pre-kharif black gram) cropping system was recorded for two years from different locations, and pooled data are presented in Table 10 and Figure 2, Figure 3 and Figure 4. The yield of the rice-based cropping system was positively affected by ample doses of N, P, K, S, and Zn for the target yield of 5 t ha−1 and 7 t ha−1 during the kharif and boro seasons of rice, respectively. Further, the residual effect of nutrients on Pre-kharif pulse as black gram was also satisfactory in terms of productivity where ample doses of nutrients were applied. With the application of an ample dose of N, P, K, S, and Zn in kharif rice, the high yielding variety ‘MTU 7029′ (T1) yielded much higher than local rice variety ‘Kabirajsal’ (T8). A similar result was observed between the hybrid rice ‘Arize Tej’ and HYV IR 36 during the boro season. In both the years, higher available nutrient was received to the rice crop due to the application of 100% N, P, K, S, and Zn (T1 and T8). Both the treatments expressed higher growth parameters, namely, dry matter production, leaf area index and tillers, and yield attributes (particularly, panicles m−2 and number of grains panicle−1), and the impact of these characters was reflected in the productivity of rice during kharif and rabi seasons.
On the other hand, the omission of nutrients reduced the availability of essential nutrients in the kharif season and more especially for the succeeding boro rice. The omission of N was more crucial as the mean data showed there was a yield reduction in rice by 43 and 45 percent during the kharif and boro seasons, respectively. Similarly, the omission of P and K reduced kharif rice grain yield by 9.7 and 3.8 percent, respectively; however, in boro, rice grain yield reduction was 11.2 and 8.6 percent, respectively. As the soil is rich in K, the omission of K reduced the grain yield of rice comparatively less than N and P during both seasons. The omission of S and Zn also did not reduce much yield of rice during both seasons. Moreover, pre-kharif black gram raised with residual nutrients also showed a similar trend in terms of productivity as noted in rice.
The omission of N decreased black gram yield by 27%, but the omission of P, K, S, and Zn decreased black gram productivity by 7.4, 2.9, 2.8, and 1.7%, respectively. Grain yield was positively correlated with the yield attributing characters (namely, panicle m−2 and number of grains panicle−1) of kharif and boro rice grown at different locations. The correlation values (R2) of the number of panicle m−2 were 0.9991, 0.9871, and 0.9891 during kharif and 1.0, 0.9323 and 0.9567 in the boro season for the locations of Guskara, Binuriya, and University farm, respectively (Figure 5, Figure 6, Figure 7 and Figure 8). In the case of the number of grains per panicle, the R2 values were 0.9752, 0.9815, and 0.9495 during kharif and 0.9491, 0.9647, and 0.9035 in the boro season for the locations of Guskara, Binuriya, and University farm, respectively. The results indicated the positive impact of balanced nutrition on the productivity of a rice-based cropping system. Similar results were also reported [12,28,29,30,31].

3.4. Nutrient Use Efficiency under Rice–Rice–Black Gram Cropping System

The pooled data of two years data showed the efficiency of applied nutrient in terms of NUE for grain production and presented in Table 11 and Table 12. The study highlighted that the balanced nutrient management practices showed a positive effect on agronomic efficiency (AE) and physiological efficiency (PE) in the rice-based sequential cropping system.
The AE and PE during both the seasons were greater in the treatment where crop received an ample dose of N, P, K, S, and Zn through chemical fertilizers than other fertility treatments, namely, the omission –N, –P, –K, –Zn, –S, and control. The results clearly showed that crop nutrition through an ample dose of chemical fertilizers was beneficial for improving productivity and nutrient use efficiency. The low response of crops to nitrogenous fertilizers was due to various nitrogen loss mechanisms, namely, ammonia volatilization, leaching, and denitrification. An enhancement of AE and PE was recorded with an ample dose of nutrients because of the proper relationship between source and sink, which ultimately resulted in a positive impact on the productivity of a rice-based cropping system. A similar finding was also reported by Singh and Bansal [32] and Xu et al. [33].

3.5. Nutrient Responses of Crops under Rice–Rice–Black Gram Cropping System

The mean data of the multi-location trial clearly revealed that the maximum nutrient response (Table 13) during the kharif season was noted when the crop received an ample dose of N, P, K, S, and Zn through chemical fertilizers, and it was closely followed by the omission of K and S. Similarly, in boro rice, the highest value of nutrient response was recorded with 100% application of N, P, K, S, and Zn, followed by the omission of sulfur and zinc. In the kharif season, the HYV ‘MTU 7029′ gave a better nutrient response over ‘Kabirajsal’, while the hybrid rice ‘Arize Tej’ proved more responsive over ‘IR 36′ during the boro season.
During the pre-kharif season, the residual effect of nutrients was tested by growing black gram, and the treatment with ample dose of N, P, K, S, and Zn resulted in the maximum nutrient response. The available N, P, K, S, and Zn contents in soil increased steadily due to increased fertilizers application. The highest available N, P, K, S, and Zn contents in soil were recorded from the treatment having an ample dose of N, P, K, S, and Zn, which were markedly higher than all other treatments. The increase in the nutrient of the soil in available form is necessary for sustaining crop productivity. Thus, optimization of NPK in rice–rice–pulse based cropping system on target yield basis along with need-based S and Zn application should be recommended for higher productivity and profitability, as mentioned by [33]. Early research evidence mentioned that interaction among essential nutrients influenced productivity of a rice-based cropping system, and it is important to make fertilizer recommendations for farmers of a locality [34].

4. Conclusions

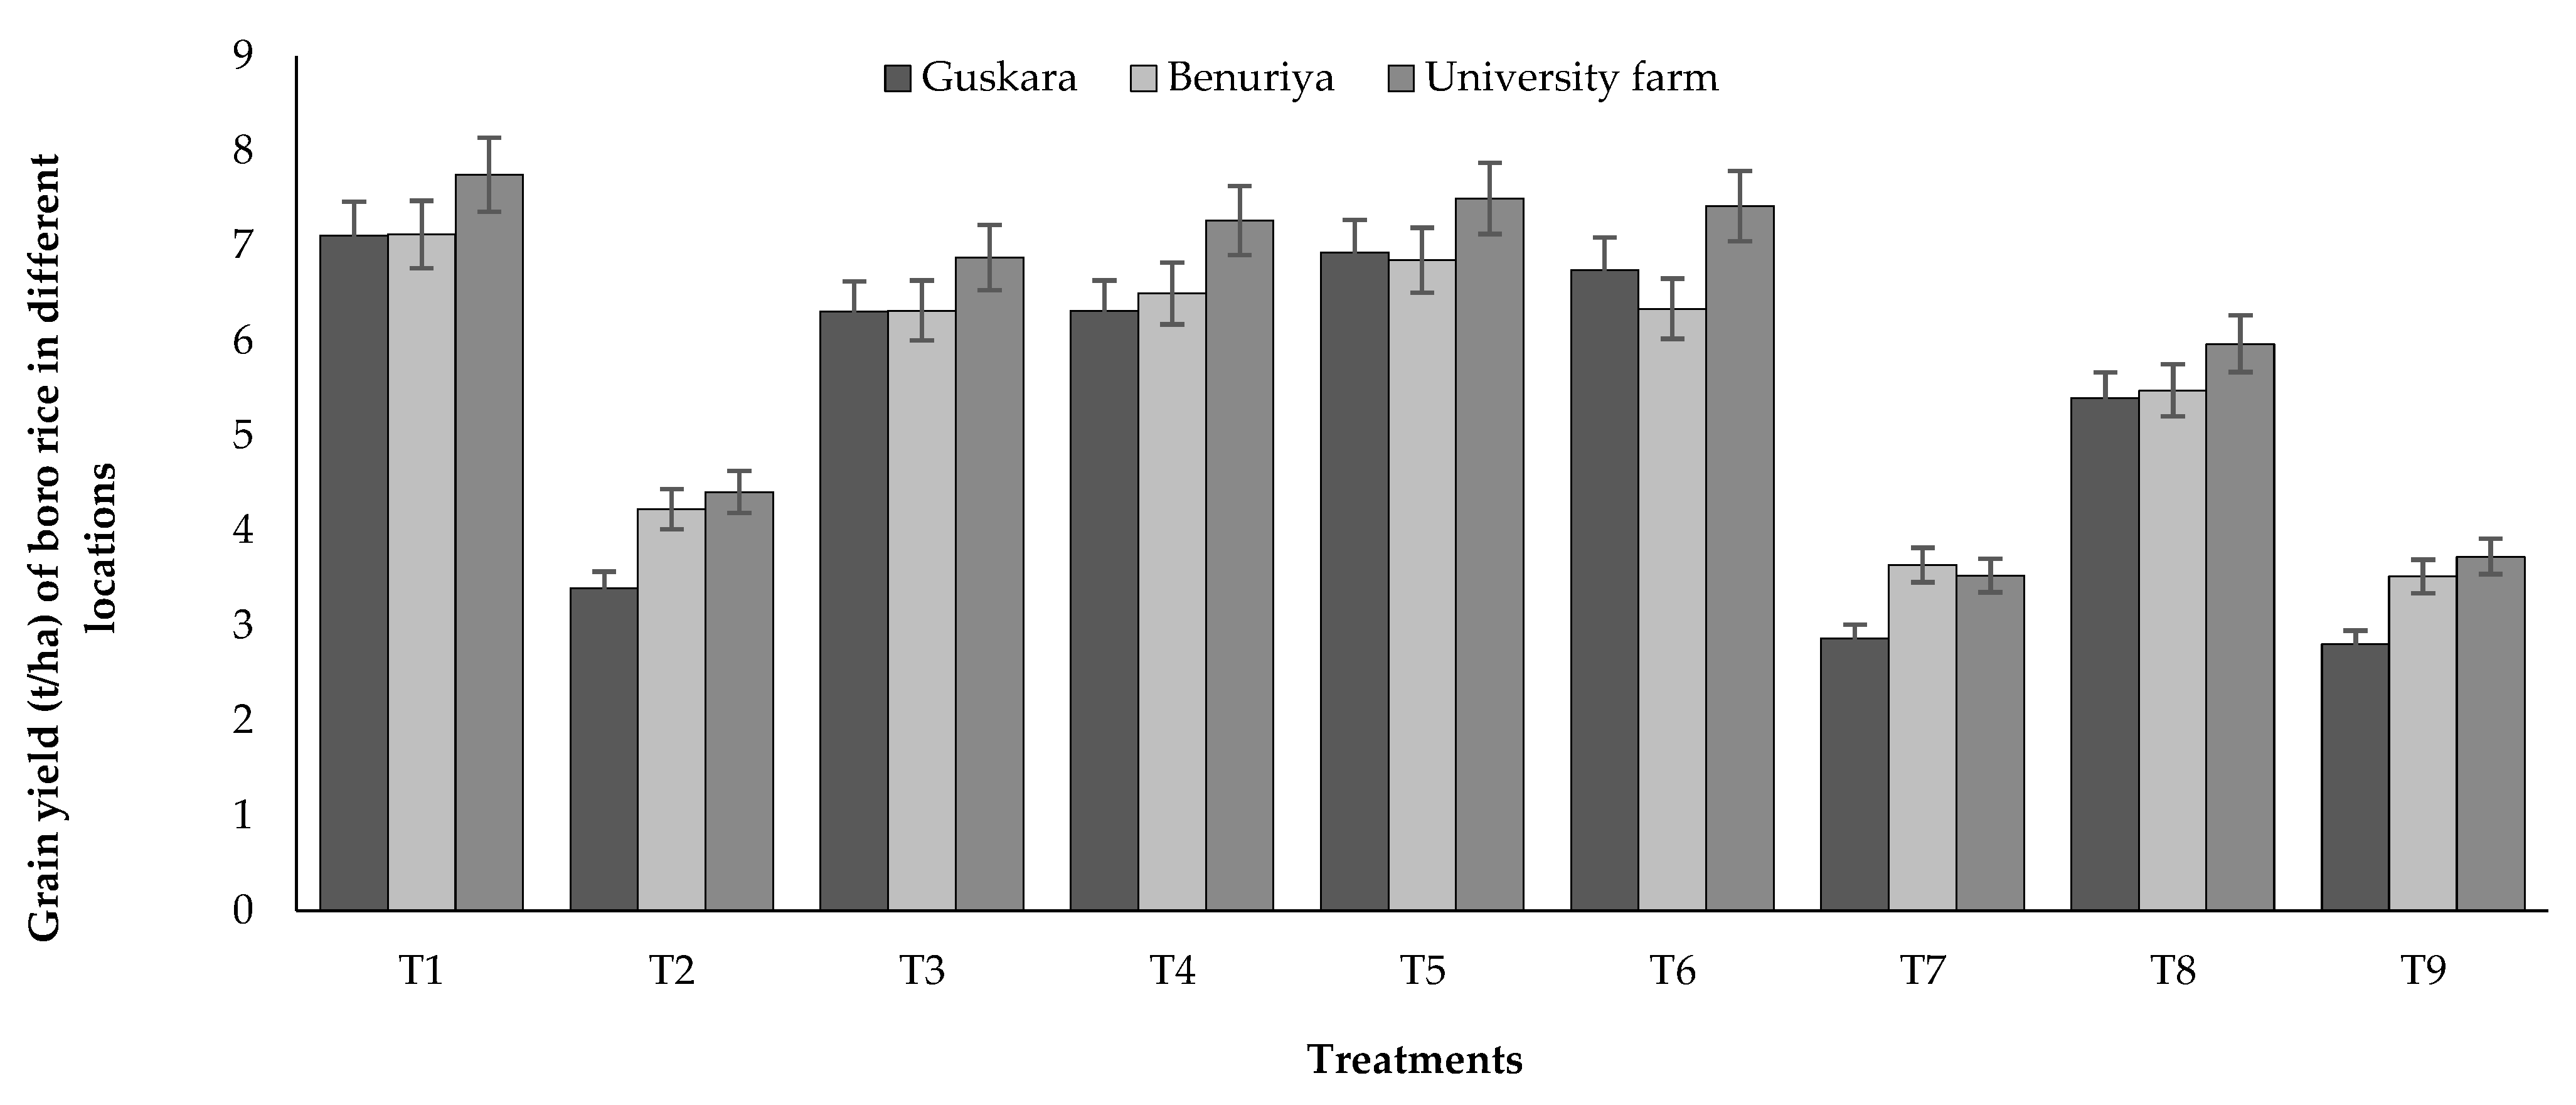
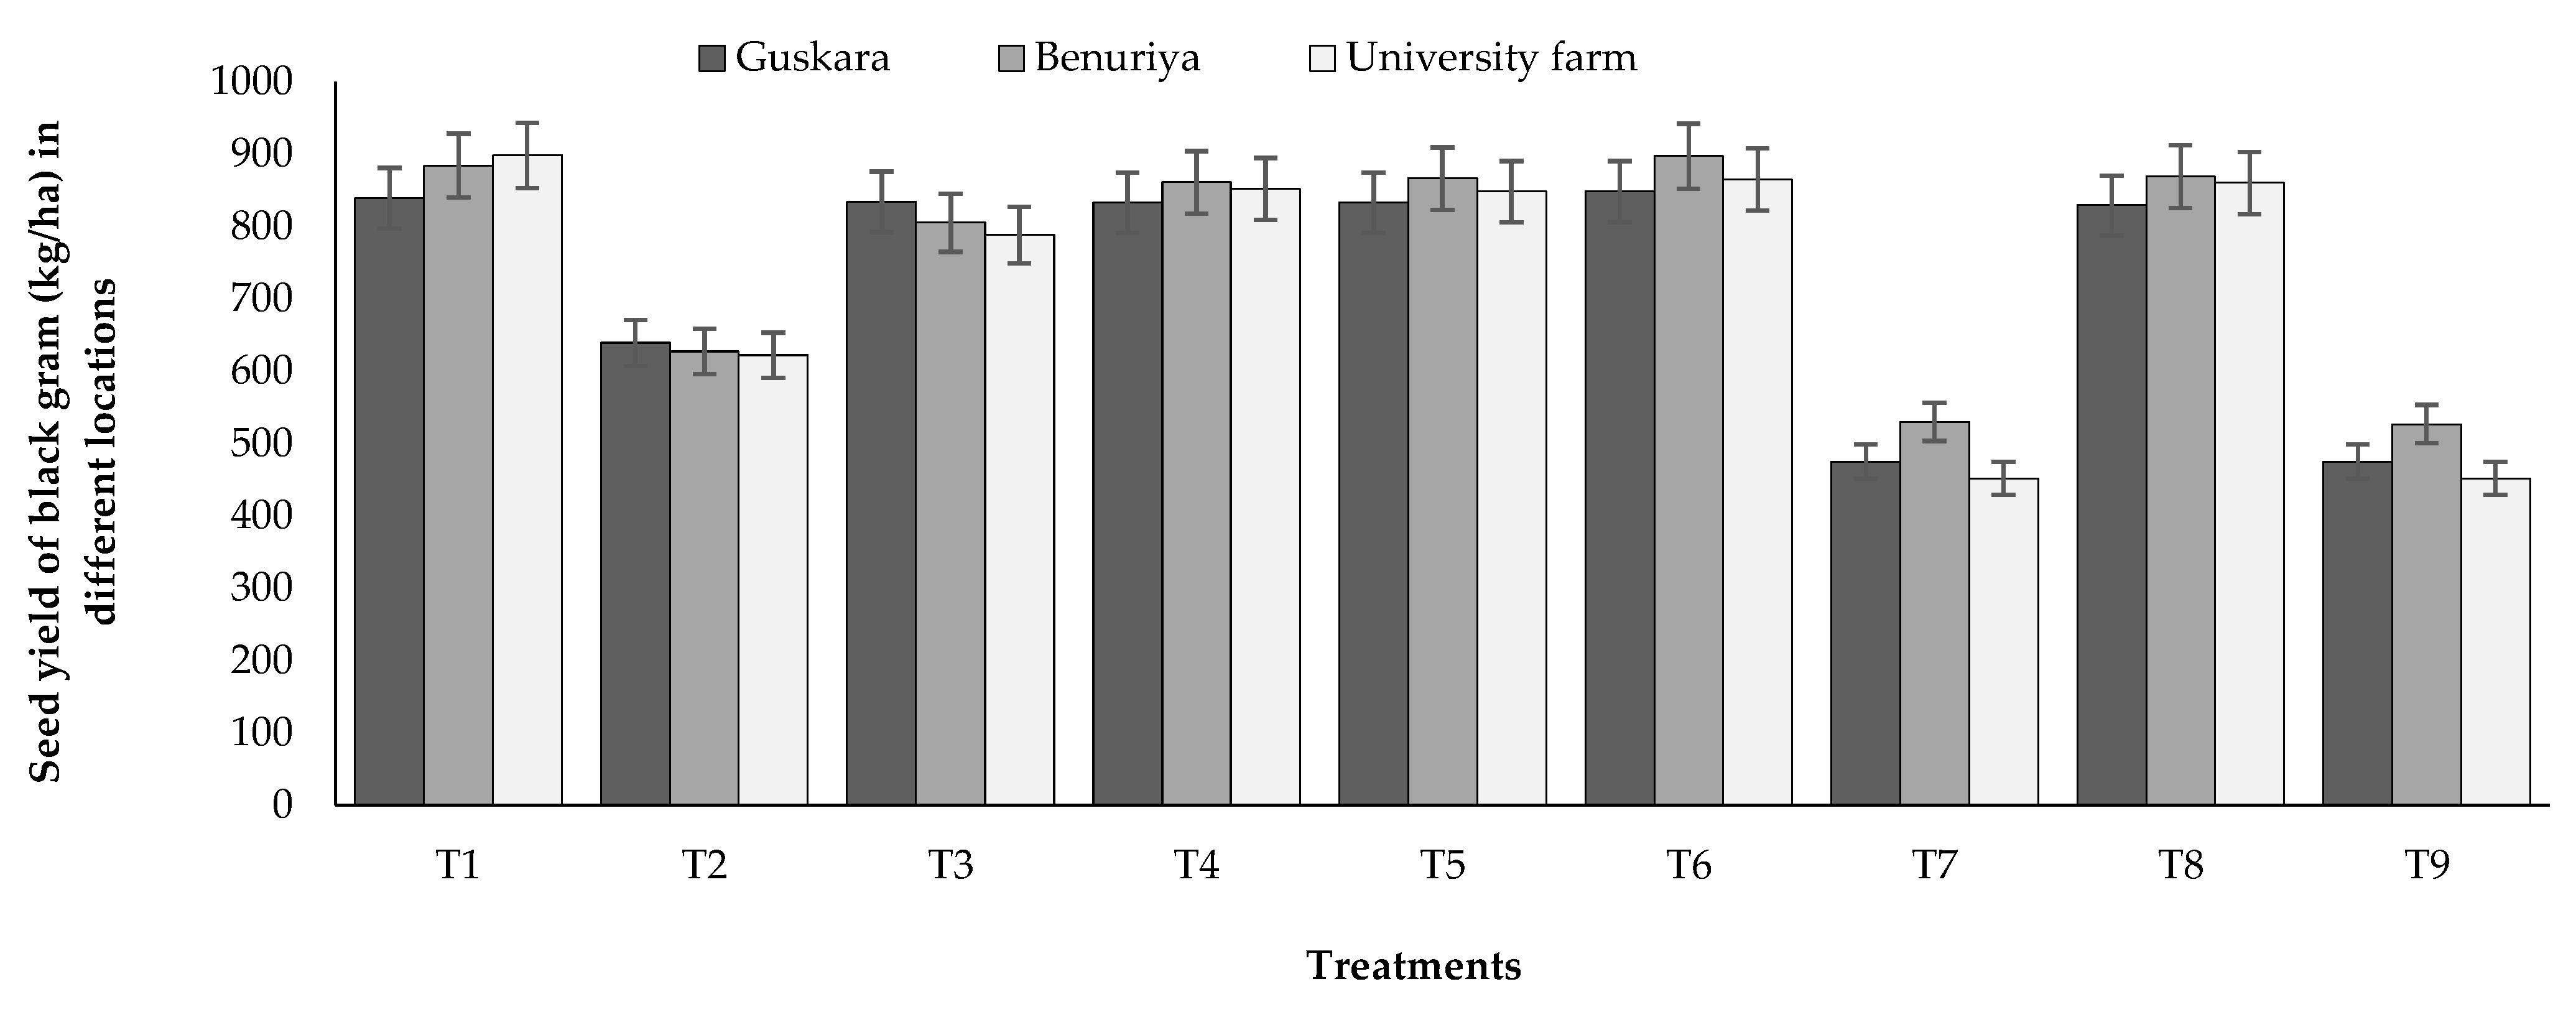
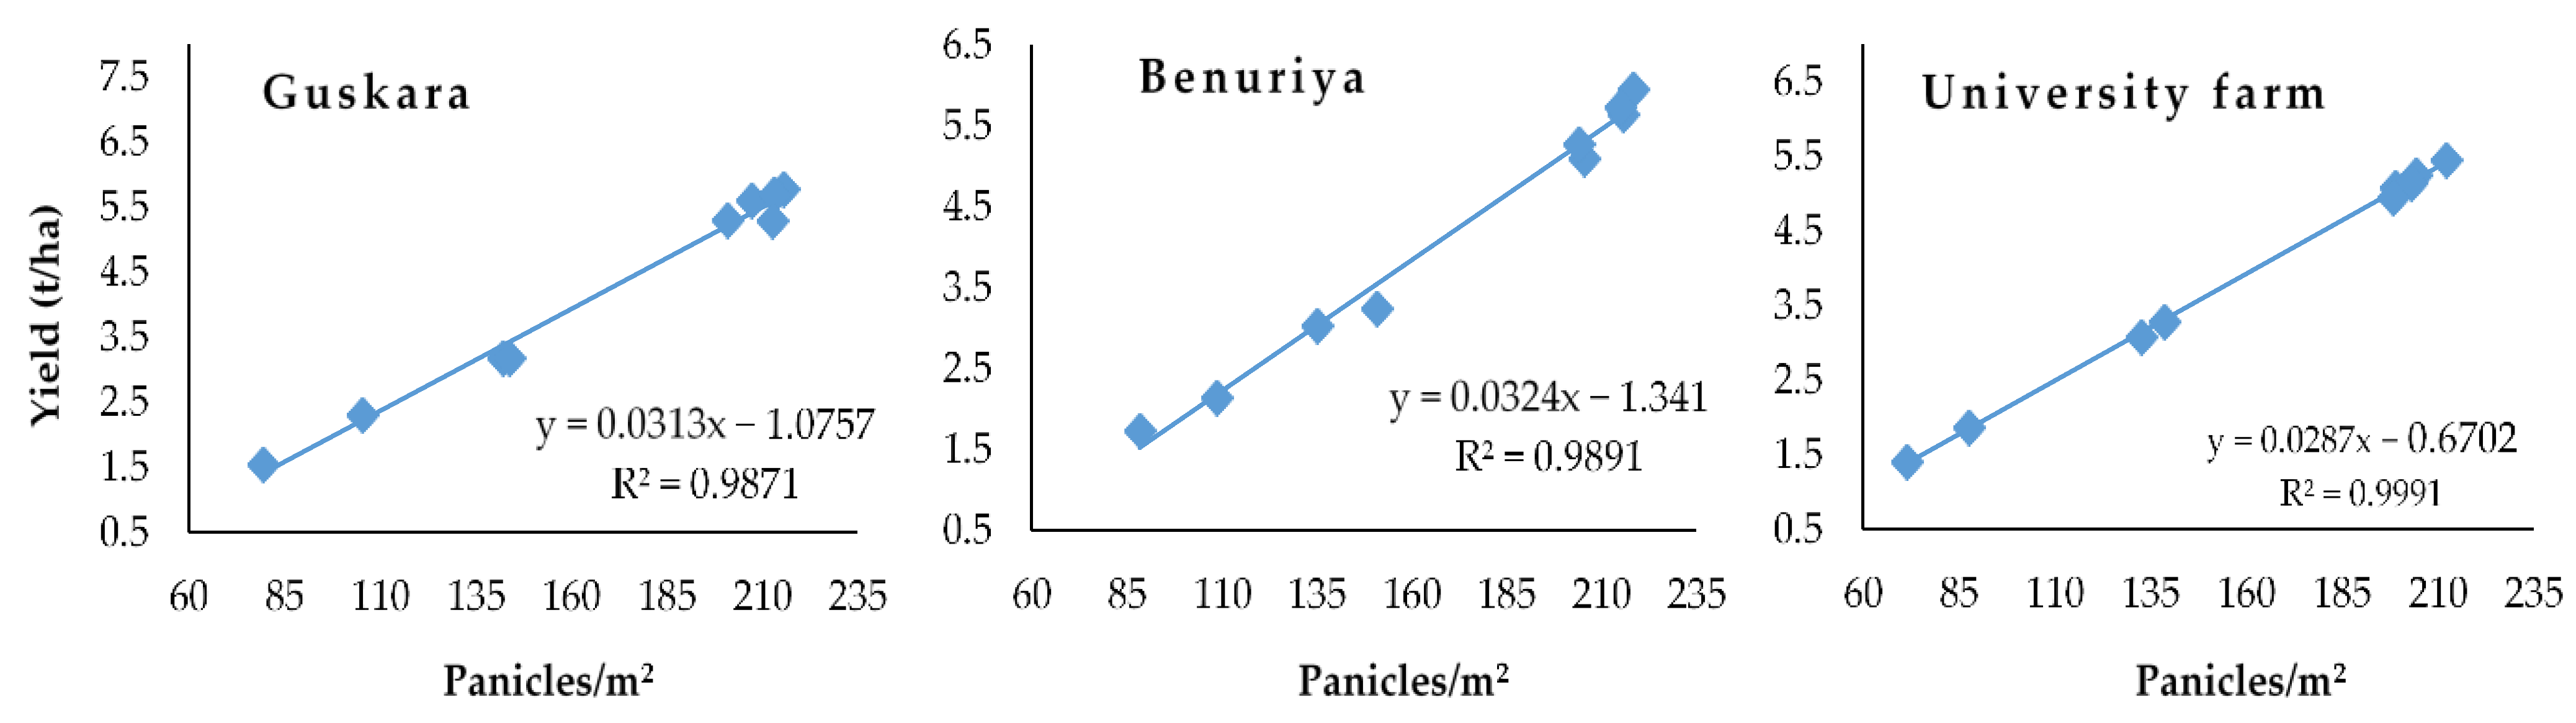
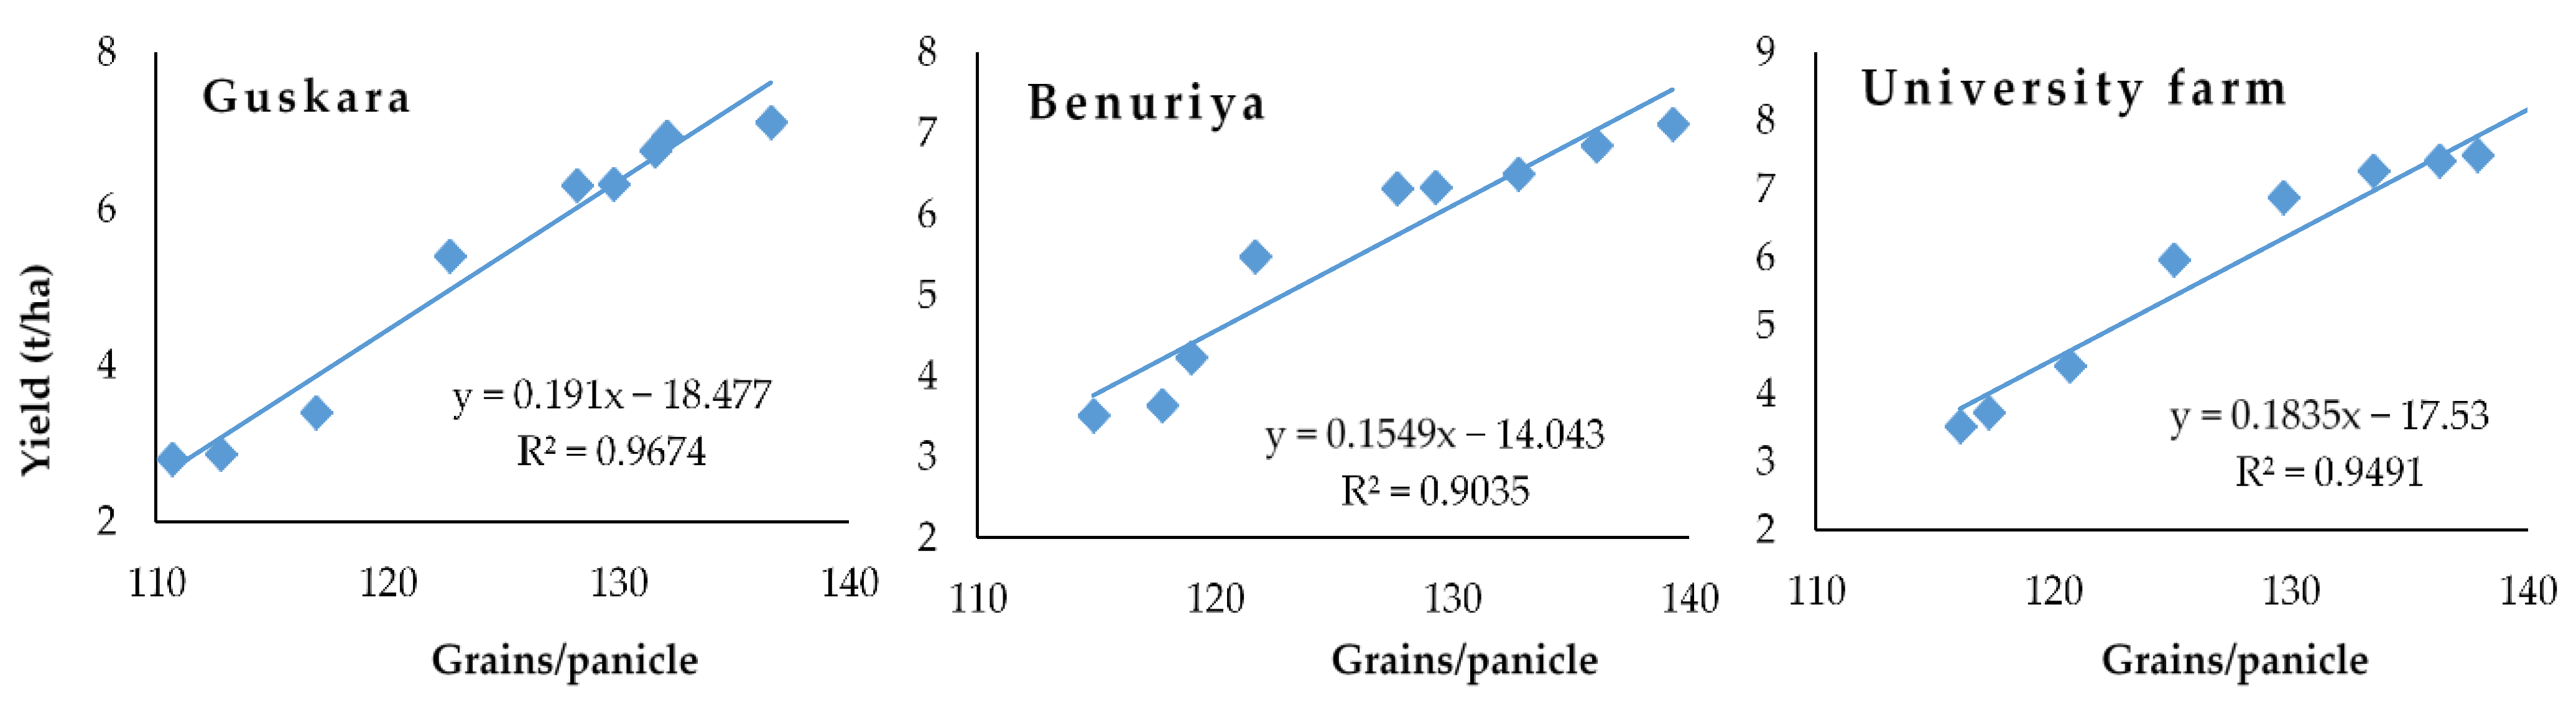
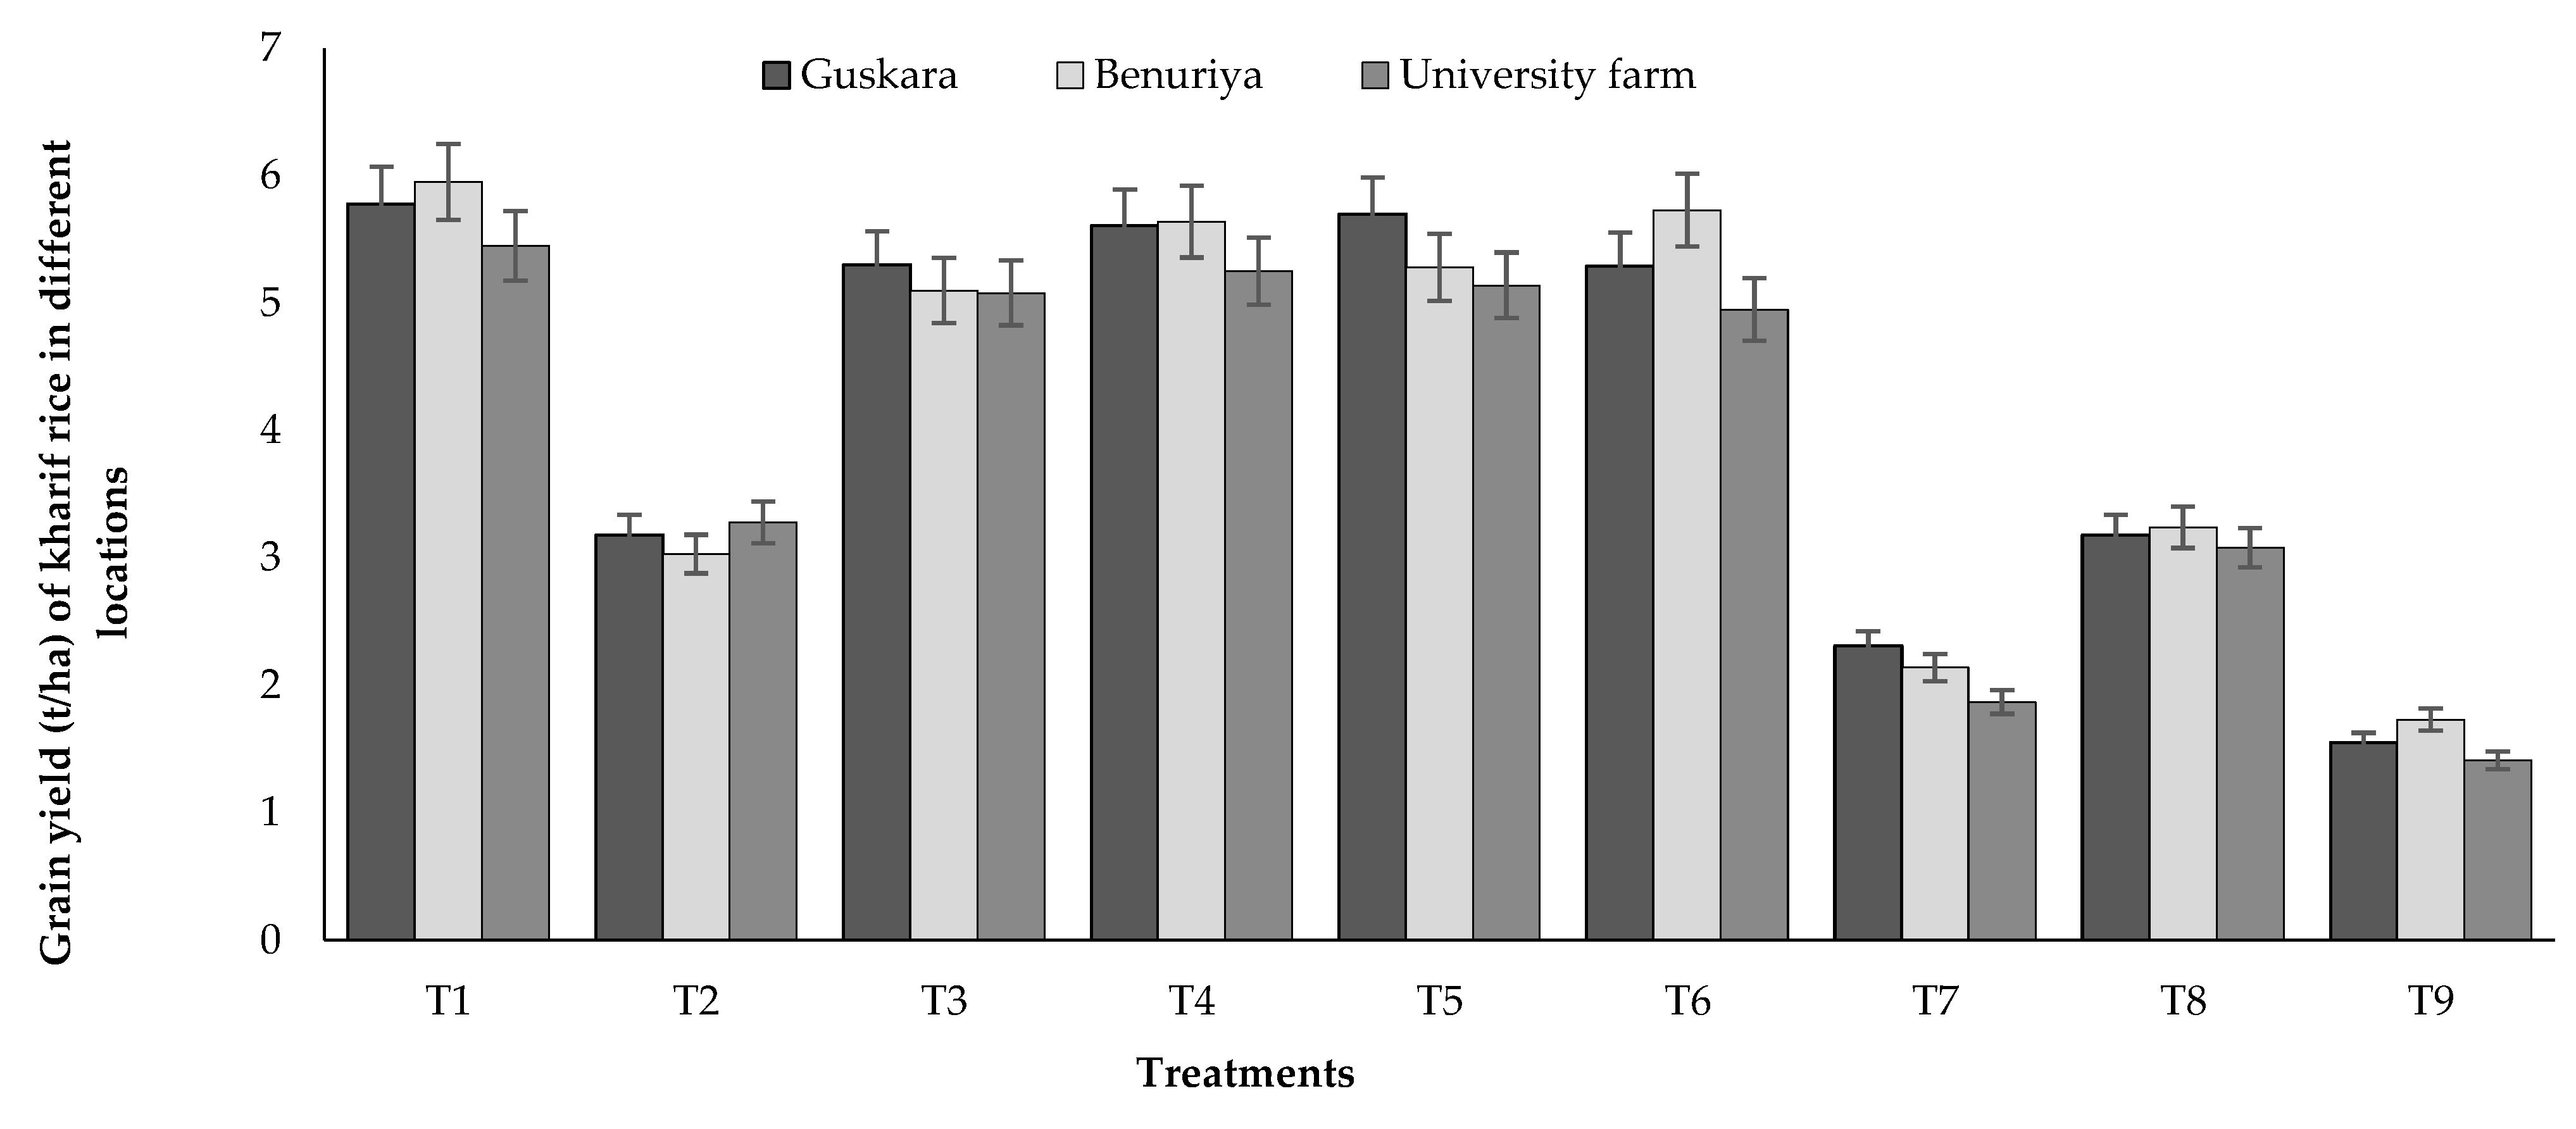
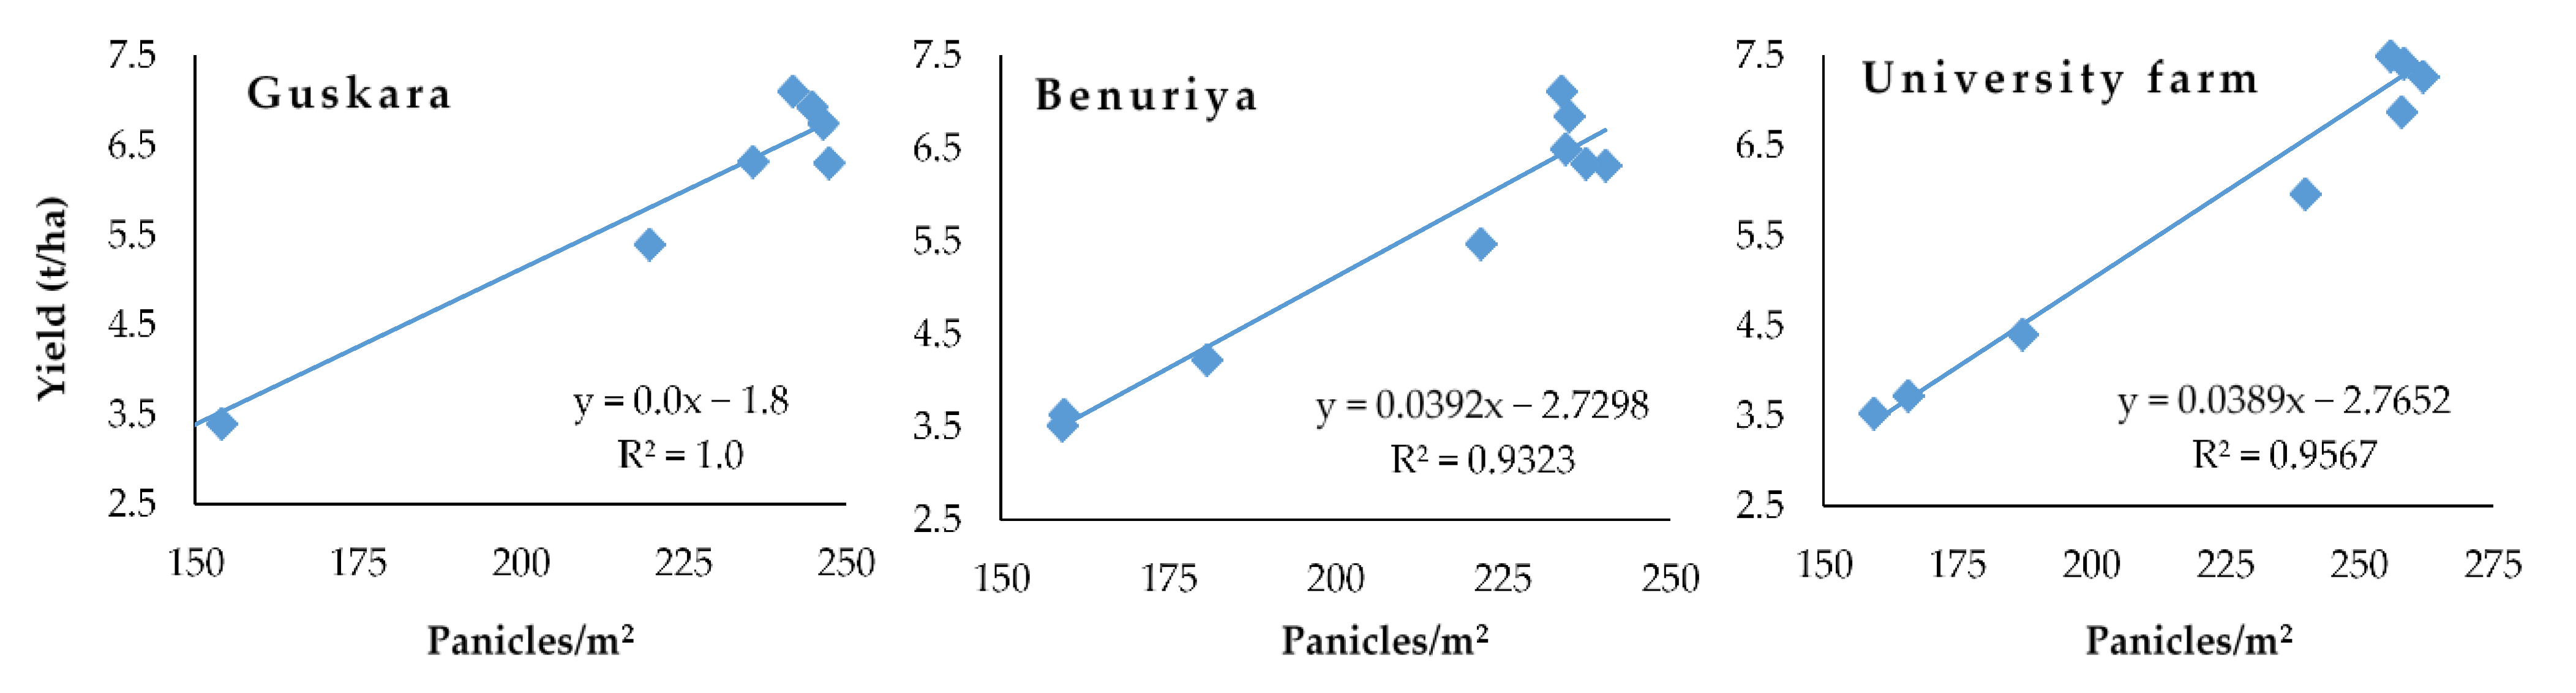
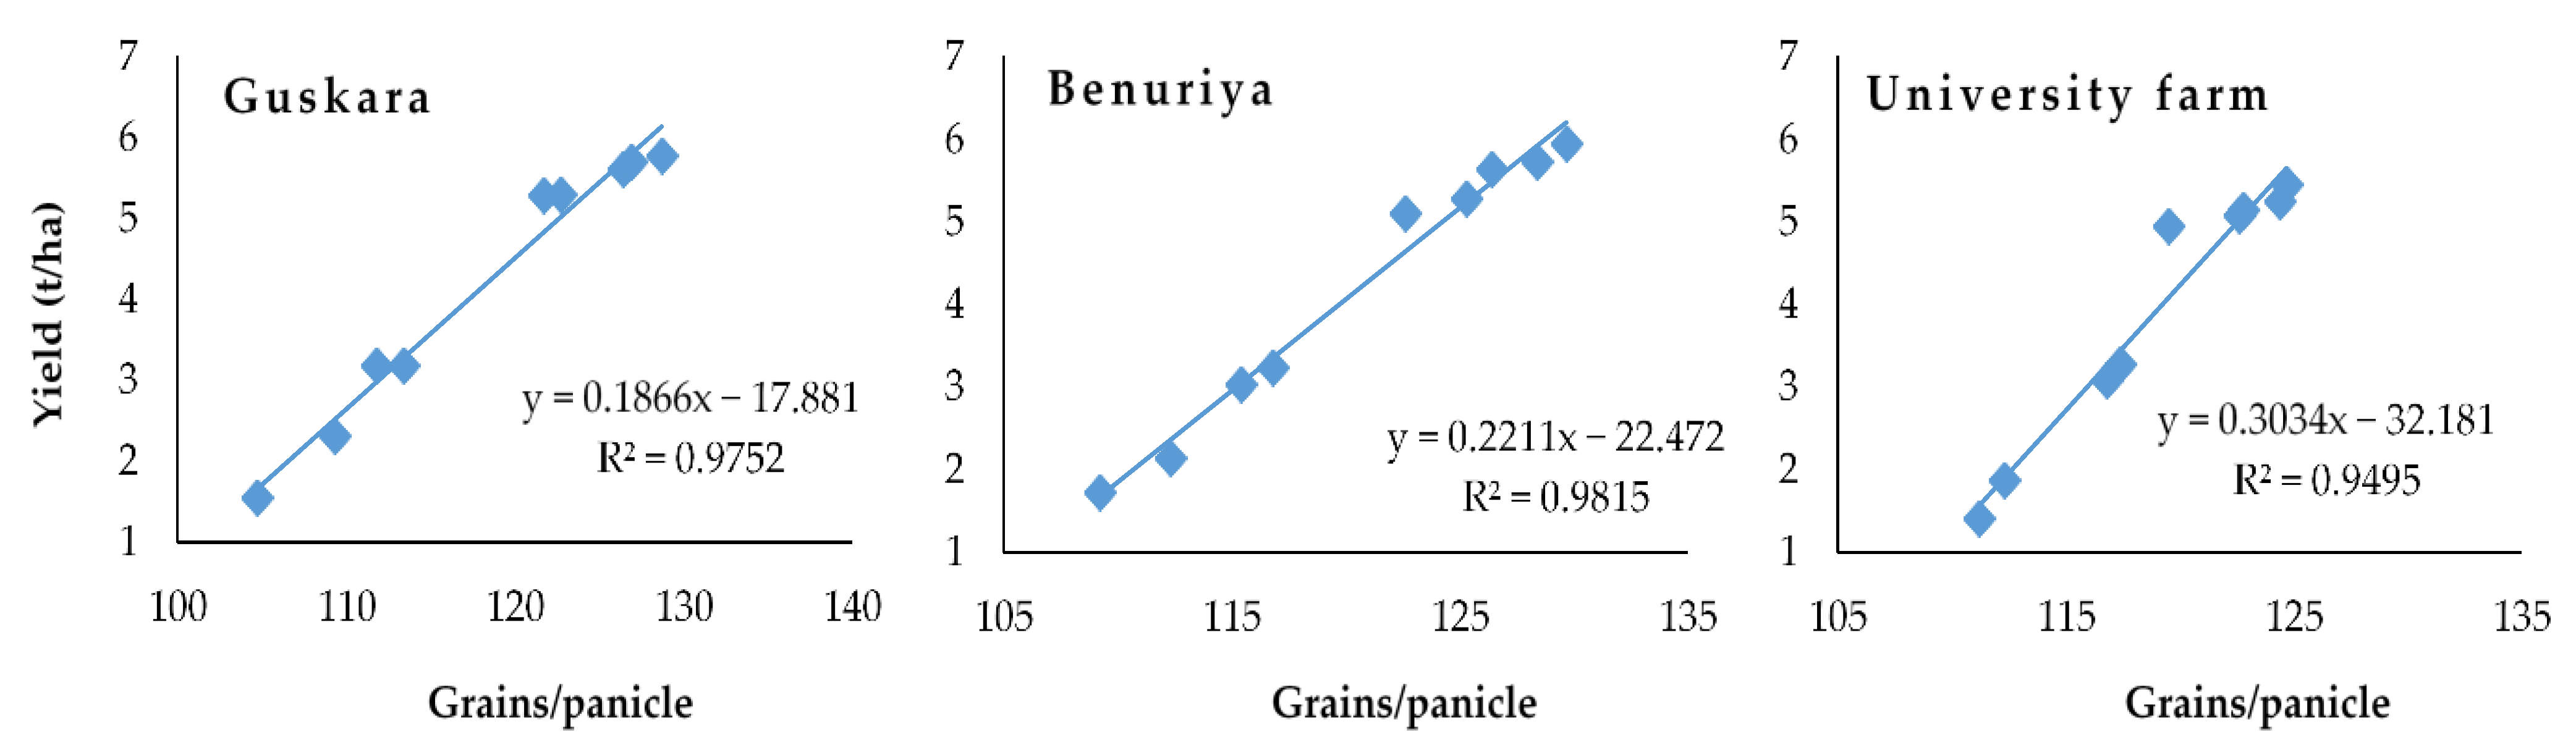
The multi-location yield trial on site specific nutrient management (SSNM) clearly indicated that the application of an ample dose of nutrients (100% recommended dose), namely, N, P, K, S, and Zn, is essential to obtain target yield of rice cultivars and higher productivity of rice based cropping systems in the red and lateritic belt of West Bengal. The growth parameters, yield attributes (panicle m−2 and grains panicle−1), and grain yield of kharif and boro rice were enhanced with balance application ample dose of nutrients, and the residual effects of the treatments were also pronounced in terms of productivity of summer black gram. Further, the agronomic efficiency (AE), physiological efficiency (PE), and nutrient response (NR) were maximum with the application of an ample dose of nutrients. The study concludes in favor of the requirement of SSNM for optimization of nutrients in the rice–rice–pulse cropping system for a target yield of rice and need-based S and Zn application for higher productivity.

Author Contributions

Conceptualization, T.S., M.B., and G.C.M.; methodology, T.S., S.D., and M.B.; software, T.S., D.M., and S.M.; validation, T.S., M.B., and G.C.M.; formal analysis, T.S., A.H., and S.M.; investigation, T.S. and M.B.; resources, M.B., A.E.S., and A.H.; data curation, S.M., A.E.S., and A.H.; writing—original draft preparation, T.S., M.B., G.C.M., D.M., S.D., and S.M.; writing—review and editing, H.A., A.B., I.A.I., A.H., and A.E.S.; visualization, T.S., M.B., and G.C.M.; supervision, M.B.; project administration, M.B., G.C.M., S.M., A.H., and A.E.S.; funding acquisition, I.A.I. All authors have read and agreed to the published version of the manuscript.

Funding

The current work was funded by the Taif University Researchers Supporting Project number (TURSP-2020/120), Taif University, Taif, Saudi Arabia.

Institutional Review Board Statement

Not applicable.

Informed Consent Statement

Not applicable.

Data Availability Statement

Most of the data are available in all Tables and Figures of the manuscripts.

Acknowledgments

The authors sincerely acknowledge the contributions of Bangladesh Wheat and Maize Research Institute (BWMRI), Nashipur, Dinajpur 5200, Bangladesh: (MAA) for providing the necessary laboratory facility during the investigation. In addition, the authors are highly grateful to Taif University Researchers Supporting Project number (TURSP—2020/120), Taif University, Taif, Saudi Arabia.

Conflicts of Interest

Authors would hereby like to declare that there is no conflict of interests that could possibly arise.

References

  1. Moya, P.F.; Dawe, D.; Pabale, D.; Tiongco, M.; Chien, N.V.; Devarajan, S.; Djatiharti, A.; Lai, N.X.; Niyomvit, L.; Ping, H.X.; et al. The economics of intensively irrigated rice in Asia. In Increasing Productivity of Intensive Rice syStems through Site-Specific Nutrient Management; Dobermann, A., Witt, C., Dawe, D., Eds.; Science Publishers and International Rice Research Institute (IRRI): Enfield, UK; Los Baños, Philippines, 2004; pp. 29–58. [Google Scholar]
  2. Buresh, R.J.; Reddy, K.R.; Van-Kessel, C. Nitrogen transformations in submerged soils. In Nitrogen in Agricultural Systems; Agronomy Monograph 49; Schepers, J.S., Raun, W.R., Eds.; ASA, CSSA, and SSSA: Madison, WI, USA, 2008; pp. 401–436. [Google Scholar]
  3. FAOSTAT. Production Quantities of Rice, Paddy by Country. Available online: http://www.fao.org/faostat/en/#data/QC/visualize (accessed on 28 January 2021).
  4. GOI. Agricultural Statistics at a Glance 2018; Government of India Ministry of Agriculture & Farmers Welfare Department of Agriculture, Cooperation & Farmers Welfare Directorate of Economics and Statistics, Government of India: New Delhi, India, 2018; pp. 87–89.
  5. Nagarajan, R.; Ramanathan, S.; Muthukrishnan, P.; Stalin, P.; Ravi, V.; Babu, M.; Selvam, S.; Sivanantham, M.; Dobermann, A.; Witt, C. Site-specific nutrient management in irrigated rice systems of Tamil Nadu, India. In Increasing Productivity of Intensive Rice Systems through Site-Specific Nutrient Management; Dobermann, A., Witt, C., Dawe, D., Eds.; Science Publishers and International Rice Research Institute (IRRI): Enfield, UK; Los Baños, Philippines, 2004; pp. 101–123. [Google Scholar]
  6. Peng, S.; Buresh, R.J.; Huang, J.; Zhong, X.; Zou, Y.; Yang, J.; Wang, G.; Liu, Y.; Hu, R.; Tang, Q.; et al. Improving nitrogen fertilization in rice by site-specific N management. A review. Agron. Sustain. Dev. 2010, 30, 649–656. [Google Scholar] [CrossRef]
  7. Mauriya, A.K.; Mauriya, V.K.; Tripathy, H.P.; Verma, R.K.; Shyam, R. Effect of site-specific nutrient management on productivity and economics of rice (Oryza sativa)-Wheat (Triticum aestivum) system. Indian J. Agron. 2013, 58, 282–287. [Google Scholar]
  8. Yadav, M.P.; Tiwari, U.S.; Raj, J. Studies on site specific nutrient management (SSNM) for maximization of yield and economics in hybrid rice (Oryza sativa). Plant Arch. 2007, 7, 795–798. [Google Scholar]
  9. Richards, M.B.; Butterbach-Bahl, K.; Jat, M.L.; Lipinski, B.; Ortiz-Monasterio, I.; Sapkota, T. Site-Specific Nutrient Management: Implementation guidance for policymakers and investors, Global Allience for Climate Smart Agriculture, 2015, p. 10. Available online: https://core.ac.uk/download/pdf/132679166.pdf (accessed on 18 January 2021).
  10. Rodriguez, D.G.P. An Assessment of the Site-Specific Nutrient Management (SSNM) Strategy for Irrigated Rice in Asia. Agriculture 2020, 10, 559. [Google Scholar] [CrossRef]
  11. Rurinda, J.; Zingore, S.; Jibrin, J.M.; Balemi, T.; Masuki, K.; Andersson, J.A.; Pampolino, M.F.; Mohammed, I.; Mutegi, J.; Kamara, A.Y.; et al. Science-based decision support for formulating crop fertilizer recommendations in sub-Saharan Africa. Agric. Syst. 2020, 180, 102790. [Google Scholar] [CrossRef] [PubMed]
  12. Shankar, T.; Malik, G.C.; Banerjee, M.; Ghosh, A. Nutrient optimization on growth and productivity of rice in the red and lateritic belt of West Bengal. J. Crop Weed 2014, 2, 500–503. [Google Scholar]
  13. Dobermann, A.; Witt, C.; Dawe, D.; Abdulrachman, S.; Gines, H.C.; Nagarajan, R.; Satawathananont, S.; Son, T.T.; Tan, P.S.; Wang, G.H.; et al. Site-specific nutrient management for intensive rice cropping systems in Asia. Field Crop. Res. 2002, 74, 37–66. [Google Scholar] [CrossRef]
  14. Buresh, R.L.; Castillo, R.L.; Torre, J.C.D.; Laureles, E.V.; Samson, M.I.; Sinohin, P.J.; Guerra, M. Site-specific nutrient management for rice in the Philippines: Calculation of field-specific fertilizer requirements by Rice Crop Manager. Field Crop. Res. 2019, 239, 56–70. [Google Scholar] [CrossRef]
  15. Witt, C.; Dobermann, A. Towards a decision support system for site-specific nutrient management. In Increasing Productivity of Intensive Rice Systems through Site-Specific Nutrient Management; Dobermann, A., Witt, C., Dawe, D., Eds.; Science Publishers and International Rice Research Institute (IRRI): Enfield, UK; Los Baños, Philippines, 2004; pp. 358–395. [Google Scholar]
  16. Witt, C.; Buresh, R.J.; Peng, S.; Balasubramanian, V.; Dobermann, A. Nutrient management. In Rice: A Practical Guide to Nutrient Management; Fairhurst, T., Witt, C., Buresh, R., Dobermann, A., Eds.; International Rice Research Institute (IRRI): Los Baños, Philippines; Philippines and International Plant Nutrition Institute (IPNI) and International Potash Institute (IPI): Singapore, 2007; pp. 1–45. [Google Scholar]
  17. Jackson, M.L. Soil Chemical Analysis; Prentice Hall of India Pvt. Ltd.: New Delhi, India, 1973; pp. 183–193. [Google Scholar]
  18. Subbiah, B.V.; Asija, G.L. A rapid procedure for the determination of available nitrogen in soils. Curr. Sci. 1956, 25, 259–260. [Google Scholar]
  19. Bray, R.H.; Kurtz, L.T. Determinations of total, organic and available forms of phosphorus in soils. Soil Sci. 1945, 59, 39–45. [Google Scholar] [CrossRef]
  20. Hanway, J.J.; Heidel, H. Soil analyses methods as used in Iowa State College Soil Testing Laboratory. Iowa Agric. 1952, 57, 1–31. [Google Scholar]
  21. Lindsay, W.L.; Norvell, W.A. Development of DTPA soil test for Zn, Fe, Mn and Cu. Soil Sci. Soc. Am. J. 1978, 42, 421–428. [Google Scholar] [CrossRef]
  22. Chesnin, L.; Yien, C.H. Turbid metric Determination of Available Sulphates. Soil Sci. Soc. Am. J. 1950, 15, 149–151. [Google Scholar] [CrossRef]
  23. Šesták, Z.; Čatský, J.; Jarvis, P.G. (Eds.) Plant Photosynthetic Production. Manual of Methods; The Hague, Dr W. Junk: The Hague, The Netherlands, 1971; p. 818. [Google Scholar]
  24. Watson, D.J. The physiological basis of variation in yield. Adv. Agron. 1952, 4, 101–145. [Google Scholar]
  25. Ray, K.; Banerjee, H.; Bhattacharyya, K.; Dutta, S.; Phonglosa, A.; Pari, A.; Sarkar, S. Site-specific nutrient management for maize hybrids in an inceptisol of West Bengal, India. Exp. Agric. 2017, 54, 874–887. [Google Scholar] [CrossRef]
  26. Cochran, W.G.; Cox, G.M. Experimental Design; Asia Publishing House: Calcutta, India, 1977; pp. 142–181. [Google Scholar]
  27. Buresh, R.J.; Pampolino, M.F.; Witt, C. Field-specific potassium and phosphorus balances and fertilizer requirements for irrigated rice-based cropping systems. Plant Soil 2010, 335, 35–64. [Google Scholar] [CrossRef]
  28. Shankar, T.; Malik, G.C.; Banerjee, M. Effect of nutrient management on yield attributes and yields in rice based cropping system. Int. J. Bio-Resour. Environ. Agric. Sci. 2018, 4, 704–708. [Google Scholar]
  29. Shankar, T.; Banerjee, M.; Malik, G.C.; Dutt, S. Effect of nutrient management on growth, productivity and economics in rice based cropping system in lateritic soil of West Bengal. Int. J. Chem. Stud. 2020, 8, 2694–2698. [Google Scholar] [CrossRef]
  30. Gill, M.S. sustaining high yield of rice-wheat system through site specific nutrient management in Punjab. Indian J. Fertil. 2006, 2, 45–50. [Google Scholar]
  31. Buresh, R.J.; Castillo, R.; Vanden-Berg, M.; Gabinete, G. Nutrient Management Decision Tool for Small-Scale Rice and Maize Farmers; Technical Bulletin 190; Food and Fertilizer Technology Center: Taipei, Taiwan, 2014; p. 37. [Google Scholar]
  32. Singh, H.; Bansal, S.K. A review of crop productivity and soil fertility as related to nutrient management in the Indo-Gangatic plane of India. Better Crop. South Asia 2010, 93, 27–29. [Google Scholar]
  33. Xu, X.; He, P.; Pampolino, M.F.; Johnston, A.M.; Qiu, S.; Zhao, S.; Chuan, L.; Zhou, W. Fertilizer recommendation for maize in China based on yield response and agronomic efficiency. Field Crop. Res. 2014, 157, 27–34. [Google Scholar] [CrossRef]
  34. Banerjee, M.; Malik, G.C.; Datta, S.; Shankar, T.; Maiti, D. Nutrient optimization and yield intensification of major cereal system of eastern India. Better Crop. 2008, 92, 26–28. Available online: http://www.ipni.net/publication/bca.nsf/0/2D08A55515160271852579A4007A9E65/$FILE/SSNM%20RW%20Khurana%2008095%20BC%20India.pdf (accessed on 14 March 2021).
Figure 1. Meteorological data of the Institute of Agriculture, Sriniketan, during crop season (July 2013 to June 2015).
Sustainability 13 03222 g001
Figure 2. Grain yield (t/ha) of kharif rice at different locations (Pooled of both years). Treatment details are available in Table 4. Standard error mean (SEm±) bar was calculated from three replicates for each treatment.
Sustainability 13 03222 g002
Figure 3. Grain yield (t/ha) of Boro rice at different locations (Two years Pooled data). Treatment details are in Table 4. Standard error mean (SEm±) bar was calculated from three replicates for each treatment.
Sustainability 13 03222 g003
Figure 4. Seed yield of black gram (kg/ha) in different locations (pooled of both years). Treatment details are in Table 4. Standard error mean (SEm±) bar was calculated from three replicates for each treatment.
Sustainability 13 03222 g004
Figure 5. Linear regression between yield (t ha−1) and panicles/m2 of kharif rice in different locations.
Sustainability 13 03222 g005
Figure 6. Linear regression between yield (t ha−1) and panicles/m2 of boro rice in different locations.
Sustainability 13 03222 g006
Figure 7. Linear regression between yield (t ha−1) and grains panicle−1 of kharif rice in different locations.
Sustainability 13 03222 g007
Figure 8. Linear regression between yield (t ha−1) and grains panicle−1 of boro rice in different locations.
Sustainability 13 03222 g008
Table 3. Cropping system and crop variety/hybrid chosen.
YearKharif (Rice)Boro (Rice)Pre-Kharif (Pulse)
2013–2014HYV Rice: MTU 7029Hybrid Rice: Arize TejBlack gram (Sarada)
2014–2015Local check: KabirajsalLocal check HYV: IR 64
Table 4. Effect of nutrient management on growth attributes of in rice–rice cropping system in multiple locations (pooled data of two years).
TreatmentCrop Biomass (g/m2) at Harvest
Kharif SeasonMeanBoro SeasonMean
GuskaraBenuriyaUniversity FarmGuskaraBenuriyaUniversity Farm
T111781160136812351184116311671171
T2996977111910311010966988988
T311711160128412051140115911421147
T411331135123411671153114111501148
T5:11371149134412101140114611221136
T611241133135612041119112811491132
T79831015118510619921004984993
T810891156139012121154116011651160
T98509381089959853936882890
SEm±52.957.757.762.019.116.720.016.3
CD (p = 0.05)130.6142.4142.5180.055.048.160.148.0
T1: ample dose of N, P, K, S, and Zn; T2: P, K, S, and Zn, T3: N, K, S, and Zn; T4: N, P, S, and Zn; T5: N, P, K, and Zn; T6: N, P, K, and S, T7: local variety under the unfertilized check; T8: local variety under ample fertilizer; T9: control (without any fertilizer).
Table 5. Effect of nutrient management on growth attributes of in the rice–rice cropping system in multiple locations (pooled of two years).
TreatmentTiller/m2 at Harvest
KharifMeanBoroMean
GuskaraBenuriyaUniversity FarmGuskaraBenuriyaUniversity Farm
T1271.6280.4261.2271.1303.8289.5307.6300.3
T2194.2187.1181.9187.7210.4221.9234.2222.2
T3256.9246.5248.3250.6298.1291.2289.5292.9
T4269.3252.7258.9260.3276.5293.3306.1292.0
T5:259.2247.1254.4253.6293.4285.9304.6294.6
T6248.7276.5242.4255.9282.9286.9312.8294.2
T7169.3174.7135.2159.7187.2202.4204.7198.1
T8194.8210.1180.1195.0277264.7287.8276.5
T9138.3139.5121.3133.0175.7202.1218.3198.7
SEm±11.589.328.5810.8510.407.098.808.80
CD (p = 0.05)28.5923.0321.1926.8025.6917.5121.7221.72
Treatment details are available in Table 4.
Table 6. Effect of nutrient management on leaf area index (LAI) of rice at 60 days after transplanting (DAT) in multiple locations (pooled of two years).
TreatmentLAI at 60 DAT
KharifMeanBoroMean
GuskaraBenuriyaUniversity FarmGuskaraBenuriyaUniversity Farm
T15.85.95.85.85.95.85.95.8
T25.15.35.15.15.25.15.15.1
T35.85.95.75.85.85.65.55.7
T45.65.85.75.75.85.75.65.7
T5:5.65.75.75.75.75.75.85.7
T65.65.75.75.75.75.75.85.7
T74.44.64.54.55.15.05.15.0
T85.85.95.95.85.95.85.95.9
T95.05.15.15.04.34.44.54.4
SEm±0.070.050.060.060.100.120.100.12
CD (p = 0.05)0.210.150.190.180.300.360.400.35
Treatment details are available in Table 4.
Table 7. Effect of nutrient management on grains per panicle of rice in multiple locations (pooled of two years).
TreatmentGrains per Panicle
KharifMeanBoroMean
GuskaraBenuriyaUniversity FarmGuskaraBenuriyaUniversity Farm
T1128.7129.7124.7127.7136.6139.3140.1138.67
T2113.4115.4117.4115.4116.9119120.7118.87
T3122.7122.6122.6122.6128.2127.7129.7128.53
T4126.4126.4124.4125.7129.8132.8133.5132.03
T5:126.9125.3122.8125.0132.1136.1137.9135.37
T6121.7128.4119.5123.2131.6129.3136.3132.40
T7109.3112.3112.3111.3112.8117.8116.1115.57
T8111.8116.8116.8115.1122.7121.7125.1123.17
T9104.7109.2111.2108.4110.7114.9117.3114.30
SEm±6.7010.818.076.697.237.479.226.89
CD (p = 0.05)2.724.383.272.712.933.033.732.79
Treatment details are available in Table 4.
Table 8. Effect of nutrient management on panicles/m2 of rice (pooled data of two years).
TreatmentPanicles/m2
KharifMeanBoroMean
GuskaraBenuriyaUniversity FarmGuskaraBenuriyaUniversity Farm
T1215.6218.4212.2215.4241.8233.7255.1243.53
T2142.2135.1138.6138.6154180.7187.1173.93
T3200.9205.5199201.8247.3240.3257.9248.50
T4207.3215.7204.3209.1235.6234.3261.9243.93
T5213.2204.1203.1206.8244.7234.9255.9245.17
T6212.7215198.4208.7246.4237.4258.3247.37
T7105.3108.787.7100.6128.9159.4159.4149.23
T8143.8150.8132.7142.4219.7221.7239.9227.10
T979.388.571.579.8135159.1165.7153.27
SEm±8.479.338.099.559.238.158.149.18
CD (p = 0.05)20.9123.0419.9823.5722.7820.1120.1022.66
Treatment details are available in Table 4.
Table 9. Effect of nutrient management on test weight (g) of rice (pooled data of two years).
TreatmentTest Weight (g)
KharifMeanBoroMean
GuskaraBenuriyaUniversity FarmGuskaraBenuriyaUniversity Farm
T121.521.821.121.521.721.921.521.7
T220.420.120.220.218.919.719.619.4
T321.320.320.520.720.120.620.420.4
T420.921.521.421.320.720.920.820.8
T5:21.220.720.520.821.621.421.321.4
T619.821.520.620.620.920.721.120.9
T720.319.519.119.619.419.419.119.3
T819.619.819.819.720.320.119.920.1
T919.219.418.619.118.919.319.219.1
SEm±0.600.690.760.560.670.670.620.69
CD (p = 0.05)NSNSNSNSNSNSNSNS
Treatment details are available in Table 4.
Table 10. Effect of nutrient management on grain yield (t/ha) of rice and seed yield of black gram (kg/ha) (pooled of two years).
TreatmentGrain Yield of Rice (t/ha)Seed Yield of Black Gram (kg/ha)
KharifMeanBoroMeanPre-kharifMean
GuskaraBenuriyaUniversity FarmGuskaraBenuriyaUniversity FarmGuskaraBenuriyaUniversity Farm
T15.785.955.455.727.117.127.757.32839884898874
T23.183.033.283.163.404.234.414.01639627622629
T35.305.105.085.166.316.326.886.50834805788809
T45.615.645.255.506.326.507.276.69833861852848
T5:5.705.285.145.376.936.857.507.09833866848849
T65.295.734.955.326.756.347.426.83848897865859
T72.312.141.872.102.873.643.533.34475530452485
T83.183.243.083.165.405.485.975.62829869860853
T91.551.731.411.562.813.523.733.35475527452485
SEm±0.170.150.160.170.180.180.200.1917.226.729.128.0
CD (p = 0.05)0.420.360.390.430.450.440.500.4742.666.171.969.2
Treatment details are available in Table 4.
Table 11. Effect of nutrient management on agronomic efficiency (AE) of rice–rice cropping system (pooled data of two years).
TreatmentAgronomic Efficiency (AE)
KharifMeanBoroMean
GuskaraBenuriyaUniversity FarmGuskaraBenuriyaUniversity Farm
T114.417.319.517.116.718.614.516.6
T20.00.00.00.00.00.00.00.0
T312.014.113.813.312.314.610.512.5
T413.116.217.415.614.314.611.413.4
T5:12.416.815.014.715.417.713.115.4
T611.114.018.014.415.116.810.614.1
T70.00.00.00.00.00.00.00.0
T88.010.97.38.712.213.09.211.5
T90.00.00.00.00.00.00.00.0
Treatment details are available in Table 4.
Table 12. Effect of nutrient management on physiological efficiency (PE) of rice–rice cropping system (pooled data of two years).
TreatmentsPhysiological Efficiency (PE)
Kharif SeasonMeanBoro SeasonMean
GuskaraBenuriyaUniversity FarmGuskaraBenuriyaUniversity Farm
T138.843.857.846.870.074.362.068.7
T20.00.00.00.00.00.00.00.0
T341.648.147.745.855.164.850.656.8
T435.846.652.545.067.864.958.863.8
T5:36.243.451.643.769.470.657.265.7
T634.643.455.844.666.070.751.662.8
T70.00.00.00.00.00.00.00.0
T831.925.232.229.878.980.668.475.9
T90.00.00.00.00.00.00.00.0
Treatment details are available in Table 4.
Table 13. Effect of nutrient management on the nutrient response (kg/ha) of high yield varieties (HYV) rice-hybrid rice-pulse cropping system. (Pooled data of two years).
Nutrients
Management
Kharif SeasonMeanBoro SeasonMeanSummer Black GramMean
GuskaraBenuriyaUniversity FarmGuskaraBenuriyaUniversity FarmGuskaraBenuriyaUniversity Farm
N, P, K, S and Zn40354225421541584015430035953970372326324340
–N1870163012951598680585705657122115103113
–P36653745336535923145350028003148267318246277
–K38354060391039353535351029753340331310305315
–S37254145354538053765411533303737327316304316
–Zn35403735399537573690393528153480344330300325
Fertilized local120587511001060--------
IR 36----2440253518452273----
Sarada--------344310311321
Publisher’s Note: MDPI stays neutral with regard to jurisdictional claims in published maps and institutional affiliations.

