
Niche Preference of Escherichia coli in a Peri-Urban Pond Ecosystem
by
 , and
, and
Gitanjali NandaKafle
1, 
Taylor Huegen
1,
Sarah C. Potgieter
2,
Emma Steenkamp
2,
Stephanus N. Venter
2 and
Volker S. Brözel
1,2,* 1
Department of Biology and Microbiology, South Dakota State University, Brookings, SD 57007, USA
2
Department of Biochemistry, Genetics and Microbiology, University of Pretoria, Pretoria 0004, South Africa
*
Author to whom correspondence should be addressed.
Life 2021, 11(10), 1020; https://doi.org/10.3390/life11101020
Submission received: 19 August 2021
/
Revised: 17 September 2021
/
Accepted: 25 September 2021
/
Published: 28 September 2021
(This article belongs to the Section Diversity and Ecology)
Abstract
:Escherichia coli comprises diverse strains with a large accessory genome, indicating functional diversity and the ability to adapt to a range of niches. Specific strains would display greatest fitness in niches matching their combination of phenotypic traits. Given this hypothesis, we sought to determine whether E. coli in a peri-urban pond and associated cattle pasture display niche preference. Samples were collected from water, sediment, aquatic plants, water snails associated with the pond, as well as bovine feces from cattle in an adjacent pasture. Isolates (120) were obtained after plating on Membrane Lactose Glucuronide Agar (MLGA). We used the uidA and mutS sequences for all isolates to determine phylogeny by maximum likelihood, and population structure through gene flow analysis. PCR was used to allocate isolates to phylogroups and to determine the presence of pathogenicity/virulence genes (stxI, stxII, eaeA, hlyA, ST, and LT). Antimicrobial resistance was determined using a disk diffusion assay for Tetracycline, Gentamicin, Ciprofloxacin, Meropenem, Ceftriaxone, and Azithromycin. Our results showed that isolates from water, sediment, and water plants were similar by phylogroup distribution, virulence gene distribution, and antibiotic resistance while both snail and feces populations were significantly different. Few of the feces isolates were significantly similar to aquatic ones, and most of the snail isolates were also different. Population structure analysis indicated three genetic backgrounds associated with bovine, snail, and aquatic environments. Collectively these data support niche preference of E. coli isolates occurring in this ecosystem.
1. Introduction
Escherichia coli is a commensal in the gastrointestinal tracts of humans and vertebrate animals, but readily isolated from aquatic and terrestrial habitats. Some data suggest semi-permanent residence in extra-host habitats [1,2]. The species displays a broad range of genotypes and associated phenotypes [3,4] and has previously been classified into four phylogroups (A, B1, B2, and D) [5], and later eight phylogroups based on their genomic information [6]. Of these, seven (A, B1, B2, C, D, E, and F) belong to E. coli sensu stricto whereas the eighth is represented by cryptic Clade-I. Variation in genotype and phenotype among strains of different phylogroups is believed to support fitness in different ecological habitats, leading to niche preference. Phylogroups A and B1 occur more frequently in the environment [7]. Some strains of phylogroup B1 were reported to persist in water [7,8] and soil [9], with some believed to be naturalized members of their specific communities [1]. B2 and D strains are frequently isolated from extra-intestinal sites within host bodies [3]. Many studies have reported that phylogroup B2 and, to a lesser extent, D strains are more likely to carry virulence factors than other phylogroups [10,11,12]. Interestingly, virulence genes are more frequently present in phylogroup B1 isolates from environments where phylogroup B2 strains are absent [13]. Thus, identification of the phylogroup of unknown isolates may provide information on their physiological characteristics and ecological preferences.
E. coli is a highly diverse species as revealed by DNA fingerprinting of populations obtained from different sources [14,15,16,17]. The species includes a wide variety of pathotypes of the gastrointestinal and urogenital tracts, reviewed recently by Braz and Melchior [18]. most notably Enterotoxigenic (ETEC) and Enterohemorrhagic E. coli. (EHEC). Many of these have been detected in aquatic environments, including the Enterohemorrhagic (EHEC) and Enterotoxigenic E. coli (ETEC). Genomic analyses also showed that E. coli has a large open pan-genome [19,20] with an estimated core genome of less than 1500 genes but an accessory genome containing a reservoir of more than 22,000 genes [21]. Of the latter many may be uncharacterized yet important virulence factors [19]. The pan-genome of 61 E. coli comprised 15,741 gene families and only 993 (65) of these families were represented in every genome, comprising the core genome [22]. Similarly, genome data for 228 E. coli isolates revealed a pangenome of 11,401 genes of which 2722 (23.9%) were core [23]. The large genomic and resulting phenotypic diversity explains the versatile behavior of this species. It exhibits a biphasic lifestyle with primary habitat in the mammalian gastrointestinal tract, but water, sediments, and soils are reported as non-host or secondary habitat [7,24,25,26,27]. Extensive genetic diversity was also reported for the E. coli populations within different environmental habitats [28,29,30]. Several studies further reported that E. coli survive and grow in water, sediments, soil, and on water-plants in various climatic regions where no evidence for fecal contamination exists [24,31,32,33]. Certain strains of E. coli present in the environment also appear to have become naturalized, and to have distinct genotypes when compared to strains associated with animal hosts [9,24]. Previous studies have suggested that there is a relationship between genotypes of E. coli found among specific animal hosts and the geographic location from which they were isolated [24,33,34]. The genetic differences between populations are a consequence of continued evolutionary success due to their survival and adaptation in different environments [35]. This suggests that E. coli strains would perform best in niches that match their specific combination of phenotypic traits.
We hypothesized that E. coli display niche preference when presented with multiple environments, and that some strains would display fitness in aquatic environments over the mammalian gut. A secluded peri-urban pond adjacent to a cattle pasture was selected as sampling site. We isolated E. coli from the water, sediment, submerged water plants, and water snails, as well as from bovine feces in the adjacent pasture. To obtain evidence of niche partitioning, isolates were characterized genotypically by phylogrouping, analysis of their uidA and mutS sequences, and virulence gene distribution, and phenotypically for antibiotic resistance.
2. Materials and Methods
2.1. Sample Source
Samples were collected from a secluded pond (GPS co-ordinate 44.2719° N, 96.7736° W) at the edge of Brookings, SD, USA during June and July 2013. This pond is located between the edge of town, a nature park, and a pasture with farmed cattle, and surrounded by dense scrub and trees, rarely visited by humans. Water (31), sediment (27), water plant (35), and snail samples (20) were collected from the pond, and bovine feces (7) was collected from the adjoining cattle pasture. Samples were placed into sterile 50 mL conical screw cap tubes, brought to the laboratory on ice, and processed on the same day.
2.2. Isolation of E. coli
Water samples (10 mL and 1 mL) were filtered through a sterile 0.45 μm mixed cellulose ester filter (MilliporeSigma, St. Louis, MO, USA) and the filters placed on Membrane Lactose Glucuronide agar (MLGA, MilliporeSigma, St. Louis, MO, USA). Sediment samples were mixed with 15 mL of sterile dH2O, shaken for 30 s, and 1 and 10 mL aliquots filtered before placing filters onto MLGA. Water plants and snails were rinsed with sterile dH2O, then crushed in 10 mL sterile dH2O, and 100 μL plated directly on to MLGA plates. Feces samples were suspended in sterile water and serial tenfold dilutions plated onto MLGA. MLGA plates were incubated at 37 °C for 18 h. Green colonies indicated positive for β-Galactosidase (yellow) and β-Glucuronidase (blue) and were assumed to be E. coli. This protocol therefore excluded β-Glucuronidase negative O157:H7 strains. One colony was selected at random from the highest dilution showing growth, streaked onto MLGA to confirm purity, sub-cultured on LB agar, and stored at −80 °C in 50% glycerol.
2.3. Phylogroup Analysis
Genomic DNA was extracted from overnight LB agar cultures harvested and re-suspended in 5mL 10 mM phosphate buffer (pH 7.0) using the genomic DNA Quick Prep Kit (Zymo Research, Irvine, CA, USA), and stored at −20 °C. Isolates were assigned to phylogroups using the protocol of Clermont et al. [6]. To avoid ambiguity, PCR was performed separately for each primer set (Table S1). Phylogroup similarity among the five sample types was determined by UPGMA analysis using the constrained Jaccard coefficient in PAST version 3.14 (https://www.nhm.uio.no/english/research/infrastructure/past/, last accessed on 17 September 2021) [36]. To determine whether the distribution of phylogroups differed by source we used multinomial log-linear regression models. The models were fitted using the nnet package in R (v.3.2.2) [37]. The response variable in this analysis was the phylogroup of each isolate (A, B1, B2, C, D, E, and Unknown), and the explanatory variables were the sample source and clusters associated with origin of the isolates. To visualize the effect of significant explanatory variables, we used regression trees fitted using Package Party [38] in R.
2.4. uidA and mutS Sequence Analysis
To genotype isolates, we amplified the uidA and mutS genes by PCR using primers described previously [39] (Table S1). uidA, which encodes the β-Glucuronidase enzyme is often used to differentiate E. coli sensu lato from other species in the genus and the primer set used was originally designed to target the most phylogenetic region of the gene [39]. mutS forms part of the mismatch repair system of bacteria, was shown to have a high diversity among E. coli isolates [40], and was an ideal target for this diversity study. PCR reactions (25 µL) were set up as follows: 2.5 µL reaction buffer (10×) (New England Biolab), 1.5 µL MgCl2 (25 mM), 0.5 µL dNTPs (40 mM), 0.1 µL forward primer and 0.1 µL reverse primer (100 µmol), 0.125 µL of Taq polymerase (NE Biolabs), 0.5 µL of DNA template, and 20.7 µL sterile nano pure water. The amplification cycle was initiated with 95 °C for 2 min, followed by 30 cycles of denaturing at 95 °C for 30 s, annealing at 56 °C for 30 s and extension at 72 °C for 1 min, with a final extension at 72 °C for 5 min. DNA sequences were determined by the dideoxy chain termination method (Beckman Coulter Genomic Center at Denver, MA, USA). The uidA and mutS sequences were submitted to Genbank (http://www.ncbi.nlm.nih.gov/genbank/, accessed on 17 September 2021) under BankIt2031081: MF459726—MF459846 and BankIt2031086: MF459847—MF459967 respectively.
To infer the relationships among isolates, DNA sequences were aligned using ClustalW [41], and overhangs were trimmed using SeAl [42]. The uidA and mutS sequences for all isolates and reference strains [43] were concatenated using SeAl. A maximum likelihood analysis using model GTR+G+I with 1000 bootstrap replicates was performed in the program MEGA 6.06 [41]. The tree was then annotated and visualized using the ITOL online tool [44].
2.5. Population Genetic Analysis
To infer population structure and assign isolates to distinct populations, we employed a model-based clustering method using STRUCTURE [45]. More specifically the admixture model was applied using sample locations as prior (LOCPRIOR). By assuming mixed ancestry, individuals within a population were thought to have inherited a fraction of their genome from an ancestor in the population [46]. Ln probability values and the variance of Ln likelihood scores were estimated for the concatenated uidA-mutS sequences, assuming the presence of 2 populations (K = 2, with an adjusted alpha = 0.5) and performing twenty iterations for each K from K = 1 to K = 6. For these analyses a burn-in of 10,000 and a run length of 500,000 were used [47]. All other parameters in STRUCTURE were left as default. The resulting data from STRUCTURE were collated and visualised using the web-based program Structure Harvester [46] to assess which likelihood values across the multiple estimates of K best explained the data (in this case K = 3 was the best) using the Evanno method [48,49]. Furthermore, optimal alignments for the number of replicate cluster analyses were generated using the FullSearch algorithm in CLUMPP [50] and the corresponding output files were used directly for cluster visualization as plots in Excel and the program Distruct 1.1 [51].
2.6. Virulence Gene Assays
PCR for detection of stx1, stx2, eaeA and hlyA genes was performed using primers as described by Fagan, et al. [52] (Table S2), and for STa and LTb virulence genes as described by Osek [53] (Table S2). DNA samples for PCR were prepared by the boiling method. Stock cultures were recovered on LBA, two colonies suspended in 500 µL dH2O, washed by centrifugation and suspended in sterile dH2O, lysed by incubating at 100 °C for 10 min, and immediately chilled on ice for 5 min. Debris was removed by centrifugation for 1 min at 12,000× g and the supernatant was transferred to a new sterile tube and stored at −20 °C for further use as PCR template. PCR reactions were carried out in 25 µL volume containing 1 µL of DNA template, 2.5 µL reaction buffer (10×) (New England Biolabs, Ipswich, MA, USA), 1.5 µL MgCl2 (25 mM), 0.5 µL dNTPs (40 mM), 0.1 µL forward primer and 0.1 µL reverse primer (100 µmol), 0.1 µL of Taq polymerase (New England Biolabs), and 19.2 µL sterile nano pure water. PCR amplification for stx1, stx2, eaeA, and hlyA was performed under the following conditions: initial 95 °C denaturation step for 3 min followed by 35 cycles of 20 s denaturation at 95 °C, 40 s primer annealing at 58 °C, and 90 s extension at 72 °C. The final cycle was followed by a 72 °C incubation for 5 min [52]. LTb and STa were amplified under the following conditions: an initial DNA denaturation step at 94 °C for 5 min followed by 30 cycles of 1 min of denaturation at 94 °C, 1 min of primer annealing at 55 °C, and 2 min of extension at 72 °C. The final extension step was performed at 72 °C for 5 min [53].
2.7. Antibiotic Resistance Assays
Antibiotic susceptibility of the 120 E. coli isolates was determined using a disk diffusion assay following the CLSI standard [54]. Stock cultures were recovered in 5 mL Mueller Hinton (MH, Oxoid) broth at 37 °C for 16 h. Cells were harvested by centrifugation (10,000× g, 2 min), re-suspended in sterile tap water and the cell density adjusted to 0.5 on the McFarland turbidity standard. Cell suspensions were spread onto MH agar (Oxoid), and antibiotic disks (Oxoid) Ciprofloxacin (CIP, 5 μg), Meropenem (MEM, 10 μg), Ceftriaxone (CRO, 30 μg), Gentamicin (CN, 10 μg), Azithromycin (AZM, 15 μg), Tetracycline (TE, 30 μg), with Penicillin (10 μg) as control were placed on the surface. After 18 h incubation at 37 °C, zone diameters were measured, and isolates scored as intermediately or fully resistant. E. coli ATCC 25922 was included in each assay as a negative control as it is sensitive to all these antibiotics.
3. Results
3.1. Bacterial Isolates
Strains of E. coli were obtained from water (31), sediment (27), water plants (35), and snails collected from the pond (20), and from fresh bovine feces (7) obtained from the adjacent pasture.
3.2. Phylogroup Distribution
Isolate collections obtained from the water and submerged water plants showed similar phylogroup distribution (Figure 1), predominated by phylogroups B1, E and some B2 isolates. Sediment was similar to water and water plants, but with the addition of phylogroup A strains. In contrast, snail isolates were mostly phylogroup B2, while those from bovine feces were phylogroup E. Multinomial log linear regression supported a significant difference (p < 0.001) between the isolate collections from water snails and those from water, sediment, and plants (Supplementary Materials, Figure S1), with the latter three collections not significantly different from one another. As our isolation method was based on MLGA (β-Glucuronidase and β-Galactosidase), phylogroup E strains lacking the uidA gene for β-Glucuronidase would have been excluded [55]. However, we obtained several green colonies from feces, all falling into phylogroup E but yielding the uidA gene by PCR.
3.3. Phylogenetic Analysis
The concatenated mutS and uidA sequence phylogeny formed many well-separated clusters with strong bootstrap support (Figure 2). None of our isolates grouped with any of the Clade I, III, IV, or V strains and all belonged to E. coli sensu stricto. Most of the water, water plant, and sediment isolates fell into mixed clusters, some with reference strains. This indicated co-occurrence of diverse strains across the three niches. The majority of water snail isolates grouped into three unique clusters that contained no water, sediment, or water plant isolates, and also no reference strains, indicating that they are unique and potentially have a preference for snails over surrounding water, sediment, or water- niches. Three of the snail isolates did cluster with water plant, sediment, water, and reference strains. All bovine fecal isolates formed a separate cluster from aquatic and from snail isolates. Furthermore, no bovine isolates clustered with phylogroup E reference strains (Figure 2), indicating hitherto poorly studied diversity within cattle.
3.4. Population Genetic Analysis
Population genetic analysis of concatenated uidA and mutS genes was performed assuming one aquatic and one fecal population (i.e., K = 2, alpha = 0.5). The result obtained from the Evanno table was K = 3, supporting the existence of three separate genetic backgrounds within the collection of isolates examined (Figure 3). The bovine fecal isolate collection was homogenous, containing mainly one genetic background. Isolates from snails were associated with two backgrounds that were mostly homogenous, one of which was identical to the fecal background. In contrast, water, sediment, and water plant isolates were associated with a mixture of three genetic backgrounds shared by the bovine fecal isolates, some shared by the second group of snail isolates, and a distinct third background (yellow in Figure 3) that was more common in the aquatic populations but not in snail isolates. Thus, the pond ecosystem comprised of an admixture of strains representing three genetic backgrounds, one likely due to introduction of bovine-derived strains (blue in Figure 3), a second associated with snail populations (red), and a third unique to the aquatic environment (yellow). This indicates gene flow among the water, sediment, and water plant populations, but with some genetic input from the fecal and snail populations. No genetic input from the water, water plant, sediment, and snail populations to the bovine fecal population was observed.
3.5. Virulence Gene Distribution
To determine their pathogenic potential, isolates were screened for the presence of major virulence genes associated with diarrhoeagenic E. coli. EHEC represent a pathotype producing at least one of the two Shiga toxins, Stx1 and Stx2, encoded by stx1 and stx2 [56]. In addition, EHEC produce numerous other putative virulence factors including Intimin, responsible for attachment of the bacteria to intestinal epithelial cells, causing attaching and effacing lesions in the intestinal mucosa and aiding in the attachment and colonization of the bacteria at the intestinal wall [57]. Intimin, encoded by the chromosomal gene eaeA, is part of a pathogenicity island termed the locus of enterocyte effacement. Hemolysin, encoded by the hlyA gene, can lyse red blood cells and liberate iron to help support E. coli metabolism [58]. The intestinal tract of cattle is regarded as the primary reservoir of EHEC, also recovered from other domestic animals, such as sheep, goats, pigs, cats, and dogs, as well as wild animals [56,59]. ETEC commonly express heat labile toxin encoded by LTb and heat stable toxin encoded by Sta [53].
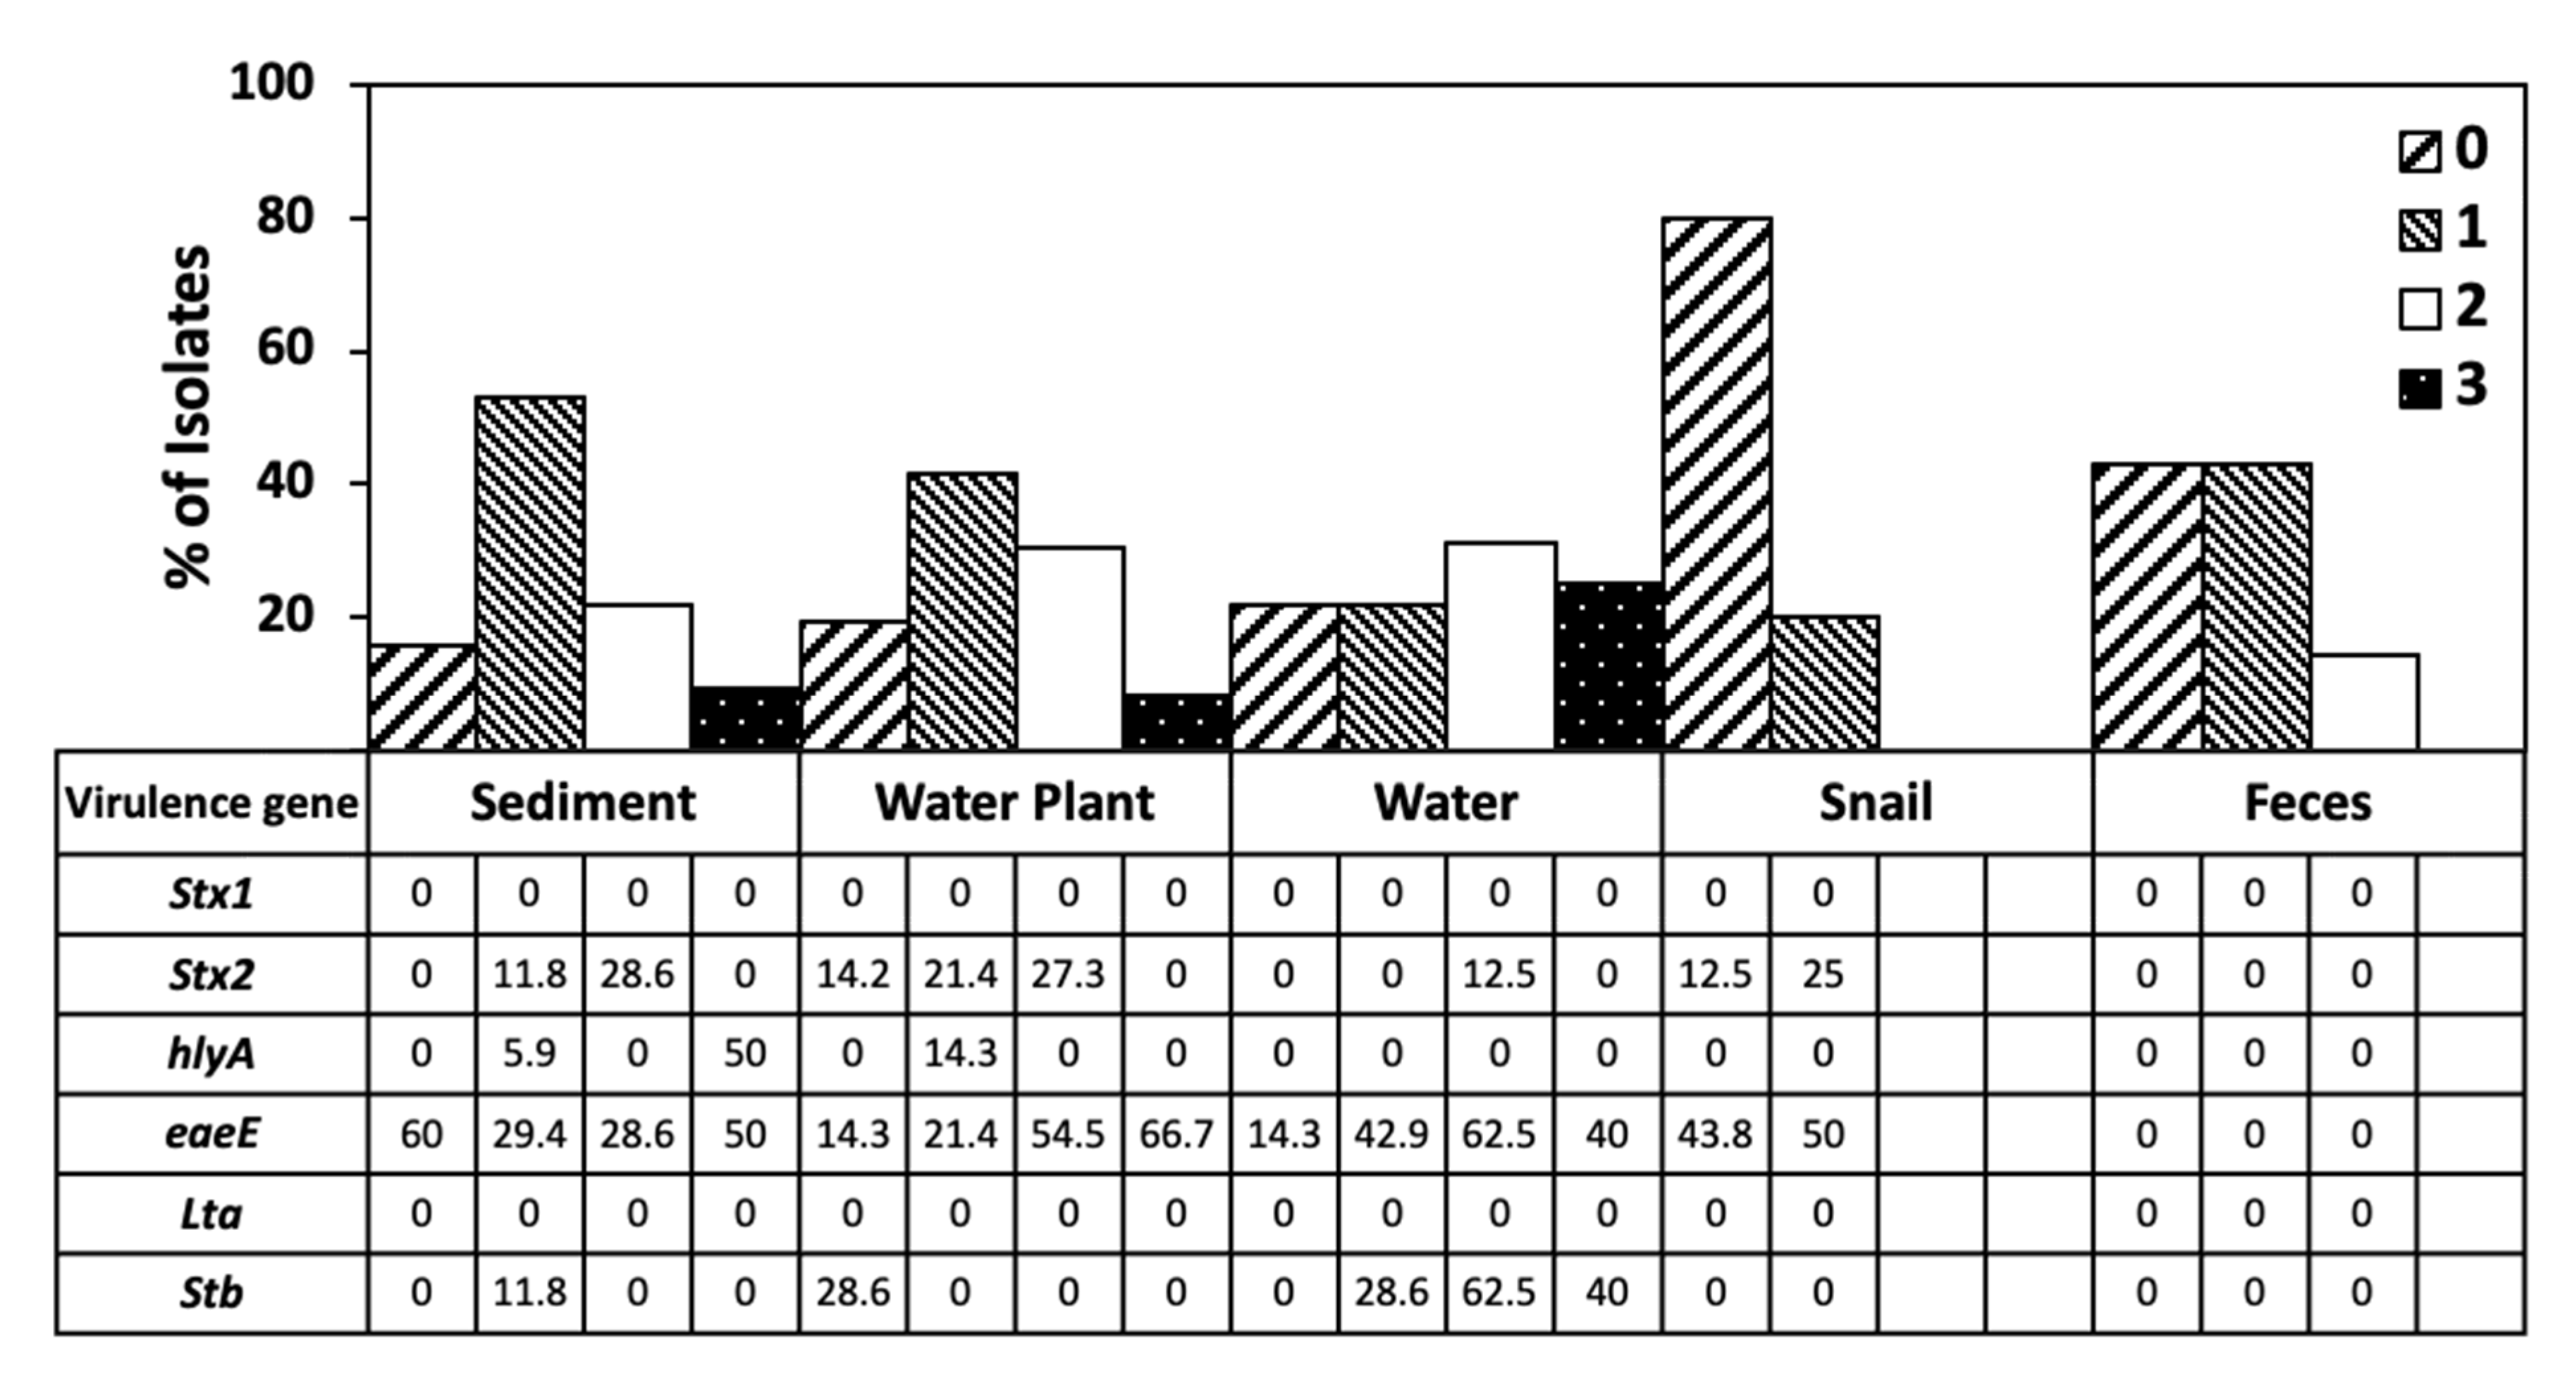
Out of six genes tested for, four (stx2, eaeA, hlyA and STa) were detected. We did not detect any isolates with the stx-1 and LTb genes, although the control strains EDL933D and O157:K88 [60] yielded positive results, confirming reliability of the assay. Among the four detected genes, eaeA was the most frequently detected (36.13%), then stx2 (12.61%), LT (10.9%), and hlyA (3.36%). Distribution of the virulence genes in E. coli populations of water, sediment, and water plants was similar, supporting exchange of isolates among these niches (Figure 4). Yet the water population was much richer in prevalence of the STa gene and had no isolates with hlyA. Virulence gene distribution of snail populations was different, with more than half the isolates containing the eaeA gene. While all isolates from bovine feces belonged to phylogroup E, none contained any of the six virulence genes (Figure 4). Few E isolates carried stx2, and none tested positive for stx1 (Figure S2). β-Glucuronidase negative strains would not have formed green colonies on MLGA, and would have been excluded, so some phylogroup E strains containing virulence genes may have been excluded in our study.
3.6. Antibiotic Resistance Profiling
One antibiotic from each of six target classes was chosen to evaluate the resistance of isolates: ceftriaxone (CRO, class cephalosporins), ciprofloxacin (CIP, class-fluoroquinolones), gentamicin (CN, class aminoglycosides), azithromycin (AZM, class-macrolides), meropenem (MEM, class carbapenems), and tetracycline (TE). Isolate collections from water and water plants showed a similar resistance distribution, with 60% of isolates resistant to gentamicin (Figure 5). Sediment antibiotic resistance distribution was different from water and water plant populations. Water, water plant, and sediment samples contained isolates resistant to three antibiotics, many of which also contained the eaeA gene as well as either STb or hlyA (Figure 6). The isolate collection from snails had a unique antibiotic resistance profile, with 80% sensitive to all antibiotics (Figure 6), whereas only 20% of the isolates from water, sediment, and water plant isolates were not resistant to any of the antibiotics. However, most of the snail isolates displayed intermediate resistance to three or four antibiotics (Figure S3). Isolates from bovine feces also displayed a unique antibiotic resistance profile (Figure 5), with 80% of isolates displaying intermediate resistance to either two or three antibiotics (Figure S3).
4. Discussion
We sought to determine whether environmental E. coli display niche preference by associating with specific environments. We chose a secluded peri-urban pond adjacent to a cattle pasture, isolating E. coli from water, sediment, submerged water plants, and water snails, as well as from freshly deposited bovine feces in the adjacent pasture. While the pond is secluded and therefore less subject to introduction of bacteria from outside, we cannot exclude introduction of E. coli through wild birds or small mammals [61]. To obtain evidence of niche partitioning, isolates were characterized genotypically by phylogrouping, analysis of their uidA and mutS sequences, and virulence gene distribution, and phenotypically for antibiotic resistance.
Snail E. coli populations were predominated by phylogroup B2. Snail phylogroup distribution was different (p < 0.001) to water, sediment, and water plant populations when using multinomial log-linear regression analysis. This indicated that strains display preference for either snail or aquatic niches but not both. Phylogroup distribution differed slightly between sediment and water and water plants but was not significant by multinomial log-linear regression analysis, indicating indiscriminate distribution of specific strains among these three niches. The prevalence of B1 and E, and some B2 in water, water plant, and sediment was consistent with previous studies where B1 have been interpreted as generalists and harbor traits linked to plant association, whereas B2 strains are associated more with animals [62,63]. Phylogroup distribution within the E. coli population in both water and superficial sediments showed spatial variation [34]. It has also been reported that phylogenetic groups are adaptable and genotypically influenced by changes in environmental conditions; however, phylogroup B1 isolates seem to persist in water [8,64]. Our data indicated that the B2 populations occurring in the pond persisted mostly in water snails. Likewise, phylogroup E strains predominated in bovine feces deposited nearby, and despite run-off from the pasture to the pond, did not thrive in the pond environment. The composition differences of phylogroups among populations in different environments may be caused by differences in adaptability and genome plasticity of E. coli strains [64]. Such variation in phylogroup distribution suggests that E. coli phylogroups are affected by niche specific selective pressures [63].
The phylogroup E strains isolated from the water, sediment, and water plants formed several clusters within the uidA mutS phylogeny. Importantly, snail phylogroup E isolates clustered separately, as did bovine fecal isolates, indicating three separate groups of isolates and supporting niche preference among various phylogroup E strains. The mutS and uidA phylogeny showed that some clusters were devoid of reference strains. None of our phylogroup E isolates clustered with any reference strains, suggesting these isolates are different to those typically associated with humans. In a recent study of cattle pasture we also found a higher percentage of phylogroup E in bovine fecal isolates compared to soil isolates, and none clustered with reference strains [9]. There appear to be diverse environmental β-Glucuronidase positive E. coli that are allocated to phylogroup E by the Clermont scheme [6], but that do not align with human isolates available in the databanks, warranting further investigation. The prevalence of E. coli in soils depends on specific conditions with phylogroup B1 and E associated with pasture lands while B2 and D phylogroups were associated with wooded areas [65]. Collectively, the phylogeny derived from uidA and mutS genes supported by phylogroup distribution analysis showed a preference of certain isolates with distinct backgrounds for specific niches.
Population genetic analysis of mutS and uidA supported the existence of three distinct genetic backgrounds within the collection of isolates analyzed. The bovine fecal isolates had a homogenous background mostly lacking admixture. Some snail isolates shared this background, while others had their own background also lacking admixture. Isolates from water, water plants and sediment varied. Some had pure bovine background, others pure snail background, while the majority had an admixture of two or three backgrounds, bovine and/or snail plus a third, apparently aquatic one. This indicated directional gene flow from bovine fecal, and separately from snail-associated strains to aquatic strains. In contrast there was no or limited evidence for gene flow from aquatic to snail or cattle populations, indicating that none of these aquatic strains were able to persist in snail or bovine gastrointestinal environments. The neutral theory of molecular evolution makes a clear prediction on how the genetic drift in the absence of all other evolutionary forces shapes genetic diversity [66]. To study genomic evolution and consider a more complex explanation for the pattern of molecular variation, the neutral theory must be rejected as a null hypothesis [67]. Genetic variation in E. coli combines aspects of recombination, selection, and population structure [68]. The gene flow model has some support in the literature. Retchless and Lawrence [69] proposed the fragment speciation model in which different segments of bacterial chromosomes become genetically isolated at different times. Sheppard et al. [70] found evidence of increasing gene flow between previously distinct Campylobacter species. Luo et al. [71] described the genomes of environmental isolates of E. coli and found little evidence of gene exchange between gut commensal E. coli due to possible ecological barriers, although they found transfer of core genes within the clades. Similarly, Karberg et al. [72] found that recently acquired genes in Salmonella and Escherichia genomes have similar codon usage frequencies, while cores genes have noticeably diverged in codon usage. Therefore, it seems that Salmonella and Escherichia strains acquire genes from common pangenomes shared among enterobacterial species.
The presence of virulence genes eaeA, stx2, hlyA, and STa indicates potential pathogens, though it has been suggested that the occurrence of single or multiple virulence genes in E. coli does not confirm its pathogenicity, unless it has the appropriate combination of virulence genes to cause disease to the host. Enteric pathogens exposed to vegetables express similar genes to those required to colonize the host intestine, indicating that enteric bacteria may have the ability for colonization of vegetables by using similar mechanism required for animal cells [73]. High prevalence of the intimin-encoding gene eaeA was observed in all four pond niches, but not in feces, indicating presence of eaeA may play a role in aquatic fitness that is distinct from virulence. Byappanahalli et al. [74] detected a high level of eaeA in isolates from algae and to a lesser extent in those from water and sand samples from lake Michigan. eaeA is one of the most frequently detected E. coli pathogenicity genes in the environment [75,76,77]. It is not certain if these isolates with virulence genes are pathogenic and persist in the environment, or whether they acquire these genes from these environments.
The similarities in patterns of antibiotic resistance in aquatic populations suggested a common source of resistant strains, with preference for these niches. Snail populations were almost devoid of resistance to the wide array of antibiotics evaluated, again supporting niche preference. E. coli isolated from various sampling sources showed variation in the antibiotic resistance patterns depending on the use of antibiotics and their exposure to environments [78,79,80]. This pond was not being used for any human or domestic animal activities and there was no direct input of wastewater. It is unclear whether isolates acquired antibiotic resistance through antibiotic exposure, or whether they maintain these genes in the absence of antibiotics [81].
In conclusion, sediment, water, and water plant populations showed similarities in phylogroup distribution, occurrence of virulence genes and antibiotic resistance patterns in their populations, indicating that individual strains of this population can associate with any of these three niches. Snail-associated populations were different, and contained several apparently novel E. coli strains, primarily belonging to phylogroup B2. Bovine fecal populations from the adjoining pasture were different based on phenotype and genotype, and not similar to any aquatic isolates. The distinct distribution patterns of E. coli strains indicate niche preference, with specific aquatic strains not associating with snails or cattle.
Supplementary Materials
The following are available online at https://www.mdpi.com/article/10.3390/life11101020/s1, Figure S1: Multinomial log-linear regression analysis of phylogroup distribution of isolates across sample types. Phylogrouping was performed according to the scheme of Clermont et al., 2013. The X axis denotes phylogroups and the Y-axis represents proportion of isolates. Sed–sediment, W–water, WP–water plant, SN–snail, Figure S2: Virulence gene distribution across isolates allocate to phylogroups based on the scheme of Clermont et al., 2013. The number of isolates for each phylogroup is given in parentheses on the x axis, Figure S3: Distribution of sensitive (0) and isolates displaying Intermediate resistance to 1, 2, 3, 4 or 5 antibiotics from the five sampling sites, Table S1: Primers used for determining the uidA and mutS genes, and for phylogrouping, Table S2: Primers used for amplification of virulence genes.
Author Contributions
Conceptualization, G.N., S.N.V. and V.S.B.; methodology, G.N., E.S., S.N.V. and V.S.B.; formal analysis, G.N., T.H. and S.C.P.; investigation, G.N., S.C.P., E.S., S.N.V. and V.S.B.; resources, S.N.V. and V.S.B.; data curation, G.N; writing—original draft preparation, G.N.; writing—review and editing, G.N., T.H., S.C.P., E.S., S.N.V. and V.S.B.; visualization, G.N. and V.S.B.; supervision, S.N.V. and V.S.B.; funding acquisition, S.N.V. and V.S.B. All authors have read and agreed to the published version of the manuscript.
Funding
GN was supported by a fellowship from the South Dakota Agricultural Experiment Station. This research was funded by the South Dakota Agricultural Experiment Station.
Institutional Review Board Statement
Not applicable.
Informed Consent Statement
Not applicable.
Data Availability Statement
Not applicable.
Conflicts of Interest
The authors declare no conflict of interest. The funders had no role in the design of the study; in the collection, analyses, or interpretation of data; in the writing of the manuscript, or in the decision to publish the results.
References
- Jang, J.; Hur, H.G.; Sadowsky, M.J.; Byappanahalli, M.N.; Yan, T.; Ishii, S. Environmental Escherichia coli: Ecology and public health implications—A review. J. Appl. Microbiol. 2017, 123, 570–581. [Google Scholar] [CrossRef] [PubMed] [Green Version]
- Blount, Z.D. The unexhausted potential of E. coli. eLife 2015, 4, e05826. [Google Scholar] [CrossRef] [PubMed]
- Gordon, D.M. The Influence of Ecological Factors on the Distribution and the Genetic Structure of Escherichia coli. EcoSal Plus 2004, 1. [Google Scholar] [CrossRef]
- Bergthorsson, U.; Ochman, H. Distribution of chromosome length variation in natural isolates of Escherichia coli. Mol. Biol. Evol. 1998, 15, 6–16. [Google Scholar] [CrossRef] [PubMed]
- Clermont, O.; Bonacorsi, S.; Bingen, E. Rapid and simple determination of the Escherichia coli phylogenetic group. Appl. Environ. Microbiol. 2000, 66, 4555–4558. [Google Scholar] [CrossRef] [PubMed] [Green Version]
- Clermont, O.; Christenson, J.K.; Denamur, E.; Gordon, D.M. The Clermont Escherichia coli phylo-typing method revisited: Improvement of specificity and detection of new phylo-groups. Environ. Microbiol. Rep. 2013, 5, 58–65. [Google Scholar] [CrossRef]
- Walk, S.T.; Alm, E.W.; Calhoun, L.M.; Mladonicky, J.M.; Whittam, T.S. Genetic diversity and population structure of Escherichia coli isolated from freshwater beaches. Environ. Microbiol. 2007, 9, 2274–2288. [Google Scholar] [CrossRef]
- Ratajczak, M.; Laroche, E.; Berthe, T.; Clermont, O.; Pawlak, B.; Denamur, E.; Petit, F. Influence of hydrological conditions on the Escherichia coli population structure in the water of a creek on a rural watershed. BMC Microbiol. 2010, 10, 222. [Google Scholar] [CrossRef] [Green Version]
- NandaKafle, G.; Seale, T.; Flint, T.; Nepal, M.; Venter, S.N.; Brözel, V.S. Distribution of Diverse Escherichia coli between Cattle and Pasture. Microbes Environ. 2017, 32, 226–233. [Google Scholar] [CrossRef] [Green Version]
- Johnson, J.R.; Stell, A.L. Extended virulence genotypes of Escherichia coli strains from patients with urosepsis in relation to phylogeny and host compromise. J. Infect. Dis. 2000, 181, 261–272. [Google Scholar] [CrossRef] [Green Version]
- Le Gall, T.; Clermont, O.; Gouriou, S.; Picard, B.; Nassif, X.; Denamur, E.; Tenaillon, O. Extraintestinal virulence is a coincidental by-product of commensalism in B2 phylogenetic group Escherichia coli strains. Mol. Biol. Evol. 2007, 24, 2373–2384. [Google Scholar] [CrossRef] [Green Version]
- Picard, B.; Garcia, J.S.; Gouriou, S.; Duriez, P.; Brahimi, N.; Bingen, E.; Elion, J.; Denamur, E. The link between phylogeny and virulence in Escherichia coli extraintestinal infection. Infect. Immun. 1999, 67, 546–553. [Google Scholar] [CrossRef] [Green Version]
- Unno, T.; Han, D.; Jang, J.; Lee, S.N.; Ko, G.; Choi, H.Y.; Kim, J.H.; Sadowsky, M.J.; Hur, H.G. Absence of Escherichia coli phylogenetic group B2 strains in humans and domesticated animals from Jeonnam Province, Republic of Korea. Appl. Environ. Microbiol. 2009, 75, 5659–5666. [Google Scholar] [CrossRef] [Green Version]
- Chandran, A.; Mazumder, A. Occurrence of Diarrheagenic Virulence Genes and Genetic Diversity in Escherichia coli Isolates from Fecal Material of Various Avian Hosts in British Columbia, Canada. Appl. Environ. Microbiol. 2014, 80, 1933–1940. [Google Scholar] [CrossRef] [Green Version]
- Chandran, A.; Mazumder, A. Prevalence of Diarrhea-Associated Virulence Genes and Genetic Diversity in Escherichia coli Isolates from Fecal Material of Various Animal Hosts. Appl. Environ. Microbiol. 2013, 79, 7371–7380. [Google Scholar] [CrossRef] [Green Version]
- McLellan, S.L.; Daniels, A.D.; Salmore, A.K. Genetic characterization of Escherichia coli populations from host sources of fecal pollution by using DNA fingerprinting. Appl. Environ. Microbiol. 2003, 69, 2587–2594. [Google Scholar] [CrossRef] [Green Version]
- Anderson, M.A.; Whitlock, J.E.; Harwood, V.J. Diversity and distribution of Escherichia coli genotypes and antibiotic resistance phenotypes in feces of humans, cattle, and horses. Appl. Environ. Microbiol. 2006, 72, 6914–6922. [Google Scholar] [CrossRef] [Green Version]
- Braz, V.S.; Melchior, K.; Moreira, C.G. Escherichia coli as a Multifaceted Pathogenic and Versatile Bacterium. Front. Cell Infect. Microbiol. 2020, 10, 1–9. [Google Scholar] [CrossRef]
- Rasko, D.A.; Rosovitz, M.J.; Myers, G.S.; Mongodin, E.F.; Fricke, W.F.; Gajer, P.; Crabtree, J.; Sebaihia, M.; Thomson, N.R.; Chaudhuri, R. The pangenome structure of Escherichia coli: Comparative genomic analysis of E. coli commensal and pathogenic isolates. J. Bacteriol. 2008, 190, 6881–6893. [Google Scholar] [CrossRef] [Green Version]
- Touchon, M.; Hoede, C.; Tenaillon, O.; Barbe, V.; Baeriswyl, S.; Bidet, P.; Bingen, E.; Bonacorsi, S.; Bouchier, C.; Bouvet, O.; et al. Organised genome dynamics in the Escherichia coli species results in highly diverse adaptive paths. PLoS Genet. 2009, 5, e1000344. [Google Scholar] [CrossRef] [Green Version]
- Robins-Browne, R.M.; Holt, K.E.; Ingle, D.J.; Hocking, D.M.; Yang, J.; Tauschek, M. Are Escherichia coli Pathotypes Still Relevant in the Era of Whole-Genome Sequencing? Front. Cell Infect. Microbiol. 2016, 6, 141. [Google Scholar] [CrossRef] [PubMed] [Green Version]
- Lukjancenko, O.; Wassenaar, T.M.; Ussery, D.W. Comparison of 61 sequenced Escherichia coli genomes. Microb. Ecol. 2010, 60, 708–720. [Google Scholar] [CrossRef] [PubMed] [Green Version]
- McNally, A.; Oren, Y.; Kelly, D.; Pascoe, B.; Dunn, S.; Sreecharan, T.; Vehkala, M.; Valimaki, N.; Prentice, M.B.; Ashour, A.; et al. Combined Analysis of Variation in Core, Accessory and Regulatory Genome Regions Provides a Super-Resolution View into the Evolution of Bacterial Populations. PLoS Genet. 2016, 12, e1006280. [Google Scholar] [CrossRef] [PubMed]
- Ishii, S.; Ksoll, W.B.; Hicks, R.E.; Sadowsky, M.J. Presence and growth of naturalized Escherichia coli in temperate soils from Lake Superior watersheds. Appl. Environ. Microbiol. 2006, 72, 612–621. [Google Scholar] [CrossRef] [Green Version]
- Brennan, F.P.; Abram, F.; Chinalia, F.A.; Richards, K.G.; O’Flaherty, V. Characterization of environmentally persistent Escherichia coli isolates leached from an Irish soil. Appl. Environ. Microbiol. 2010, 76, 2175–2180. [Google Scholar] [CrossRef] [Green Version]
- Lyautey, E.; Lu, Z.; Lapen, D.R.; Wilkes, G.; Scott, A.; Berkers, T.; Edge, T.A.; Topp, E. Distribution and diversity of Escherichia coli populations in the south nation river drainage basin, eastern Ontario, Canada. Appl. Environ. Microbiol. 2010, 76, 1486–1496. [Google Scholar] [CrossRef] [Green Version]
- Van Elsas, J.D.; Hill, P.; Chronakova, A.; Grekova, M.; Topalova, Y.; Elhottova, D.; Kristufek, V. Survival of genetically marked Escherichia coli O157:H7 in soil as affected by soil microbial community shifts. ISME J. 2007, 1, 204–214. [Google Scholar] [CrossRef] [Green Version]
- Byappanahalli, M.N.; Richard, L.W.; Shivelya, D.A.; John, F.; Ishii, S.; Sadowsky, M.J. Population structure of cladophora-borne Escherichia coli in nearshore water of lake Michigan. Water Res. 2007, 41, 3649–3654. [Google Scholar] [CrossRef]
- Casarez, E.A.; Pillai, S.D.; Di Giouanni, G.D. Genotype diversity of Escherichia coli isolates in natural waters determined by PFGE and ERIC-PCR. Water Res. 2007, 41, 3643–3648. [Google Scholar] [CrossRef]
- McLellan, S.L. Genetic diversity of Escherichia coli isolated from urban rivers and beach water. Appl. Environ. Microbiol. 2004, 70, 4658–4665. [Google Scholar] [CrossRef] [Green Version]
- Beversdorf, L.J.; Bornstein-Forst, S.M.; McLellan, S.L. The potential for beach sand to serve as a reservoir for Escherichia coli and the physical influences on cell die-off. J. Appl. Microbiol. 2007, 102, 1372–1381. [Google Scholar] [CrossRef]
- Byappanahalli, M.N.; Fujioka, R.S. Evidence that tropical soil environment can support the growth of Escherichia coli. Water Sci. Technol. 1998, 38, 171–174. [Google Scholar] [CrossRef]
- Byappanahalli, M.N.; Whitman, R.L.; Shively, D.A.; Sadowsky, M.J.; Ishii, S. Population structure, persistence, and seasonality of autochthonous Escherichia coli in temperate, coastal forest soil from a Great Lakes watershed. Environ. Microbiol. 2006, 8, 504–513. [Google Scholar] [CrossRef]
- Petit, F.; Clermont, O.; Delannoy, S.; Servais, P.; Gourmelon, M.; Fach, P.; Oberle, K.; Fournier, M.; Denamur, E.; Berthe, T. Change in the Structure of Escherichia coli Population and the Pattern of Virulence Genes along a Rural Aquatic Continuum. Front. Microbiol. 2017, 8, 609. [Google Scholar] [CrossRef]
- Blount, Z.D.; Barrick, J.E.; Davidson, C.J.; Lenski, R.E. Genomic analysis of a key innovation in an experimental Escherichia coli population. Nature 2012, 489, 513–518. [Google Scholar] [CrossRef]
- Hammer, Ø.; Harper, D.A.T.; Ryan, P.D. PAST: Paleontological Statistics Software Package for Education and Data Analysis. Paleontol. Electron. 2001, 4, 1–9. [Google Scholar]
- R Development Core Team. R: A Language and Environment for Statistical Computing; R Foundation for Statistical Computing: Vienna, Austria, 2015. [Google Scholar]
- Hothorn, T. Comprehensive R Archive Network; Party, v.1.0-17; R Foundation for Statistical Computing: Vienna, Austria, 2014. [Google Scholar]
- Walk, S.T.; Alm, E.W.; Gordon, D.M.; Ram, J.L.; Toranzos, G.A.; Tiedje, J.M.; Whittam, T.S. Cryptic lineages of the genus Escherichia. Appl. Environ. Microbiol. 2009, 75, 6534–6544. [Google Scholar] [CrossRef] [Green Version]
- Ferenci, T. What is driving the acquisition of mutS and rpoS polymorphisms in Escherichia coli? Trends Microbiol. 2003, 11, 457–461. [Google Scholar] [CrossRef]
- Tamura, K.; Peterson, D.; Peterson, N.; Stecher, G.; Nei, M.; Kumar, S. MEGA5: Molecular evolutionary genetics analysis using maximum likelihood, evolutionary distance, and maximum parsimony methods. Mol. Biol. Evol. 2011, 28, 2731–2739. [Google Scholar] [CrossRef] [Green Version]
- Rambaut, A. SE-AL v. 2.0a11: Sequence Alignment Program. 2002. Available online: http://tree.bio.ed.ac.uk/software/seal/ (accessed on 17 September 2021).
- Leimbach, A.; Hacker, J.; Dobrindt, U. E. coli as an all-rounder: The thin line between commensalism and pathogenicity. Curr. Top. Microbiol. Immunol. 2013, 358, 3–32. [Google Scholar] [CrossRef]
- Letunic, I.; Bork, P. Interactive tree of life v2: Online annotation and display of phylogenetic trees made easy. Nucleic Acids Res. 2011, 39, W475–W478. [Google Scholar] [CrossRef]
- Falush, D.; Stephens, M.; Pritchard, J.K. Inference of population structure using multilocus genotype data: Linked loci and correlated allele frequencies. Genetics 2003, 164, 1567–1587. [Google Scholar] [CrossRef]
- Pritchard, J.K.; Stephens, M.; Donnelly, P. Inference of population structure using multilocus genotype data. Genetics 2000, 155, 945–959. [Google Scholar] [CrossRef]
- Hubisz, M.J.; Falush, D.; Stephens, M.; Pritchard, J.K. Inferring weak population structure with the assistance of sample group information. Mol. Ecol. Resour. 2009, 9, 1322–1332. [Google Scholar] [CrossRef] [PubMed] [Green Version]
- Evanno, G.; Regnaut, S.; Goudet, J. Detecting the number of clusters of individuals using the software STRUCTURE: A simulation study. Mol. Ecol. 2005, 14, 2611–2620. [Google Scholar] [CrossRef] [PubMed] [Green Version]
- Earl, D.A.; Vonholdt, B.M. STRUCTURE HARVESTER: A website and program for visualizing STRUCTURE output and implementing the Evanno method. Conserv. Genet. Resour. 2012, 4, 359–361. [Google Scholar] [CrossRef]
- Jakobsson, M.; Rosenberg, N.A. CLUMPP: A cluster matching and permutation program for dealing with label switching and multimodality in analysis of population structure. Bioinformatics 2007, 23, 1801–1806. [Google Scholar] [CrossRef] [Green Version]
- Rosenberg, N.A. DISTRUCT: A program for the graphical display of population structure. Mol. Ecol. Notes 2004, 4, 137–138. [Google Scholar] [CrossRef]
- Fagan, P.K.; Hornitzky, M.A.; Bettelheim, K.A.; Djordjevic, S.P. Detection of Shiga-liketoxin (stx(1) and stx(2)), Intimin (eaeA), and enterohemorrhagic Escherichia coli (EHEC) Hemolysin (EHEC hlyA) genes in animal feces by multiplex PCR. Appl. Environ. Microbiol. 1999, 65, 868–872. [Google Scholar] [CrossRef] [Green Version]
- Osek, J. Multiplex polymerase chain reaction assay for identification of enterotoxigenic Escherichia coli strains. J. Vet. Diagn. Invest. 2001, 13, 308–311. [Google Scholar] [CrossRef] [Green Version]
- Wayne, P.A.; CLSI. Twenty-Fifth Informational Performance Standards for Antimicrobial Susceptibility Testing Supplement. In CLSI Document M100-S25; Clinical and Laboratory Standards Institute: New York, NY, USA, 2015. [Google Scholar]
- Chang, G.W.; Brill, J.; Lum, R. Proportion of beta-D-glucuronidase-negative Escherichia coli in human fecal samples. Appl. Environ. Microbiol. 1989, 55, 335–339. [Google Scholar] [CrossRef] [Green Version]
- Mora, A.; Lopez, C.; Dhabi, G.; Lopez-Beceiro, A.M.; Fidalgo, L.E.; Diaz, E.A.; Martinez-Carrasco, C.; Mamani, R.; Herrera, A.; Blanco, J.E.; et al. Seropathotypes, Phylogroups, Stx Subtypes, and Intimin Types of Wildlife-Carried, Shiga Toxin-Producing Escherichia coli Strains with the Same Characteristics as Human-Pathogenic Isolates. Appl. Environ. Microb. 2012, 78, 2578–2585. [Google Scholar] [CrossRef] [Green Version]
- Dhaka, P.; Vijay, D.; Vergis, J.; Negi, M.; Kumar, M.; Mohan, V.; Doijad, S.; Poharkar, K.V.; Malik, S.S.; Barbuddhe, S.B.; et al. Genetic diversity and antibiogram profile of diarrhoeagenic Escherichia coli pathotypes isolated from human, animal, foods and associated environmental sources. Infect. Ecol. Epidemiol. 2016, 6, 31055. [Google Scholar] [CrossRef]
- Schwidder, M.; Heinisch, L.; Schmidt, H. Genetics, Toxicity, and Distribution of Enterohemorrhagic Escherichia coli Hemolysin. Toxins 2019, 11, 502. [Google Scholar] [CrossRef] [Green Version]
- Singh, P.; Sha, Q.; Lacher, D.W.; Del Valle, J.; Mosci, R.E.; Moore, J.A.; Scribner, K.T.; Manning, S.D. Characterization of enteropathogenic and Shiga toxin-producing Escherichia coli in cattle and deer in a shared agroecosystem. Front. Cell Infect. Microbiol. 2015, 5, 29. [Google Scholar] [CrossRef] [PubMed] [Green Version]
- Francis, D.H.; Willgohs, J.A. Evaluation of a live avirulent Escherichia coli vaccine for K88+, LT+ enterotoxigenic colibacillosis in weaned pigs. Am. J. Vet. Res. 1991, 52, 1051–1055. [Google Scholar]
- Hansen, D.L.; Ishii, S.; Sadowsky, M.J.; Hicks, R.E. Escherichia coli Populations in Great Lakes Waterfowl Exhibit Spatial Stability and Temporal Shifting. Appl. Environ. Microb. 2009, 75, 1546–1551. [Google Scholar] [CrossRef] [Green Version]
- White, A.P.; Sibley, K.A.; Sibley, C.D.; Wasmuth, J.D.; Schaefer, R.; Surette, M.G.; Edge, T.A.; Neumann, N.F. Intergenic sequence comparison of Escherichia coli isolates reveals lifestyle adaptations but not host specificity. Appl. Environ. Microbiol. 2011, 77, 7620–7632. [Google Scholar] [CrossRef] [Green Version]
- Meric, G.; Kemsley, E.K.; Falush, D.; Saggers, E.J.; Lucchini, S. Phylogenetic distribution of traits associated with plant colonization in Escherichia coli. Environ. Microbiol. 2013, 15, 487–501. [Google Scholar] [CrossRef]
- Jang, J.; Di, D.Y.W.; Lee, A.; Unno, T.; Sadowsky, M.J.; Hur, H.G. Seasonal and Genotypic Changes in Escherichia coli Phylogenetic Groups in the Yeongsan River Basin of South Korea. PLoS ONE 2014, 9, e100585. [Google Scholar] [CrossRef]
- Dusek, N.; Hewitt, A.J.; Schmidt, K.N.; Bergholz, P.W. Landscape-Scale Factors Affecting the Prevalence of Escherichia coli in Surface Soil Include Land Cover Type, Edge Interactions, and Soil pH. Appl. Environ. Microbiol. 2018, 84, e02714–e02717. [Google Scholar] [CrossRef] [Green Version]
- Kimura, M. The Neutral Theory of Molecular Evolution; Cambridge University Press: Cambridge, UK, 1983. [Google Scholar]
- Lynch, M.; Walsh, B. The Origins of Genome Architecture; Sinauer Associates Sunderland: Sunderland, MA, USA, 2007; Volume 98. [Google Scholar]
- Maddamsetti, R. Gene flow in microbial communities could explain unexpected patterns of synonymous variation in the Escherichia coli core genome. Mob. Genet. Elem. 2016, 6, e1137380. [Google Scholar] [CrossRef] [PubMed]
- Retchless, A.C.; Lawrence, J.G. Temporal Fragmentation of Speciation in Bacteria. Science 2007, 317, 1093–1096. [Google Scholar] [CrossRef] [PubMed] [Green Version]
- Sheppard, S.K.; McCarthy, N.D.; Falush, D.; Maiden, M.C. Convergence of Campylobacter species: Implications for bacterial evolution. Science 2008, 320, 237–239. [Google Scholar] [CrossRef]
- Luo, C.; Walk, S.T.; Gordon, D.M.; Feldgarden, M.; Tiedje, J.M.; Konstantinidis, K.T. Genome sequencing of environmental Escherichia coli expands understanding of the ecology and speciation of the model bacterial species. Proc. Natl. Acad. Sci. USA 2011, 108, 7200–7205. [Google Scholar] [CrossRef] [Green Version]
- Karberg, K.A.; Olsen, G.J.; Davis, J.J. Similarity of genes horizontally acquired by Escherichia coli and Salmonella enterica is evidence of a supraspecies pangenome. Proc. Natl. Acad. Sci. USA 2011, 108, 20154–20159. [Google Scholar] [CrossRef] [Green Version]
- Goudeau, D.M.; Parker, C.T.; Zhou, Y.G.; Sela, S.; Kroupitski, Y.; Brandl, M.T. The Salmonella Transcriptome in Lettuce and Cilantro Soft Rot Reveals a Niche Overlap with the Animal Host Intestine. Appl. Environ. Microbiol. 2013, 79, 250–262. [Google Scholar] [CrossRef] [Green Version]
- Byappanahalli, M.N.; Nevers, M.B.; Whitman, R.L.; Ishii, S. Application of a Microfluidic Quantitative Polymerase Chain Reaction Technique to Monitor Bacterial Pathogens in Beach Water and Complex Environmental Matrices. Environ. Sci. Technol. Lett. 2015, 2, 347–351. [Google Scholar] [CrossRef]
- Zhang, Q.; Eichmiller, J.J.; Staley, C.; Sadowsky, M.J.; Ishii, S. Correlations between pathogen concentration and fecal indicator marker genes in beach environments. Sci. Total Environ. 2016, 573, 826–830. [Google Scholar] [CrossRef]
- Hamilton, M.J.; Hadi, A.Z.; Griffith, J.F.; Ishii, S.; Sadowsky, M.J. Large scale analysis of virulence genes in Escherichia coli strains isolated from Avalon Bay, CA. Water Res. 2010, 44, 5463–5473. [Google Scholar] [CrossRef] [Green Version]
- Chandran, A.; Mazumder, A. Pathogenic Potential, Genetic Diversity, and Population Structure of Escherichia coli Strains Isolated from a Forest-Dominated Watershed (Comox Lake) in British Columbia, Canada. Appl. Environ. Microbiol. 2015, 81, 1779–1789. [Google Scholar] [CrossRef] [PubMed]
- Amaya, E.; Reyes, D.; Paniagua, M.; Calderon, S.; Rashid, M.U.; Colque, P.; Kuhn, I.; Mollby, R.; Weintraub, A.; Nord, C.E. Antibiotic resistance patterns of Escherichia coli isolates from different aquatic environmental sources in Leon, Nicaragua. Clin. Microbiol. Infect. 2012, 18, E347–E354. [Google Scholar] [CrossRef] [PubMed] [Green Version]
- Sayah, R.S.; Kaneene, J.B.; Johnson, Y.; Miller, R. Patterns of antimicrobial resistance observed in Escherichia coli isolates obtained from domestic- and wild-animal fecal samples, human septage, and surface water. Appl. Environ. Microbiol. 2005, 71, 1394–1404. [Google Scholar] [CrossRef] [PubMed] [Green Version]
- Ibekwe, A.M.; Murinda, S.E.; Graves, A.K. Genetic Diversity and Antimicrobial Resistance of Escherichia coli from Human and Animal Sources Uncovers Multiple Resistances from Human Sources. PLoS ONE 2011, 6, e20819. [Google Scholar] [CrossRef] [Green Version]
- Vaz-Moreira, I.; Nunes, O.C.; Manaia, C.M. Bacterial diversity and antibiotic resistance in water habitats: Searching the links with the human microbiome. Fems Microbiol. Rev. 2014, 38, 761–778. [Google Scholar] [CrossRef]
Figure 1.
Phylogroup distribution across isolates from the five sample types. Phylogrouping was performed according to the scheme of Clermont et al., 2013 [6]. The relatedness between Phylogroup distribution similarity was determined by UPGMA using the constrained Jaccard coefficient.
Figure 1.
Phylogroup distribution across isolates from the five sample types. Phylogrouping was performed according to the scheme of Clermont et al., 2013 [6]. The relatedness between Phylogroup distribution similarity was determined by UPGMA using the constrained Jaccard coefficient.
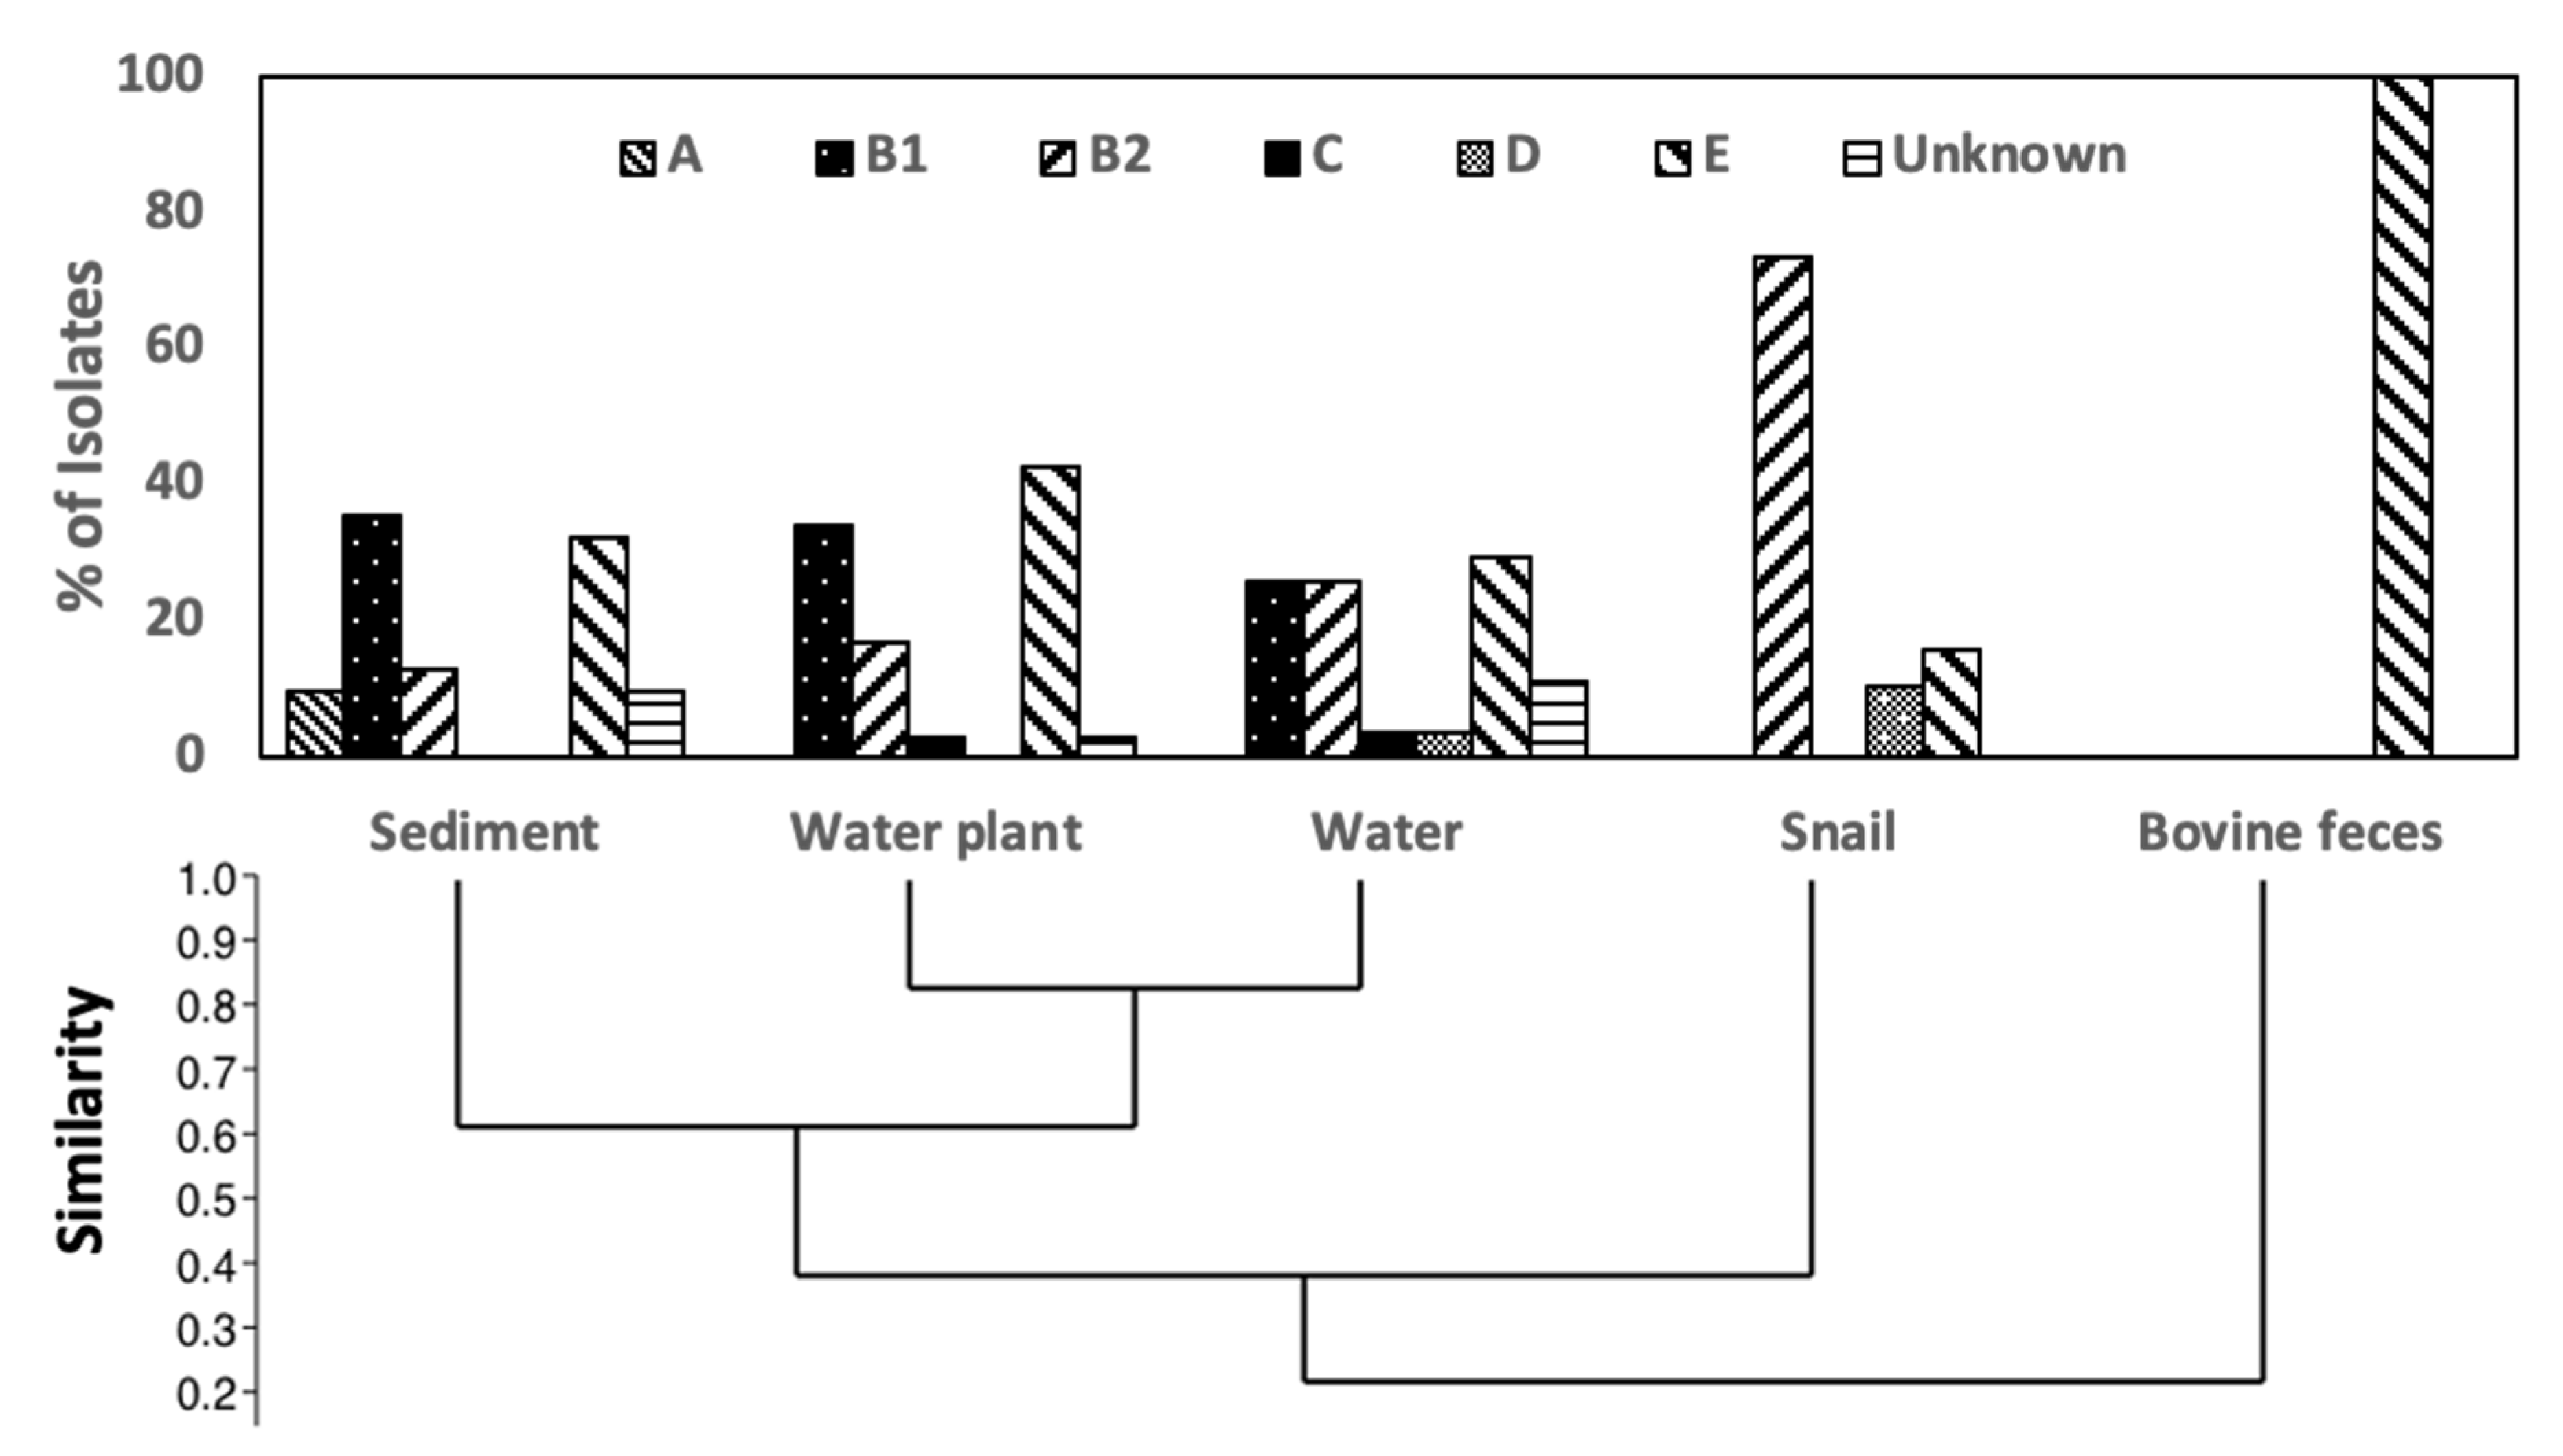
Figure 2.
Phylogenetic analysis of the concatenated uidA and mutS gene sequences of E. coli isolates, reference strains, and cryptic species of E. coli. Sequences were aligned using ClustalW and manually trimmed using Se-Al. The best model: Maximum Likelihood analysis with GTR and G + I was performed in the program MEGA 6. The phylogenetic tree was color-coded and visualized using the Interactive Tree of Life with isolates color-coded based on their sources. Grey circles on branches indicate a bootstrap value of >80% (1000 bootstraps).
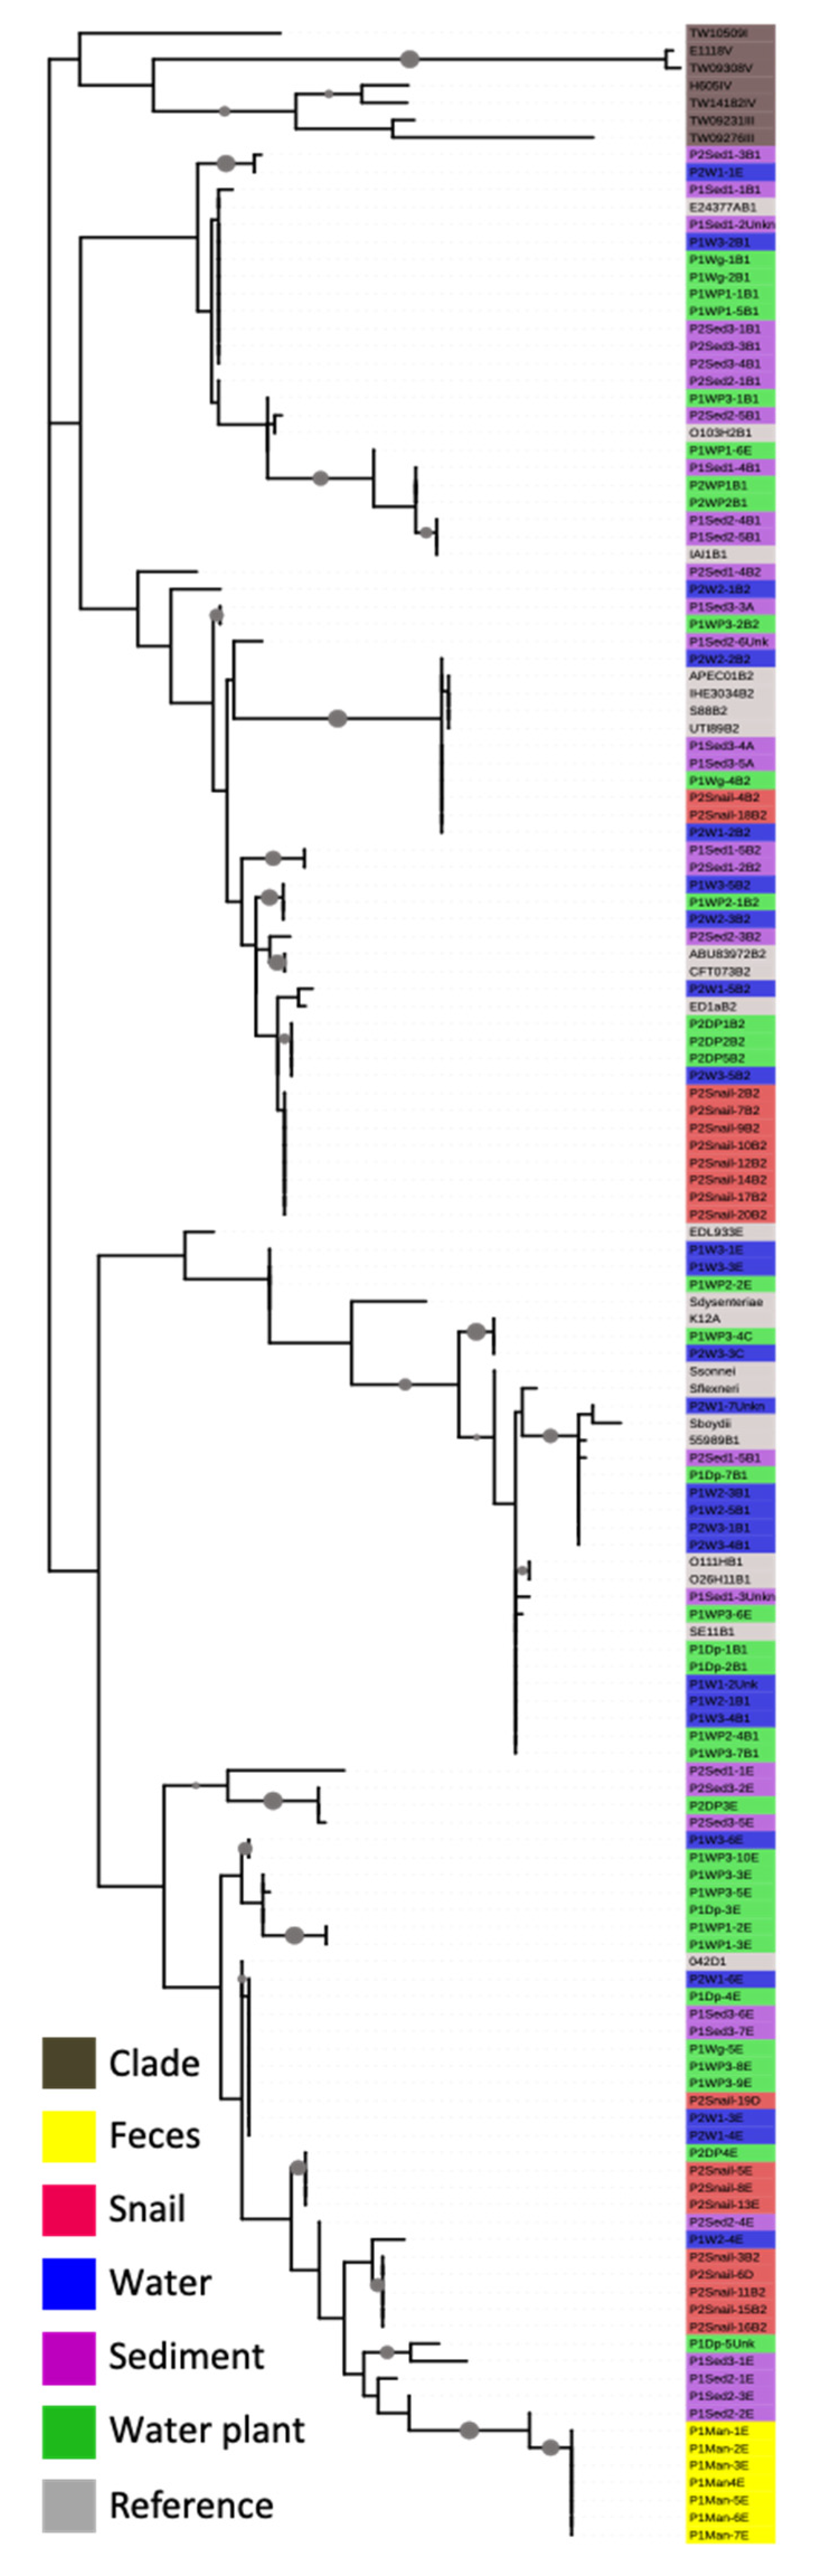
Figure 3.
Population structure analysis of E. coli isolates. Concatenated uidA and mutS sequences were analyzed assuming presence of two populations, but analysis using Structure Harvester showed that K = 3 best explained the data. The short color bars below the figure indicate the isolate source as defined in the legend.
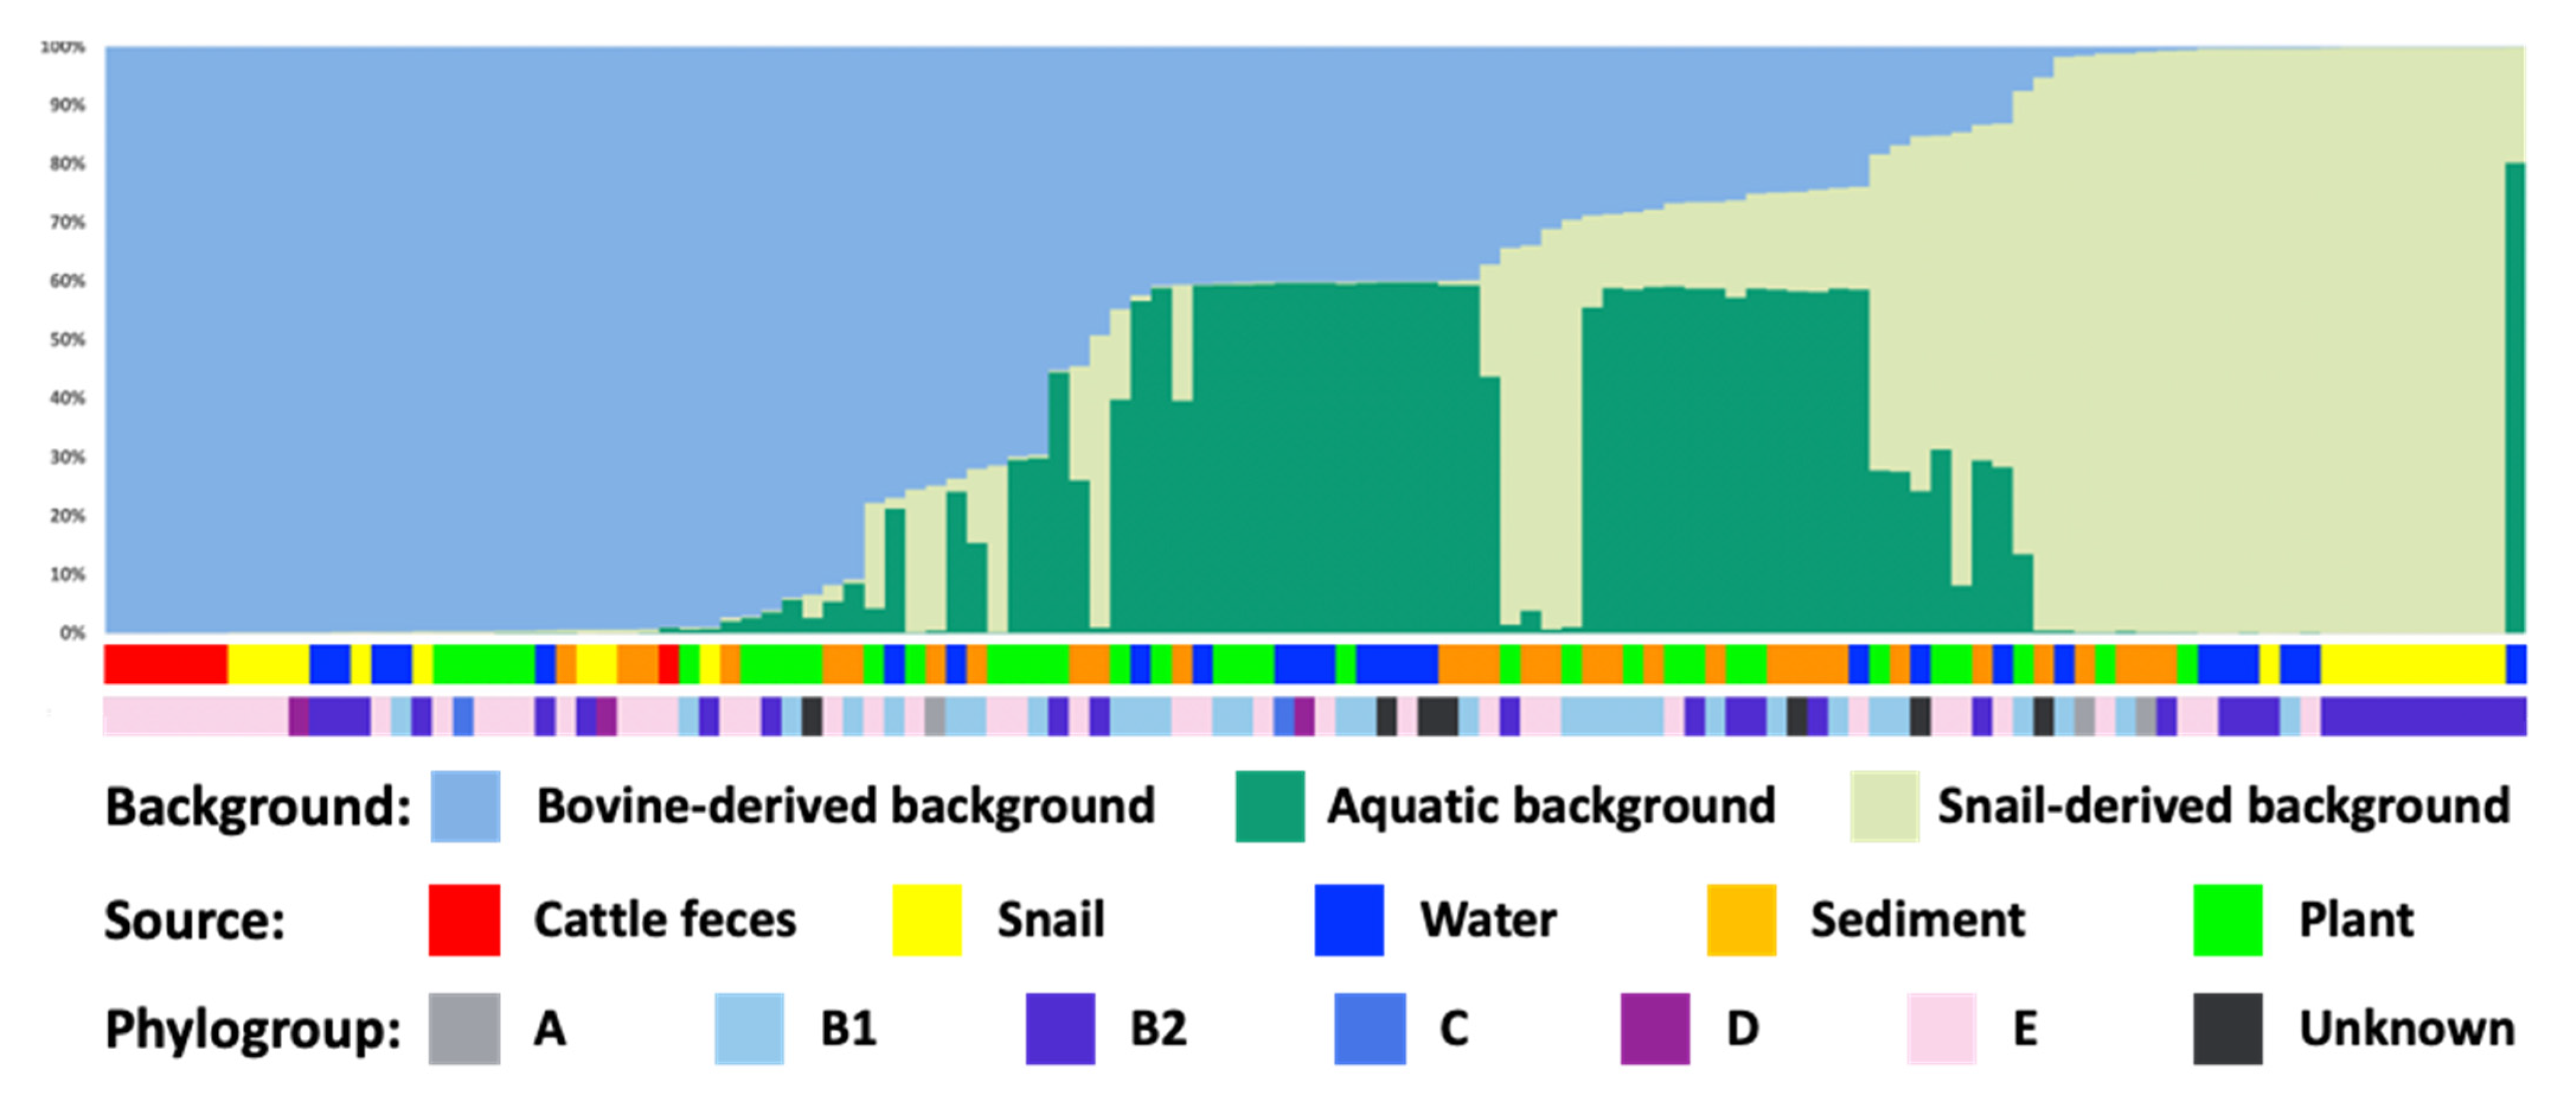
Figure 4.
Virulence gene distribution across isolates from the five sample types. The relatedness between virulence gene distribution profiles was determined by UPGMA using the constrained Jaccard coefficient.
Figure 4.
Virulence gene distribution across isolates from the five sample types. The relatedness between virulence gene distribution profiles was determined by UPGMA using the constrained Jaccard coefficient.
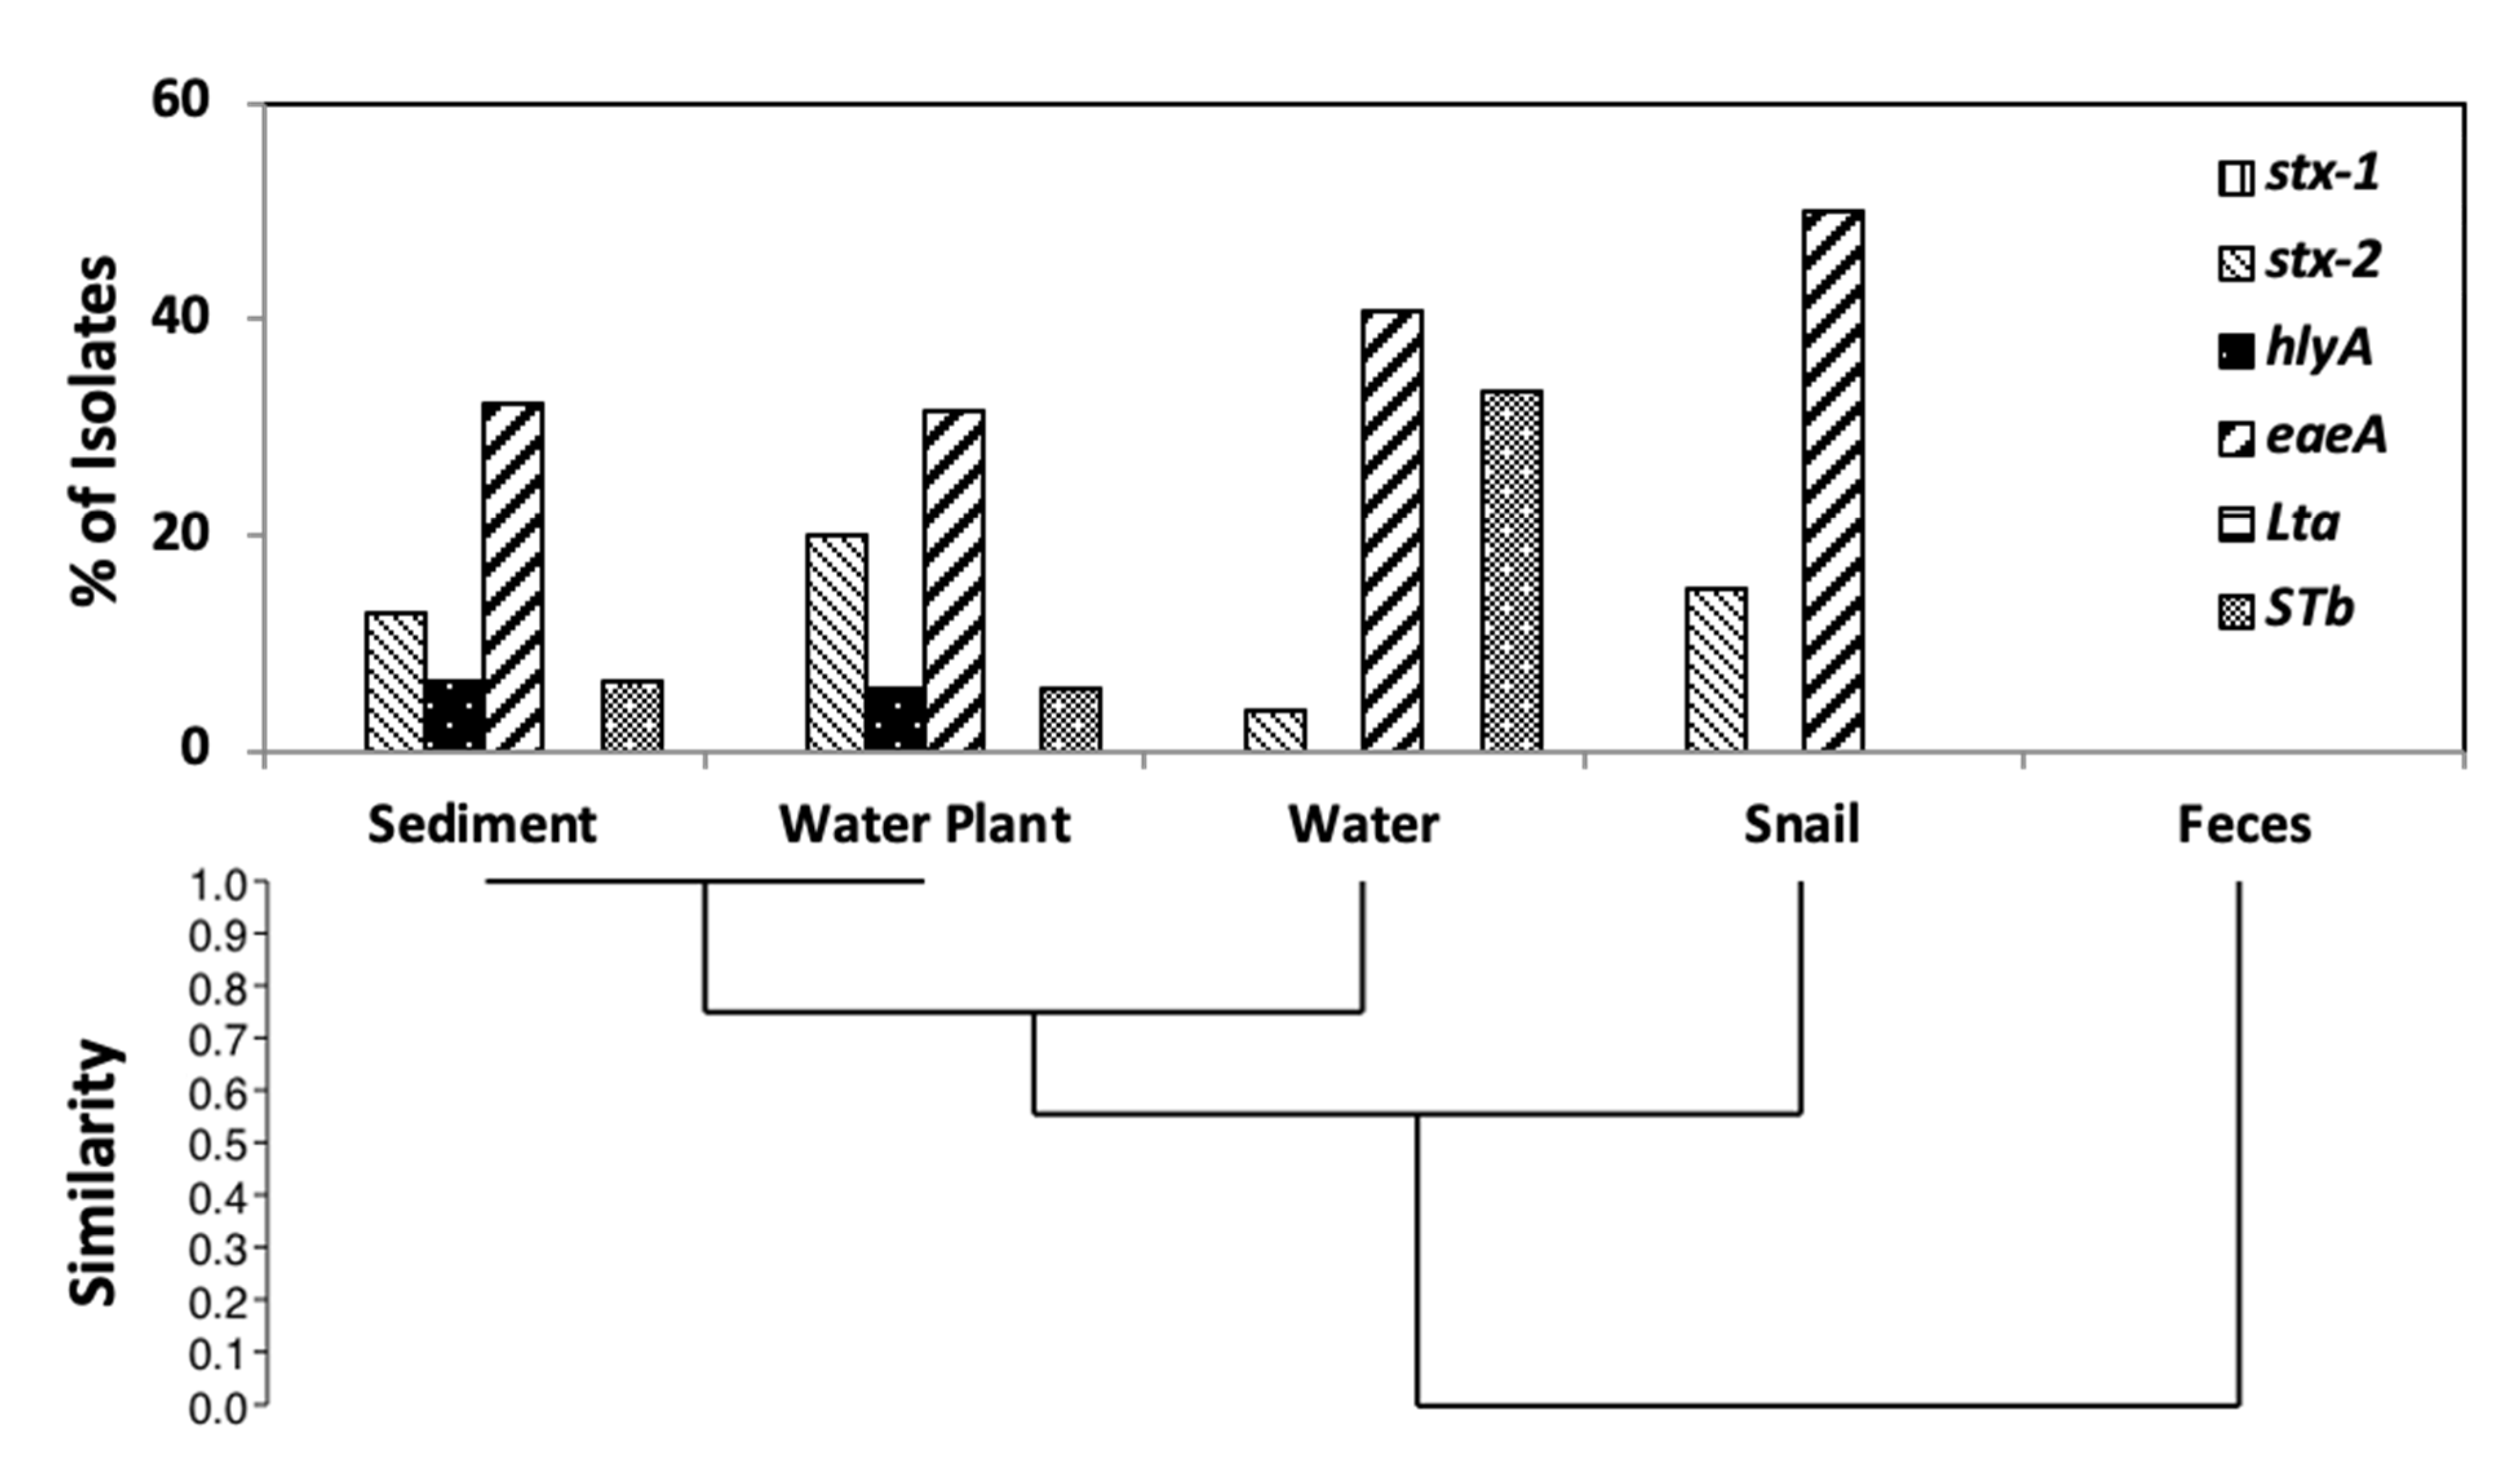
Figure 5.
Antibiotic resistance across isolates from the five sample types. The relatedness between resistance profiles was determined by UPGMA using the constrained Jaccard coefficient.
Figure 5.
Antibiotic resistance across isolates from the five sample types. The relatedness between resistance profiles was determined by UPGMA using the constrained Jaccard coefficient.
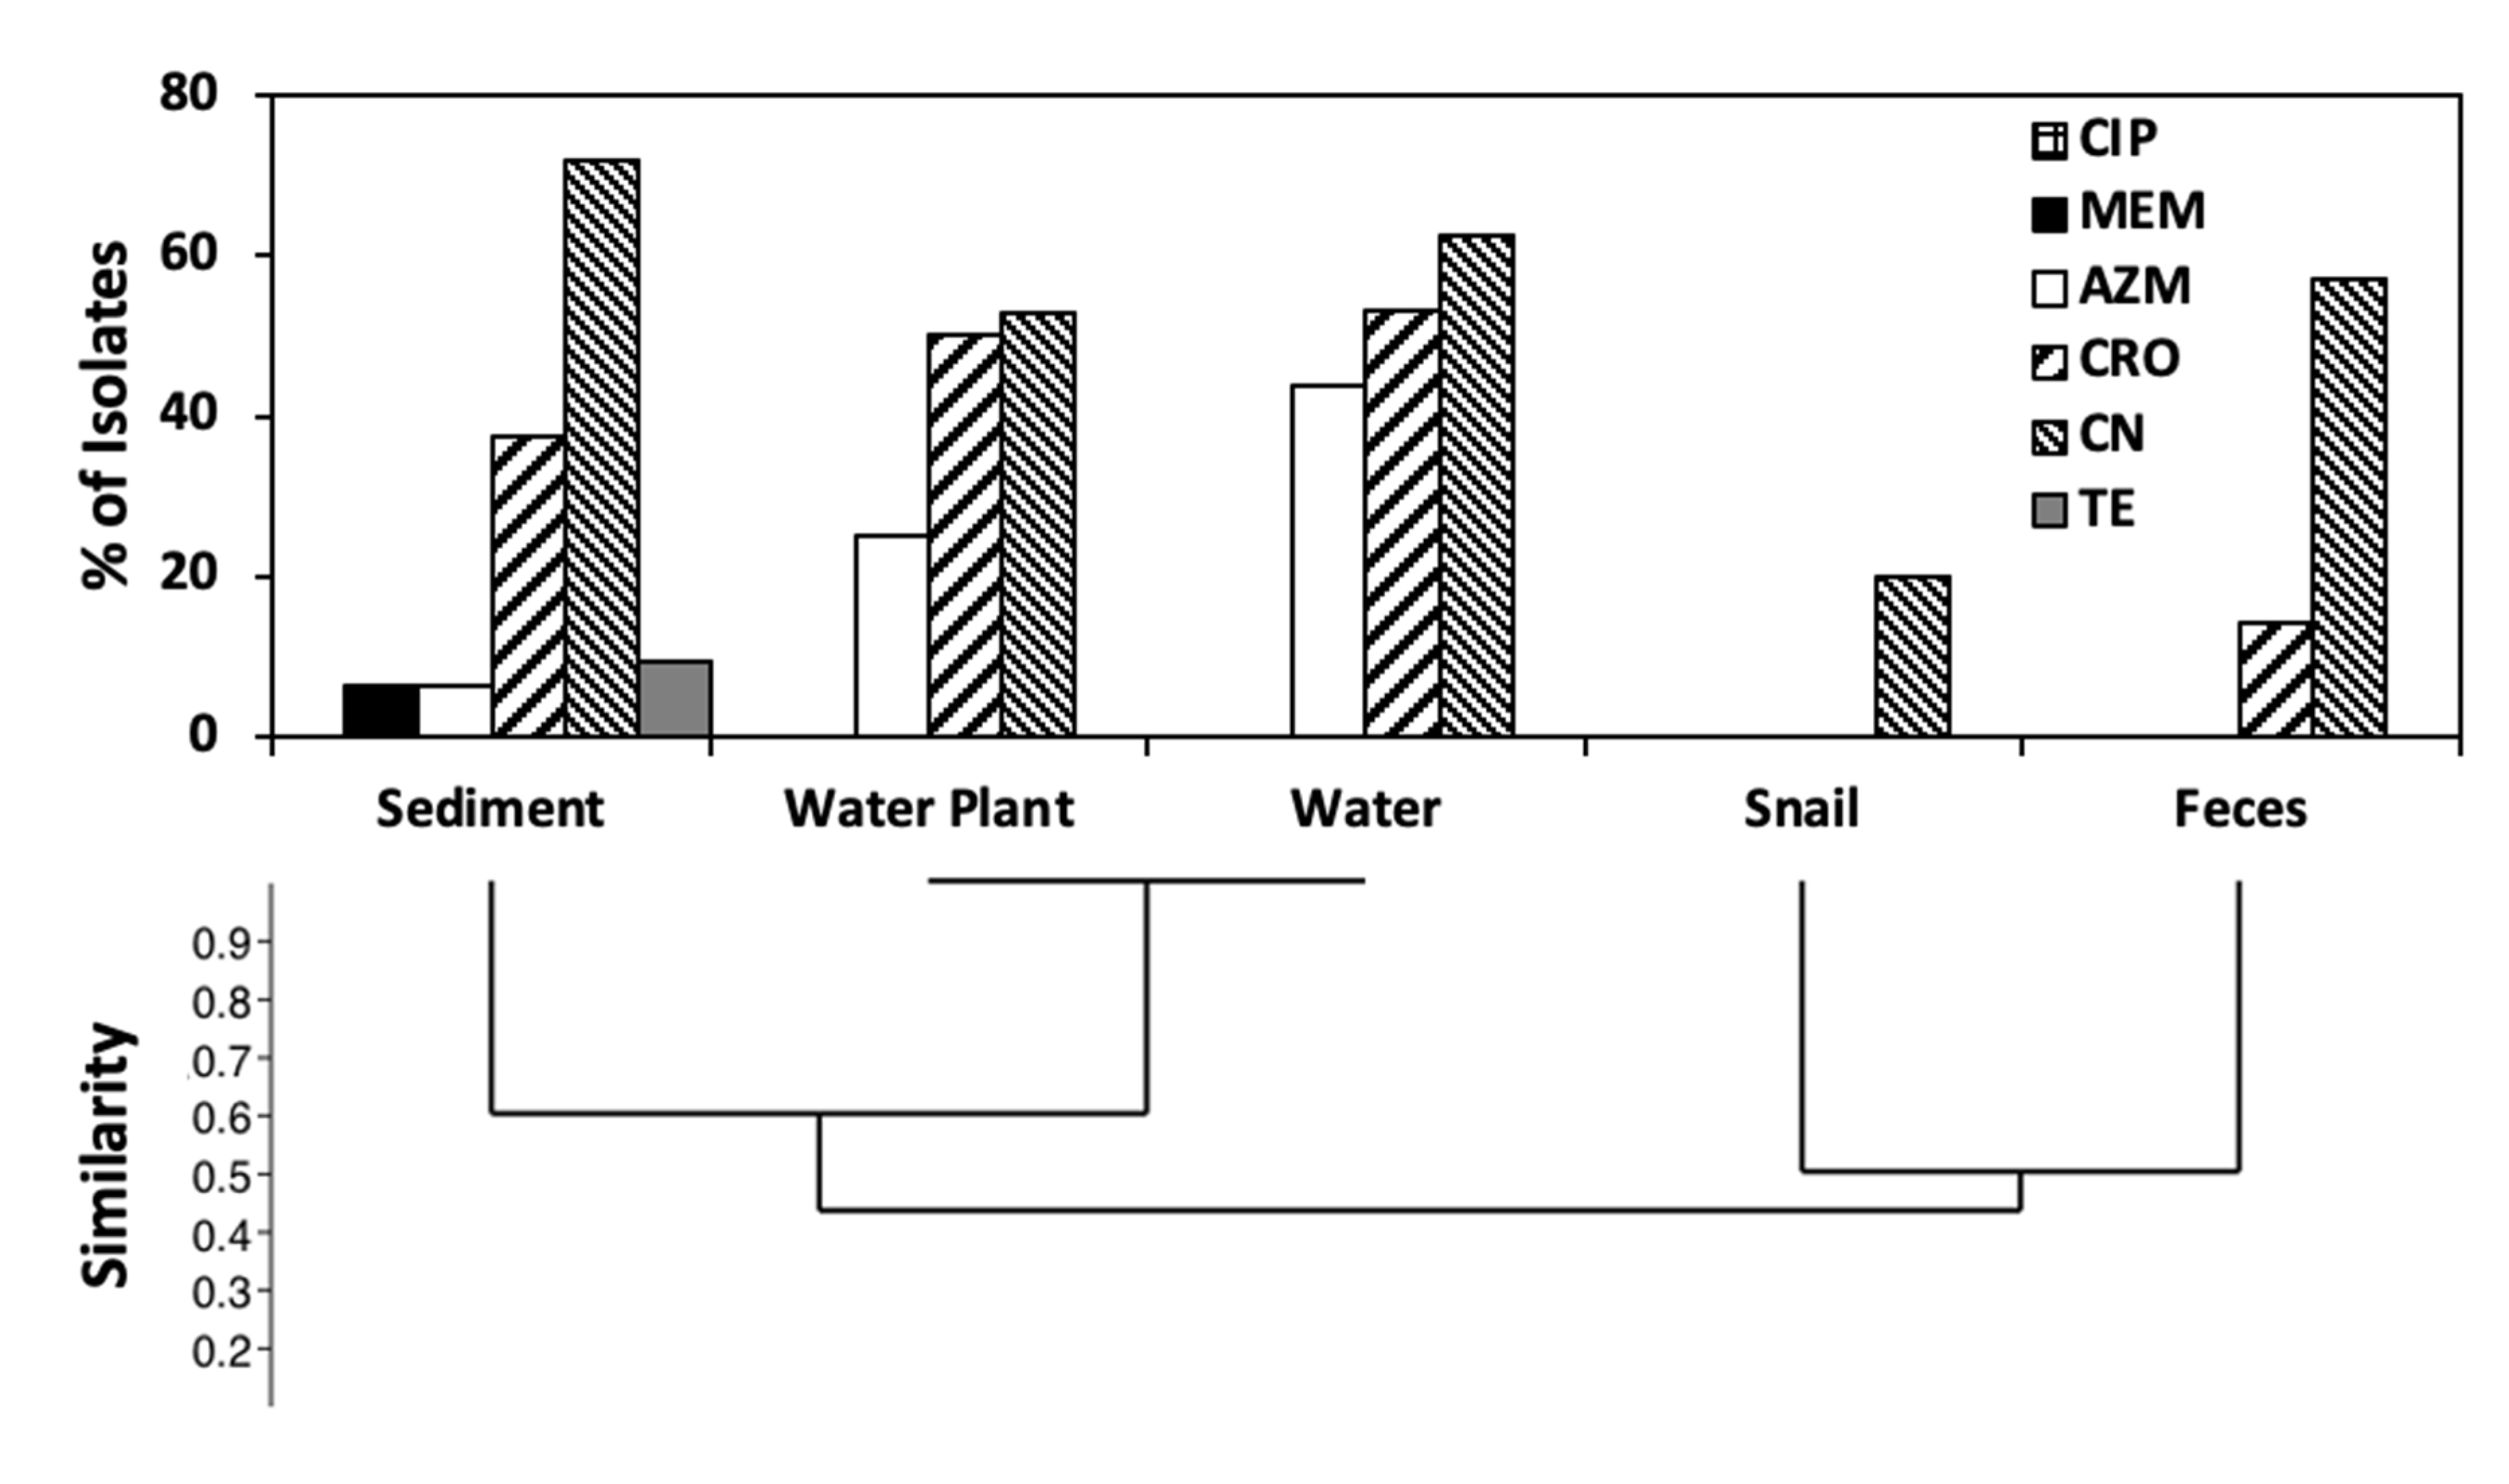
Figure 6.
Sensitivity and resistance to 0, 1, 2, or 3 antibiotics across sample types expressed as percentage, compared to occurrence of virulence genes.
Figure 6.
Sensitivity and resistance to 0, 1, 2, or 3 antibiotics across sample types expressed as percentage, compared to occurrence of virulence genes.
Publisher’s Note: MDPI stays neutral with regard to jurisdictional claims in published maps and institutional affiliations. |
© 2021 by the authors. Licensee MDPI, Basel, Switzerland. This article is an open access article distributed under the terms and conditions of the Creative Commons Attribution (CC BY) license (https://creativecommons.org/licenses/by/4.0/).
Share and Cite
MDPI and ACS Style
NandaKafle, G.; Huegen, T.; Potgieter, S.C.; Steenkamp, E.; Venter, S.N.; Brözel, V.S. Niche Preference of Escherichia coli in a Peri-Urban Pond Ecosystem. Life 2021, 11, 1020. https://doi.org/10.3390/life11101020
AMA Style
NandaKafle G, Huegen T, Potgieter SC, Steenkamp E, Venter SN, Brözel VS. Niche Preference of Escherichia coli in a Peri-Urban Pond Ecosystem. Life. 2021; 11(10):1020. https://doi.org/10.3390/life11101020
Chicago/Turabian StyleNandaKafle, Gitanjali, Taylor Huegen, Sarah C. Potgieter, Emma Steenkamp, Stephanus N. Venter, and Volker S. Brözel. 2021. "Niche Preference of Escherichia coli in a Peri-Urban Pond Ecosystem" Life 11, no. 10: 1020. https://doi.org/10.3390/life11101020
Note that from the first issue of 2016, this journal uses article numbers instead of page numbers. See further details here.