1. Introduction
Before the COVID-19 pandemic broke-out, the world had experienced a central-bank-fueled monetary stimulus, a fiscal stimulus, and low/zero interest rates for a number of years. In the USA, the Federal Reserve started its interest rate cuts in the autumn of 2007 (see data series,
Federal Reserve System 2022a), which could be taken as one possible starting point of this new policy era (these cuts continued until the near-zero rate level was achieved in early 2009). An alternative point for this new era was the decision to start quantitatively easing in the following autumn of 2008 (see data series,
Federal Reserve System 2022b). In the first wave, more than USD 1 trillion worth of debt was added to the Federal Reserve balance sheet, and this was before the year end of 2008 (total assets were around USD 2.2 trillion). Before Russia engaged in its military invasion of Ukraine in late February 2022, the Federal Reserve’s balance sheet was close to USD 9 trillion, and interest rates were at zero. Even if this development portrays that of the USA, other central banks around the world mimicked these monetary policies (e.g.,
Arouri et al. 2013) to stimulate the economies and help with continuous governmental budget deficits (especially in China, Japan, the European Union, and the UK). However, it could be said that the start of the COVID-19 era was some sort of final phase of loose monetary policy, where rapidly increasing prices, availability issues, and general inflation were visible in 2021 (
Sheffi 2021). In contrast to expectations, inflation’s steep continuation in 2022 made central banks turn their policies rapidly in the opposite direction (
Gharehgozli and Lee 2022). Of course, the Russian invasion of Ukraine played an important role, and not only on the availability of food or raw materials from these countries but also the implemented sanctions on both sides (Russia and the Western Bloc) rattled supply chains and economies (
Jagtap et al. 2022). This has of course resulted in further inflation growth and pressures (
Govindarajan et al. 2022). Together with physical product and monetary flow sanctions, logistics and transportation have been hurt due to the war in Europe (in the area surrounding the war zones and especially in the Black Sea) as well as the closed airspace of Russia and Europe for each other’s commercial flights, together with the questionable container-based railway connection down to China (
Stackpole 2022;
Ngoc et al. 2022).
For companies to operate in this new era after the global financial crisis (2008–2009), it was of course a challenge to manage in terms of supply chains and inventory holdings (e.g.,
Christopher and Holweg 2011;
Blome and Schoenherr 2011). After this sudden downwards development, the global economy was more or less stabilized; however, there were debt crises in the early years of the following decade in Europe. It was actually the case that the USA tried to get rid of loose Federal Reserve monetary policies in 2017–2018 by raising interest rates for the first time after the rate cut initiation of 2007; however, this action was short-lived. As COVID-19 started to spread around the world, interest rates were quickly taken to zero, and increasing debt in the central bank’s balance sheet again became the norm. Even if this trial of tightening was made, it did not have much of an effect on company operations and supply chains. Demand was somewhat softer in 2018–2019, but global supply chains functioned well, and prices were stable. Companies only needed to maximize their profits, and this was done often with expanding of sales and presence as well as with organic investments and mergers and acquisitions. However, supply chain difficulties started becoming serious already in the spring of 2020, when the first COVID-19 lockdowns were implemented around the world (
Handfield et al. 2020). In the following two years, these lockdowns, restrictions, and limiting of the ability of people freely move produced a variety of difficulties. Labor was more difficult to find with reasonable cost, demand emphasized physical products (as people stayed home), and people had an increasing amount of money to spend (due to less consumption through staying in a smaller area and within their home country, but also due to possibly receiving stimulus funds from the government). Due to lockdowns and restrictions, together with increasing product-based demand, global supply chains started to malfunction (e.g.,
Krolikowski and Naggert 2021;
Sheffi 2021). Sea freight rates increased around ten times higher from pre-pandemic lows (from 2019 to early 2020) to the worst time in 2021, its autumn (e.g., Freightos FBX index in containers, and Baltic Dry Index in bulk shipping; e.g.,
Rao and Saul 2021;
Investing.com 2022). Research has confirmed that these extreme price changes were tied to the pandemic time and its numerous restrictions and lockdowns (
Rožić et al. 2022;
Khan et al. 2022). Purchasing of components also became increasingly more costly, and availability concerns were high. In early 2022, it seemed that in some years’ time, supply chains could revert back to normal. However, the war in Ukraine changed everything, and the difficult situation persisted and became even worse. It could be said that in 2021–2022, companies eventually realized that low inventory days and just-in-time systems were not for operating in the environment they were facing. Buffering and safety stocks were needed (
Shih 2020;
Sheffi 2021;
Govindarajan et al. 2022). Moreover, more closer supply chain partners became suddenly valuable (
Shih 2020;
Stackpole 2022;
Free and Hecimovic 2021). All of the stated changes mentioned above provide the reason for this research work—to examine inventory management in the European Union’s country companies through descriptive analysis. In this research, the data arises from Finland. This research is novel in its examination approach as both quantitative and qualitative research approaches were employed, and we analyzed quarterly data from 2022 as the COVID-19 era was accompanied with war in the continent.
Currently, the situation in Europe is unique within the global inflation context as the European Union has greatly relied upon energy imports from Russia. As now this Russian trade is faced by sanctions from both trading sides, inflation in the very beginning accelerated in terms of producer prices. It is actually the case that average consumer price inflation (annual) in European Union countries is around 10% (August 2022;
Eurostat 2022a), while producer price index is somewhat below 38% (July 2022;
Eurostat 2022b). This is a rather unique setup as typically consumer inflation is higher in inflationary periods and producer or wholesale prices are more manageable (and demand slumps even become negative; see the Indian experience from 2006 to 2009 as introduced by
Nagaraju et al. 2016). Inflation in this time is rather a push type and arises from availability and pricing of purchased components and modules, but also is caused by volatile and increasing energy prices.
The interest of this research is to gain answers to the following research questions: (1) “How have inventory holdings developed in the recent years, especially in 2020–22?”, and (2) “What are the reasons for inventory increases based on quarterly reports of companies?” This research used both quantitative and qualitative data and analyzed a rather complex situation where it is difficult to have only one right answer (especially on reasons of inventory build-up, but also on the development of inventory investments based on size of companies). The contribution of this study is towards inventory management change due to the two major crises faced, as well as how companies have adopted to this new environment. It is already known how the COVID-19 pandemic changed supply chains and inventory management, but the effects of the extended crisis and the double crisis is yet unknown and it has not been widely analyzed.
The research manuscript is structured as follows: In
Section 2, we review the literature related to inventory and supply chain management, particularly in the environment experienced in the past years. The research methodology and environment follows in
Section 3. Inventory holdings of the selected Finnish publicly traded companies (retail and manufacturing) is analyzed in
Section 4. Content analysis of reasons for inventory build-up is provided in
Section 5. Research findings are discussed and concluded in
Section 6, and future research avenues are proposed.
2. Inventory’s Role in Times of Crises
In the 1990s and early 2000s, there was a major wave of offshoring and outsourcing of manufacturing to Asian and other low-cost countries from developed economies, such as those of the USA and Europe (e.g.,
Christopher et al. 2006;
Slepniov and Waehrens 2008). In the beginning, this was very beneficial in economic terms, and this activity only accelerated towards the 2010s. However, already before the trade war between the USA and China, there were research works about the “China plus one” strategy, suggesting that companies should source and establish to more than just China (
Zhang and Huang 2012). They should not be dependent only on one country in their supply chains. However, as Chinese manufacturing did develop so fast and was so advanced, it the case that the analyses stated that it is difficult to diversify completely from China as the country holds a significant competitive advantage both in terms of lead time and cost (
Zhang and Huang 2012). Thus, the “China plus one” strategy could be implemented, but under the surface it would be still greatly dependent on China. However, after the trade war period and the COVID-19 experience, companies have started onshore and backshore production at or closer to their main demand areas, such as Europe or North America (
Shih 2020;
Handfield et al. 2020;
Wiesmann et al. 2017). Overall, too high concentration in Asia (or China) is too risky now due to geopolitics, sudden increasing costs of shipping and transport, and increasing lead times of delivery. In the time of
Zhang and Huang’s (
2012) study, these now changed factors were in rather good control, but the COVID-19 era provided a lesson for companies in terms of how expensive Asian imports can become (and this has continued with Ukrainian conflict changes to supply chains). It could be concluded that supply chains and networks are more dispersed now and will be especially so in the future (the term “distributed manufacturing” is often used;
Purvis et al. 2021). This will lead to higher inventory carrying as companies do not operate with a highly centralized structure any longer. It is debatable whether this new strategy is bringing great financial rewards; on the basis of the large-scale and longitudinal research of
Capkun et al. (
2009), it was found that inventories, and lower amounts of them (as scaled to sales), are driving financial performance. Especially important in
Capkun et al.’s (
2009) study was raw material inventory performance. In a dispersed supply chain environment with numerous manufacturing locations, raw materials and purchase inventories will inevitably increase. Longer distance also increases inventory investments (
Jain et al. 2014). However, in the previous decade, we saw evidence of lower inventory efficiencies, and these trends have not reversed, having taken place simultaneously with quantitative easing programs of Central Banks with a low interest rate emphasis (empirical evidence, see
Hilmola et al. 2021; macro-economic justification, see
Huang 2016). Research works from the recent decade support these arguments further, as in empirical studies it has been found that inventory efficiency is not a significant driver of profitability as it was argued to be before, and sometimes there is not any connection at all (
Elsayed and Wahba 2016;
Kwak 2019). However, excessive inventory holdings are risky and could cause sudden decline in orders and demand of supply chain if their own demand falters (
Zotteri 2013). This is especially true in international supply chains due to the earlier described changes and long delays.
On the basis of inventory management theory and economic order quantity foundation, there were numerous factors that increased inventories in the prolonged COVID-19 pandemic. First of all, longer lead times will result in earlier ordering and/or building larger safety stock inventories (buffers). As shipping becomes more costly, it is important to have the highest possible fill-rates in containers (e.g.,
Salam and Khan 2016)—this also encourages excessive ordering. If actors are witnessing price inflation in sold items or have indications from this (e.g.,
Mehra and Amini 1994;
Jaggi et al. 2016), it is logical to make larger orders as own profitability will possibly become better (lower purchase price and higher future sales price). It is also said that availability became a problem already during the COVID-19 pandemic and has increased in some items due to the Ukrainian conflict (such as with food, metals, iron, gas, and some other raw materials), and eventually this will lead to higher inventory holdings (as companies build inventory buffers to hedge against a very uncertain future). Of course, it is the case that there is not a large enough inventory that could tackle through the entire crisis time, but it could be said that numerous factors have led companies to hold higher inventories (balancing between two: low inventory system, and inefficient large inventory investments; see
Free and Hecimovic 2021). For example, Toyota was doing well in 2021 as it had excessive inventories of semiconductors, which were learning points of the Japanese earthquake, tsunami, and subsequent nuclear accident of 2011 (
Sheffi 2021;
Oi 2022). However, even well-prepared excessive holdings of strategic components were not enough, and in the autumn of 2021, the company was forced to close production lines (
Oi 2022). Despite these undesired shutdowns, Toyota was able to turn itself into the largest car manufacturer in 2021 and widened its margin to that of Volkswagen (
Kelly and Shiraki 2022). As
Elsayed and Wahba (
2016) argued, one function of inventory is to avoid customer stock-outs and generate sales, as well as protect market share. It is also the case that among vehicle manufacturers, variation in inventory performance is rather significant (as compared to other industries; see Kwak 2019).
3. Research Methodology and Environment
To obtain accurate and up-to-date information concerning companies of trade and manufacturing in Finland, publicly traded companies were selected as the target population. Overall, in the time period of 2008–2022, there were 56 companies identified; however, this was the total count of different companies in all years analyzed. It should be remembered that publicly traded companies could be acquired by other parties, they could be merged, and also bankruptcy is an option, and in addition, new listings in terms of initial public offerings (IPOs) could add new entrants. Apart from bankruptcy, this sample contains companies in all of these events. In the first observation year, the analysis sample contained 46 companies, wherein the last analysis year 2022 contained 52. The maximum number of companies (55) were recorded during the years 2017–2020. The sudden decline in the number of companies at the end of the observation period could be explained with three foreign led acquisitions of Finnish companies and one larger merger between two publicly traded companies (one company also entered the dataset due to a initial public offering). All data were gathered by hand through annual reports and they were cross-checked as well as used in other research works earlier. Companies entering the dataset through the IPO expanded amount of companies somewhat. New entrants were included with accounting data from the period, being provided by companies at their investors’ webpages. In many cases, it meant that accounting data were available from a year or two earlier than the actual IPO was completed. From the earlier studies of
Hilmola (
2022) and
Hilmola et al. (
2021), this sample differed in a way that it included more consumer-based businesses, smaller companies, and manufacturers that were not earlier accounted (they could be classified to other branches as they have distribution and retail in their portfolio, such as with pharmaceuticals). Details of companies included in this study and years of presence can be accessed from
Appendix A.
In the following, we used four different indicators of inventory development, and they were average, median, and quartiles (lower and upper). This was used to analyze the entire dataset properly as single or dual indicators could lead to biases (such as using only the average). As revenue development is such an important part of inventory management decisions,
Figure 1 was produced to illustrate the environment where companies were operating in the time of this study. It is clear that the Global Financial Crisis (GFC) caused difficulties for all sizes of companies in 2009–2010, and recovery was clearly present in 2011. However, the following European debt crisis again caused low growth and decline of revenues in the following years. During 2015, the situation took some time to recover. However, development was moderate in the following years, and 2019 as well as 2020 were troublesome for companies. COVID-19 recovery and growth of retail and manufacturing was strong in 2021, and on the basis of six months worth of data of 2022, seemed to be the case in 2022 (although real growth is lower due to such high inflation, especially in 2022). It should be noted that if a dataset concerning revenue would be indexed, it would be so that development in the observed time period would have been moved sideways without that much growth (if the first half of the year was used as a forecast for 2022, then in the last observation year of this study, the average revenue was slightly higher than in 2008—however, this was well below for the entire earlier decade; do note that this concerns revenue in nominal terms, not inflation adjusted). In the sample, only smaller companies showed growth abilities (lower quartile was roughly 50% higher in 2022 as compared to 2008; here, the substantial part of this growth took place in 2021–2022). There are explanations for this: for example, Nokia’s struggle and eventual divestment of the mobile phone business, and the restructuring of forest industry companies (which earlier concentrated much more on paper production, but in this time period, they were diversified into different products, such as packaging, tissues, and pulp).
This research work also contained content analysis of quarterly reports from the end of 2021 and out of two quarters in 2022. This analysis was produced by reading, examining, and searching keywords out of these reports. All relevant text was stored in a database where it was classified as belonging from one to six different themes identified (analysis was conducted on a company basis). As texts in quarterly reports often have high similarity to earlier ones, classifications were often rather similar in companies throughout the time period. However, some differences could have, for example, occurred from the effects of Russian sanctions or price increases. Classification was occasionally a rather difficult task as companies used different words out of the same situations faced. Therefore, in the research, it was decided that reasons for inventory build-up could be numerous, and in the analysis, it was used with small tolerance to add more reasons for the company itself. Framework classification themes were named on the basis of COVID-19 literature findings and the examination of company reports (e.g.,
Krolikowski and Naggert 2021;
Sheffi 2021;
Handfield et al. 2020;
Free and Hecimovic 2021).
4. Empirical Data Analysis: Inventory Holdings in Finnish Publicly Traded Companies
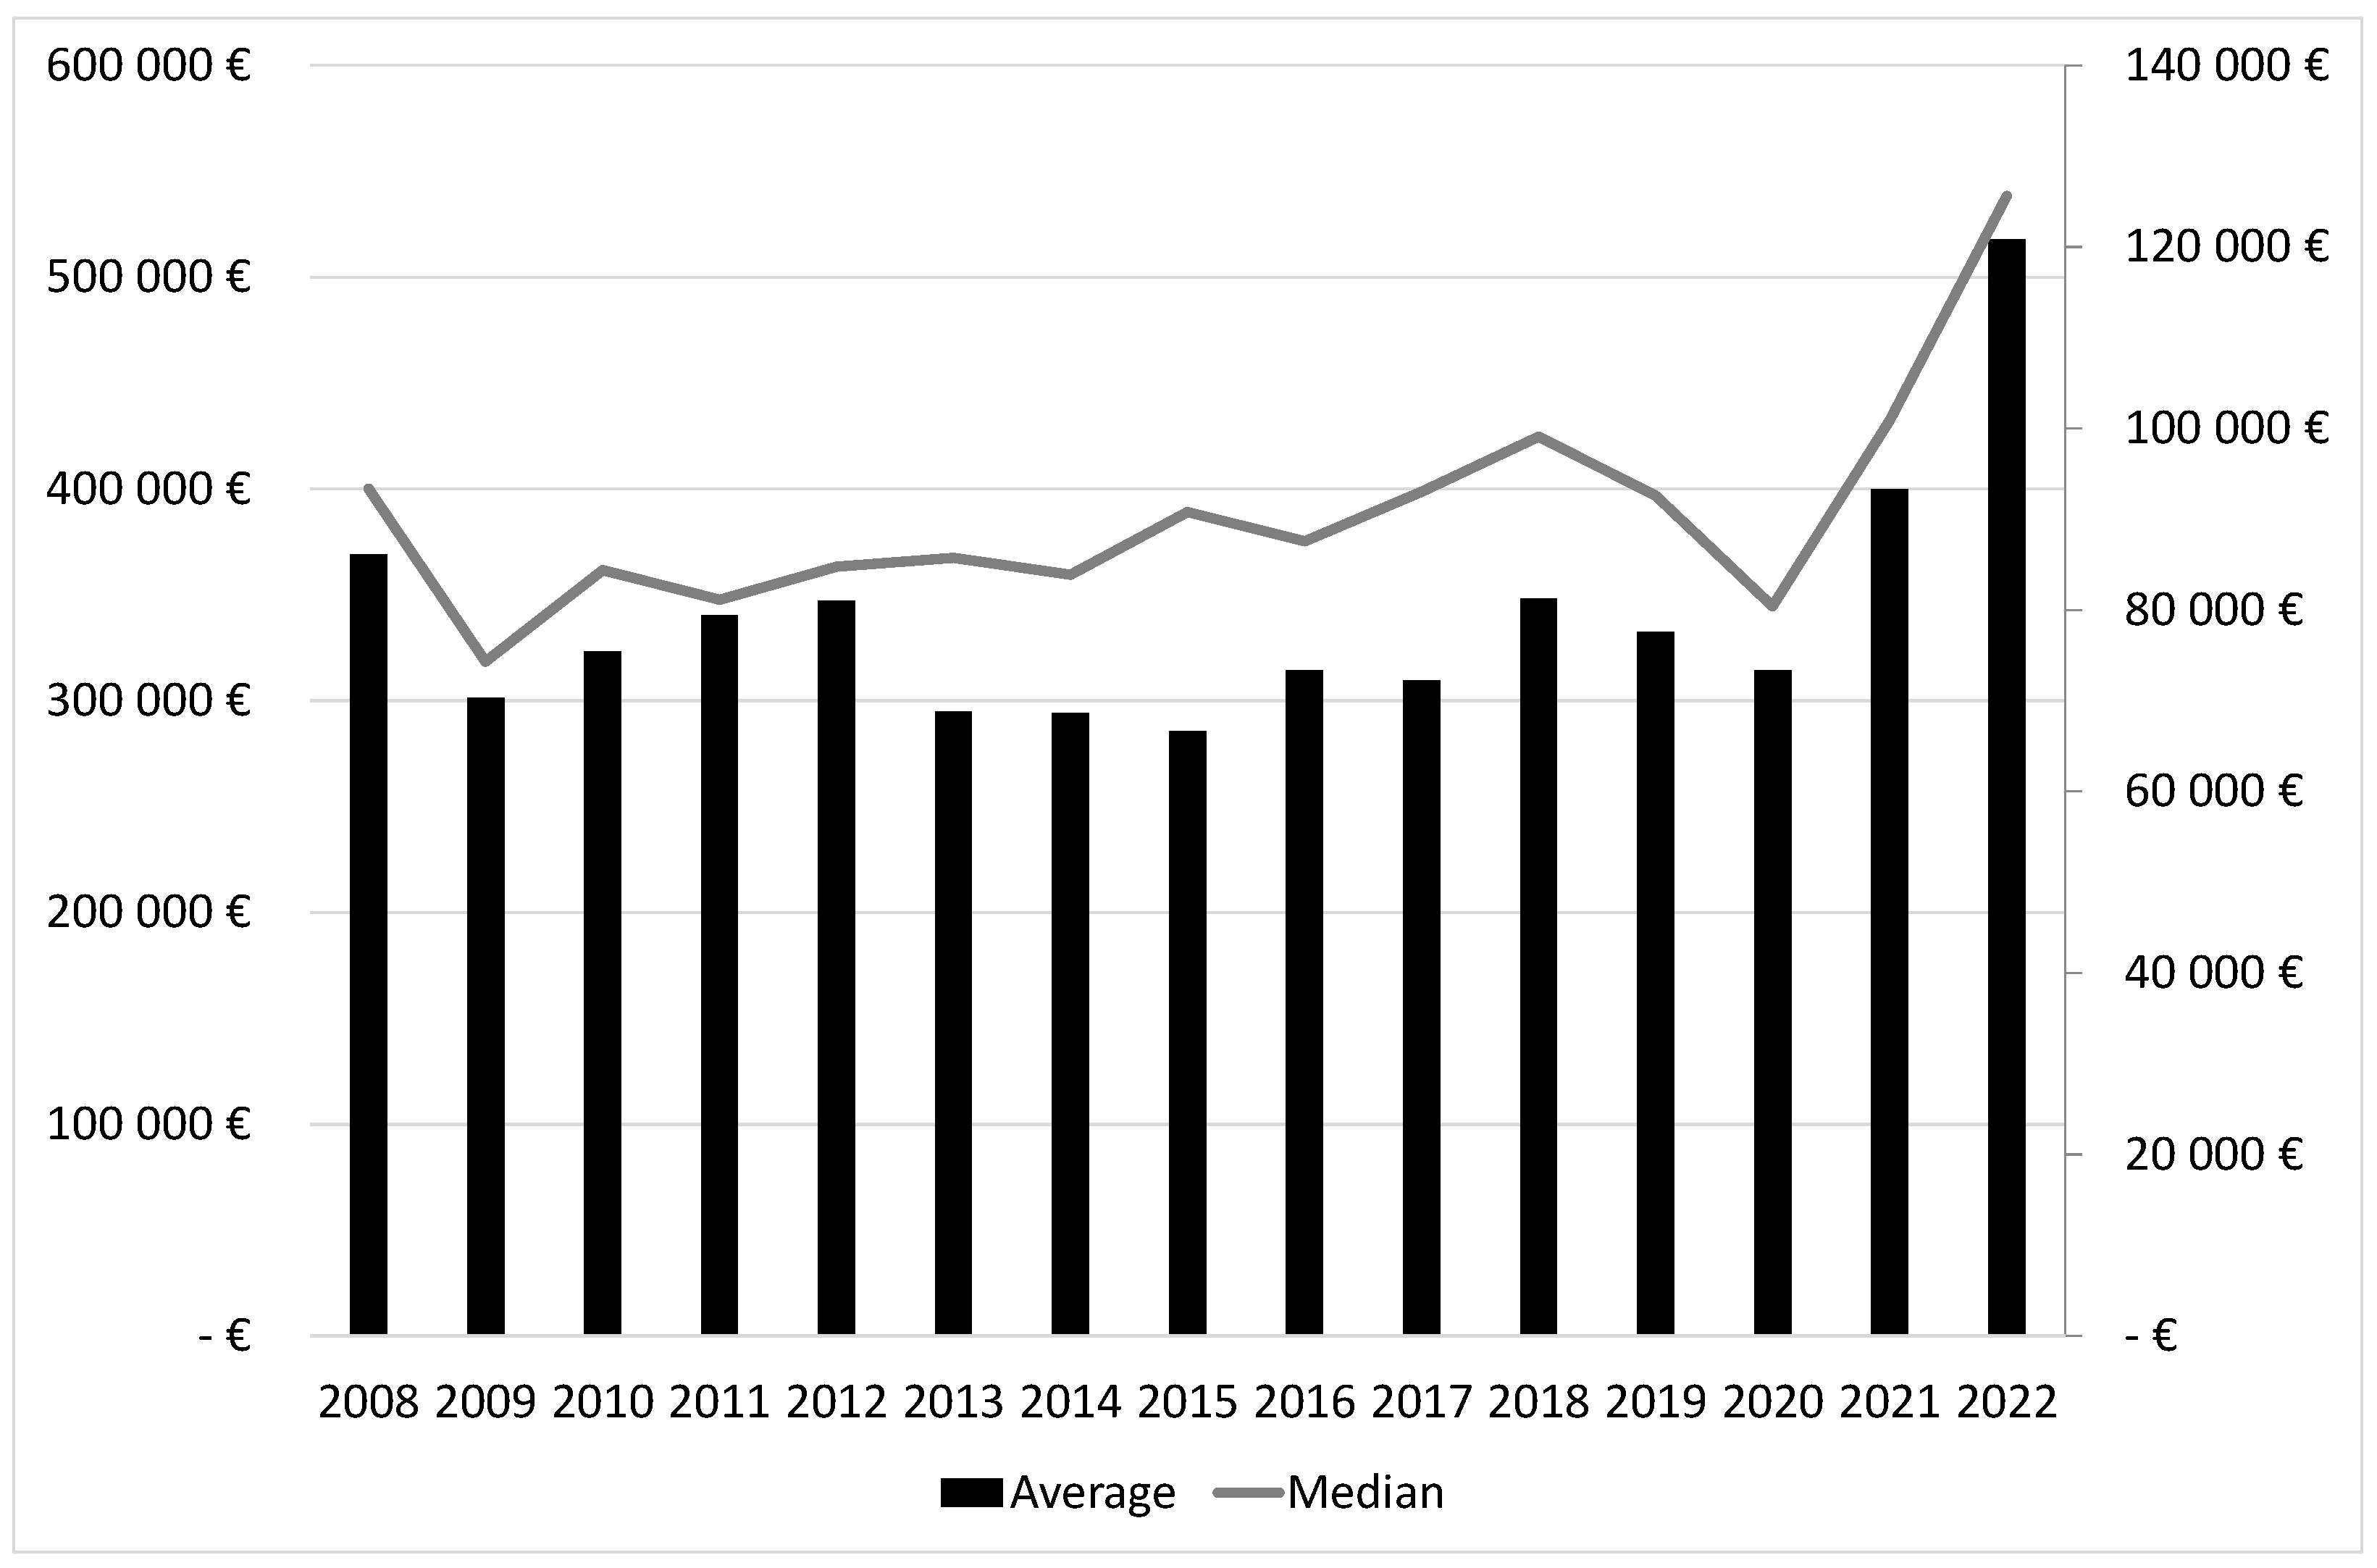
In terms of examining inventory investment in Finnish publicly traded companies within retail and manufacturing, it could be detected that on average, inventories did not change that much until 2021 (see
Figure 2). It was of course the case that in the year 2008, inventories were at somewhat of a higher level, but corrected themselves in the GFC year 2009. After this, inventories increased for some years, until 2013. Decline in this occasion was accountable in an average curve to Nokia, which sold its handset business. Inventory holdings of Nokia also declined substantially due to this. However, inventory investments started to recover again in 2015, and this continued until 2018, while in 2019 and 2020, they slightly declined (roughly 10% from the average value was lost in 2018–2020). What is notable is that in terms of the rather consistent and significant growth of inventories in 2021 and 2022, from year 2020, they grew by 65% to 2022 (first half). The highest average amount of inventory holdings shown in
Figure 2 is clearly the year 2022.
In median terms, inventory holdings were much more consistent throughout the observation period. The starting years of 2008–2009 of course showed their fluctuations up and down; however, thereafter, inventories increased rather continuously until the COVID-19 outbreak year of 2020. The decline in this outbreak year within median terms was moderate at −13.2%. Growth started in 2021, and in 2022, median terms showed a similar jump as was observed in average terms, and inventory holdings grew from 2020 to 2022 by 56%. The highest amount of inventory holdings in median terms was also within observation period year of 2022.
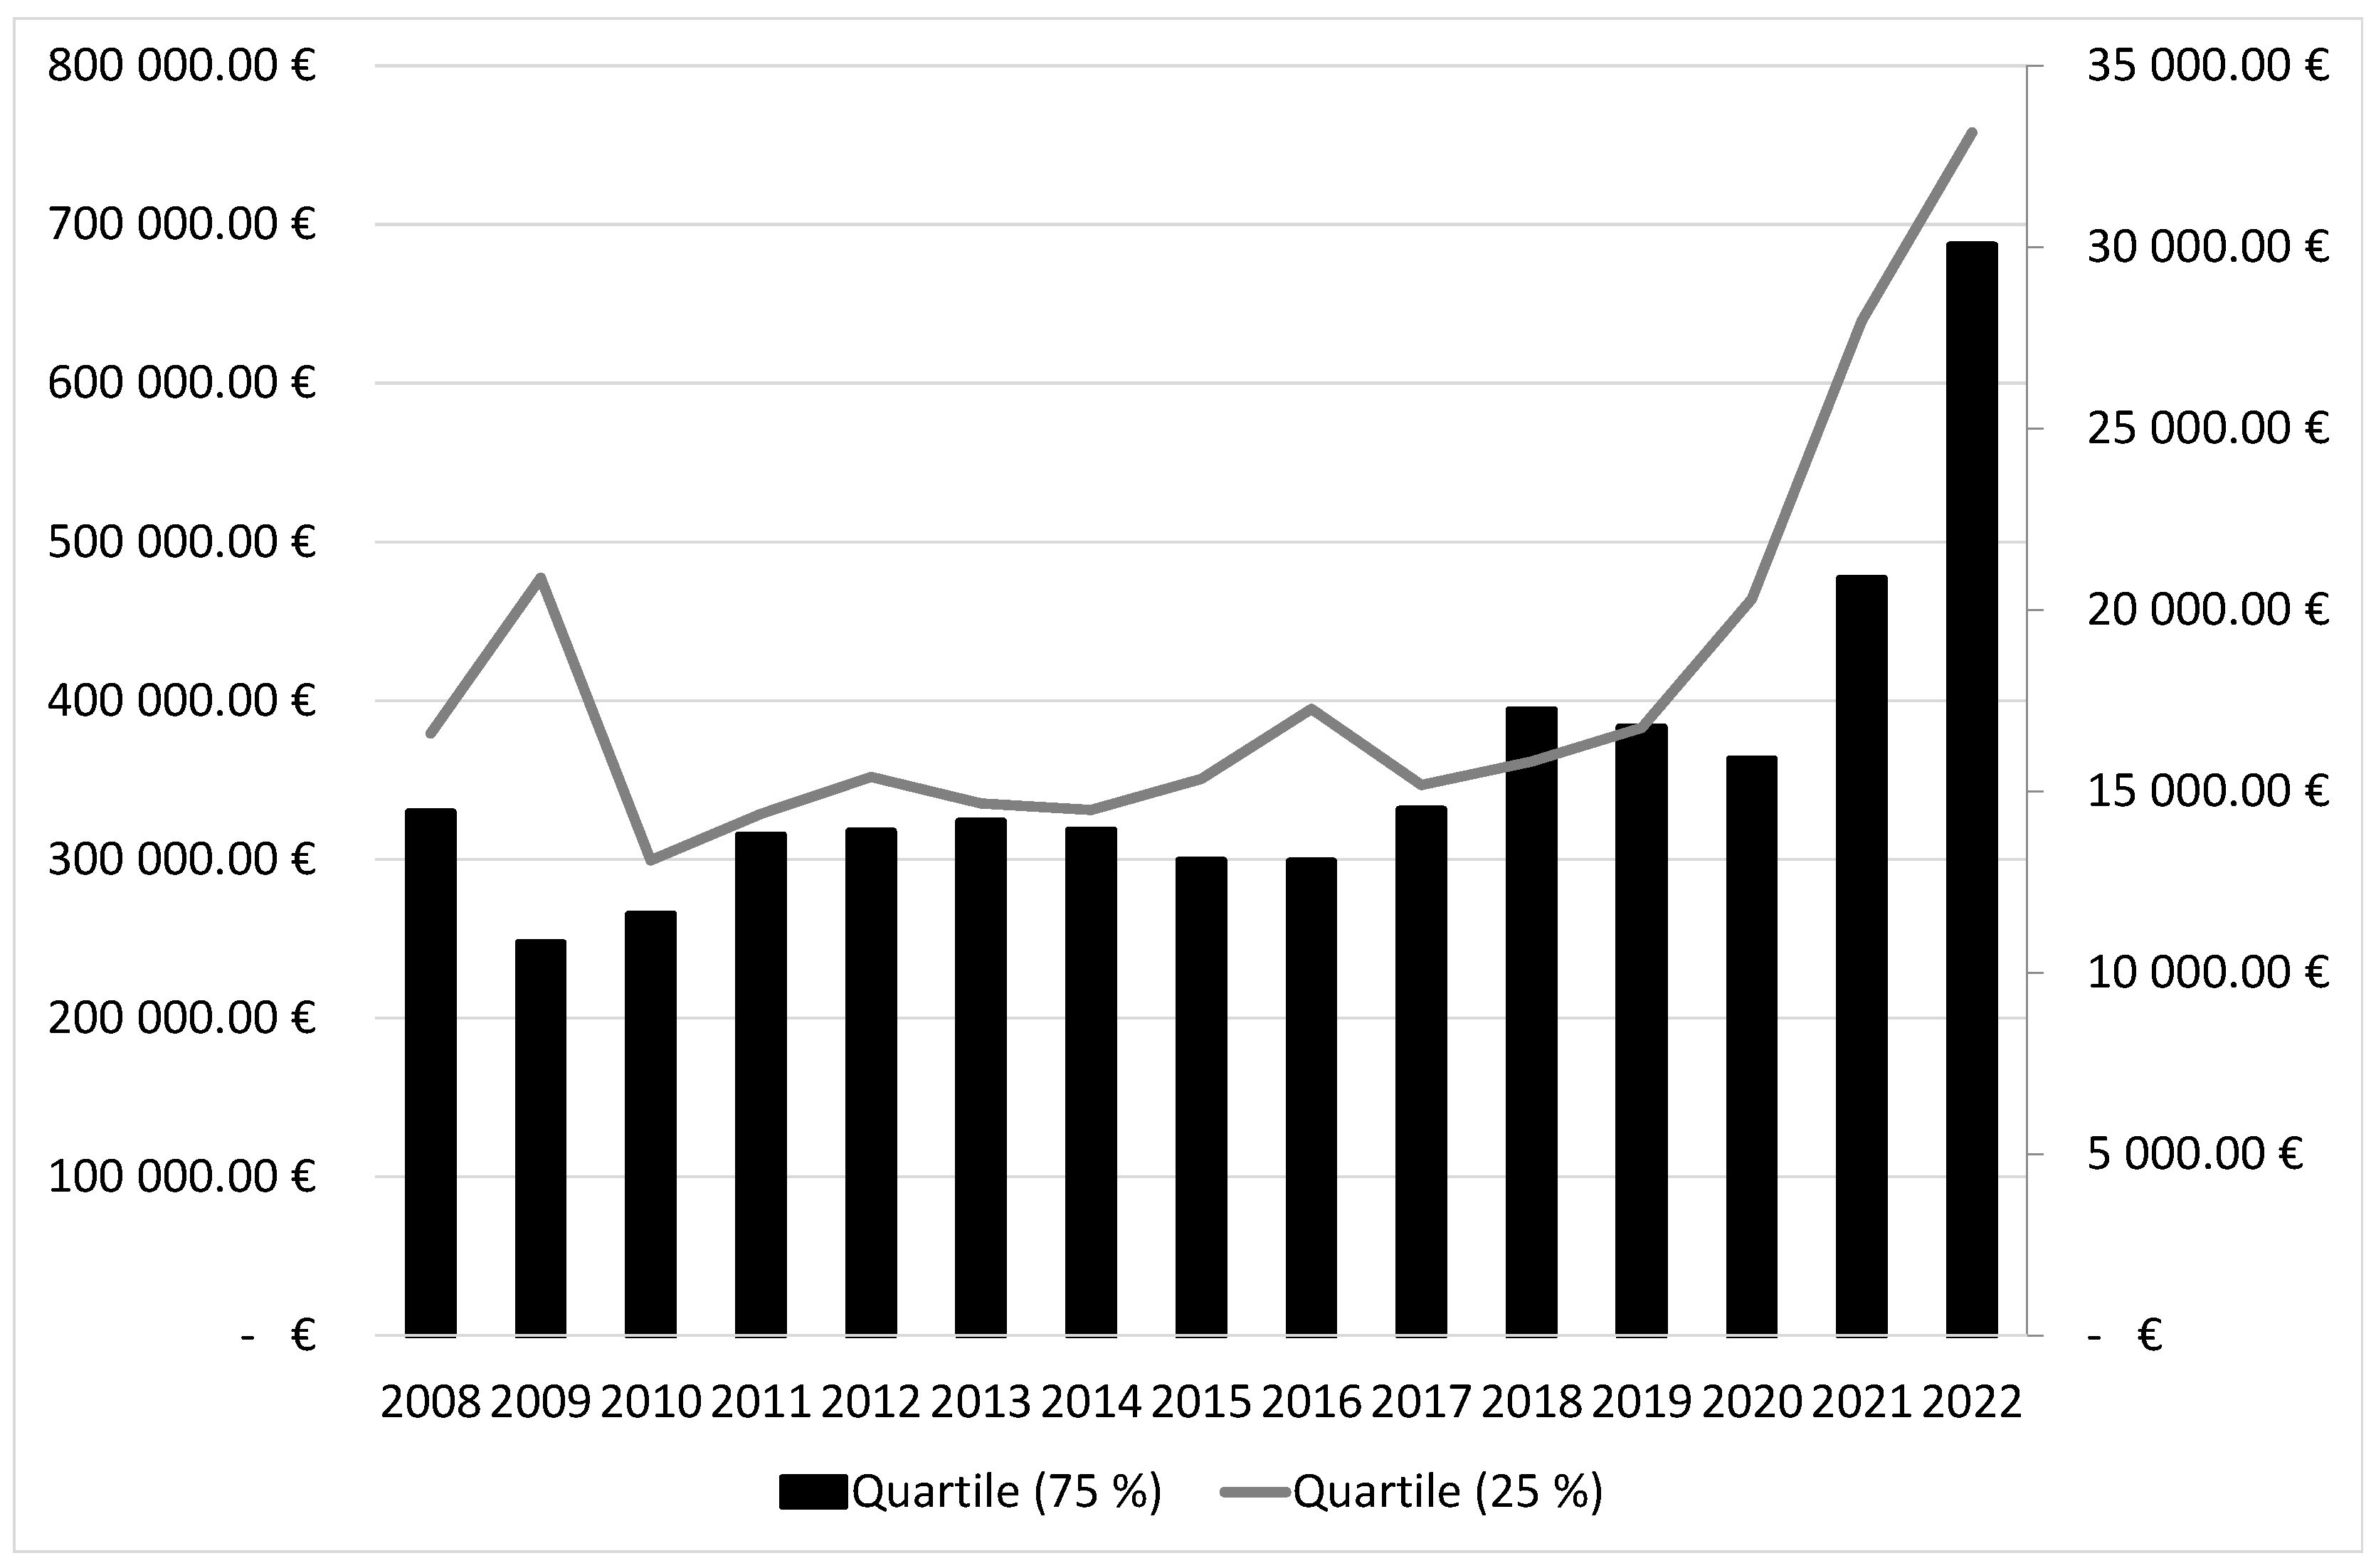
Upper (75%) and lower (25%) quartile curves also illustrate consistency in inventory investment growth (
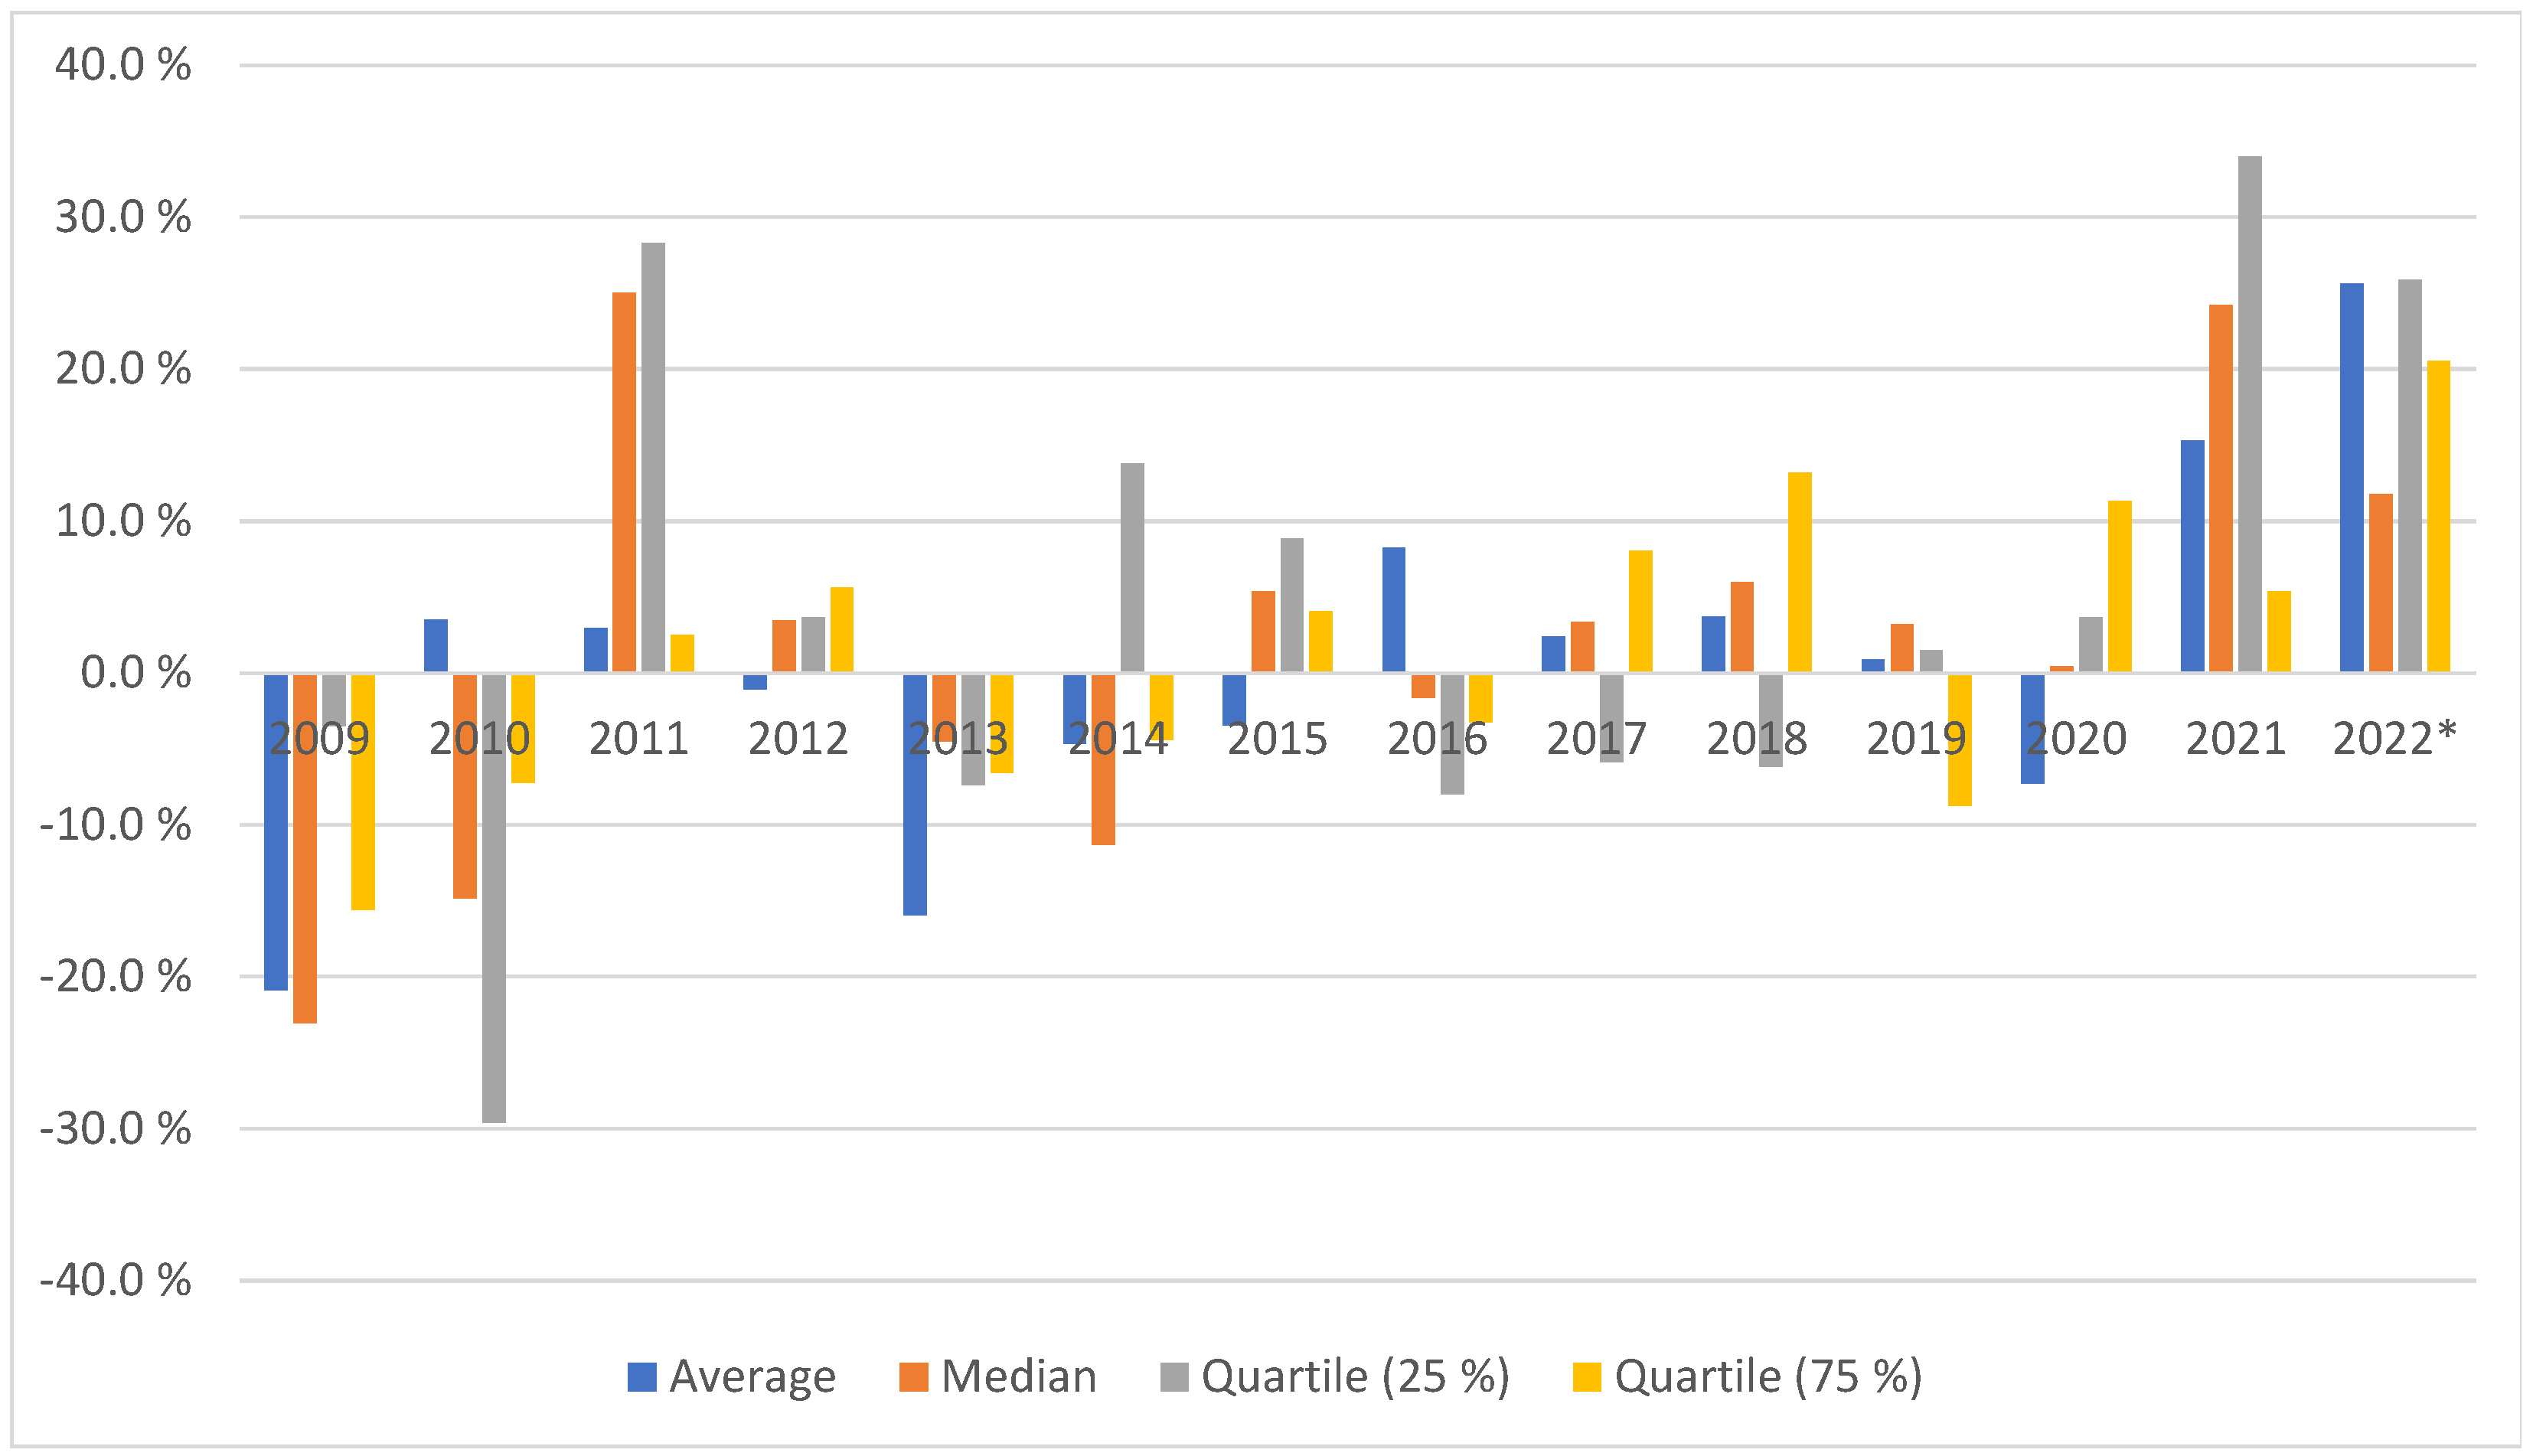
Figure 3), as did the median and average numbers. Apart from the changes of 2008–2009, growth in inventory investments seem to be continuous, and in the year 2020, there was a rather minor decline in the upper quartile (−5.3 decline in 2020 from 2019), while the lower quartile still continued to grow (21.2% growth in 2020 from 2019). Growth was substantial in both the years 2021 and 2022. The lower quartile growth (63% growth from 2020 to 2022) was similar to the average and median values; however, the upper quartile showed a much more significant change, with a growth of 89%.
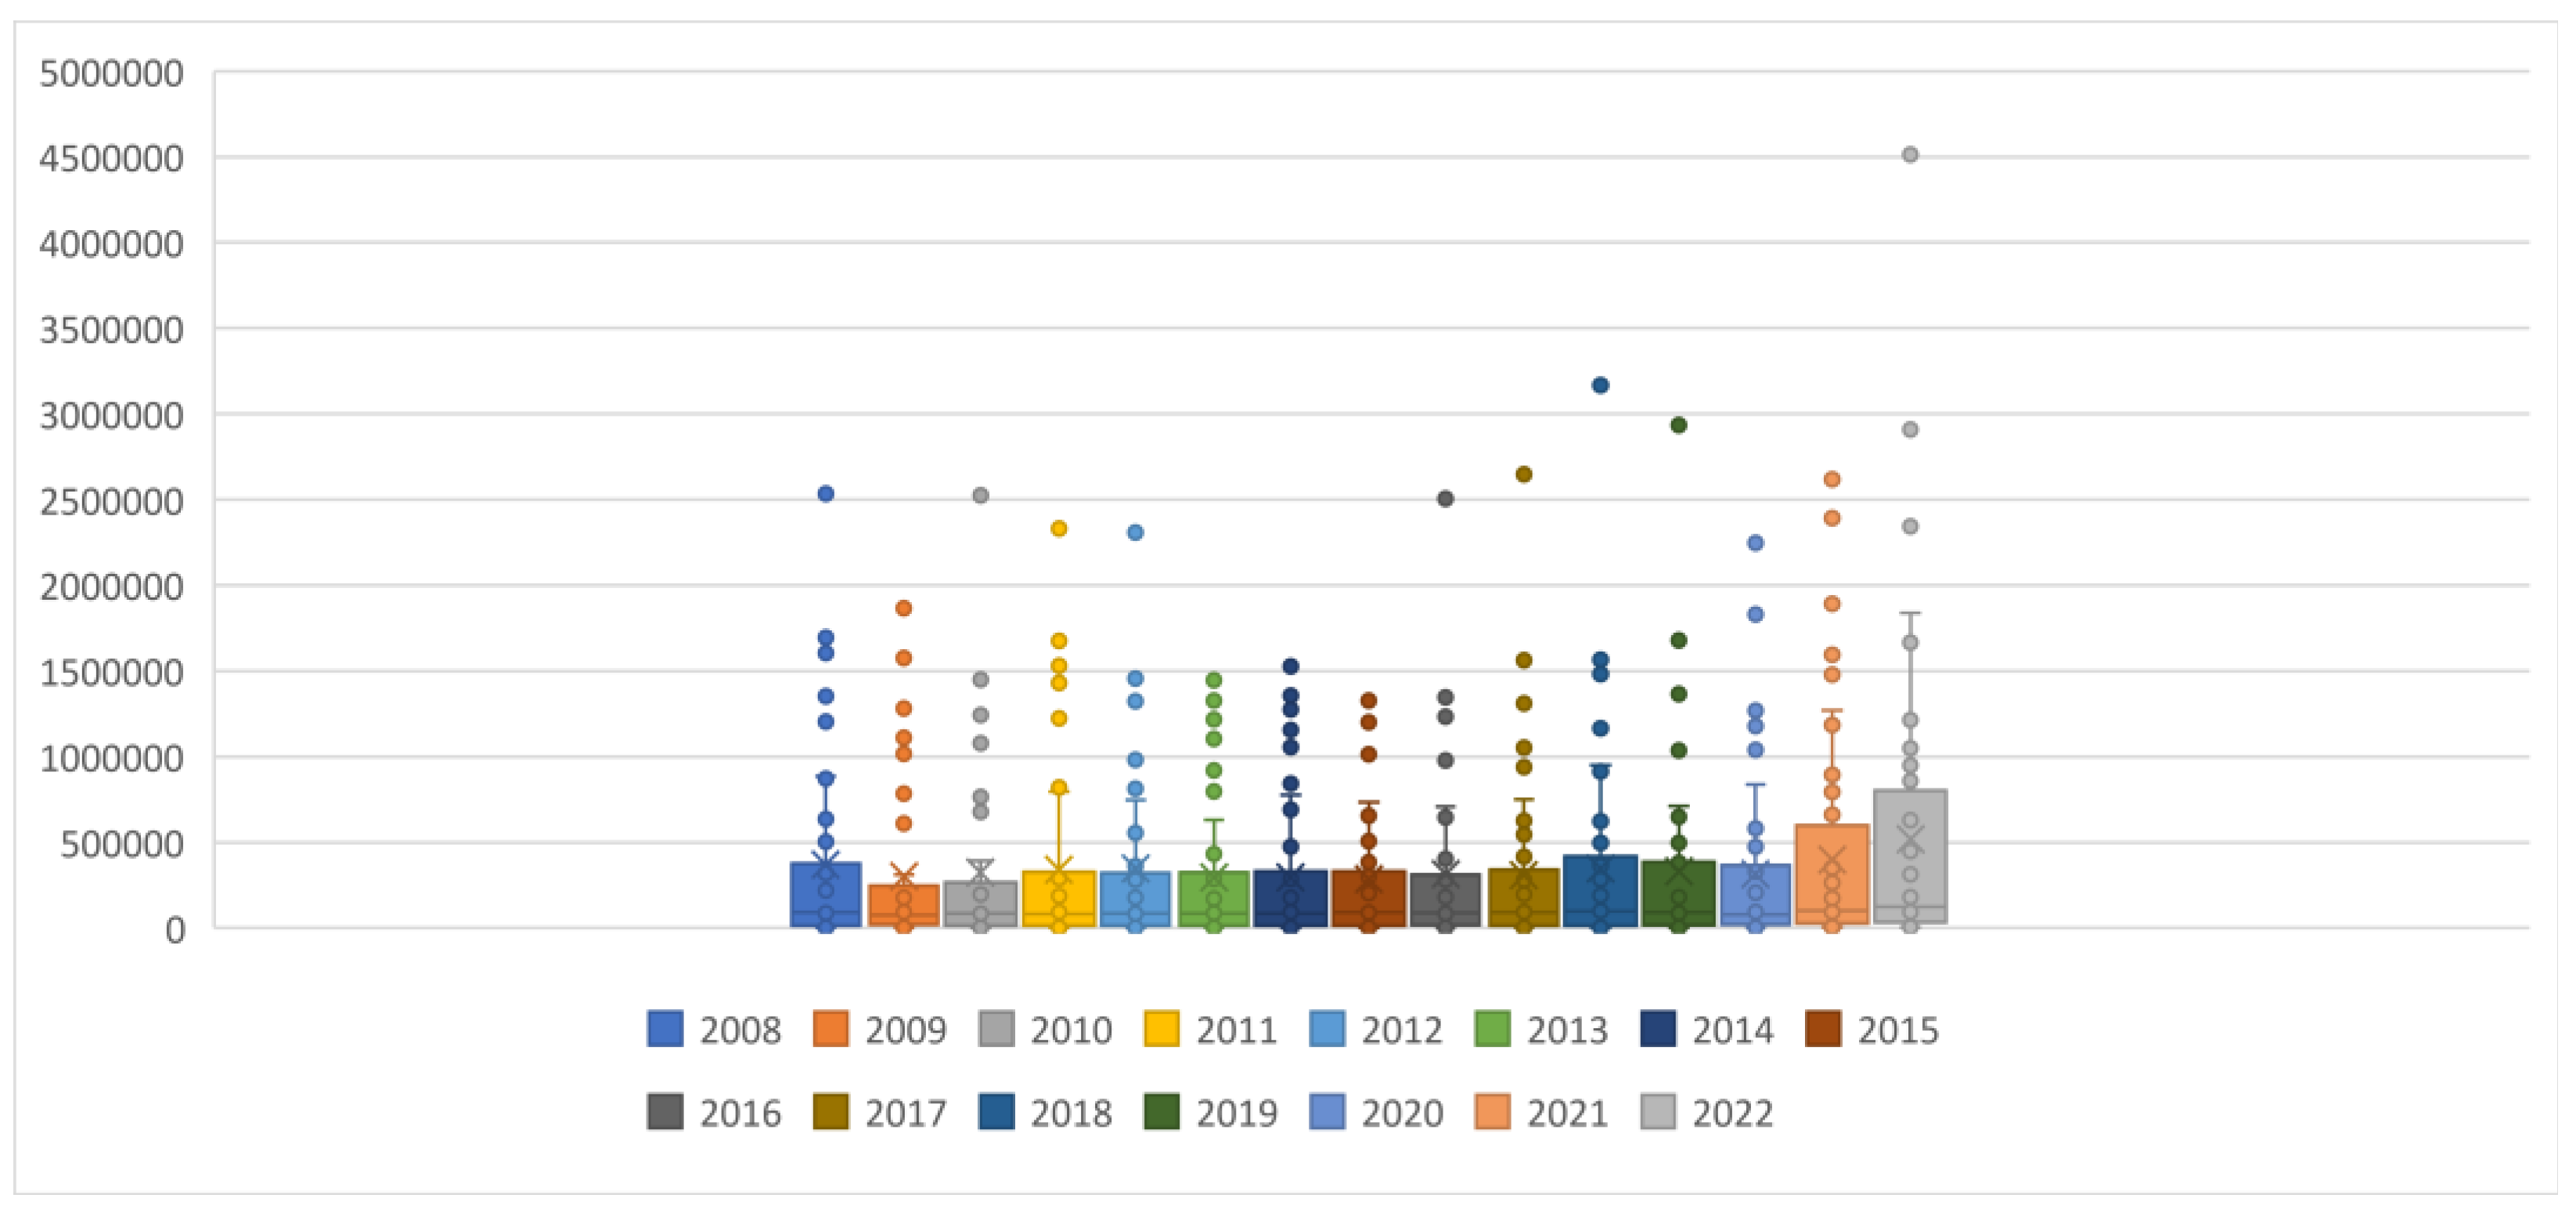
Median and quartile results are compiled in
Figure 4, where the box plot (whisker) is used to illustrate the overall development of the examined companies. As can be noted, in nearly every year, there were companies that were clearly outside of the predicted range. Typically, the highest inventory holder is in a class of its own. Rather interestingly, this top position did not change that often—in 10 times out of 15 examined years, it was Nokia (years: 2008–2012, 2016–2020), followed by Neste (oil refinery and renewable fuel manufacturer) in three occasions (years: 2013, 2021–2022). During these 15 years, Outokumpu (stainless steel producer; in the year 2014) and UPM (manufacturer of forest industry products; in the year 2015) had the highest inventory holdings only once. As inventory investments grew rather rapidly in 2021 and 2022, it was Neste that showed the highest inventory amounts. This is understandable as oil prices increased in these two years rather significantly, and there were global availability issues due to the Ukrainian conflict in 2022. In euro currency terms, oil price was in 2022 the highest level ever experienced. Neste was also the highest inventory holder in 2013, when the oil price in euro terms was also high, and this was for a longer period of time (until 2014, when the Ukrainian conflict started and oil prices plunged).
5. Content Analysis for Reasons of Inventory Build-Up
A disparity between increasing inventory investment within companies and quarterly reports was present when the content of the quarterly reports of 2021/Q4, 2022/Q1, and 2022/Q2 were analyzed. In an earlier analysis from euro terms change of inventory, it was clear that inventories grew in 2021 from 2020 and in the time of the two quarterly reports of 2022. If analysis is made on the company basis, it could be said that in 50 out of the analyzed 52 companies, inventories increased in 2021 from the previous year (and in these two, where there was decline detected, it was miniscule, at roughly one percent), and 49 companies out of 52 continued this increasing inventory trend in the first half of 2022 from the end of 2021.
Even if inventories were clearly growing in the majority of companies, in financial reports, they were not particularly mentioned or analyzed. In the final quarterly report of 2021, altogether, 30 companies mentioned inventory investment in their report, where 17 left it without any notice. To the second quarter of 2022, inventories were similarly again left without any attention—27 companies mentioned them in their written reports, while 25 companies did not feel that they were worth describing nor analyzing any further. In between these two quarters, in the first quarter, reporting was even less frequent—only 19 companies ended up mentioning inventory performance in their quarterly report, whereas 23 left it without any analysis (inventories grew from Q4/2021 in 37 companies as the total amount of reporting companies was 42).
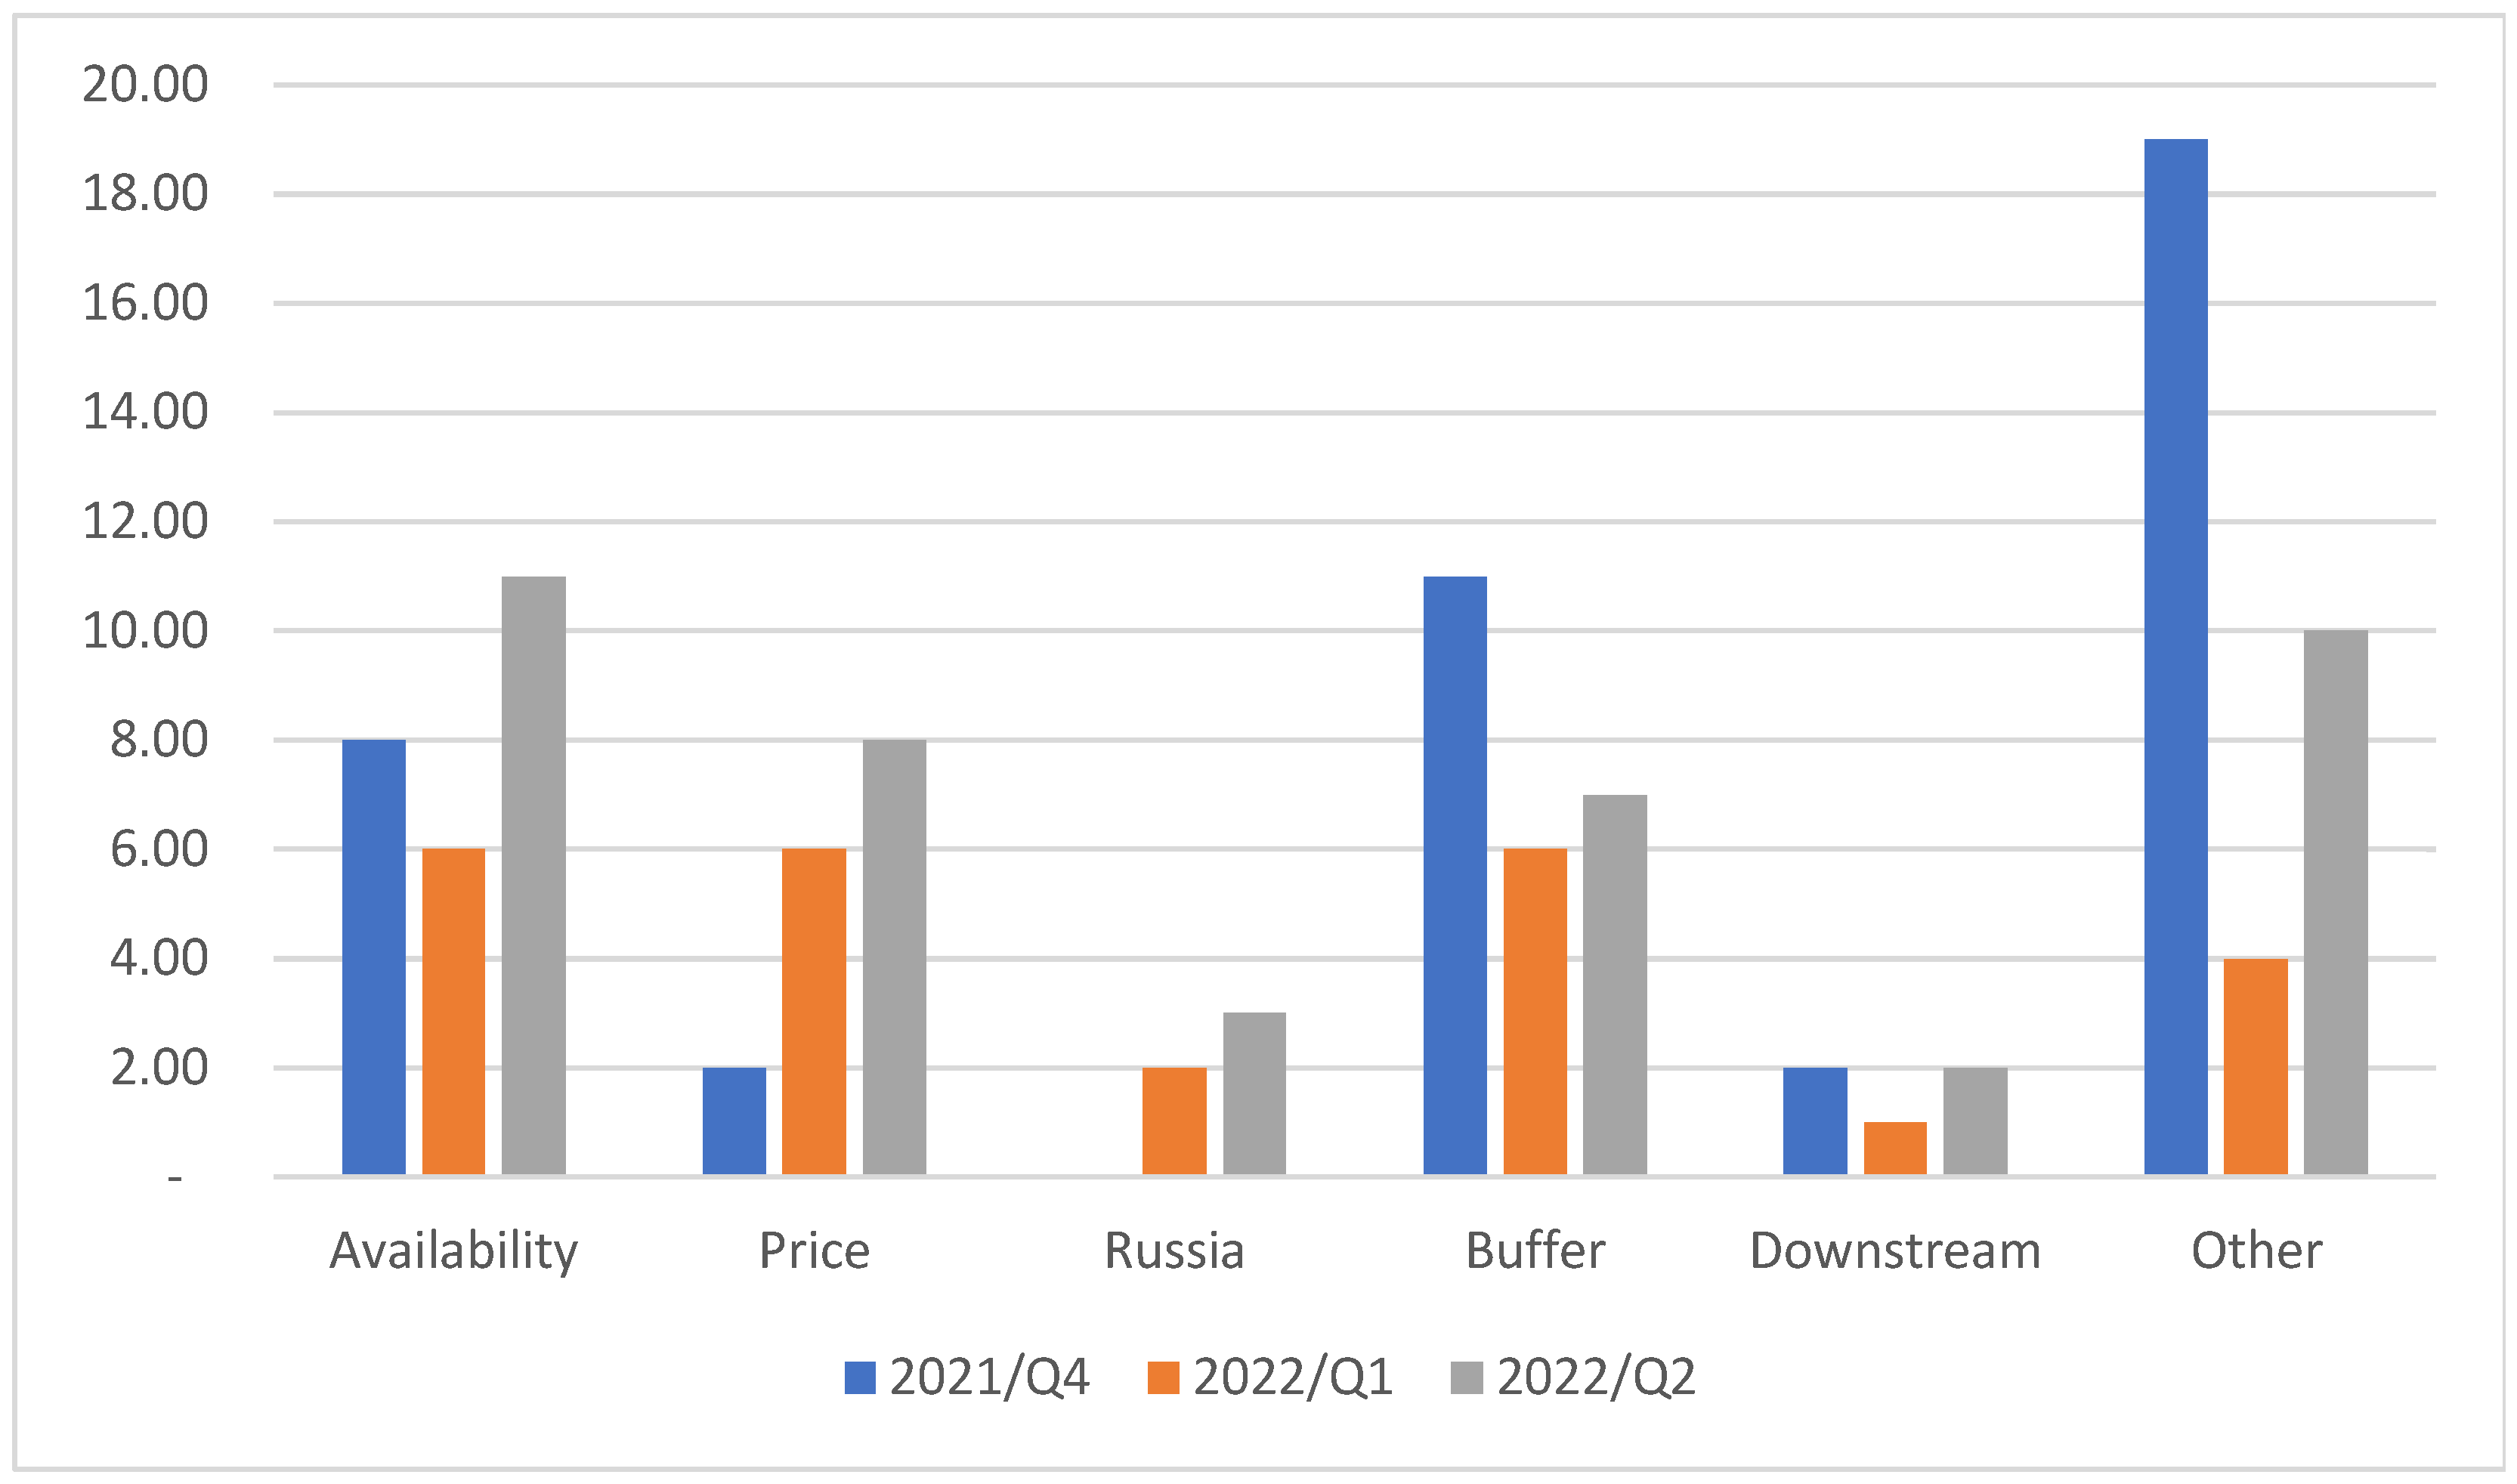
Companies reporting inventory issues at quarterly reports were classified into different themes, as is shown in
Figure 5. One company can belong to more than one theme, and this depends on what they mentioned in each report. In the end of 2021, the theme of “other” seemed to dominate available themes, and it was followed by buffering need recognized and availability challenges faced within purchasing markets. The theme called “other” was really diversified as companies reported that their expansion (manufacturing capacity or sales outlets) or general sales growth resulted in inventory investments, where others only mentioned that inventories increased during the period and/or caused profits to increase. There was one company that also complained that they were not able to increase inventories high enough (although they were already increasing). Buffering was mentioned often in the inventory context, and it was on many occasions mentioned that inventory levels were increased to assure business continuity and deliveries. Often, availability of purchased items as well as availability of logistics services (such as shipping) was mentioned in buffering themes or then separately. Mentioning directly purchasing price and downstream (customer or consumer) changes in the context of inventory was not that common at the end of 2021. Price was mentioned among two companies, and they argued it to have contributed to increased inventory holdings. Actually, one company estimated that 60% of inventory increase was due to price increases of metals. Downstream issues were not often mentioned, but in two companies, they were pinpointed as challenges. In one company, customer deliveries were said to have been late, causing inventories to increase. In another company, supply chain inventory levels were too high for weakened demand and caused sales to decline and inventories to increase.
In 2022, within two quarterly reports, it was evident that price became increasingly an issue, which was recognized within companies. In the majority of situations, it was so that price increase in purchases was seen as a cause of an increased need of working capital and increased inventory holdings. Together with price, it was availability that sustained and increased in importance in 2022, especially in the second quarter. The reasons for availability challenges were identified as the plain product availability issues, but also in many companies, delays and disruptions in supply chains were argued to have been the causes. In the “other” theme, there was an additional explanation for growing inventories, either sales or order growth experienced, but there were also companies that blamed inventories to have grown as sales did not progress that well in the period. Buffering remained as one of the popular reasons for inventory investments.
What is interesting from analyzing the content of financial reports, as well as those of quarterly reports in 2022, is that Russian sanctions and the situation with the war did not cause that great of an effect on companies in terms of inventory holdings. In the first quarter, two companies mentioned this as a factor, and in the second quarter, three companies did so. Typically, they suffered from a sudden stop of operations and customer demand, which was said to have increased inventories. One company also mentioned that they made preparations to make adjustments in inventory values (downgrade) due to the end of Russian demand and projects.
6. Concluding Discussion
In general, it could be concluded that inventories increased during 2021 and 2022 in analyzed companies, within a rather substantial fashion. This growth was not only due to some particular sized inventories increasing, and it seems that all values of average, median, and quartiles showed upwards development. It is interesting that the largest inventory holdings in particular significantly grew in 2021–2022 (also in the earlier period they were growing). As research showed that the largest inventory holder in the case of Finnish publicly traded companies did not vary that much, in the observation period of this research work (2008–2022), there were four companies with the highest inventory held annually, but two of these dominated the sample (especially the leading one). Interestingly, this highest holder position was either held by a telecommunications industry corporation or if oil prices were high, then it was held by a regionally leading refinery and significant renewable fuel manufacturer. In addition to the role of largest inventory holders, it was revealed in the analysis that lowest inventory holders (lower quartile) were also having rather robust growth in their holdings, not only in 2021–2022, but also in 2020 in terms of inventories growth.
In the content analysis of the final quarter of 2021 and two quarters of 2022 (Q1 and Q2), it was shown that not all companies reported causes of inventory growth and/or how it could be managed better. Most of the companies in these quarters experienced inventory growth. As in content analysis, the reasons for inventory growth were further analyzed, and it was rather surprising to find out that Russia was not the stated main reason for inventory challenges. Together with this, it was rather rarely identified that downstream customers were causing it. However, availability issues, increasing prices, buffering need, and other reasons were the most frequently mentioned. Often, companies argued, for example, that business was growing and they needed to have higher inventories, but also there were explanations from situations, where revenues did not meet expectations, and inventories did not meet the forecasted demand. Increasing purchase prices are often one major cause in the growth of inventories—in this analysis, it was so that companies identified that this further analysis was proceeding in time (some metal industry actors reported a rather high significance effect of price changes to its inventory holdings).
It could be said that findings of this research stress the importance of earlier research concerning the crisis times and the need to increase inventories as well as reconfigure the supply network (
Sheffi 2021;
Shih 2020;
Handfield et al. 2020;
Wiesmann et al. 2017). It is also interesting to note that some companies said that declining or increasing sales were the reason for inventory growth, providing a further perspective on inventory’s function through sales (e.g.,
Elsayed and Wahba 2016). Reactions and practices are disseminating fast, and those used as reported by Toyota before the COVID-19 period (
Oi 2022;
Kelly and Shiraki 2022) appear to be used in a wider fashion already.
As a weakness of this study, it cannot be said what parts of inventory growth are caused due to the COVID-19 era and where the war time resulted in it growing. These two crises have somewhat overlapped with each other. However, this research offers a timely view of inventory build-up in 2021–2022 as the examination was taken to a quarterly level (with this being its strength).
As further research in inventory management and its efficiency arena, it would be interesting to follow how changes in the global economy, geopolitics, and central bank policies affect the forthcoming quarters and years. This could be done simply by expanding the dataset of this study. In addition to this, content analysis from this forthcoming period would be fruitful for the research area. Together with these, it would be vital to update larger statistical analysis from the effects of inventory holdings on profits and profitability. Has the new environment of previous years changed the old assumptions?


