Article

The Perception of the National Traceability Platform among Small-Scale Tea Farmers in Typical Agricultural Areas in Central China

1
College of Economics and Management, South China Agricultural University, Guangzhou 510642, China
2
College of Geography and Environmental Science, Henan University, Kaifeng 475001, China
3
Key Laboratory of Geospatial Technology for the Middle and Lower Yellow River Regions, Henan University, Ministry of Education, Kaifeng 475001, China
*
Author to whom correspondence should be addressed.
Int. J. Environ. Res. Public Health 2022, 19(23), 16280; https://doi.org/10.3390/ijerph192316280
Submission received: 4 November 2022 / Revised: 29 November 2022 / Accepted: 1 December 2022 / Published: 5 December 2022
(This article belongs to the Special Issue Safety and Quality of Agricultural Product and Food)

Abstract

:
As one of the key technologies to ensure the safety of agricultural products, the national traceability platform is being widely promoted in China. However, it has not yet been widely adopted among farmers, especially small-scale farmers. Farmers are both producers and direct participants in the traceability of agricultural products. Their perception directly affects the effectiveness of the promotion of the national traceability platform. This study explores the perception of the national traceability platform among small-scale tea farmers in typical agricultural areas in central China. This research employed Q methodology, an approach that integrates both qualitative and quantitative data allowing individuals’ subjective understandings of a specific topic to be studied. The Q-sort procedure was performed in the field with 16 small-scale tea farmers. Next, Q-factor analyses were conducted using the Ken-Q analysis. The results show that small-scale tea farmers have different perceptions of the national traceability platform. Their main characteristics are active participation, resistant participation, risk aversion, and being driven by pressure. These four categories covered 52% of the perceived variance. Meanwhile, there is also a degree of internal consistency in the perception of small-scale tea farmers. Specifically, they are all concerned that participating in the national traceability platform may increase the cost and risk of cultivation and that it is difficult to obtain support from agricultural technicians. Therefore, understanding the perceptions of tea farmers of the national traceability platform is the premise for formulating effective promotion policies. Our research sheds light on the decision-making mechanisms for small-scale tea farmers to participate in national traceability platforms, further expanding the scope of current research on farmer behavior. This research has reference significance for promoting national traceability platforms in China and other countries around the world.

1. Introduction

Tea is the most widely consumed beverage in the world, second only to water [1]. The demand for tea has risen sharply over the past two decades and will continue to grow in the next decade [2,3]. More than 69% of the global population drinks tea every day, with an estimated daily consumption of 18–20 billion cups [4]. As a non-alcoholic stimulant beverage, tea has unique bioactivity and health benefits [5]. In recent years, the tea cultivation area in the world has expanded significantly due to the increase in the number of small-scale tea farmers [6]. About 70% of the world’s tea is produced by small-scale tea farmers, who constitute an important part of the global tea industry [7]. However, the low profitability of small-scale tea farming has become a serious threat to the sustainable development of the tea sector [8]. To achieve higher incomes, many tea farmers rely heavily on pesticide and fertilizer inputs to achieve higher yields [9,10]. This will not only damage the environment in the long run but also pose a great threat to human health [11,12]. Therefore, with the increase in tea consumption, the importance of tea safety has become increasingly prominent [13].
In order to ensure the safety of agricultural products, traceability systems have been established in many countries and regions around the world. However, such systems are mostly distributed in developed countries, such as those in the European Union [14], the United States [15], South Korea [16], and Australia [17]. The application of traceability systems in agriculture has not yet been fully established, especially in developing countries. India has established a traceability system, not for the purpose of tracking but rather to display the prices of goods [18]. The traceability system in Malawi is ineffective because the food supply chain is not traceable [19]. The traceability system in the Taiwan region of China also failed to achieve the expected success due to the low participation rate of farmers [20]. Meanwhile, traceability systems are still in the early development and application stage due to the influence of blockchain and the Internet of Things (IoT) [21]. In addition, due to restrictions from government regulations, unstable food safety policies, unorganized market areas, inadequate supply chain facilities, lack of cold chain facilities in the field, and insufficient agricultural practices by a large number of farmers, the usage rate of traceability systems is still relatively low [22].
Affected by individual food safety incidents in China, consumers are constantly seeking healthier and safer food [23]. Several Chinese government departments have established traceability platforms, but they mainly focus on food production enterprises, including meat, vegetables, Chinese herbal medicines, and alcohol (https://zycpzs.mofcom.gov.cn/, accessed on 15 March 2022.). For this reason, China has issued a policy to accelerate the construction of a traceability system for important products, proposing to establish a traceability system at the national level. In 2017, the National Agriculture Food Quality Safety Traceability Management Information Platform (National Traceability Platform, NTP, http://www.qsst.moa.gov.cn/, accessed on 21 August 2021) was activated [24]. In 2018, the NTP was fully promoted in China. Green food, organic agricultural products, and agricultural products with geographical indications identified by the agricultural sector are all included in the traceability management [25]. However, small-scale tea farmers rarely participate in the NTP. It is estimated that 80% of China’s tea production is produced by small-scale tea farmers [2]. Their extensive participation is, therefore, important for tea safety.
The NTP can directly ensure food safety and quality, and reduce the time and cost of food recalls [14]. Participating in the NTP can also indirectly bring environmental, economic, and social benefits. First, it can regulate pesticide and fertilizer inputs for tea farmers [26]. Excessive use of pesticides and fertilizers can lead to soil compaction and water pollution, ecological imbalance in tea gardens, and ultimately limit tea tree growth and tea quality [27,28]. Simultaneously, carbon dioxide from tea cultivation and processing is one of the important sources of agricultural greenhouse gas emissions [29]. By regulating the production behavior of small-scale tea farmers, carbon emissions can be reduced, and the resulting adverse effects of climate change can be mitigated. Furthermore, the traditional cultivation and management of tea has been a major threat to biodiversity, and production based on agricultural standards is beneficial for biodiversity conservation [30]. Eventually, tea farmers produce according to certain standards, which not only can shorten the supply chain by reducing the distance between tea farmers and consumers, but also increase the value chain, thus improving the livelihoods of tea farmers and promoting rural development [31].
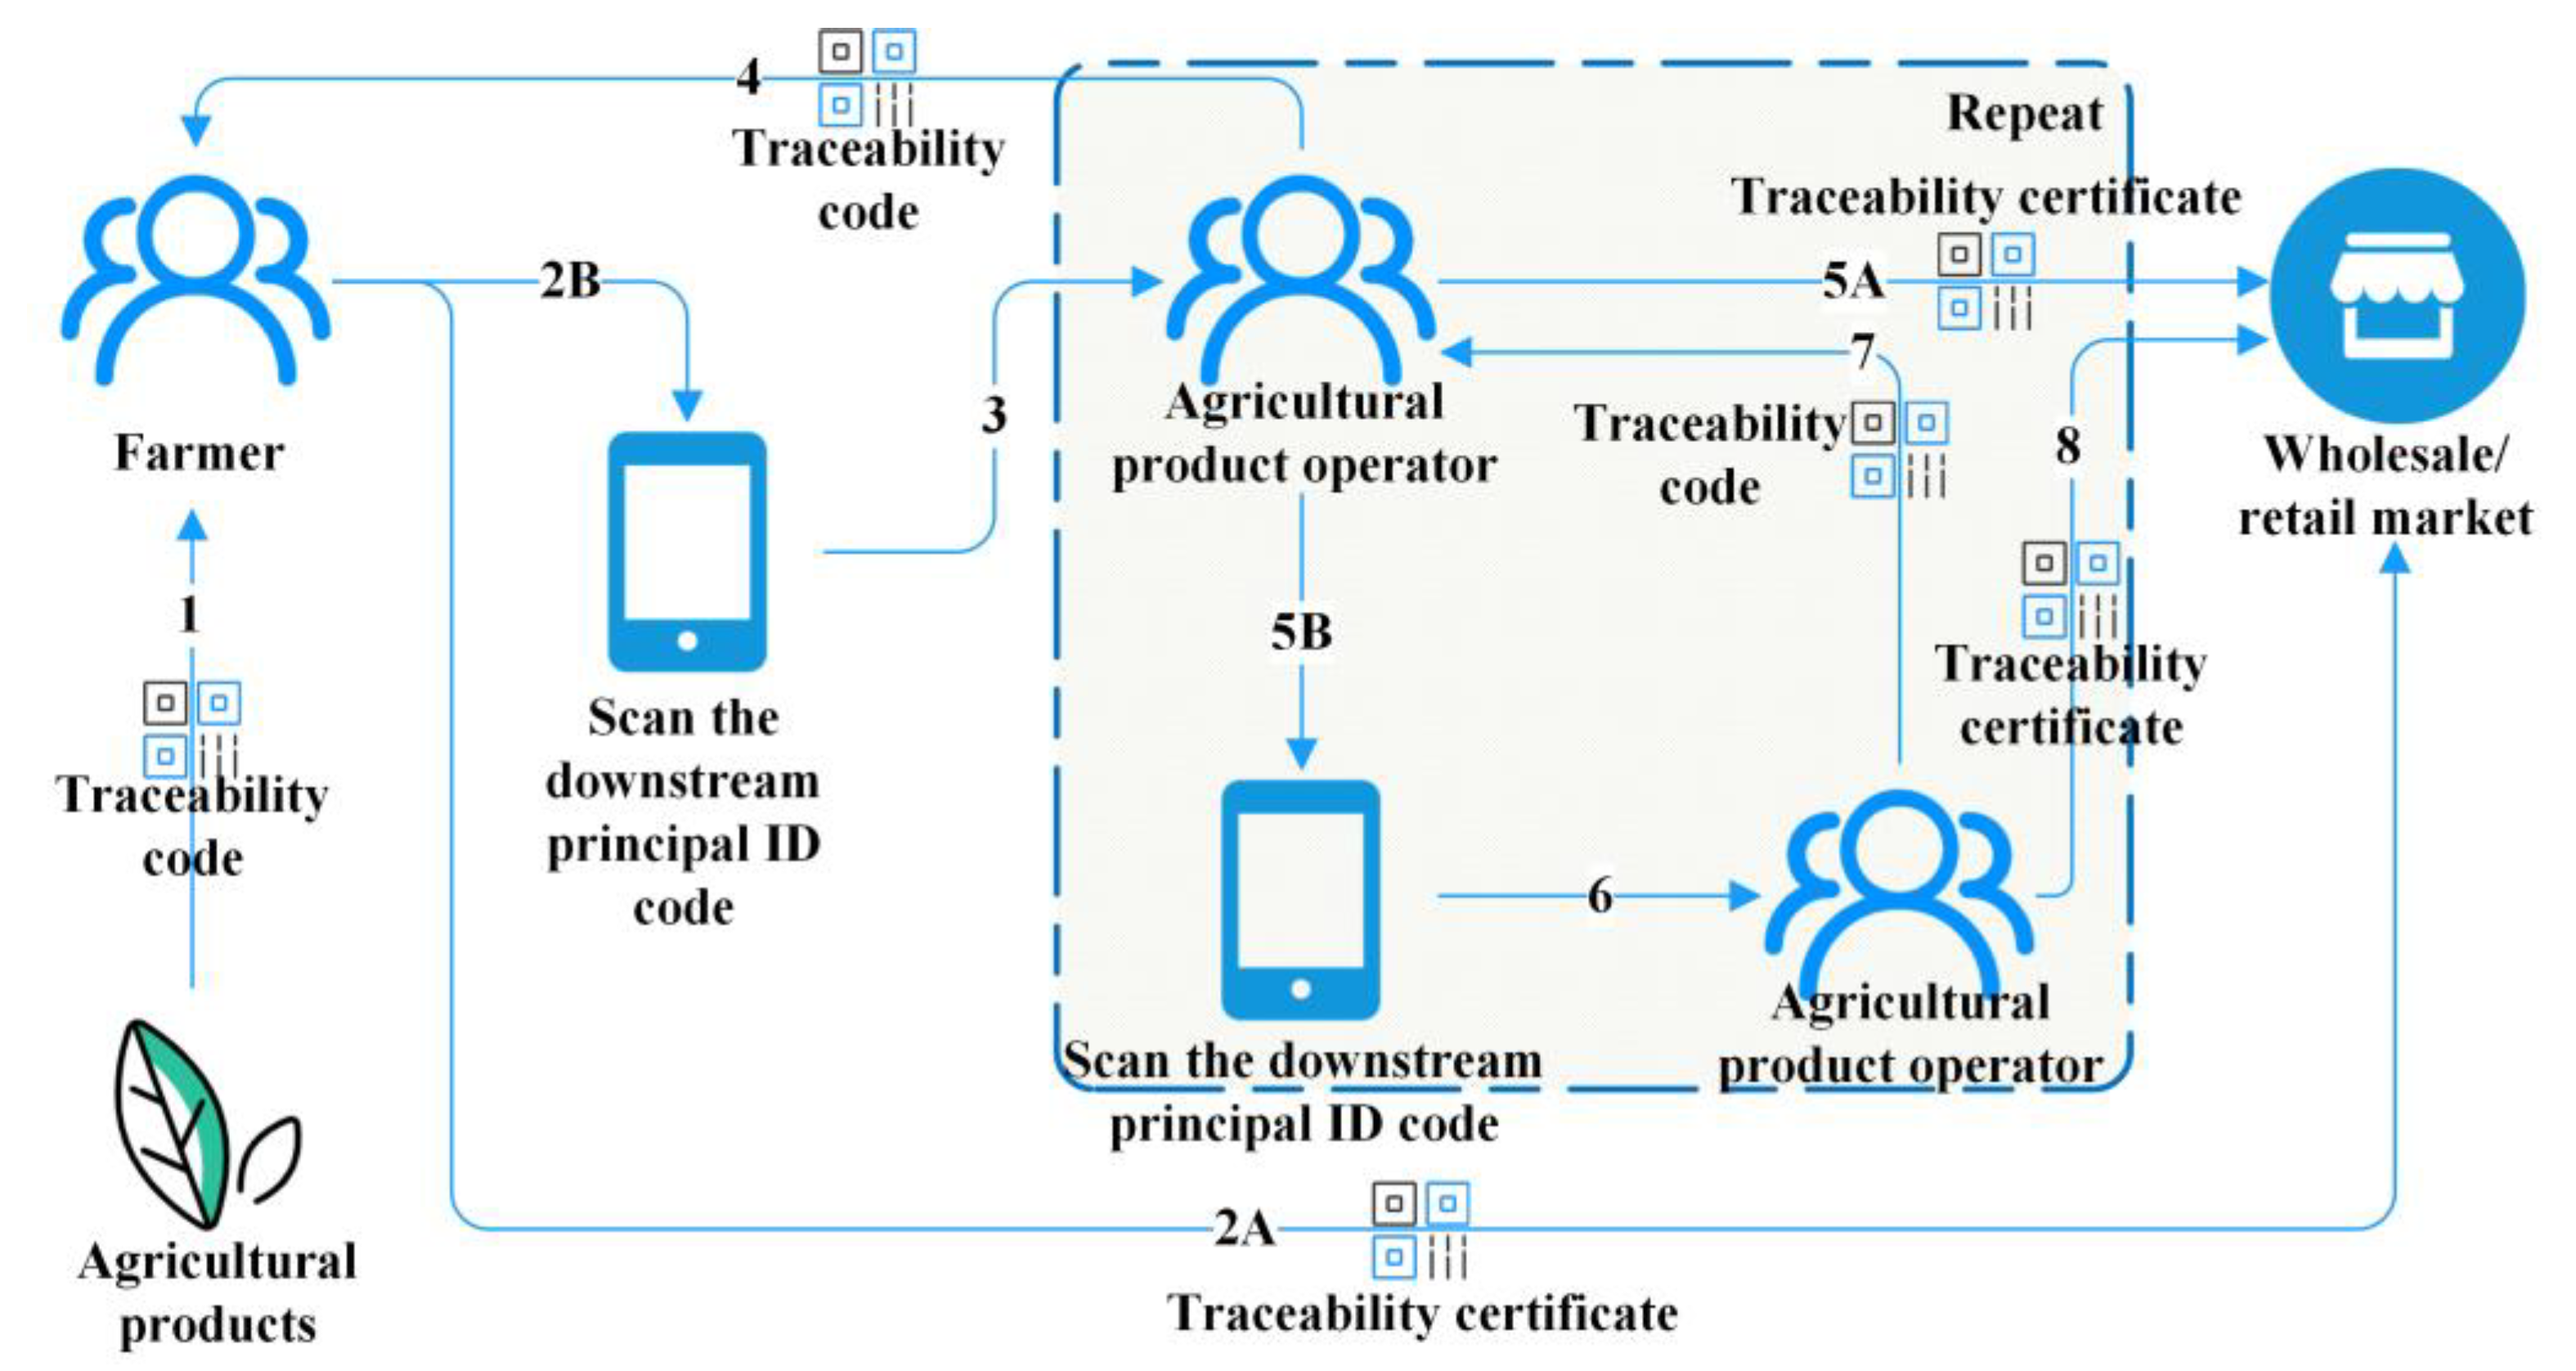
Agricultural safety events are typically characterized by immediacy, high uncertainty and complexity [32]. Ensuring the safety of agricultural products must be an action of the whole society, including farmers, companies, consumers and governments [33]. The NTP is considered to be an effective means of guaranteeing the quality and safety of agricultural products [34]. This is because it can identify the responsible parties and thus reduce market failures caused by information asymmetries and unspecified responsibilities. Farmers are both producers and direct participants in the traceability of agricultural products. Studying the behavior of farmers has become the key to solving the problem of agricultural safety. However, the difficulty in promoting the NTP is also for farmers, as they are large and dispersed throughout China [35].
Meanwhile, farmers’ perceptions of new agricultural technologies, including the NTP, are complex. Any policy that requires farmers to adopt new technologies needs to understand their perceptions of the status quo and new technologies [36], especially for small-scale farmers. Because they are already exposed to vulnerability, they may be less willing to take risks [37]. If farmers adopt new technologies, they first need to believe that these technologies will bring them considerable income [38]. When people have a positive attitude toward a new technology, they are mentally prepared for its adoption. This psychological preparation may, in turn, lead them to have a higher willingness to use it [39]. Therefore, by understanding the perceptions of small-scale tea farmers, policymakers can formulate precise policies and accelerate the effective promotion of the NTP in the agricultural sector.
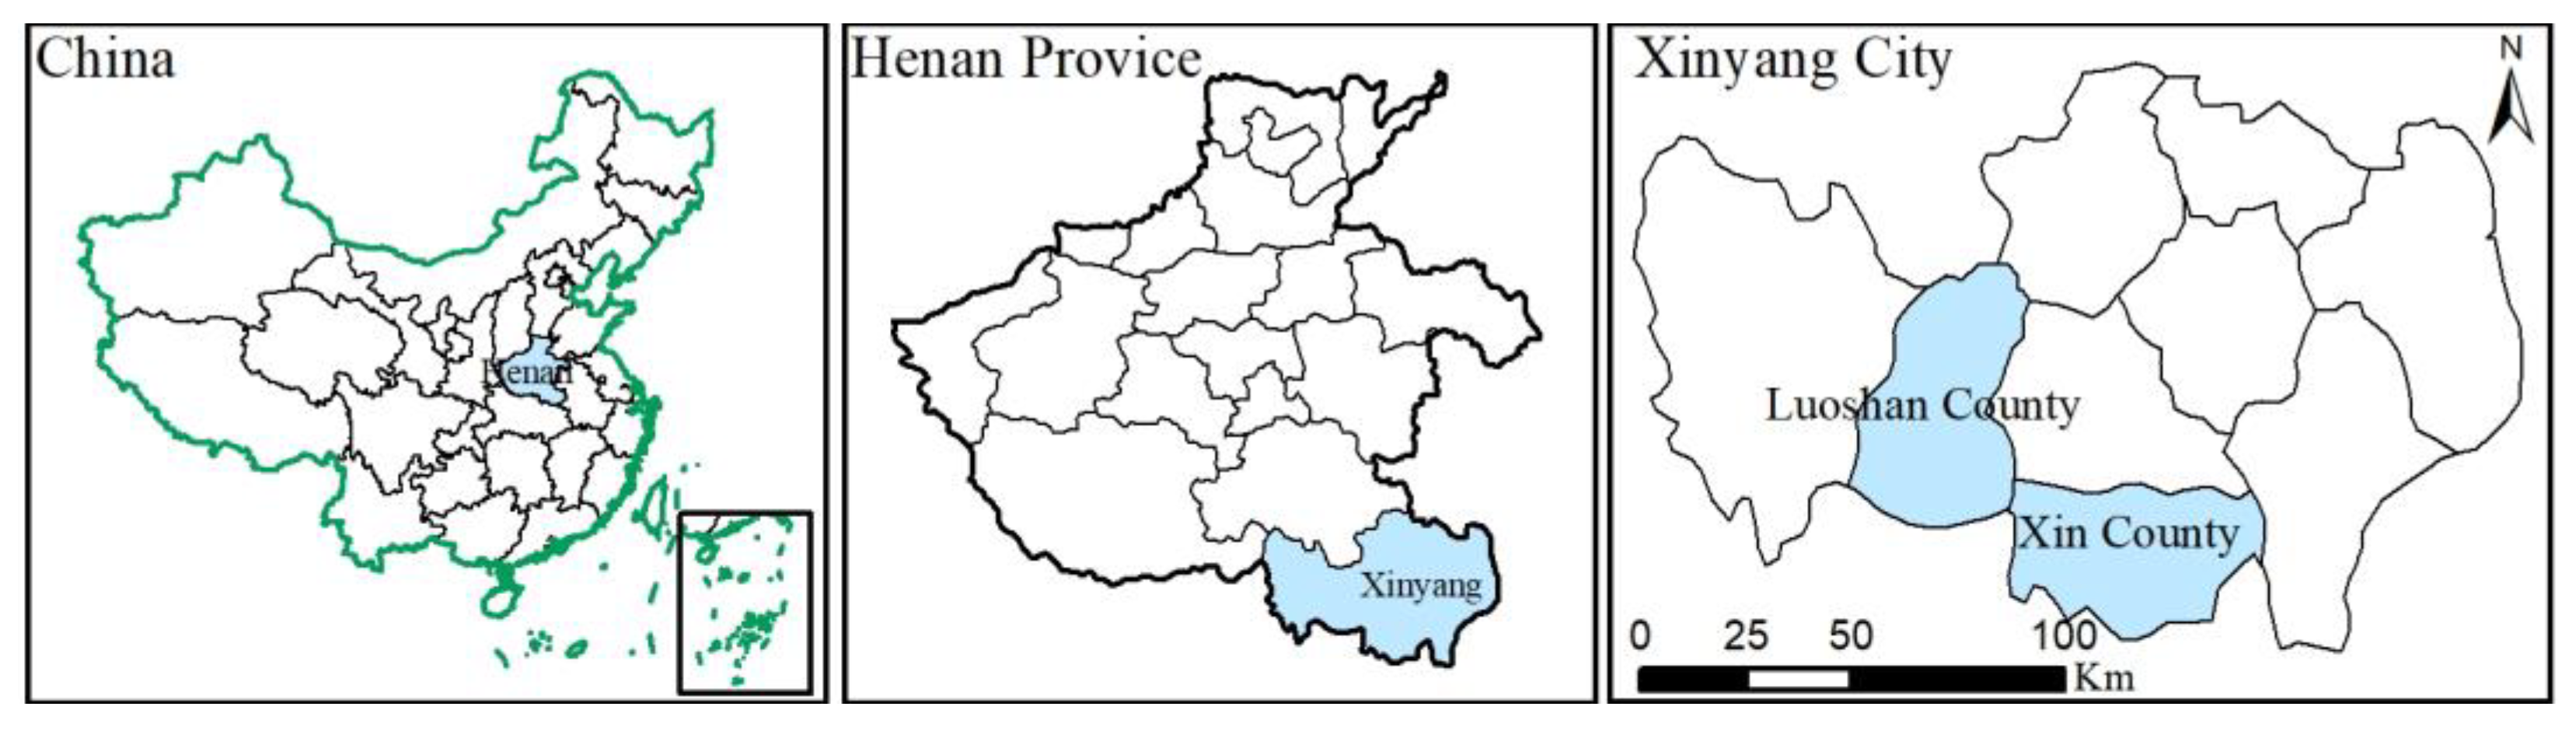
The study was therefore conducted to investigate the perceptions of small-scale tea farmers about the NTP in a typical agricultural area in central China. Based on their different perceptions, we have tried to classify them into different categories of tea farmers. Our research can further expand the scope of research on farmers’ behavior. At the same time, by understanding farmers’ perceptions, the results can be used to support the development of more appropriate policies to promote the NTP in the agricultural sector. Knowledge of farmers’ perceptions will increase our understanding of which policies are more likely to be accepted and therefore adopted by farmers.

2. Materials and Methods

2.1. Description of National Traceability Platform

The national traceability platform was developed and constructed by the Agricultural Product Quality Safety Center of the Ministry of Agriculture and Rural Affairs of PRC, including traceability, supervision, detecting, and enforcement systems. The traceability system is the main component of the NTP, which is used to support agricultural product producers and operators to collect production and circulation information. Figure 1 shows the flowchart of the traceability system. First, farmers put agricultural product information into the system. Second, agricultural products can be sold in circulation and market. Among them, 2A: The agricultural products are directly sold in the market, and the traceability certificate is generated by the system; 2B: Farmers scan the identity codes of downstream transaction subjects to determine their identity information. Third, by scanning the identity code of the downstream transaction subject, farmers fill in relevant transaction information to complete the circulation sales of agricultural products. Fourth, the downstream transaction subjects confirm the completion of the transaction, and the system generates the product traceability code. Fifth, after the downstream subjects confirm the information of the purchased agricultural products and complete the filing, the agricultural products can be selected for circulation sales and market sales. Among them, 5A: Agricultural products are directly sold in the market, and the traceability certificate is generated by the system; 5B: Select the circulation link and repeat the 2B-4 process (This link can be repeated in a loop).
According to the requirements of the Chinese agricultural department, green food, organic agricultural products, and agricultural products with geographical indications (including tea) are all included in the traceability management system. Products not only need to be launched with certificates and codes but also have traceability labels posted on the market [25]. For tea farmers, they need to record variety information, production area environmental information, tea garden reclamation information, soil management information, drug fertilization information, fresh-leaf picking information, testing information, and processing information on the NTP to promote the traceability of the production process [26].

2.2. Study Area

Our study was carried out in Xinyang City, Henan Province, Central China (Figure 2), with geographic coordinates ranging from 113°45′ to 115°55′ E and 31°23′ to 32°24′ N. The topography of Xinyang is high in the south and low in the north, and it is located in the transition zone from subtropical to warm temperate. It has a distinct monsoon climate, which is characterized by abundant sunshine and rainfall. In 2020, the total population of Xinyang city was 6.23 million, including 600,000 tea farmers. Its GDP is about $40 billion, of which the tea output value exceeds $1.7 billion [40]. The tea of Xinyang is exported to more than 20 countries and regions around the world [41]. Tea planting covers the entire territory of Xinyang City. The area of tea plantations is equal to 110.37 thousand hectares, with an average annual output of about 70,000 tons of tea. Tea plantation area and output account for 98% and 99% of Henan Province, respectively [42]. There are three main reasons why we chose this area for our research. First, Xinyang is an important green tea production area. Xinyang Maojian Green Tea is one of the top ten famous teas in China, with a brand value of over $1 billion. Secondly, Xinyang has a long history of tea planting, and the tea there is primarily planted by small-scale tea farmers. In addition, Xinyang Maojian Green Tea obtained the National Agricultural Product Geographical Indication Certification in 2020, and tea farmers were included in the NTP for management. However, NTP has not been widely adopted by small-scale tea farmers. Therefore, exploring small-scale tea farmers’ perception of the NTP can not only help us understand the actual needs of tea farmers, but also has significance for the tea industry management that aims to promote the NTP.

2.3. Research Methods

2.3.1. Q Methodology

Based on non-positivist philosophy and epistemology, the Q methodology avoids the fallacies of popular positivist research methodology [43,44]; it can scientifically translate subjective human views into objective results [45]. First, unlike other social research methods, it provides numerical results to support the points explained, thus combining the advantages of quantitative and qualitative methods [46,47]. Second, the method is exploratory, meaning it does not focus on the frequency and distribution of research opinions in the population, but rather on diversity [48]. Moreover, it can mitigate certain response biases because respondents are required to engage explicitly with opinions that they might deem inappropriate or unexpected [46]. In recent years, the Q methodology has become an important method for analyzing agricultural issues, including food safety [49], commercial-scale beef farmers [50], intensive agriculture [51], agricultural best management practices [52], wireless sensor network applications [53], and precision farming [54].
We use the Q methodology to explore small-scale tea farmers’ perceptions of the NTP. The Q methodology mainly consists of four steps (Figure 3): (1) Creating the statement concourse, (2) Selecting the Q sample, (3) Identify respondents (P-set) (the Q samples were sorted according to their viewpoints (Q-sort), and interviews were conducted), (4) Factor analysis was performed on the Q-sort to determine the respondents’ main perceptions. The analysis step used Ken-Q analysis (https://shawnbanasick.github.io/ken-q-analysis/, accessed on 18 January 2022), version 1.0.6.
The first step was creating the statement concourse. A statement concourse can use different sources of information, such as literature, interviews, expert opinions, blogs, and newspapers [47]. By sorting out the relevant literature on the research topic of farmer technology adoption, we summarized the relevant statements in combination with tea planting practices. These statements were examined, discussed, and categorized by a scholar in the field of agricultural economics research and two doctoral students. Finally, 80 statements made up the statement concourse.
The second step involved selecting the Q sample. In general, the Q sample is between 40 and 80 samples large, which are selected from the statement concourse [44]. We conducted pre-interviews with seven tea farmers and removed repeated or ambiguous statements (Table A1). In addition, our team once again discussed these statements. Finally, 48 statements made up the Q sample.
The third step was identifying the respondents and conducting the Q-sort. Since Xinyang belongs to a mountainous area, tea farmers live in scattered places. We interviewed 16 respondents face-to-face in two separate sessions. In January 2022, we interviewed ten tea farmers in Balifan Town, Xinxian County, which is known as “the first township of tea in the Central Plains.” In February 2022, we interviewed six tea farmers in Zhutang Town, Luoshan County, which is known as the “Landscape Tea Township”. The two places have a long history of tea, and both are mainly grown by small-scale tea farmers. Our goal was to give tea farmers a clear and pertinent view of the research topic and avoid samples that were too homogeneous. Unlike traditional positivist sampling methods, we conducted a purposeful sampling survey. Tea farmers come from different regions and have different characteristics, such as age, planting experience, education level, and tea planting area. After we explained the research purpose and procedures to them, they were willing to participate in the Q-sort. A Q-sort is an improved rank-sorting technique. Under certain conditions, participants rank question items according to their personal perceived importance [55]. Each tea farmer needed to read the randomly numbered statements and fill in the number of all statements in the grid according to their level of agreement (−2 = “strongly disagree”; −1 = “disagree”; 0 = “neutral”; 1 = “agree”; 2 = “strongly agree”) (Figure 4). After the Q-sort, each tea farmer was interviewed to learn about their thoughts regarding the Q-sort. In such cases, it is relatively free of certain psychological biases such as the dominance effect [46,56].
Fourth, a Q factor analysis and interpretation was conducted. We applied principal component analysis (PCA) to the Q-sort correlation matrix, simplifying the data to several factors. Factors are usually rotated to make the data structure clearer and more interpretable [46]. We used Varimax to rotate the factors. Meanwhile, the Q-sort of these factors was identified and marked in order to reveal differences between factors. Mark [57] refers to the selection of the Q-sort for inclusion in the final factor. In addition, a statement score is calculated for each factor. Based on the statement scores between the different factors, we identified distinguishing and consensus statements. Finally, we highlighted significant distinguishing and consensus statements for each factor. Through the analysis of tea farmer reviews, we, thus, strengthened the quantitative interpretation of these factors.
It is noteworthy that the factor extraction process depends on the eigenvalues and the factor loadings. In other words, not only should the extracted factors have eigenvalues greater than one but also they should include at least two significant viewpoints. There are three types of viewpoints: insignificant, significant and confused. Insignificant viewpoints are those insignificantly correlated with the selected factors. Significant viewpoints are those significantly correlated with one selected factor. Confused viewpoints are those significantly correlated with at least two selected factors. Insignificant and confused viewpoints are excluded from the analysis [44]. Moreover, taking into account each factor, the viewpoints with a loading factor greater than 2.58 × SE (Standard Error) are significant at the 0.01 level. SE is calculated as follows: S E = 1 / N , where N indicates the number of statements.
An unusual feature of Q methodology is that the rule of thumb that larger sample sizes are better does not necessarily apply [44]. Powerful Q results can be obtained with very small samples [46]. In addition, Milakis et al. [58] and Jang and Lee [59] used the Q methodology to collect 17 and 16 samples for related studies, respectively. Therefore, the samples used in our study can be considered suitable.

2.3.2. Discriminant Analysis

We assessed the robustness of the Q results by using discriminant analysis. Discriminant analysis is a method of modeling dependent variables according to their relationships with certain independent variables [60]. The results are usually presented in the form of a graph, where the categories are projected into the discriminant function [61]. Discriminant analysis is appropriate when the dependent variable is determined in advance [62]. To verify the classification results obtained by the Q factor analysis, we performed Fisher’s linear discriminant analysis using the demographic and economic characteristics of the tea farmers, such as age, education level, gender, and other variables, to determine the group membership of each category of tea farmers.

3. Results

3.1. Sample Features

The average age of tea farmers was 37.9 years; the oldest and youngest were 60 and 22 years old, respectively (Table 1). The average planting years was 15.9 years; the maximum and minimum planting years were 33 and 2 years, respectively. We included both young and experienced tea farmers. Therefore, we considered our selection of samples to be diverse. They are small-scale tea farmers with an average family tea garden area of 6 mu. They are mostly male. Their average education level is high school; few tea farmers join cooperatives; most tea farmers are engaged in other jobs besides tea planting; their average annual household income is $12.409 dollars.

3.2. Q Factor Results

According to the differences in the perception of small-scale tea farmers on the NTP, we divided them into four categories, representing four factors, respectively. These four factors explained 52% of the total variance (Table 2). Among the 16 tea farmers, 14 were significantly loaded factors, and two farmers (13 and 15) did not load any factors. The sample characteristics of each factor are shown in Appendix A Table A2. The four factors show high composite reliability and low standard error.
Figure 5 shows the Q-sort of the four factors. Tea farmers within each factor had similar perceptions of the NTP. We use factor 1 as an example to explain how to read the Q-sort. Among them, statements 48, 12, 26, 22, 13, 4, 41, and 6 in factor 1 represent “strongly agree.” Statements 26 and 13 are significantly different from the other factors at the 1% level, and statements 22 and 4 are significant at the 5% level. Appendix A Table A3 lists the full Q-sort for each factor.
Distinguishing and consensus statements can be used to reveal differences and similarities between factors [63]. To better understand the perceptions of small-scale tea farmers, we combined their comments made in the interviews to describe the distinguishing statements (Table A3) (Section 3.2.1, Section 3.2.2, Section 3.2.3 and Section 3.2.4) and consensus statements (Section 3.2.5). For each factor, the numbers in parentheses represent the ordinal number of the statement and its Q-sort value. For factor 1, (26, 2) is represented in the position of 2, meaning the response to statement 26 was considered to be “strongly agree.”

3.2.1. Factor 1: Active Participation

Results showed that factor 1 accounted for 21% of the overall variance. Five tea farmers’ viewpoints fell into this factor (Table 2). These tea farmers were very willing to spend time and energy on the NTP (45, −2) as they believed that the cost of participating in the NTP was not high (1, −2) (Figure 6a). “I like to try new things, including participating in the NTP, even if I pay some costs,” said Tea Farmer 7. Furthermore, if participating in the NTP was in line with their principles, values, and beliefs (4, 2), they would continue to focus on the development trend of the platform (26, 2). As Tea Farmer 5 said: “The government’s requirements for tea production are becoming more and more stringent; participation in tea traceability is a trend.” Meanwhile, they supported participation in the NTP to reduce the adverse environmental impacts of tea cultivation (40, 1). However, they maintained the neutral attitude that participating in the NTP could reduce the risk of tea cultivation (5, 0) and sell tea to the national market (9, 0). Tea Farmer 11 explained: “If tea cultivation is carried out in accordance with national standards, we will reduce the use of pesticides and fertilizers, which will be of benefit for the environment. But tea growth will face pests and diseases, which may increase the risk of planting.” In addition, tea farmers believed that they needed to spend a long time learning the relevant knowledge and technology related to the NTP (22, 2). “I need to spend time learning how to use it because I don’t understand the NTP,” said Tea Farmer 10. In general, such tea farmers were willing to bear the cost, and they had a strong willingness to participate in the NTP. Therefore, such tea farmers demonstrated the characteristics of active participation.

3.2.2. Factor 2: Resistant Participation

Five of the tea farmers fall into factor 2, which explains 12% of the total variance (Table 2). Such tea farmers strongly agreed that participating in the NTP cannot increase tea sale revenue (6, −2) (Figure 6b). They didn’t want to spend a lot of time and energy learning how to use technology and participating in the NTP, so they might as well go out to work and make money (11, 1) (22, 1) (45, 2). Tea Farmer 4 said: “I need to go out to work to earn more money to improve my family’s living standard. It is difficult to maintain my family’s livelihood by relying on tea income alone.” They strongly disagreed with the influence of subjective norms (43, −2) (23, −2). Tea Farmer 3 explained: “I have been growing tea for 30 years, and it is hard for other people’s opinions to influence me.” They also lacked the necessary equipment to participate in the NTP, such as an “office computer + scanner” or “smartphone + printer” (36, −2). Tea Farmer 8 said: “I only have a mobile phone, and the network signal is poor. I don’t have any other devices.” To sum up, such tea farmers strongly believed that the costs and risks of participating in the NTP far outweighed the benefits, and it was rather difficult for subjective norms to influence their perceptions. Consequently, such tea farmers showed the characteristics of resistant participation.

3.2.3. Factor 3: Risk Aversion

Factor 3 contains two tea farmers and they represented 10% of the overall variance (Table 2). Such tea farmers strongly supported participation in the NTP to reduce the adverse environmental impacts of tea cultivation (40, 2), and they were concerned about the risks of tea cultivation (5, −2) (Figure 6c). Tea Farmer 14 said: “I pay attention to environmental issues because I can also benefit from it. But I am more worried about the risks of tea cultivation, which directly affects my income.” Meanwhile, they believed that tea safety was the most basic step in food safety production (31, 2). In addition, tea farmers believed that the government supported their participation in the NTP (48, 1). They also had the funds to purchase equipment to participate in the NTP (37, 1). Tea farmer 16 said: “In recent years, I can feel that the government has formulated many policies for the development of tea.” However, they would not feel guilty if they did not participate in the NTP (15, −2). In brief, they could feel the benefits of participating in the NTP, including environmental and tea safety. Risk perception had a greater impact on their participation in the NTP. For this reason, these tea farmers showed the characteristic of risk aversion.

3.2.4. Factor 4: Being Pressure-Driven

Factor 4 explains 9% of the total variance and two tea farmers’ viewpoints fell into this category (Table 2). Such tea farmers strongly believed that the cost of participating in the NTP was too high (1, 2). They felt that the government did not support their participation in the NTP (48, −2) (Figure 6d). They also felt no obligation (30, −2) and no confidence to participate in the NTP (24, −2). Tea Farmer 6 explained: “If I participate in the NTP, I need to pay for the related equipment. I feel that the government should bear these costs.” Meanwhile, if neighbors were willing to participate in the NTP, they were also willing to try it (18, 2). They strongly agreed that participation in the NTP was a matter of social pressure (29, 2). Tea Farmer 12 said: “If all the neighbors participated, I would also participate.” In addition, they believed that participating in the NTP cannot improve the quality and safety of tea (7, −2). They also disagreed with raising awareness of tea farmers’ participation in the NTP in order to ensure tea safety (12, −2). In summary, such tea farmers were greatly affected by social pressure, and policies also affected their behavioral choices. Thus, these tea farmers have the characteristic of being pressure-driven.

3.2.5. Consensus Statements

Consensus statements are those that do not distinguish between factor differences. Seven of the 48 statements were consensus statements (Table 3), and all were significant at the 5% level. Tea farmers supported the relevant measures of the NTP, and they also believed that participating in the NTP would make tea sales more convenient. If the conditions were right, they would consider participating in the NTP. Moreover, tea farmers believed that participating in the NTP did not necessarily improve the efficiency of tea planting, but that it might increase the cost of planting. The probable reason was that the NTP was new to most tea farmers, and they all felt that participation might bring certain risks. In addition, tea farmers did not believe that agricultural technicians supported their participation in the NTP. Tea Farmer 11 explained: “Nowadays, we rarely see agricultural technicians; it is difficult to get help from them.”

3.3. Robustness Check

Table 4 lists the Fisher discriminant analysis results. The discriminability of Function 1 is statistically significant, which confirms that there is a significant difference between categories. The eigenvalue of Function 1 is 79.43, the variance is 93%, and the correlation coefficient is positive and relatively large (0.99). The statistical significance of each discriminant function was evaluated according to Wilks’ Lambda. The range of this parameter is 1.0 (no discrimination) to 0 (perfect discrimination). The Wilks’ Lambda values of Function 1 and Function 2 are 0 and 0.07, respectively, which means that there are significant differences between different categories of tea farmers.
Figure 7 plots the grouping of Functions 1 and 2, using their discriminant coefficients as coordinates for all tea farmers. It is easy to see that the classification results show smaller within-group distances and larger inter-group distances. Therefore, it can be stated that the results obtained by the Q-factor analysis are robust. That is, the Q-factor analysis can effectively predict and classify the perception of small-scale tea farmers for the NTP.
Table 5 shows the classification results of discriminant analysis. Through the prediction of the discriminant function, we find that all observations can be effectively predicted. That is, the classification results of tea farmers obtained by the Q analysis are the same as those obtained by discriminant analysis. Therefore, 100% of the original group of tea farmers are correctly classified.
It is noteworthy that this study developed the initial Q sample based on an extensive literature review, and subsequently invited four experts and doctors to provide comments and suggestions to improve the initial Q sample. Therefore, this study adequately addressed the content validity requirements. Moreover, each step of this study, from the identification of Q samples and selection of P sets to Q sorting and factor analysis, strictly follows the standard procedure of Q methodology, and thus the reliability of this study is ensured. Finally, if a future study investigating a larger population revealed other perspectives, the results would strengthen, rather than weaken, the results of this study, as the future study further demonstrates the large variance of opinions in the population.

4. Discussion

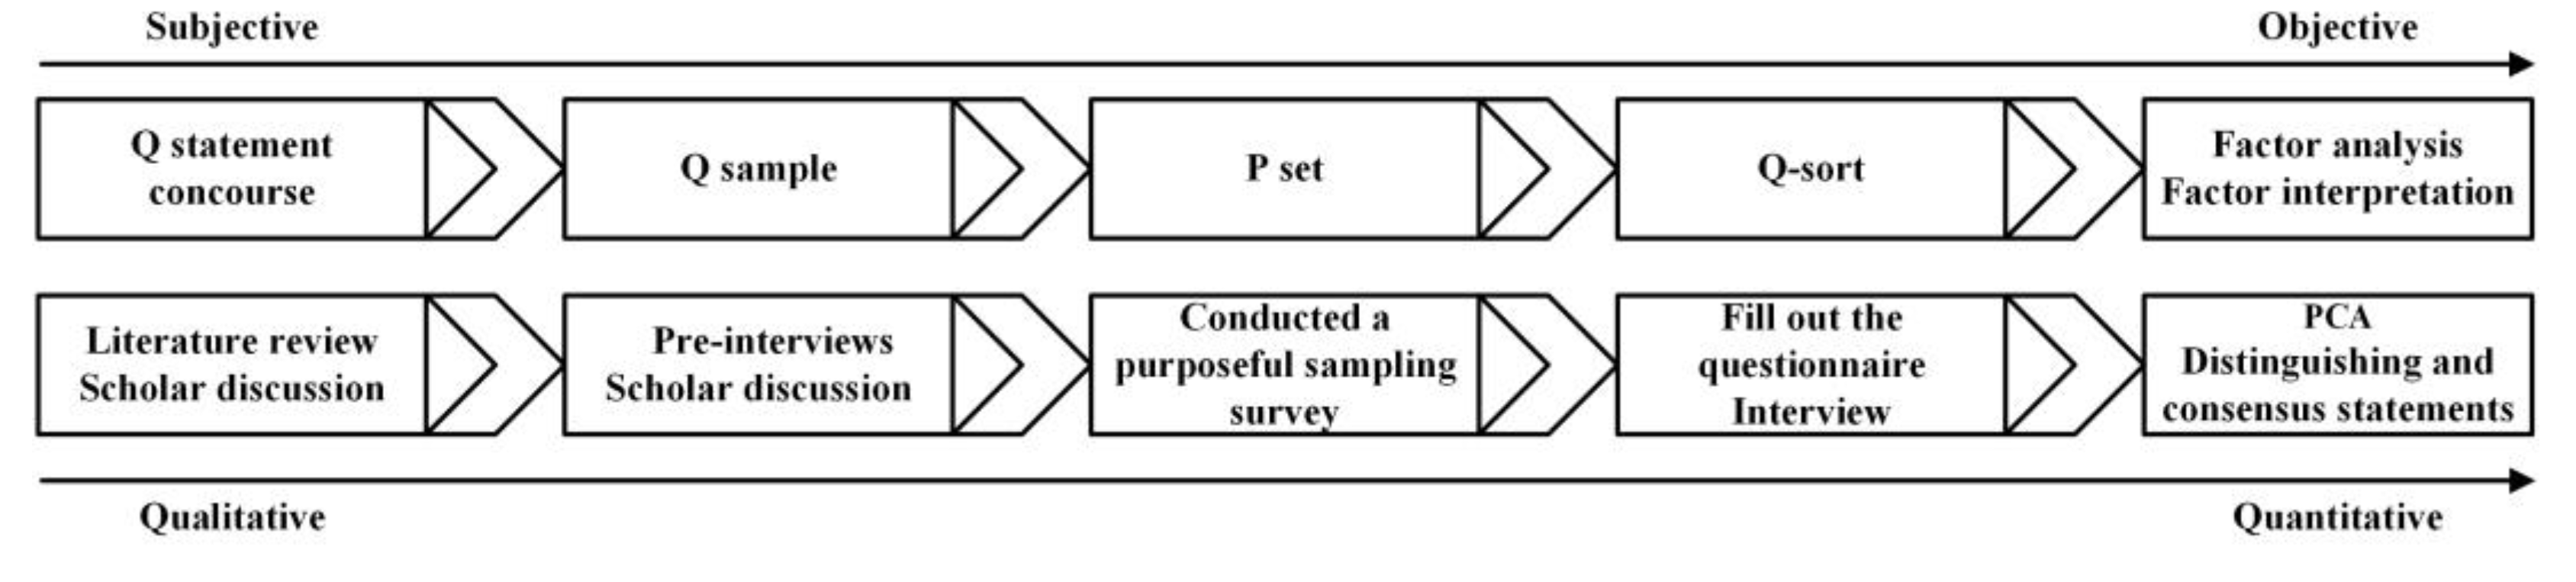
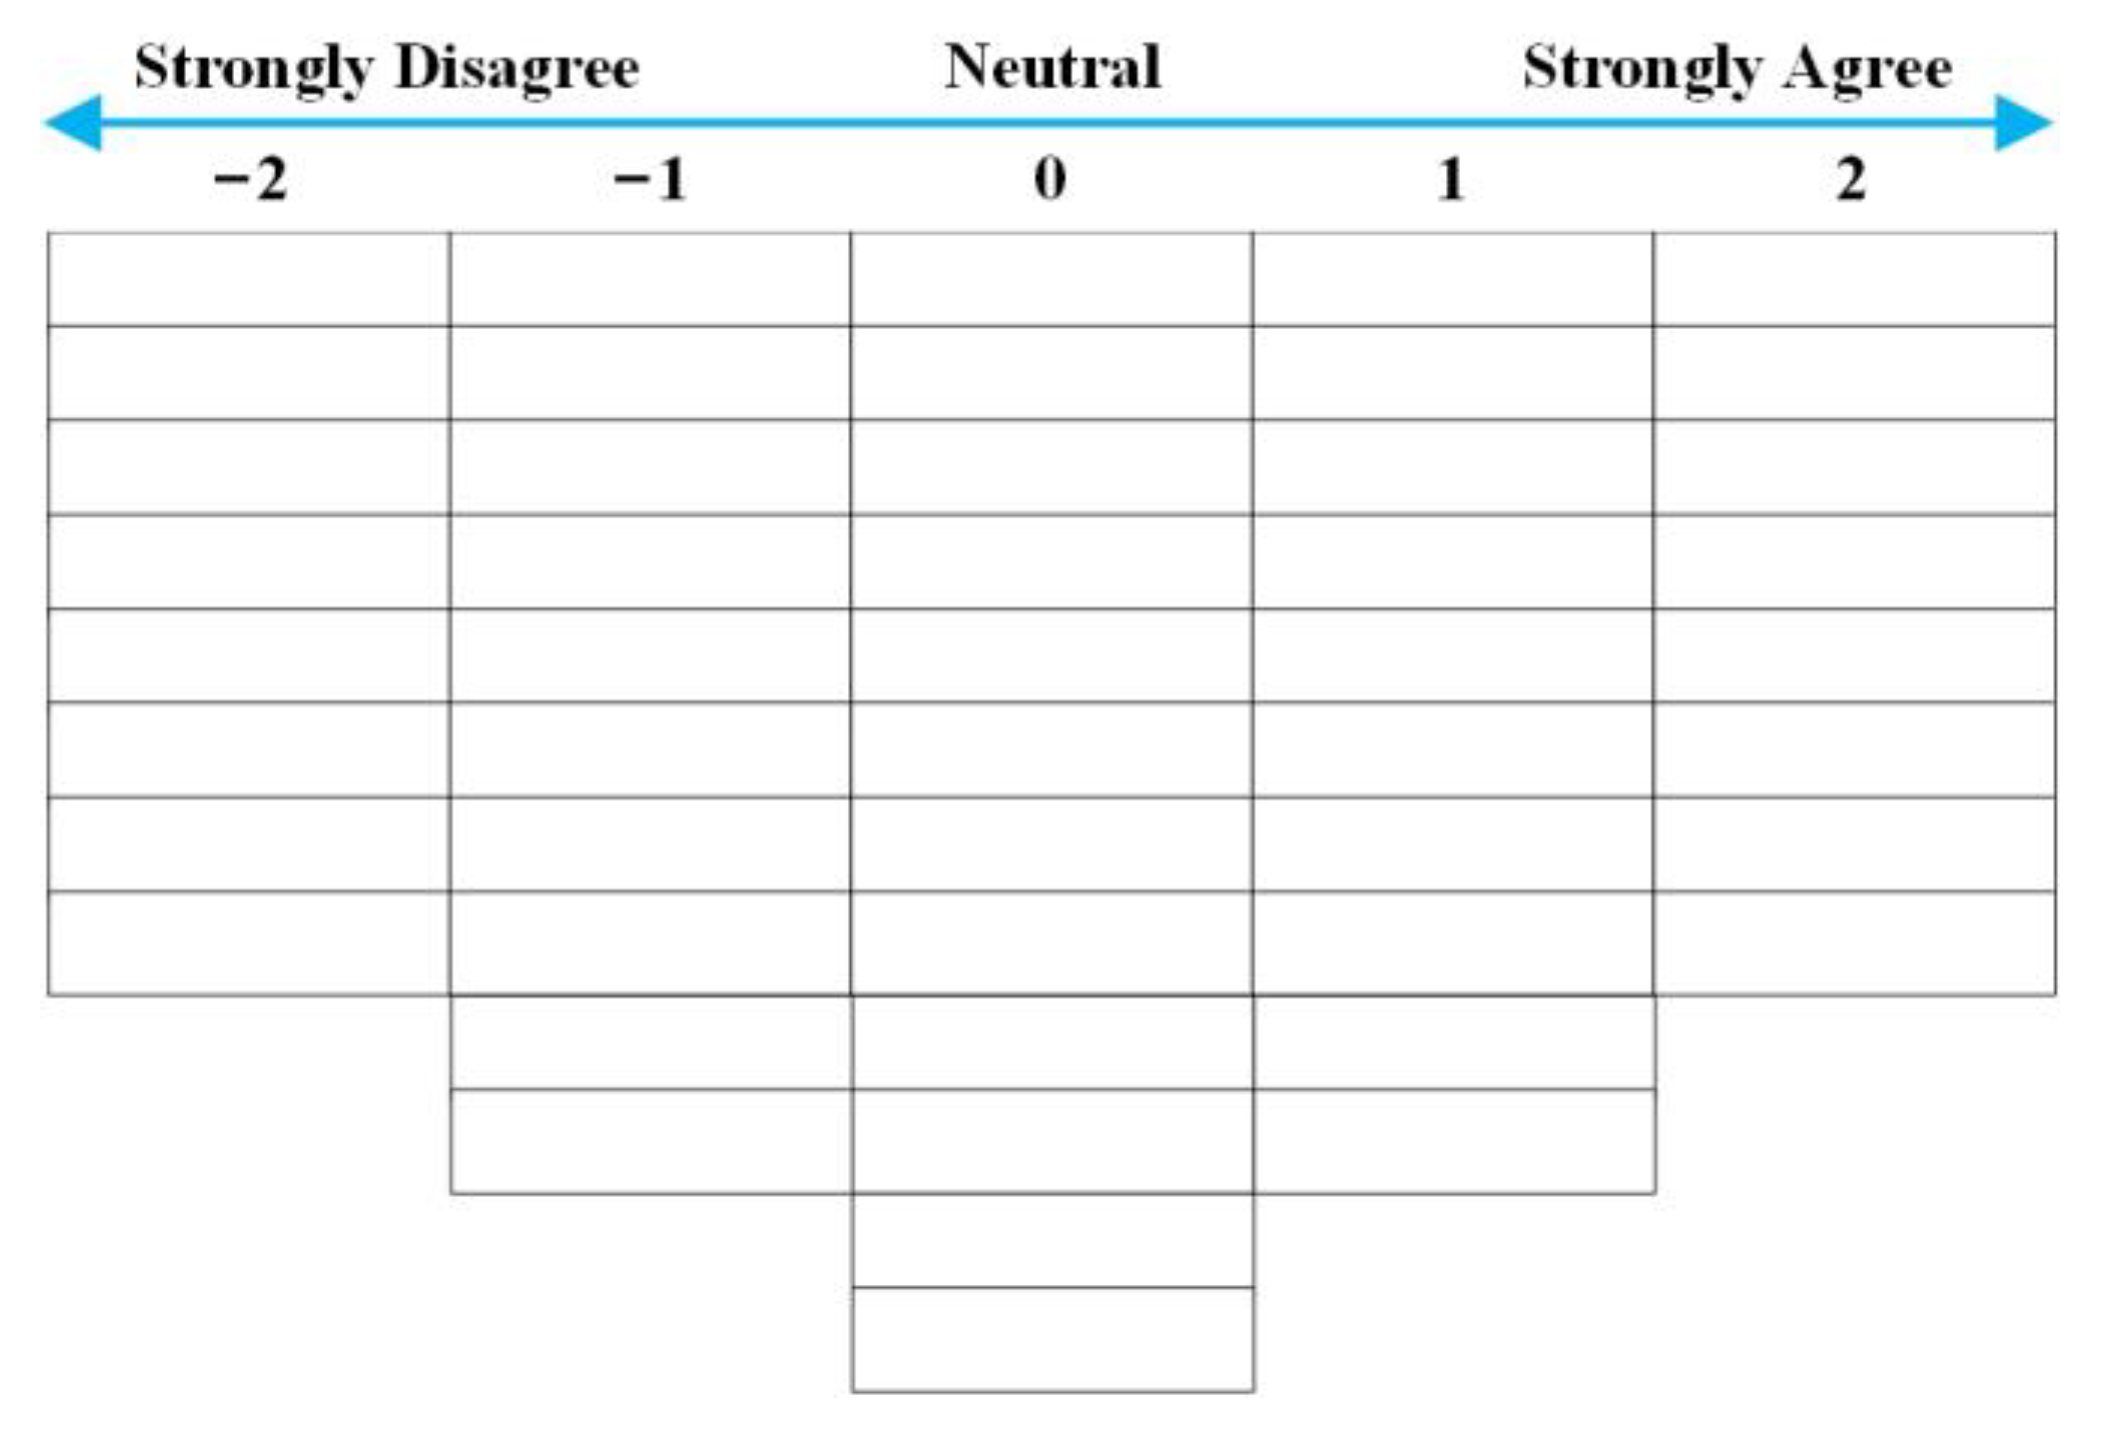
The Q methodology can be a useful method for answering the question “What are farmers’ real perceptions of the NTP”? Not only did we reveal the perception of difference and similarity among small-scale tea farmers, but we also overcame the limitations of qualitative and quantitative methods in studying farmers. In the context of agricultural safety, we believe that the Q methodology can add color to research in the area of farmer perception.
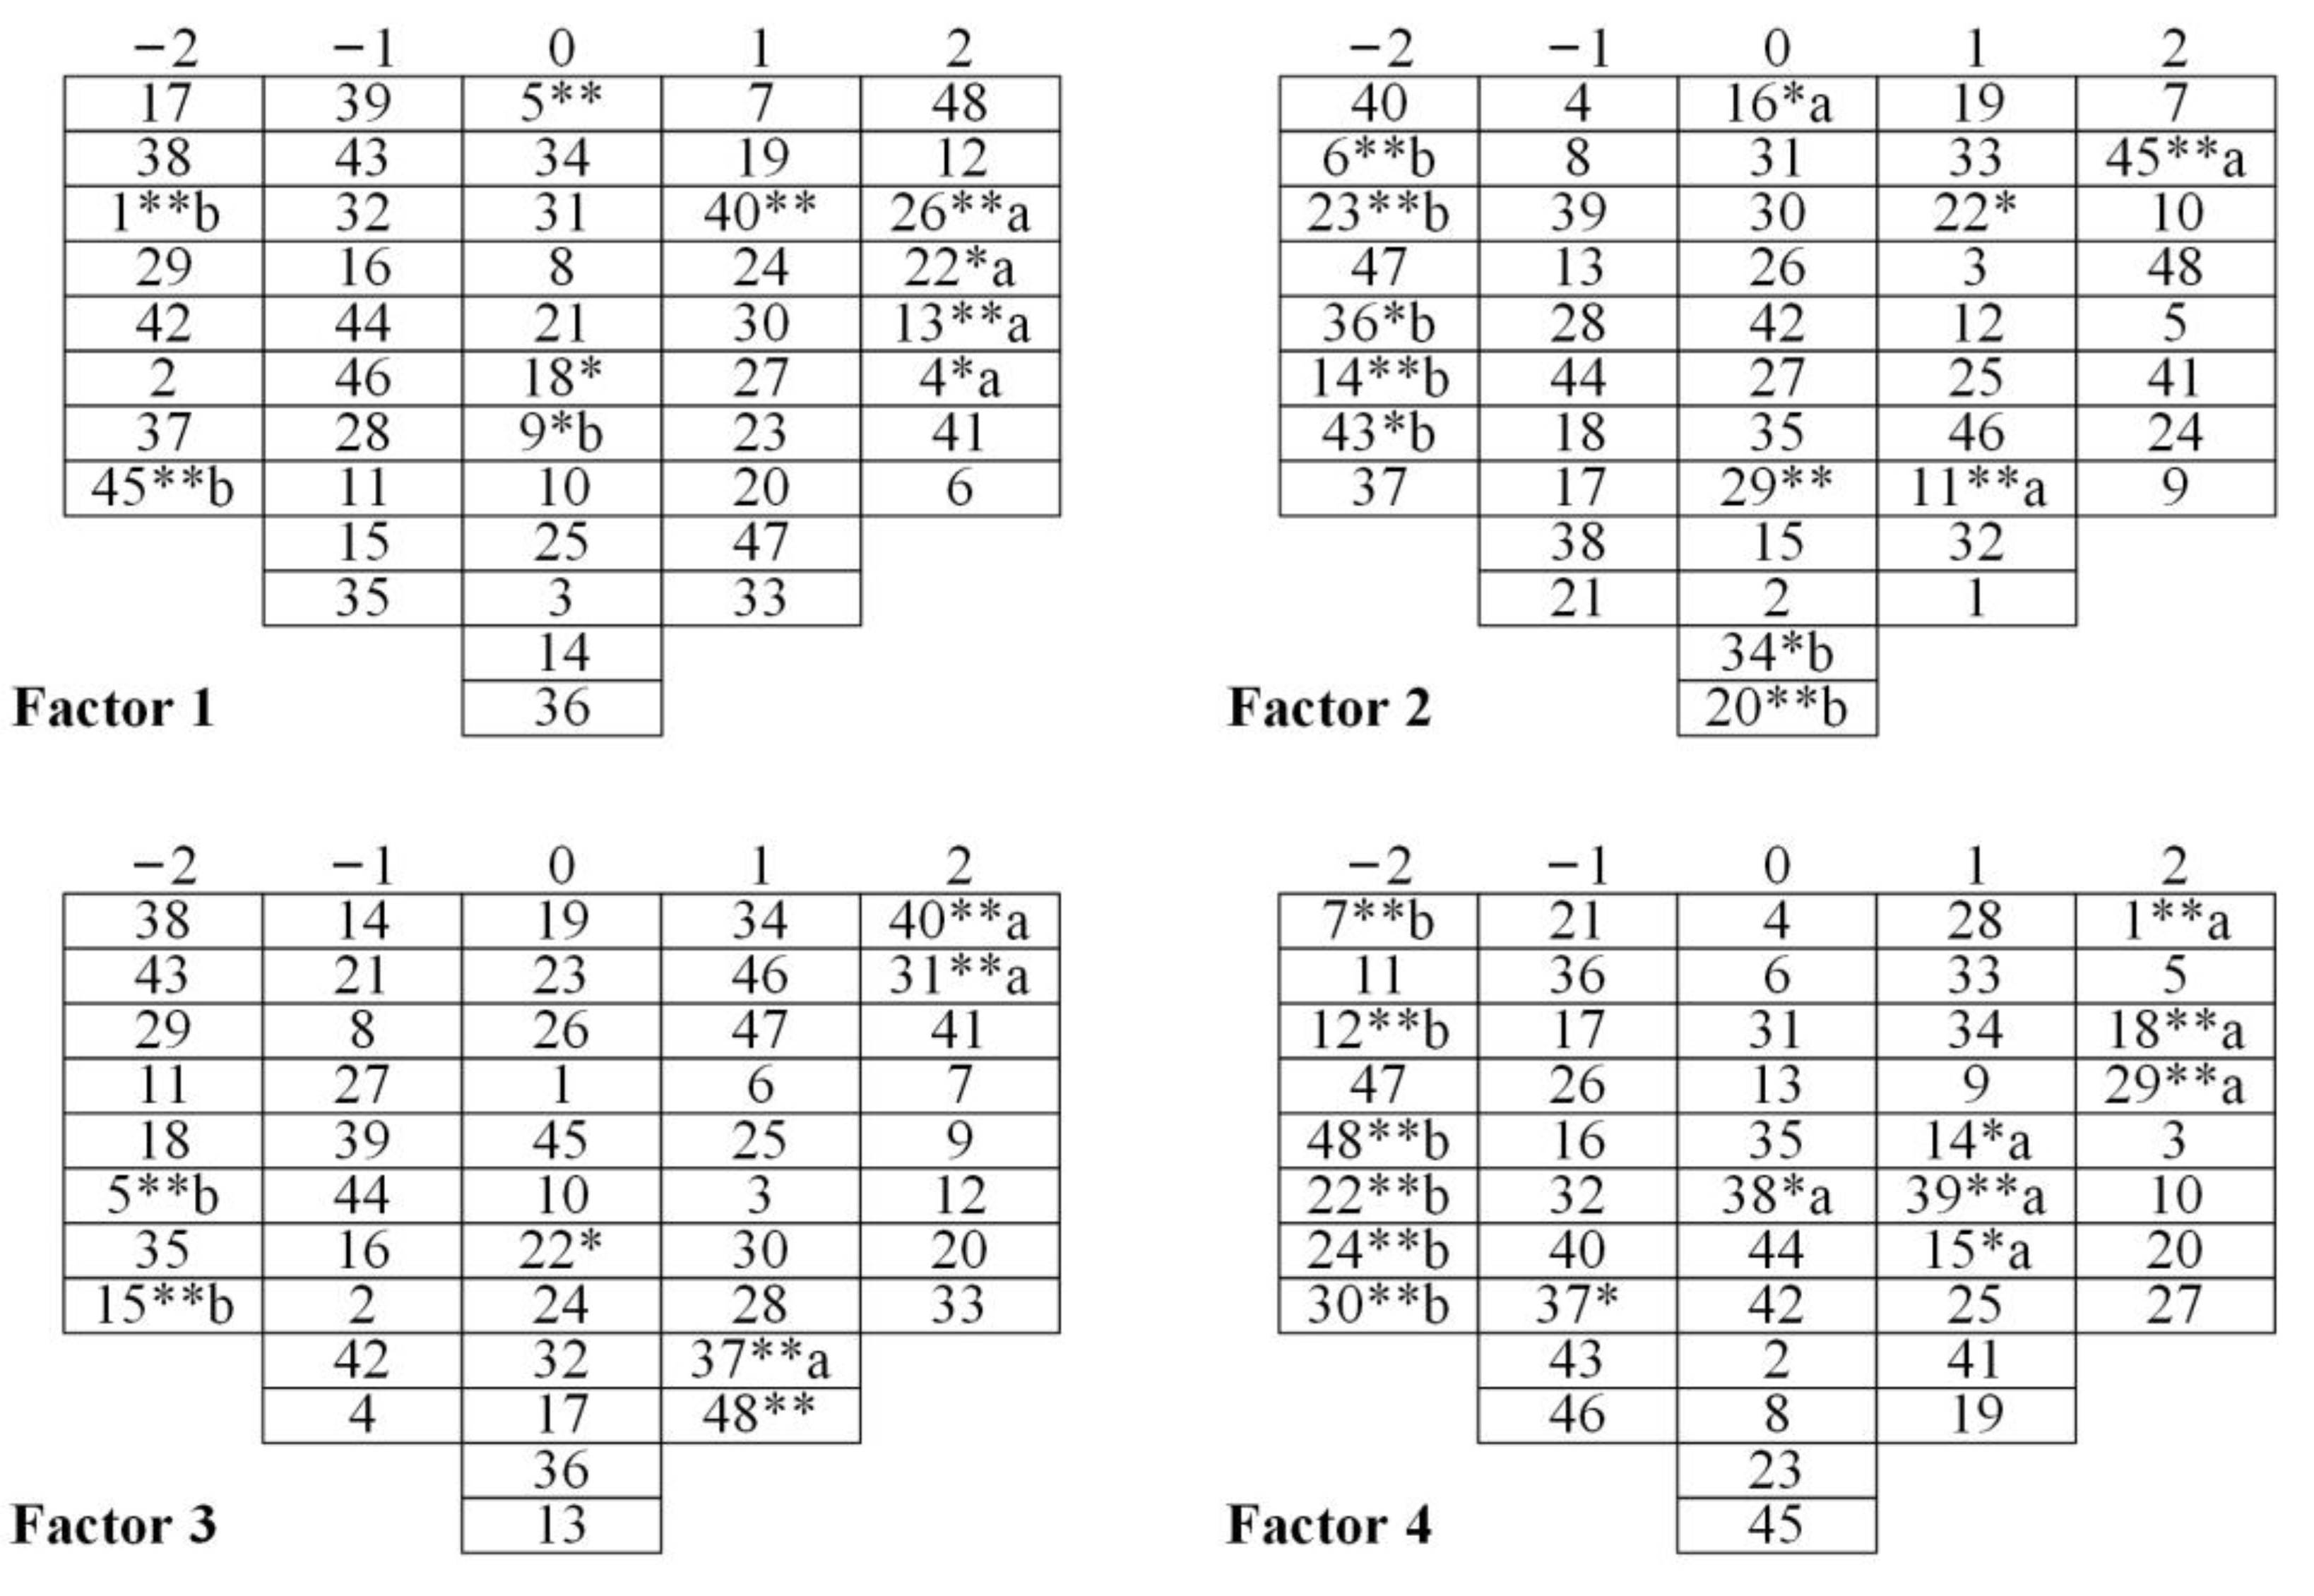
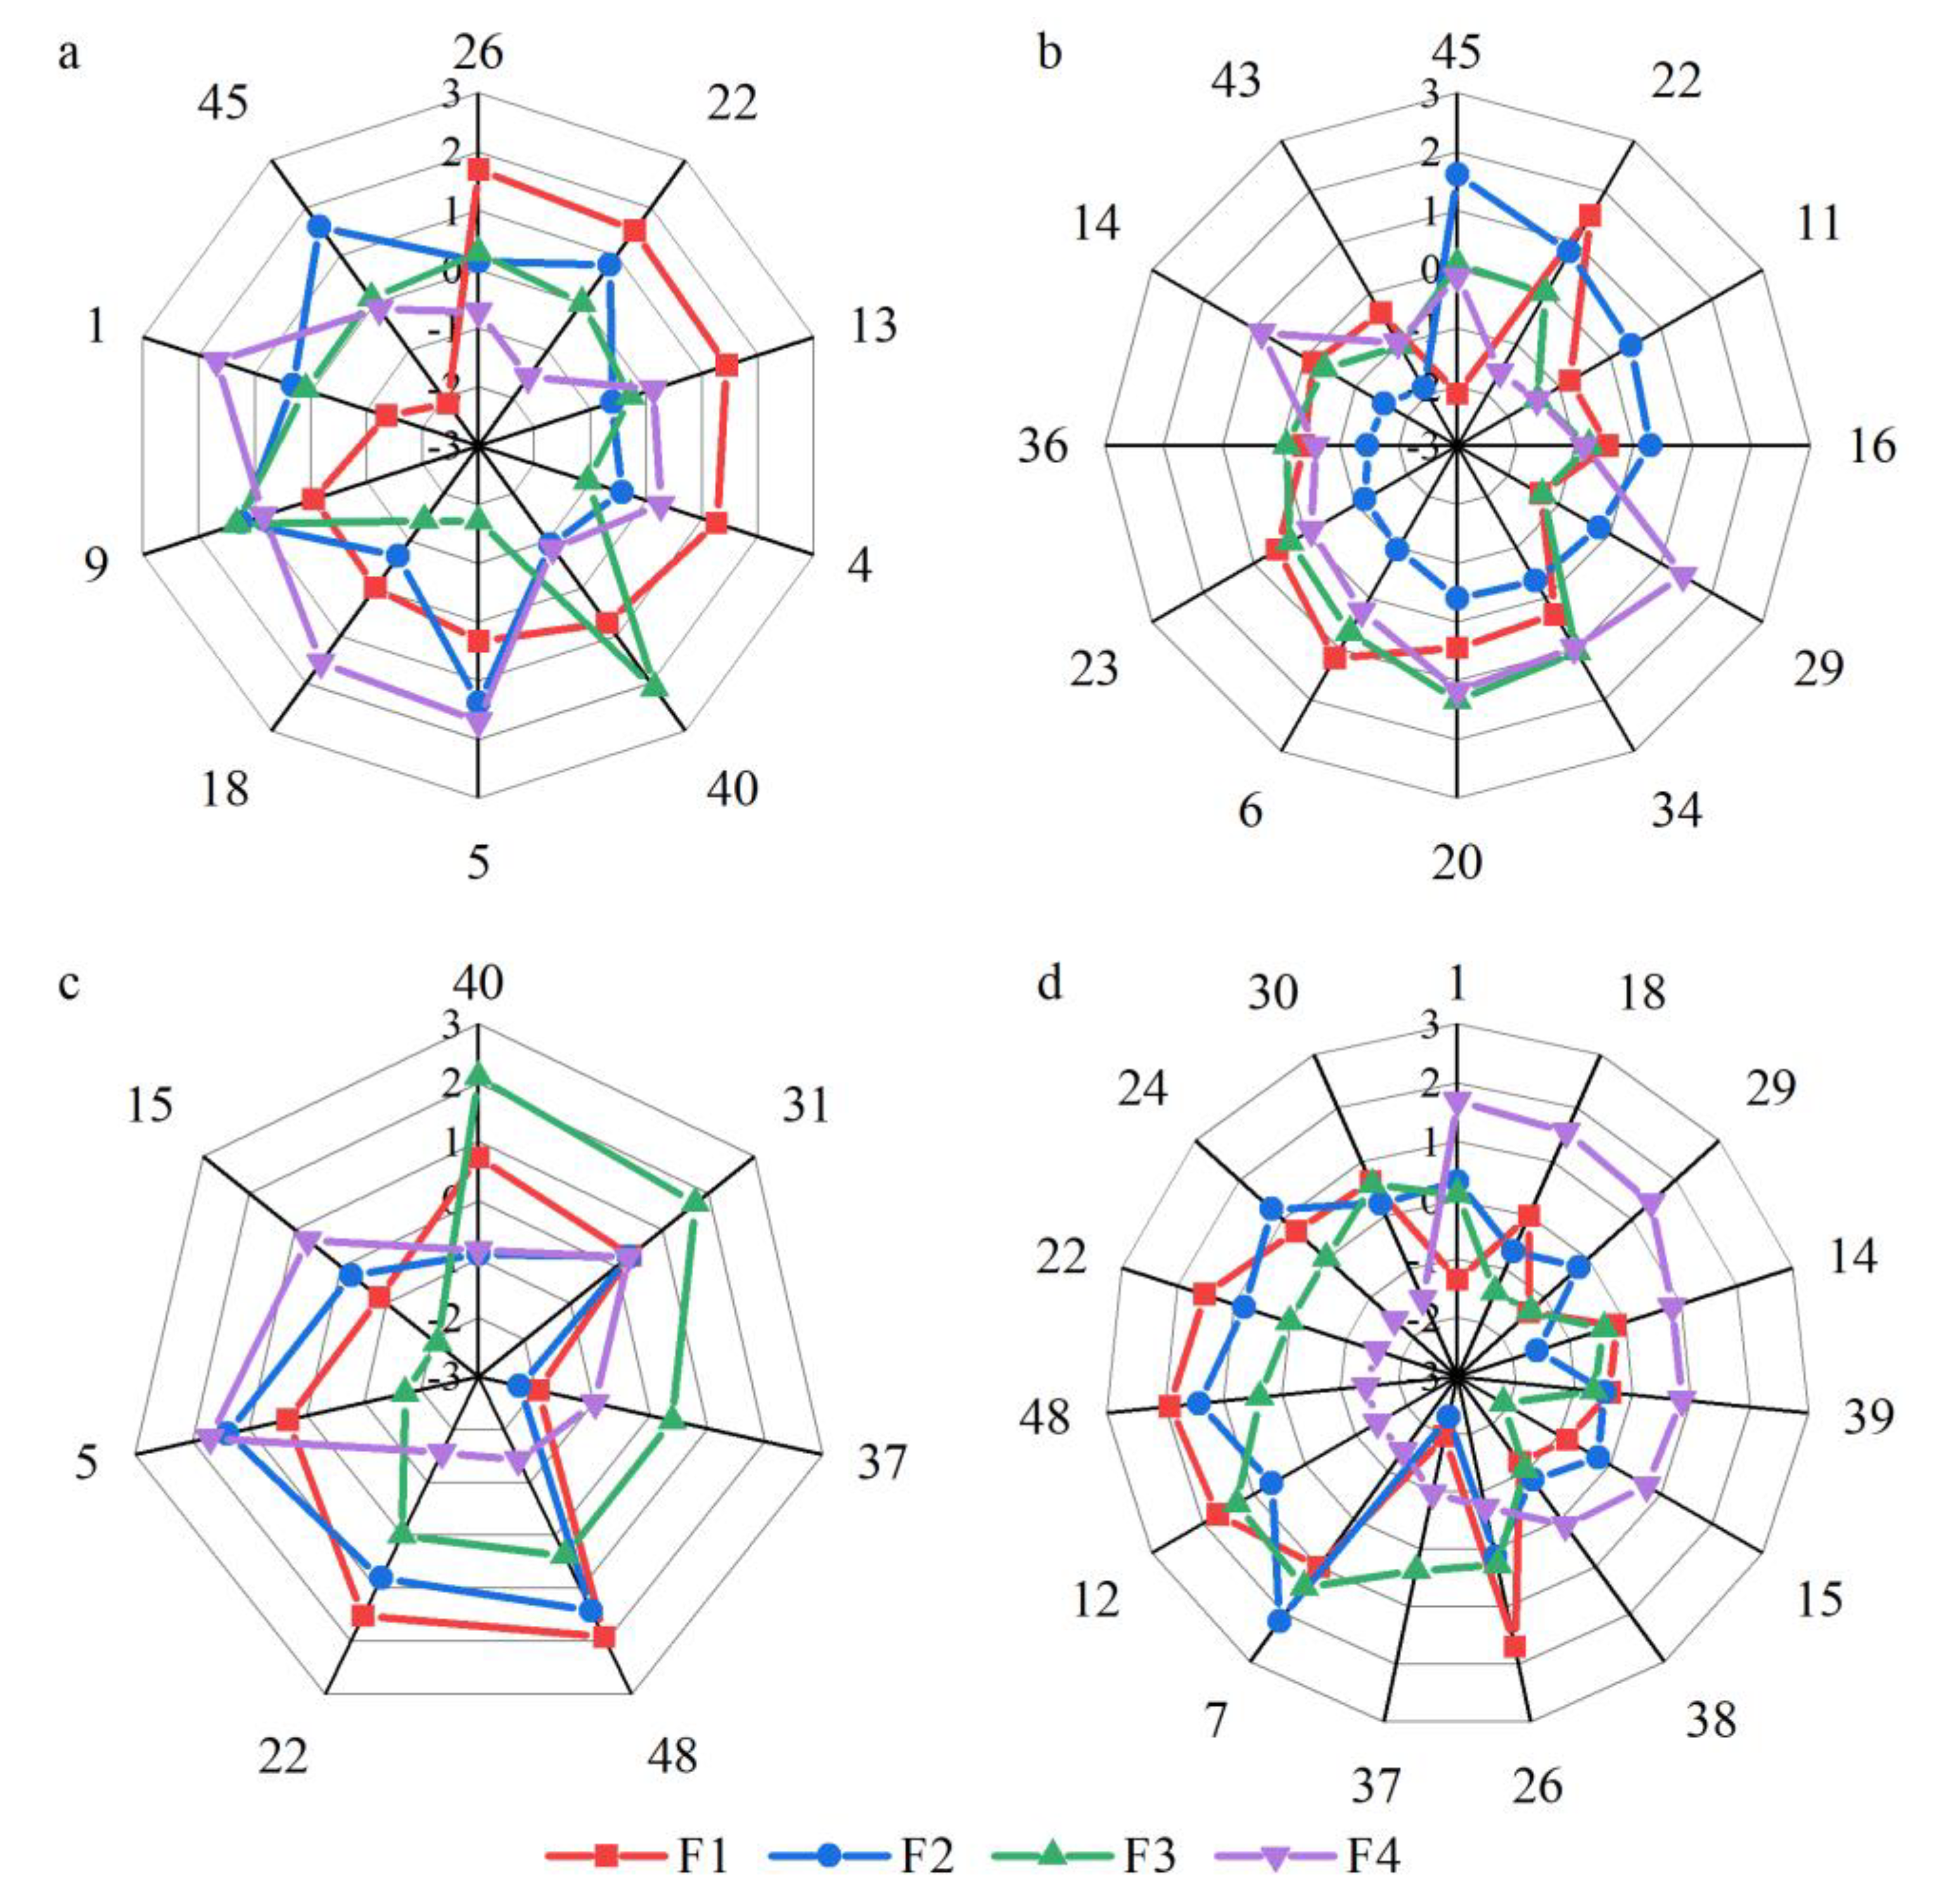
By analyzing the Q-factor results, we identified four different categories of tea farmers, representing their different perceptions of the NTP. Four categories of tea farmers explained 52% of the total variance, and the related findings of Kroesen and Bröer [64] and Krabbenborg et al. [65] had an explanatory power of 49% and 40%, respectively. Therefore, we considered the findings to be credible. Research showed that there are perceptual differences among small-scale tea farmers, which was consistent with Oyinbo et al. [66], who also acknowledge significant heterogeneity among farmers. Meanwhile, on some specific issues, tea farmers have similar perceptions.
The first category of tea farmers were those characterized by active participation. They are willing to bear the cost and put their time and energy into the NTP. Farmers believed that there was a cost to adopting new agricultural technologies. They would, therefore, invest in it only if the expected benefits outweighed the costs [67]. In fact, tea production faced many challenges, including price fluctuation, climate change, and cultivation risks [22,68]. For small-scale tea farmers, participating in the NTP was a strategic choice, which might reduce planting costs and grant access to a broader market. They believed that it took a long time to learn relevant knowledge and technology simultaneously. The survey found that local tea farmers rarely understood the NTP; thus, they needed to learn how to use it.
The second category of tea farmers were those who engaged in resistant participation. They did not want to spend time and energy on the NTP but to go to work and make money instead. This result is also confirmed by Li et al. [69], who showed that tea farmers face cost risk, time risk, and opportunity risk. With the rapid development of the social economy, a large part of the income of rural households comes from other employment rather than agricultural production [70]. This is also one of the main reasons why tea farmers were reluctant to participate in the NTP. Meanwhile, it was difficult for subjective norms to affect the perception of tea farmers. Such perceptions being external and self-perception being internal, the impact of self-perception was more direct. Farmers relied on their previous experience in managing production [67]; thus, it was difficult for subjective norms to influence their long-term beliefs.
The third category of tea farmers were those who were risk-averse. They could see the benefits of participating in the NTP, including environmental improvements and tea safety. Li et al. [69] argued that perceived benefits can more strongly influence farmers’ adoption of agricultural technologies through positive recognition of the perceived value. This might increase their willingness to participate in the NTP and focus on consumer health. But tea farmers were more worried about planting risks. Most farmers were risk-averse [71]. Because of the conflict between economic goals and environmental goals, they felt no guilt for not participating in the NTP. This showed that tea farmers’ perception of the NTP was only superficial as it had not been fully understood and accepted.
The fourth category of tea farmers were those who were pressure-driven. They were strongly influenced by social pressure. Kallgren et al. [72] argued that individuals followed social norms because they not only feared social pressure but also used it as a source of information to understand which behavior is appropriate in a particular situation. Thus, social norms played a key role in farmer technology adoption [73]. The more positively tea farmers evaluated the NTP, the higher their willingness to participate would be. Furthermore, they did not have the confidence to participate in the NTP. Ajzen [74] found that people’s behavior was strongly influenced by their self-confidence. A possible reason for this was that farmers lacked confidence in understanding and using new technologies due to the lack of effective policy support [75].
Furthermore, tea farmers had similar views on some specific issues. For example, they were all concerned that participating in the NTP might increase the cost of tea cultivation. Lou et al. [76] believed that tea farmers were affected by realistic uncertainties and past habits when adopting agricultural technologies. They were all small-scale growers and had no experience participating in the NTP. If they participated in the NTP, they needed to consider its potential risks, future benefits, and opportunity costs from traditional to standard tea cultivation. Unlike food crop production, tea cultivation was rarely subsidized by the government, which made it less resilient to risks. Tea farmers also felt that they were not supported by agricultural technicians. Diaz et al. [77] argued that the opinions, views, and comments of agricultural technicians were important to farmers, which would influence their adoption and decision-making. As far as we know, local technology promotion efforts were low, and it was difficult for tea farmers to directly refer to the opinions of agricultural technicians.
The recently amended Law of the People’s Republic of China on Quality and Safety of Agricultural Products will implement traceability management for agricultural products listed in the Agricultural Products Quality and Safety Traceability Catalogue. Meanwhile, the protection and management of geographical indication agricultural products will be strengthened. This shows that traceability of agricultural products is indeed the urgent issue at present.

5. Conclusions

This study provides a new contribution to the promotion of the NTP. We have focused all our attention on the perceptions of small-scale farmers, and the findings could provide new evidence for the debate on the NTP. Meanwhile, new perspectives and insights on the subject are provided for policy makers to rethink the promotion policy of the NTP. In addition, we encourage action to prevent the negative impact of the promotion of the NTP on farmers.
There is an increasing amount of research on the NTP in various areas, but not much effort seems to have been made on the farmer side. The NTP are an important means of ensuring the safety of agricultural products. Farmers are both producers and direct participants in the NTP. Farmers’ perception of the NTP is a prerequisite for their adoption. Due to a lack of understanding of farmers’ perceptions, policy makers may have adopted the wrong extension policies.
This study of small-scale Chinese tea farmers’ perceptions of the NTP further expands the scope of research on farmer behavior. The study shows that there are four categories of tea farmers with different characteristics, including active participation, resistant participation, risk aversion, and driven by pressure, and each category contains tea farmers with very similar perceptions. The first category can actively bear the cost; thus, they should be the first to participate in the NTP. The traditional perception of the second category is difficult to change in the short term, so they may be the last category of participants. The third category may participate in the NTP if planting risks can be reduced. Under social pressure, the fourth category may also participate in the NTP. Although there is significant heterogeneity in the perceptions of tea farmers, some commonalities are also highlighted. They all worry that participating in the NTP may increase planting costs and risks, and find it rather difficult to get support from agricultural technicians. Therefore, understanding the different perceptions of tea farmers is a prerequisite for formulating precise policies. Our findings can serve as the basis for the promotion of the NTP in the agricultural sector.

Recommendations and Study Limitations

Planning should be based on an overall perspective and implement tailored policies. For the first category of tea farmers, we suggest carrying out platform operation training from the perspective of meeting the needs of tea farmers, formulating training programs scientifically, and improving the pertinence and timeliness of the training offered. Self-service learning platforms and technical support should also be provided to improve the ability of tea farmers to master the business processes, system functions, and related operations of the NTP. For the second category, the government widely publicize the application progress and effectiveness of the NTP through various forms, including online and offline formats. It is also necessary to popularize traceability knowledge and cultivate traceability culture more deeply to positively influence the cognitive structure of tea farmers. For the third category, we recommend holding regional expositions and promotion meetings to publicize and display traceable products so as to increase the awareness of tea farmers about traceable products. The government can also actively promote the entry of tea into large supermarkets and e-commerce and promote the connection between production and sales of high-quality tea in order to increase the enthusiasm of tea farmers to participate in the NTP. For the fourth category, we recommend strengthening policy support, especially in terms of increasing funds to subsidize the necessary equipment expenditures for tea farmers to participate in the NTP. Policies should also support the establishment of standard tea gardens that demonstrate the use of the NTP to increase tea farmers’ awareness of the NTP. In addition, the government should exert the appeal and influence of large-scale tea farmers to enhance their confidence in participation as well. Finally, for all tea farmers, we suggest using a variety of ways to help them understand and recognize the benefits of the NTP, including the agricultural sector, NGOs, and agricultural colleges. The government can also consider establishing a risk compensation and price guarantee mechanism for tea traceability to reduce planting risks and promote steady growth in the income of tea farmers.
Although we conducted a purposeful survey of small-scale tea farmers, it was still difficult to ensure that all tea farmers’ perceptions of the NTP were explored. The study may have missed some points, such as two tea farmers who did not belong to any of the four categories outlined in this study. We should also acknowledge some limitations. First, there were few participants. Future studies could increase the sample size to include farmers at different times and levels of participation. Moreover, since this study focuses on perceptual identification, follow-up studies could also conduct quantitative surveys to assess the perceptual distribution and driving factors. Furthermore, this study takes tea farmers in Xinyang City as an example, and the applicability of the findings to farmers of different crops and in different regions is unclear. Future research can, therefore, expand the scope of study to different types of farmers and add more samples with different regional attributes. Eventually, future research should also be extended to other stakeholders to explore their perceptions.

Author Contributions

Conceptualization, W.J. and Y.H.; methodology, Y.H.; software, Y.H.; validation, Y.H., H.L. and X.G.; formal analysis, Y.H.; investigation, Y.H., H.L. and X.G.; resources, W.J.; data curation, Y.H.; writing—original draft preparation, Y.H.; writing—review and editing, W.J.; visualization, Y.H.; supervision, W.J.; project administration, W.J.; funding acquisition, W.J. All authors have read and agreed to the published version of the manuscript.

Funding

This research was funded by the National Natural Science Foundation of China, grant number 41601112.

Informed Consent Statement

Informed consent was obtained from all subjects involved in the study.

Data Availability Statement

The data presented in this study are available on request from the corresponding author.

Conflicts of Interest

The authors declare no conflict of interest.

Appendix A

Table A1. Demographic characteristics of pre-interviewed tea farmers.
No.GenderAgeMarital StatusEducation LevelPlanting YearsHousehold SizeTea Garden Area (mu)Number of EmployeesWhether to Join a CooperativeAre you Engaged in other EmploymentAnnual Household Income
(Thousand US Dollars)
1Male30MarriedCollege and above10760NoYes7.142
2Female30MarriedMiddle school2322NoYes4.285
3Female34MarriedCollege and above20550NoYes1.428
4Male34MarriedMiddle school6623YesNo4.285
5Female37MarriedCollege and above20750NoYes14.285
6Male49MarriedMiddle school203100NoYes17.142
7Male50MarriedHigh school20431NoYes7.142
Table A2. The basic characteristics of tea farmers by factors.
CharacteristicDescriptionF1F2F3F4
GenderMale2412
Female3110
Mean of personal characteristicAge (years)37.841.83339
Planting years1818.48.521.5
Household size4.6545
Number of employees00.82.50
Annual household income (Thousand US dollars)12.417.65.312.1
Tea garden area (mu)6.67.637.5
Marital statusUnmarried1011
Married4511
Education levelPrimary school0000
Middle school1121
High school1200
College and above3201
Join a cooperative 0001
Engaged in other employment 5521
Table A3. Q-sort value and Z-score for four factors.
No.StatementF1 SVF1_Z-ScoreF2 SVF2 Z-ScoreF3 SVF3 Z-ScoreF4 SVF4 Z-Score
1The cost of participating in the NTP is too high−2−1.35 **10.3200.1021.69 **
2The benefits of participating in the NTP are not enough to offset the costs−2−1.580−0.33−1−0.950−0.13
3Participating in the NTP is valuable to me0−0.1510.7110.5721.18
4Participating in the NTP is consistent with my principles, values and beliefs21.26 *−1−0.44−1−1.0500.26
5Participating in the NTP can reduce the risk of tea cultivation00.33 **21.38−2−1.72 **21.69
6Participating in the NTP can increase the sales revenue of tea21.17−2−0.96 **10.6700.26
7Participating in the NTP can improve the quality and safety of tea11.0122.1521.43−2−1.43 **
8Participating in the NTP can improve the efficiency of tea cultivation00.26−1−0.48−1−0.570−0.13
9Participating in the NTP enables tea to be sold to the national market0−0.05 *21.2521.3310.84
10Participating in the NTP is an inevitable trend of future development0−0.0921.5900.0021.18
11Participating in the NTP requires a lot of time and effort to focus on relevant information−1−0.7910.41 **−2−1.43−2−1.43
12Tea safety is a key issue and I need to raise awareness to participate in the NTP21.7010.6421.33−2−1.43 **
13I will consider the opinions of my neighbors when participating in the NTP21.44 **−1−0.610−0.2900.13
14Participating in the NTP, I feel like being a better person0−0.17−2−1.57 **−1−0.3810.84 *
15I would feel guilty if not participating in the NTP−1−0.840−0.24−2−2.10 **10.72 *
16The functionality of the NTP is clear and I can easily remember how to operate it−1−0.4400.28 *−1−0.76−1−0.84
17Even if the cost of tea cultivation increases, I will participate in the NTP−2−1.06−1−0.800−0.10−1−0.72
18If neighbors participate in the NTP, I am also willing to try it0−0.01 *−1−0.67−2−1.4321.56 **
19If the conditions are right, I intend to participate in the NTP10.9311.1500.2910.46
20Social media publicity has had an important impact on my participation in the NTP10.440−0.40 **21.3321.18
21With simple training, I can easily participate in the NTP00.06−1−0.85−1−0.38−1−0.59
22I will spend a long time learning the relevant knowledge and technology of the NTP21.52 *10.81 *00.00 *−2−1.56 **
23My family encouraged me to participate in the NTP10.54−2−1.18 **00.290−0.13
24I have enough confidence to participate in the NTP10.6921.2500.00−2−1.56 **
25I will participate in the NTP0−0.1110.5610.6710.72
26I will continue to pay attention to the development trend of the NTP21.70 **00.1300.29−1−0.72 *
27I will be influenced by agricultural technicians and participate in the NTP10.5600.00−1−0.5721.18
28I think it will be easy to participate in the NTP for tea sales−1−0.75−1−0.6210.3810.97
29I think participation in the NTP is a social pressure−2−1.370−0.22 **−2−1.3321.43 **
30I am obliged to participate in the NTP10.6300.2210.57−2−1.56 **
31Paying attention to tea safety issues and participating in the NTP are the most basic steps in food safety production00.3000.2721.72 **00.26
32Participating in the NTP requires more capital investment−1−0.3910.3700.00−1−0.84
33Participating in the NTP will make tea sales more convenient10.3911.1421.0510.97
34Participating in the NTP for tea sales can save time00.320−0.34 *11.0510.97
35I would like to participate in NTP in the future−1−0.980−0.12−2−1.7200.13
36I have the essential resources to participate in the NTP (“office computer + scanner” or “smartphone + printer”)0−0.39−2−1.47 *0−0.10−1−0.59
37I have funds to purchase equipment for the NTP−2−1.96−2−2.2910.38 **−1−0.97 *
38I have the ability to grow, produce and sell tea in accordance with the requirements of the NTP−2−1.20−1−0.82−2−1.0500.13 *
39I should encourage other farmers to participate in the NTP−1−0.39−1−0.49−1−0.6710.84 **
40I support participation in the NTP to reduce the adverse environmental impact of tea cultivation10.73 **−2−0.9222.10 **−1−0.84
41I support the relevant measures of the NTP21.2021.3821.7210.72
42Tea is a proper agricultural product to participate in NTP−2−1.5000.04−1−0.9500.00
43Consumers think I should participate in the NTP−1−0.39−2−1.87 *−2−1.05−1−0.97
44Agricultural technicians supported me to participate in the NTP−1−0.69−1−0.63−1−0.6700.13
45I would rather go out to work to make money than spend time and energy on the NTP−2−2.12 **21.61 **00.100−0.13
46I would recommend it to others when participating in the NTP−1−0.7110.4910.76−1−0.97
47The government has supportive policies for participating in the NTP10.39−2−1.2810.76−2−1.43
48The government supports me to participate in the NTP21.9221.4210.38 **−2−1.43 **
Note: * Distinguishing statement at p < 0.05; ** Distinguishing statement at p < 0.01.

References

  1. Xing, L.; Zhang, H.; Qi, R.; Tsao, R.; Mine, Y. Recent Advances in the Understanding of the Health Benefits and Molecular Mechanisms Associated with Green Tea Polyphenols. J. Agric. Food Chem. 2019, 67, 1029–1043. [Google Scholar] [CrossRef] [PubMed]
  2. Chang, K. World Tea Production and Trade: Current and Future Development. Food and Agriculture Organization of the United Nations Website. Available online: http://www.fao.org/3/a-i4480e.pdf (accessed on 22 October 2021).
  3. Debnath, B.; Haldar, D.; Purkait, M.K. Potential and sustainable utilization of tea waste: A review on present status and future trends. J. Environ. Chem. Eng. 2021, 9, 106179. [Google Scholar] [CrossRef]
  4. Abbasi, E.; Yousefi, M.H.; Hashemi, S.; Hosseinzadeh, S.; Ghadimi, A.H.; Safapour, M.; Azari, A. Aflatoxin B1 and heavy metals in imported black tea to Bushehr, southern Iran; Contamination rate and risk assessment. J. Food Compos. Anal. 2022, 106, 104277. [Google Scholar] [CrossRef]
  5. Mannani, N.; Tabarani, A.; Abdennebi, E.H.; Zinedine, A. Assessment of aflatoxin levels in herbal green tea available on the Moroccan market. Food Control 2020, 108, 106882. [Google Scholar] [CrossRef]
  6. Deka, N.; Goswami, K. Economic sustainability of organic cultivation of Assam tea produced by small-scale growers. Sustain. Prod. Consum. 2021, 26, 111–125. [Google Scholar] [CrossRef]
  7. Voora, V.; Bermúdez, S.; Larrea, C. Global Market Report: Tea. Sustainable Commodities Marketplace Series 2019. International Institute for Sustainable Development Website. Available online: https://www.iisd.org/sites/default/files/publications/ssi-global-market-report-tea.pdf (accessed on 15 November 2021).
  8. ul Haq, S.; Boz, I. Measuring environmental, economic, and social sustainability index of tea farms in Rize Province, Turkey. Environ. Dev. Sustain. 2020, 22, 2545–2567. [Google Scholar] [CrossRef]
  9. Wang, J.; Cheung, W.; Leung, D. Determination of Pesticide Residue Transfer Rates (Percent) from Dried Tea Leaves to Brewed Tea. J. Agric. Food Chem. 2014, 62, 966–983. [Google Scholar] [CrossRef]
  10. Li, H.; Zhong, Q.; Luo, F.; Wang, X.; Zhou, L.; Chen, Z.; Zhang, X. Residue degradation and metabolism of spinetoram in tea: A growing, processing and brewing risk assessment. Food Control 2021, 125, 107955. [Google Scholar] [CrossRef]
  11. Lin, M.-H.; Sun, L.; Kong, F.; Lin, M. Rapid detection of paraquat residues in green tea using surface-enhanced Raman spectroscopy (SERS) coupled with gold nanostars. Food Control 2021, 130, 108280. [Google Scholar] [CrossRef]
  12. Wang, Q.; Wang, D.; Li, Z.; Wang, Y.; Yang, Y.; Liu, M.; Li, D.; Sun, G.; Zeng, B. Concentrations, leachability, and health risks of mercury in green tea from major production areas in China. Ecotoxicol. Environ. Saf. 2022, 232, 113279. [Google Scholar] [CrossRef]
  13. Yang, S.-W.; Yun, C.-I.; Moon, J.-Y.; Lee, J.-G.; Kim, Y.-J. Analytical method development and risk characterisation of anthraquinone in various types of tea. Food Control 2022, 137, 108923. [Google Scholar] [CrossRef]
  14. Qian, J.; Ruiz-Garcia, L.; Fan, B.; Villalba, J.I.R.; McCarthy, U.; Zhang, B.; Yu, Q.; Wu, W. Food traceability system from governmental, corporate, and consumer perspectives in the European Union and China: A comparative review. Trends Food Sci. Technol. 2020, 99, 402–412. [Google Scholar] [CrossRef]
  15. McEntire, J.C.; Arens, S.; Bernstein, M.; Bugusu, B.; Busta, F.F.; Cole, M.; Davis, A.; Fisher, W.; Geisert, S.; Jensen, H.; et al. Traceability (Product Tracing) in Food Systems: An IFT Report Submitted to the FDA, Volume 1: Technical Aspects and Recommendations. Compr. Rev. Food Sci. Food Saf. 2010, 9, 92–158. [Google Scholar]
  16. Kim, Y.G.; Woo, E. Consumer acceptance of a quick response (QR) code for the food traceability system: Application of an extended technology acceptance model (TAM). Food Res. Int. 2016, 85, 266–272. [Google Scholar] [CrossRef] [PubMed]
  17. Tonsor, G.T.; Schroeder, T.C. Australia’s Livestock Identification Systems: Implications for United States Programs; U.S. Department of Agriculture: Washington, DC, USA, 2004.
  18. Rao, E.S.; Shukla, S. Rizwana Food traceability system in India. Meas. Food 2021, 5, 100019. [Google Scholar] [CrossRef]
  19. Kumvenji, D.C.E.; Chamba, M.V.M.; Lungu, K. Effectiveness of food traceability system in the supply chain of local beef and beef sausages in Malawi: A food safety perspective. Food Control 2022, 137, 108839. [Google Scholar] [CrossRef]
  20. Liao, P.-A.; Chang, H.-H.; Chang, C.-Y. Why is the food traceability system unsuccessful in Taiwan? Empirical evidence from a national survey of fruit and vegetable farmers. Food Policy 2011, 36, 686–693. [Google Scholar] [CrossRef]
  21. Lu, Y.; Li, P.; Xu, H. A Food anti-counterfeiting traceability system based on Blockchain and Internet of Things. Procedia Comput. Sci. 2022, 199, 629–636. [Google Scholar] [CrossRef]
  22. Dandage, K.; Badia-Melis, R.; Ruiz-García, L. Indian perspective in food traceability: A review. Food Control 2017, 71, 217–227. [Google Scholar] [CrossRef] [Green Version]
  23. Shao, Y.T.; Wang, Y.P.; Yuan, Y.W. Food safety and government regulation in rural China. J. Agric. Food Res. 2021, 5, 100170. [Google Scholar] [CrossRef]
  24. Notice on Carrying out the Trial Operation of the National Agricultural Product Quality and Safety Traceability Management Information Platform. Ministry of Agriculture and Rural Affairs of the People’s Republic of China Website. Available online: http://www.jgj.moa.gov.cn/zsgl/201904/t20190418_6186136.htm (accessed on 28 June 2021). (In Chinese)
  25. Notice on the Comprehensive Promotion and Application of the National Agricultural Product Quality and Safety Traceability Management Information Platform. Ministry of Agriculture and Rural Affairs of the People’s Republic of China Website. Available online: http://www.jgs.moa.gov.cn/zsgl/201904/t20190418_6186148.htm (accessed on 11 October 2021). (In Chinese)
  26. Traceability Requirements for Agricultural Products—Tea. Available online: http://c.gb688.cn/bzgk/gb/showGb?type=online&hcno=859231FFAF6AE947FBAF0FEE0F690293 (accessed on 12 July 2021). (In Chinese).
  27. Yang, X.-D.; Ni, K.; Shi, Y.-Z.; Yi, X.-Y.; Zhang, Q.-F.; Fang, L.; Ma, L.-F.; Ruan, J. Effects of long-term nitrogen application on soil acidification and solution chemistry of a tea plantation in China. Agric. Ecosyst. Environ. 2018, 252, 74–82. [Google Scholar] [CrossRef]
  28. Xie, S.; Feng, H.; Yang, F.; Zhao, Z.; Hu, X.; Wei, C.; Liang, T.; Li, H.; Geng, Y. Does dual reduction in chemical fertilizer and pesticides improve nutrient loss and tea yield and quality? A pilot study in a green tea garden in Shaoxing, Zhejiang Province, China. Environ. Sci. Pollut. Res. 2018, 26, 2464–2476. [Google Scholar] [CrossRef] [PubMed]
  29. Han, Z.; Lin, H.; Xu, P.; Li, Z.; Wang, J.; Zou, J. Impact of organic fertilizer substitution and biochar amendment on net greenhouse gas budget in a tea plantation. Agric. Ecosyst. Environ. 2021, 326, 107779. [Google Scholar] [CrossRef]
  30. Chowdhury, A.; Samrat, A.; Devy, M.S. Can tea support biodiversity with a few “nudges” in management: Evidence from tea growing landscapes around the world. Glob. Ecol. Conserv. 2021, 31, e01801. [Google Scholar] [CrossRef]
  31. Mohan, S. Risk aversion and certification: Evidence from the Nepali tea fields. World Dev. 2020, 129, 104903. [Google Scholar] [CrossRef]
  32. Song, Y.-H.; Yu, H.-Q.; Tan, Y.-C.; Lv, W.; Fang, D.-H.; Liu, D. Similarity matching of food safety incidents in China: Aspects of rapid emergency response and food safety. Food Control 2020, 115, 107275. [Google Scholar] [CrossRef]
  33. Hoffmann, S.; Ashton, L.; Ahn, J.-W. Food safety: A policy history and introduction to avenues for economic research. Appl. Econ. Perspect. Policy 2021, 43, 680–700. [Google Scholar] [CrossRef]
  34. Zhou, J.; Jin, Y.; Liang, Q. Effects of regulatory policy mixes on traceability adoption in wholesale markets: Food safety inspection and information disclosure. Food Policy 2022, 107, 102218. [Google Scholar] [CrossRef]
  35. Zhou, J.; Jin, Y.; Wang, Y.; Liang, Q. Quality information disclosure, signal transmission and agricultural product certification-based on a comparative analysis of meat and vegetable industries. Issues Agric. Econ. 2020, 9, 76–87. [Google Scholar]
  36. Palihakkara, I.R.; Mohammed, A.J.; Inoue, M. Current Livelihood Condition of and Futurity of Tea Farming for Marginal Small Tea Farm Holders (MSTH) of Sri Lanka: Case Study from Badulla and Matara District. Environ. Nat. Resour. Res. 2014, 5, 11. [Google Scholar] [CrossRef]
  37. Plaihakkara, I.R.; Mohammed, A.J.; Shivakoti, G.P.; Inoue, M. Prospect of Fuelwood Plantations for Marginal Small Tea Farmers: A Case Study in Matara and Badulla Districts, Sri Lanka. Nat. Resour. 2015, 06, 566–576. [Google Scholar] [CrossRef] [Green Version]
  38. Tatlıdil, F.F.; Boz, I.; Tatlidil, H. Farmers’ perception of sustainable agriculture and its determinants: A case study in Kahramanmaras province of Turkey. Environ. Dev. Sustain. 2009, 11, 1091–1106. [Google Scholar] [CrossRef]
  39. Rezaei, R.; Ghofranfarid, M. Rural households’ renewable energy usage intention in Iran: Extending the unified theory of acceptance and use of technology. Renew. Energy 2018, 122, 382–391. [Google Scholar] [CrossRef]
  40. Wang, H.; Cao, X.; Yuan, Z.; Guo, G. Untargeted metabolomics coupled with chemometrics approach for Xinyang Maojian green tea with cultivar, elevation and processing variations. Food Chem. 2021, 352, 129359. [Google Scholar] [CrossRef] [PubMed]
  41. Wang, Z.; Ma, B.; Ma, C.; Zheng, C.; Zhou, B.; Guo, G.; Xia, T. Region identification of Xinyang Maojian tea using UHPLC-Q-TOF/MS-based metabolomics coupled with multivariate statistical analyses. J. Food Sci. 2021, 86, 1681–1691. [Google Scholar] [CrossRef]
  42. Henan Province Bureau of Statistics. 2021 Henan Statistical Yearbook; China Statistics Press: Beijing, China, 2021.
  43. Brown, S.R.; Durning, D.W.; Selden, S. Q methodology. Public Adm. Public Policy 1999, 71, 599–638. [Google Scholar]
  44. Watts, S.; Stenner, P. Doing Q methodology: Theory, method and interpretation. Qual. Res. Psychol. 2005, 2, 67–91. [Google Scholar] [CrossRef] [Green Version]
  45. Honey, S.; Bryant, L.D.; Murray, J.; Hill, K.; House, A. Differences in the perceived role of the healthcare provider in delivering vascular health checks: A Q methodology study. BMC Fam. Pract. 2013, 14, 172. [Google Scholar] [CrossRef] [Green Version]
  46. Zabala, A.; Sandbrook, C.; Mukherjee, N. When and how to use Q methodology to understand perspectives in conservation research. Conserv. Biol. 2018, 32, 1185–1194. [Google Scholar] [CrossRef] [Green Version]
  47. Sneegas, G.; Beckner, S.; Brannstrom, C.; Jepson, W.; Lee, K.; Seghezzo, L. Using Q-methodology in environmental sustainability research: A bibliometric analysis and systematic review. Ecol. Econ. 2021, 180, 106864. [Google Scholar] [CrossRef]
  48. Brown, S.R. Subjectivity in the Human Sciences. Psychol. Rec. 2019, 69, 565–579. [Google Scholar] [CrossRef]
  49. Han, F. How to Use the Q Method in Conducting Food Safety Perception Research. China J. Prev. Med. 2011, 45, 553–555. [Google Scholar]
  50. Pereira, M.A.; Fairweather, J.R.; Woodford, K.B.; Nuthall, P.L. Assessing the diversity of values and goals amongst Brazilian commercial-scale progressive beef farmers using Q-methodology. Agric. Syst. 2016, 144, 1–8. [Google Scholar] [CrossRef] [Green Version]
  51. Alexander, K.S.; Parry, L.; Thammavong, P.; Sacklokham, S.; Pasouvang, S.; Connell, J.G.; Jovanovic, T.; Moglia, M.; Larson, S.; Case, P. Rice farming systems in Southern Lao PDR: Interpreting farmers’ agricultural production decisions using Q methodology. Agric. Syst. 2018, 160, 1–10. [Google Scholar] [CrossRef]
  52. Schall, D.; Lansing, D.; Leisnham, P.; Shirmohammadi, A.; Montas, H.; Hutson, T. Understanding stakeholder perspectives on agricultural best management practices and environmental change in the Chesapeake Bay: A Q methodology study. J. Rural Stud. 2018, 60, 21–31. [Google Scholar] [CrossRef]
  53. Taheri, F.; D’Haese, M.; Fiems, D.; Hosseininia, G.H.; Azadi, H. Wireless sensor network for small-scale farming systems in southwest Iran: Application of Q-methodology to investigate farmers’ perceptions. Comput. Electron. Agric. 2020, 177, 105682. [Google Scholar] [CrossRef]
  54. Vecchio, Y.; Di Pasquale, J.; Del Giudice, T.; Pauselli, G.; Masi, M.; Adinolfi, F. Precision farming: What do Italian farmers really think? An application of the Q methodology. Agric. Syst. 2022, 201, 103466. [Google Scholar] [CrossRef]
  55. Brown, S.R. Political Subjectivity: Applications of Q Methodology in Political Science; Yale University Press: New Haven, CT, USA, 1980. [Google Scholar]
  56. Mukherjee, N.; Hugé, J.; Sutherland, W.J.; McNeill, J.; Van Opstal, M.; Dahdouh-Guebas, F.; Koedam, N. The Delphi technique in ecology and biological conservation: Applications and guidelines. Methods Ecol. Evol. 2015, 6, 1097–1109. [Google Scholar] [CrossRef] [Green Version]
  57. Haua, R.; Wolf, A.; Harrison, J.; Aspden, T. Q methodology: An underutilised tool in pharmacy practice research. Res. Soc. Adm. Pharm. 2021, 18, 2178–2183. [Google Scholar] [CrossRef]
  58. Milakis, D.; Kroesen, M.; van Wee, B. Implications of automated vehicles for accessibility and location choices: Evidence from an expert-based experiment. J. Transp. Geogr. 2018, 68, 142–148. [Google Scholar] [CrossRef]
  59. Jang, H.-Y.; Lee, Y.-M. Investigating the perception of the elderly on the future of labour market. Int. J. Trade Glob. Mark. 2020, 13, 71–80. [Google Scholar] [CrossRef]
  60. Marey-Pérez, M.F.; Rodríguez-Vicente, V. Factors determining forest management by farmers in northwest Spain: Application of discriminant analysis. For. Policy Econ. 2011, 13, 318–327. [Google Scholar] [CrossRef]
  61. D’Archivio, A.A.; Giannitto, A.; Maggi, M.A.; Ruggieri, F. Geographical classification of Italian saffron (Crocus sativus L.) based on chemical constituents determined by high-performance liquid-chromatography and by using linear discriminant analysis. Food Chem. 2016, 212, 110–116. [Google Scholar] [CrossRef] [PubMed]
  62. Huberty, C.J. Applied Discriminant Analysis; Wiley-Interscience: New York, NY, USA, 1994. [Google Scholar]
  63. Van Exel, J.; De Graaf, G. Q Methodology: A Sneak Preview. 2005. Available online: https://www.researchgate.net/profile/Gjalt-Graaf/publication/228574836_Q_Methodology_A_Sneak_Preview/links/02bfe50f946fc9978b000000/Q-Methodology-A-Sneak-Preview.pdf (accessed on 18 March 2021).
  64. Kroesen, M.; Broer, C. Policy discourse, people’s internal frames, and declared aircraft noise annoyance: An application of Q-methodology. J. Acoust. Soc. Am. 2009, 126, 195–207. [Google Scholar] [CrossRef] [PubMed]
  65. Krabbenborg, L.; Molin, E.; Annema, J.A.; van Wee, B. Public frames in the road pricing debate: A Q-methodology study. Transp. Policy 2020, 93, 46–53. [Google Scholar] [CrossRef]
  66. Oyinbo, O.; Chamberlin, J.; Vanlauwe, B.; Vranken, L.; Kamara, Y.A.; Craufurd, P.; Maertens, M. Farmers’ preferences for high-input agriculture supported by site-specific extension services: Evidence from a choice experiment in Nigeria. Agric. Syst. 2019, 173, 12–26. [Google Scholar] [CrossRef]
  67. Ulhaq, I.; Pham, N.T.A.; Le, V.; Pham, H.-C.; Le, T.C. Factors influencing intention to adopt ICT among intensive shrimp farmers. Aquaculture 2022, 547, 737407. [Google Scholar] [CrossRef]
  68. Ahmed, S.; Orians, C.M.; Griffin, T.S.; Buckley, S.; Unachukwu, U.; Stratton, A.E.; Stepp, J.R.; Robbat, A., Jr.; Cash, S.; Kennelly, E.J. Effects of water availability and pest pressures on tea (Camellia sinensis) growth and functional quality. AoB PLANTS 2014, 6, plt054. [Google Scholar] [CrossRef] [Green Version]
  69. Li, M.; Wang, J.; Zhao, P.; Chen, K.; Wu, L. Factors affecting the willingness of agricultural green production from the perspective of farmers’ perceptions. Sci. Total Environ. 2020, 738, 140289. [Google Scholar] [CrossRef]
  70. Jiang, L.; Zhang, J.; Wang, H.H.; Zhang, L.; He, K. The impact of psychological factors on farmers’ intentions to reuse agricultural biomass waste for carbon emission abatement. J. Clean. Prod. 2018, 189, 797–804. [Google Scholar] [CrossRef]
  71. Ahmad, D.; Afzal, M.; Rauf, A. Analysis of wheat farmers’ risk perceptions and attitudes: Evidence from Punjab, Pakistan. Nat. Hazards 2019, 95, 845–861. [Google Scholar] [CrossRef]
  72. Kallgren, C.A.; Reno, R.R.; Cialdini, R.B. A Focus Theory of Normative Conduct: When Norms Do and Do not Affect Behavior. Pers. Soc. Psychol. Bull. 2000, 26, 1002–1012. [Google Scholar] [CrossRef]
  73. Li, F.; Zhang, K.; Ren, J.; Yin, C.; Zhang, Y.; Nie, J. Driving mechanism for farmers to adopt improved agricultural systems in China: The case of rice-green manure crops rotation system. Agric. Syst. 2021, 192, 103202. [Google Scholar] [CrossRef]
  74. Ajzen, I. The theory of planned behavior. Organ. Behav. Hum. Decis. Process. 1991, 50, 179–211. [Google Scholar] [CrossRef]
  75. Xie, Q.; Song, W.; Peng, X.; Shabbir, M. Predictors for e-government adoption: Integrating TAM, TPB, trust and perceived risk. Electron. Libr. 2017, 35, 2–20. [Google Scholar] [CrossRef]
  76. Lou, S.; Zhang, B.; Zhang, D. Foresight from the hometown of green tea in China: Tea farmers’ adoption of pro-green control technology for tea plant pests. J. Clean. Prod. 2021, 320, 128817. [Google Scholar] [CrossRef]
  77. Diaz, A.C.; Sasaki, N.; Tsusaka, T.W.; Szabo, S. Factors affecting farmers’ willingness to adopt a mobile app in the marketing of bamboo products. Resour. Conserv. Recycl. Adv. 2021, 11, 200056. [Google Scholar] [CrossRef]
Figure 1. The flowchart of the traceability system.
Ijerph 19 16280 g001
Figure 2. Location of the study area.
Ijerph 19 16280 g002
Figure 3. Framework of conducting Q methodology research.
Ijerph 19 16280 g003
Figure 4. Q-sort grid of standard normal distribution.
Ijerph 19 16280 g004
Figure 5. Q-sort of four factors. Note: * Distinguishing statement at p < 0.05; ** Distinguishing statement at p < 0.01. a: Z-Score for the statement is higher than in all other factors; b: Z-Score for the statement is lower than in all other factors.
Ijerph 19 16280 g005
Figure 6. Average loadings for the distinguishing Statements of four factor. Note: The numbers in the Figure represent the order of the statements.
Ijerph 19 16280 g006
Figure 7. Groupings of tea farmers using Functions 1 and 2.
Ijerph 19 16280 g007
Table 1. Descriptive Statistics.
VariableDescriptionMeanSDMinMax
Gender1 = Male, 0 = Female0.690.47901
AgeActual age (years)37.9410.9632260
Marital status1 = Unmarried, 2 = Married, 3 = Divorced, 4 = Widowed1.750.44712
Education level1 = Primary school, 2 = Middle school, 3 = High school, 4 = College and above30.89424
Planting yearsTea planting years15.889.135233
Household sizeNumber of household members4.751.18337
Tea garden areaTea garden planting area (mu)6.064.419220
Number of employees 0.811.10903
Whether to join a cooperative1 = Yes, 0 = No0.130.34201
Are you engaged in other employment1 = Yes, 0 = No0.870.34201
Annual household incomeThousand US dollars12.4096.5751.51345.4
Table 2. Factor matrix for all Q-sorts (four factors after rotation).
Q-SortF1F2F3F4
1−0.200.53 *−0.160.00
20.180.44 *0.360.14
30.120.77 *−0.04−0.14
40.330.42 *0.07−0.08
50.60 *−0.18−0.04−0.49
60.18−0.19−0.140.41 *
70.74 *0.02−0.090.22
80.170.53 *0.310.19
90.55 *0.120.13−0.11
100.74 *0.01−0.060.00
110.67 *0.420.100.12
12−0.260.16−0.070.84 *
130.490.170.50−0.12
14−0.040.150.65 *−0.01
150.33−0.130.440.44
16−0.15−0.230.78 *−0.22
Eigenvalues3.311.851.661.36
% Explained Variance2112109
Cumulative % Explained Variance21334352
Number of defining sort5522
Avg. Rel. Coef.0.80.80.80.8
Composite Reliability0.9520.9520.8890.889
S.E. of Factor Z-scores0.2190.2190.3330.333
Note: * p < 0.05.
Table 3. Consensus statements across all factors (Q-Sort Value).
No.StatementF1 Q-SVF2 Q-SVF3 Q-SVF4 Q-SV
8Participating in the NTP can improve the efficiency of tea cultivation0−1−10
17Even if the cost of tea cultivation increases, I will participate in the NTP−2−10−1
19If the conditions are right, I intend to participate in the NTP1101
25I will participate in the NTP0111
33Participating in the NTP will make tea sales more convenient1121
41I support the relevant measures of the NTP2221
44Agricultural technicians supported me to participate in the NTP−1−1−10
Table 4. Fisher discriminant analysis results.
FunctionEigenvalue% of VarianceCumulative %Canonical CorrelationWilks’ LambdaChi-SquaredfSig.
179.4393.093.00.990.0045.40270.01
24.595.498.40.900.0716.88160.39
31.401.6100.00.760.415.7070.58
Table 5. Classification results of the Fisher discriminant functions.
Diagnostic Category Predicted Group Membership Total
F1F2F3F4
OriginalCountF150005
F205005
F300202
F400022
Ungrouped observations00112
%F1100.00.00.00.0100.0
F20.0100.00.00.0100.0
F30.00.0100.00.0100.0
F40.00.00.0100.0100.0
Ungrouped observations0.00.050.050.0100.0
Publisher’s Note: MDPI stays neutral with regard to jurisdictional claims in published maps and institutional affiliations.

