
Numerical Simulation on Shale Fragmentation by a PDC Cutter Based on the Discrete Element Method

 ,
,
Abstract
:1. Introduction
2. Methods
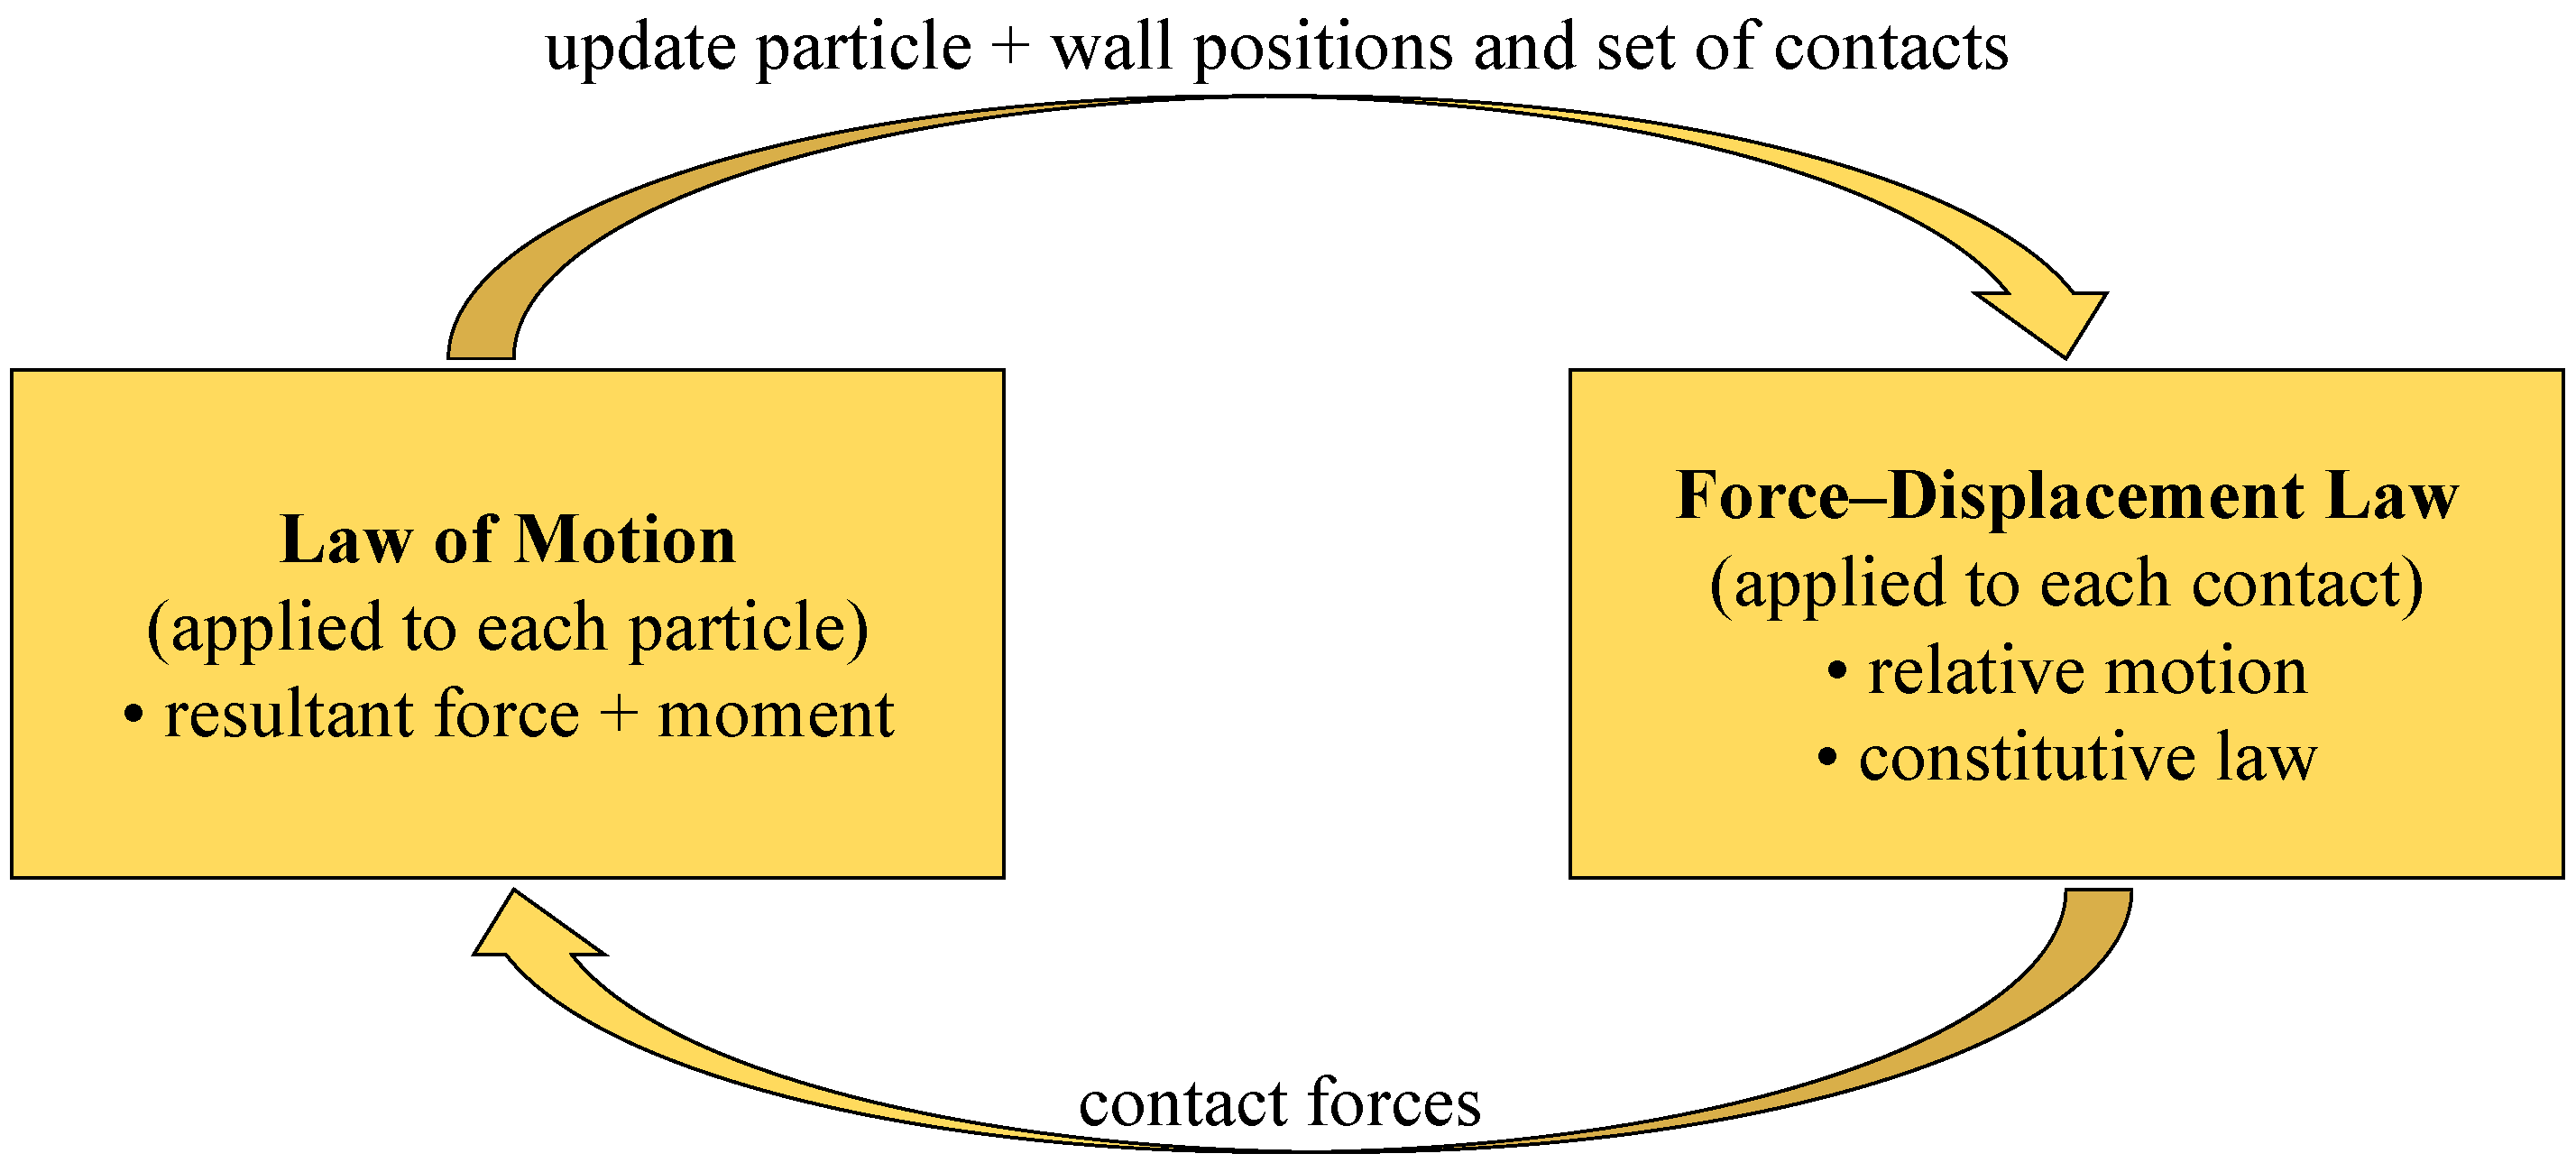
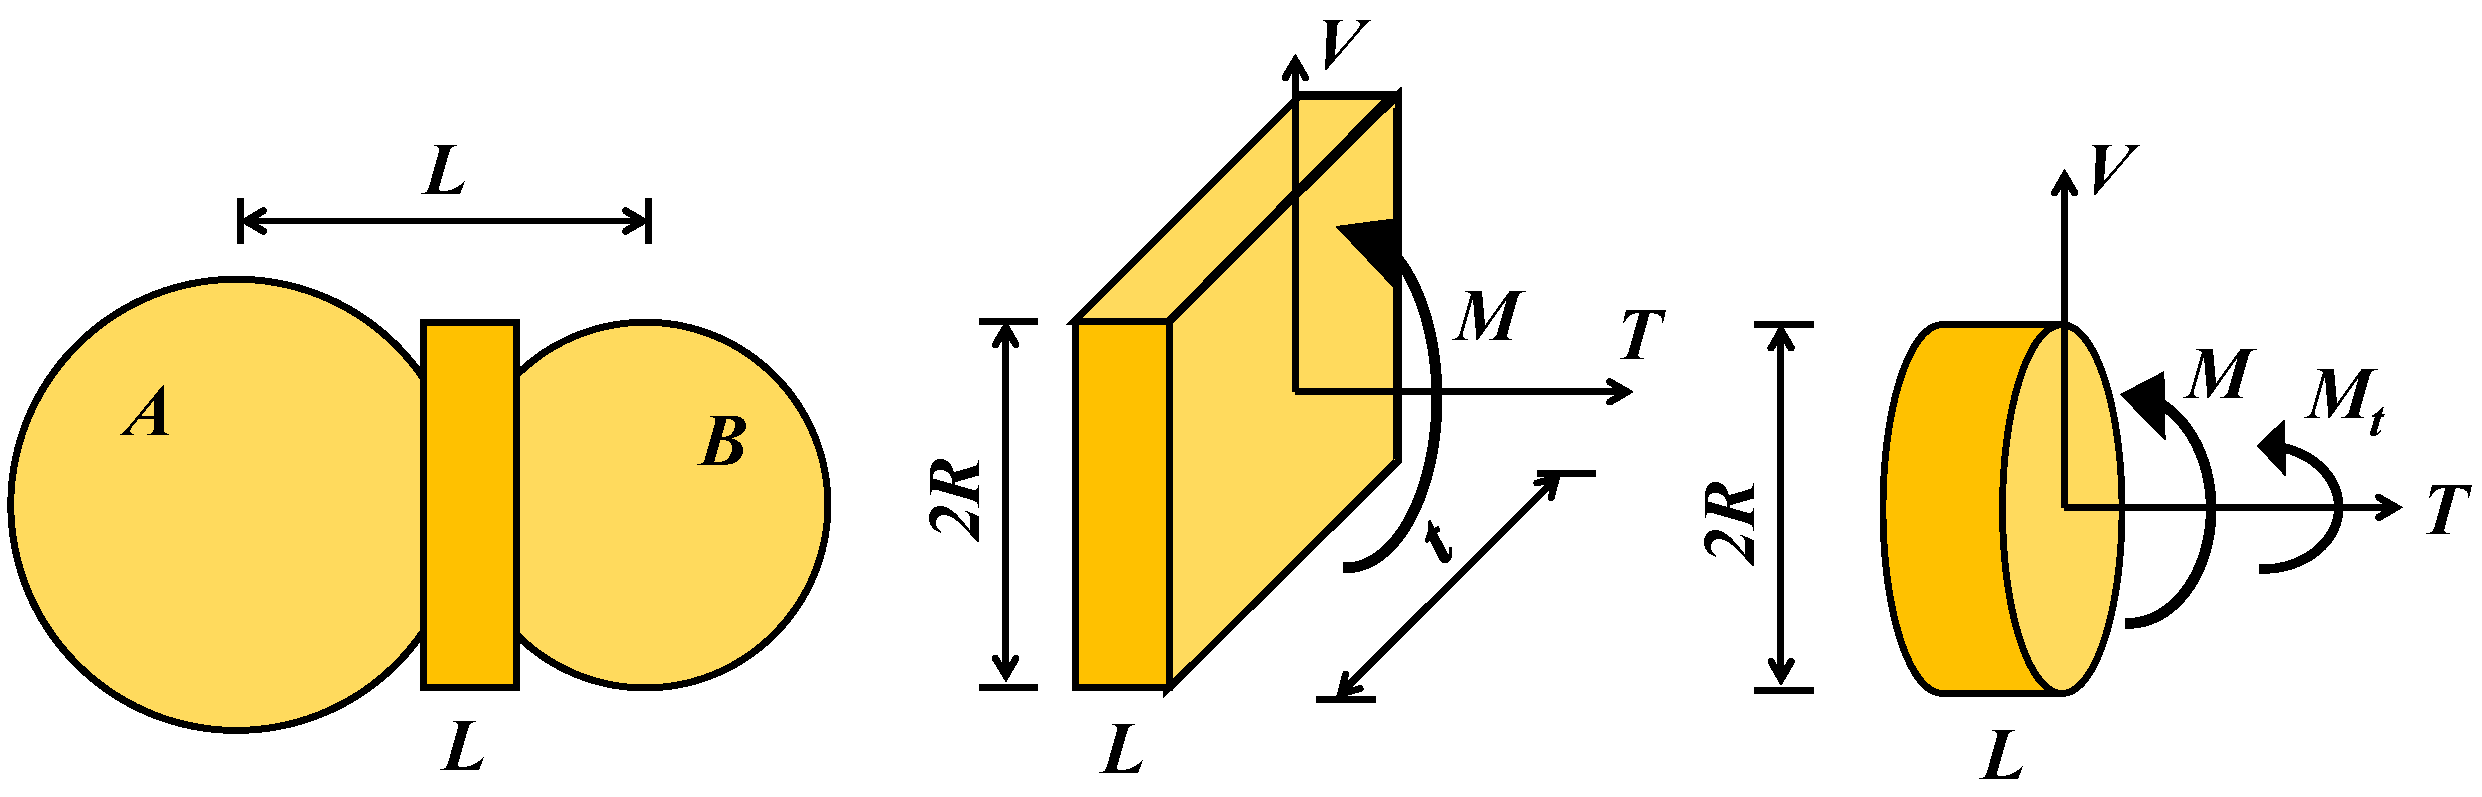
2.1. Basic Principle of Particle Flow Discrete Element
2.2. Basic Assumption
- The bedding of shale samples is of equal thickness, and there is no natural fracture.
- Since the interaction between the drill bit and the rock can be regarded as the sum of the interaction between all the cutters on the drill bit and the rock, this paper focuses on a single cutter and simulates the cutting effect of a single PDC cutter on shale.
- The influences of ground stress, temperature and hydrostatic pressure on rock mass are not considered.
- In this paper, it is assumed that the drill bit moves along the center line of the wellbore with uniform rotational speed and uniform drilling speed without eccentricity; the drilling speed of drill bit and rotational speed of cutter are constant.
- The actual movement form of cutters at the bottom of the well is spiral. In this paper, the movement of cutters is simplified as plane movement.
- Due to the general view of predecessors, the cutting action of the blunt tooth (wear) tool or the traction drill is divided into two processes: (a) the pure cutting action in front of the cutting surface; (b) Friction processes across the wear surface [90,91,92,93,94]. This paper assumes that the drill cutter is sharp and only needs to consider the pure cutting force, without considering friction.
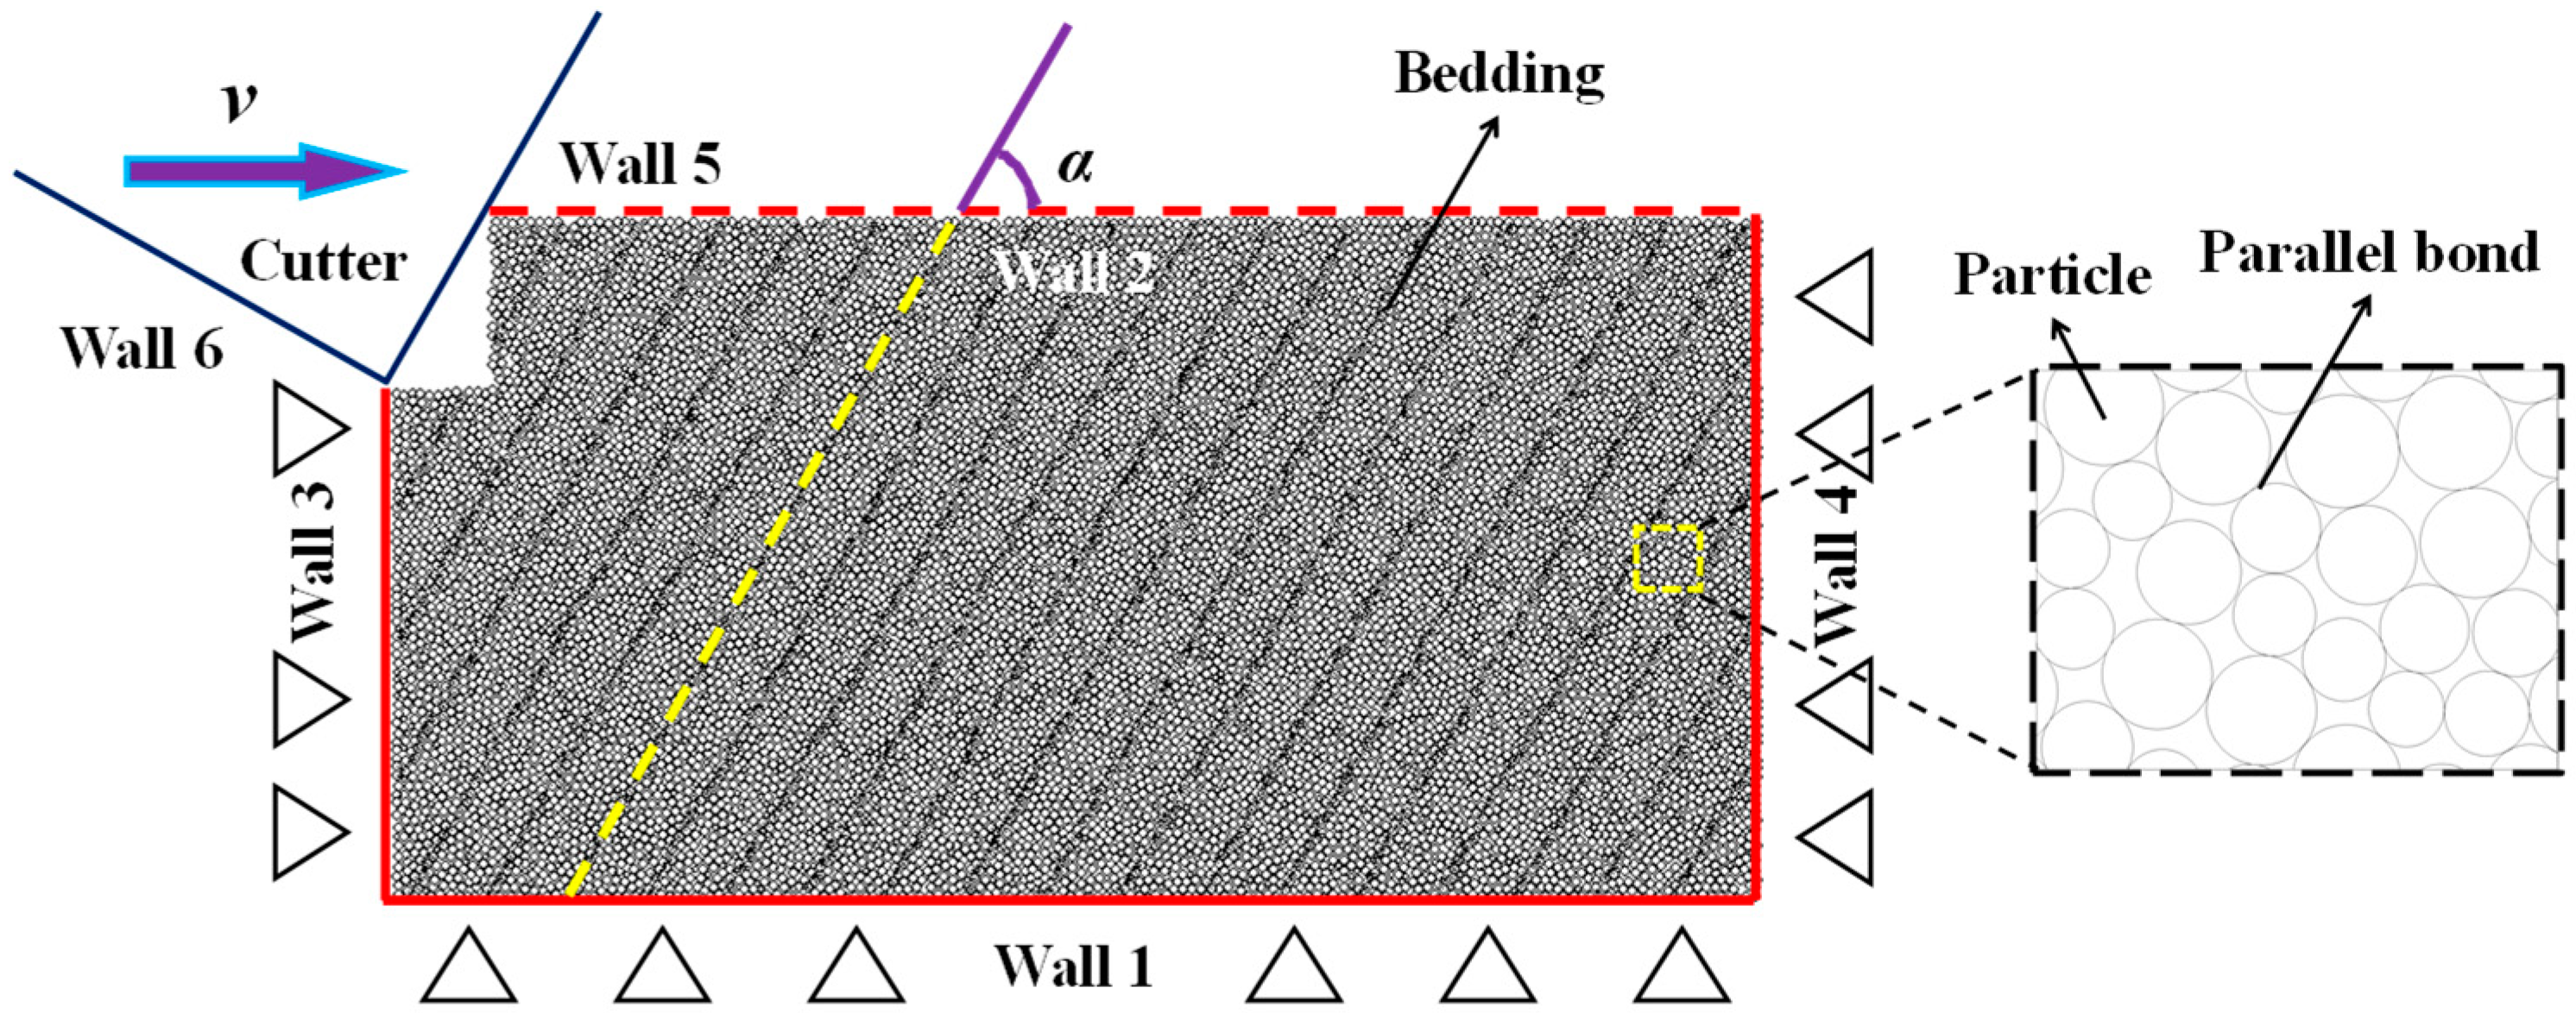
2.3. Establishment of Model of Cutter Cutting Shale
2.4. Numerical Test Scheme
3. Results
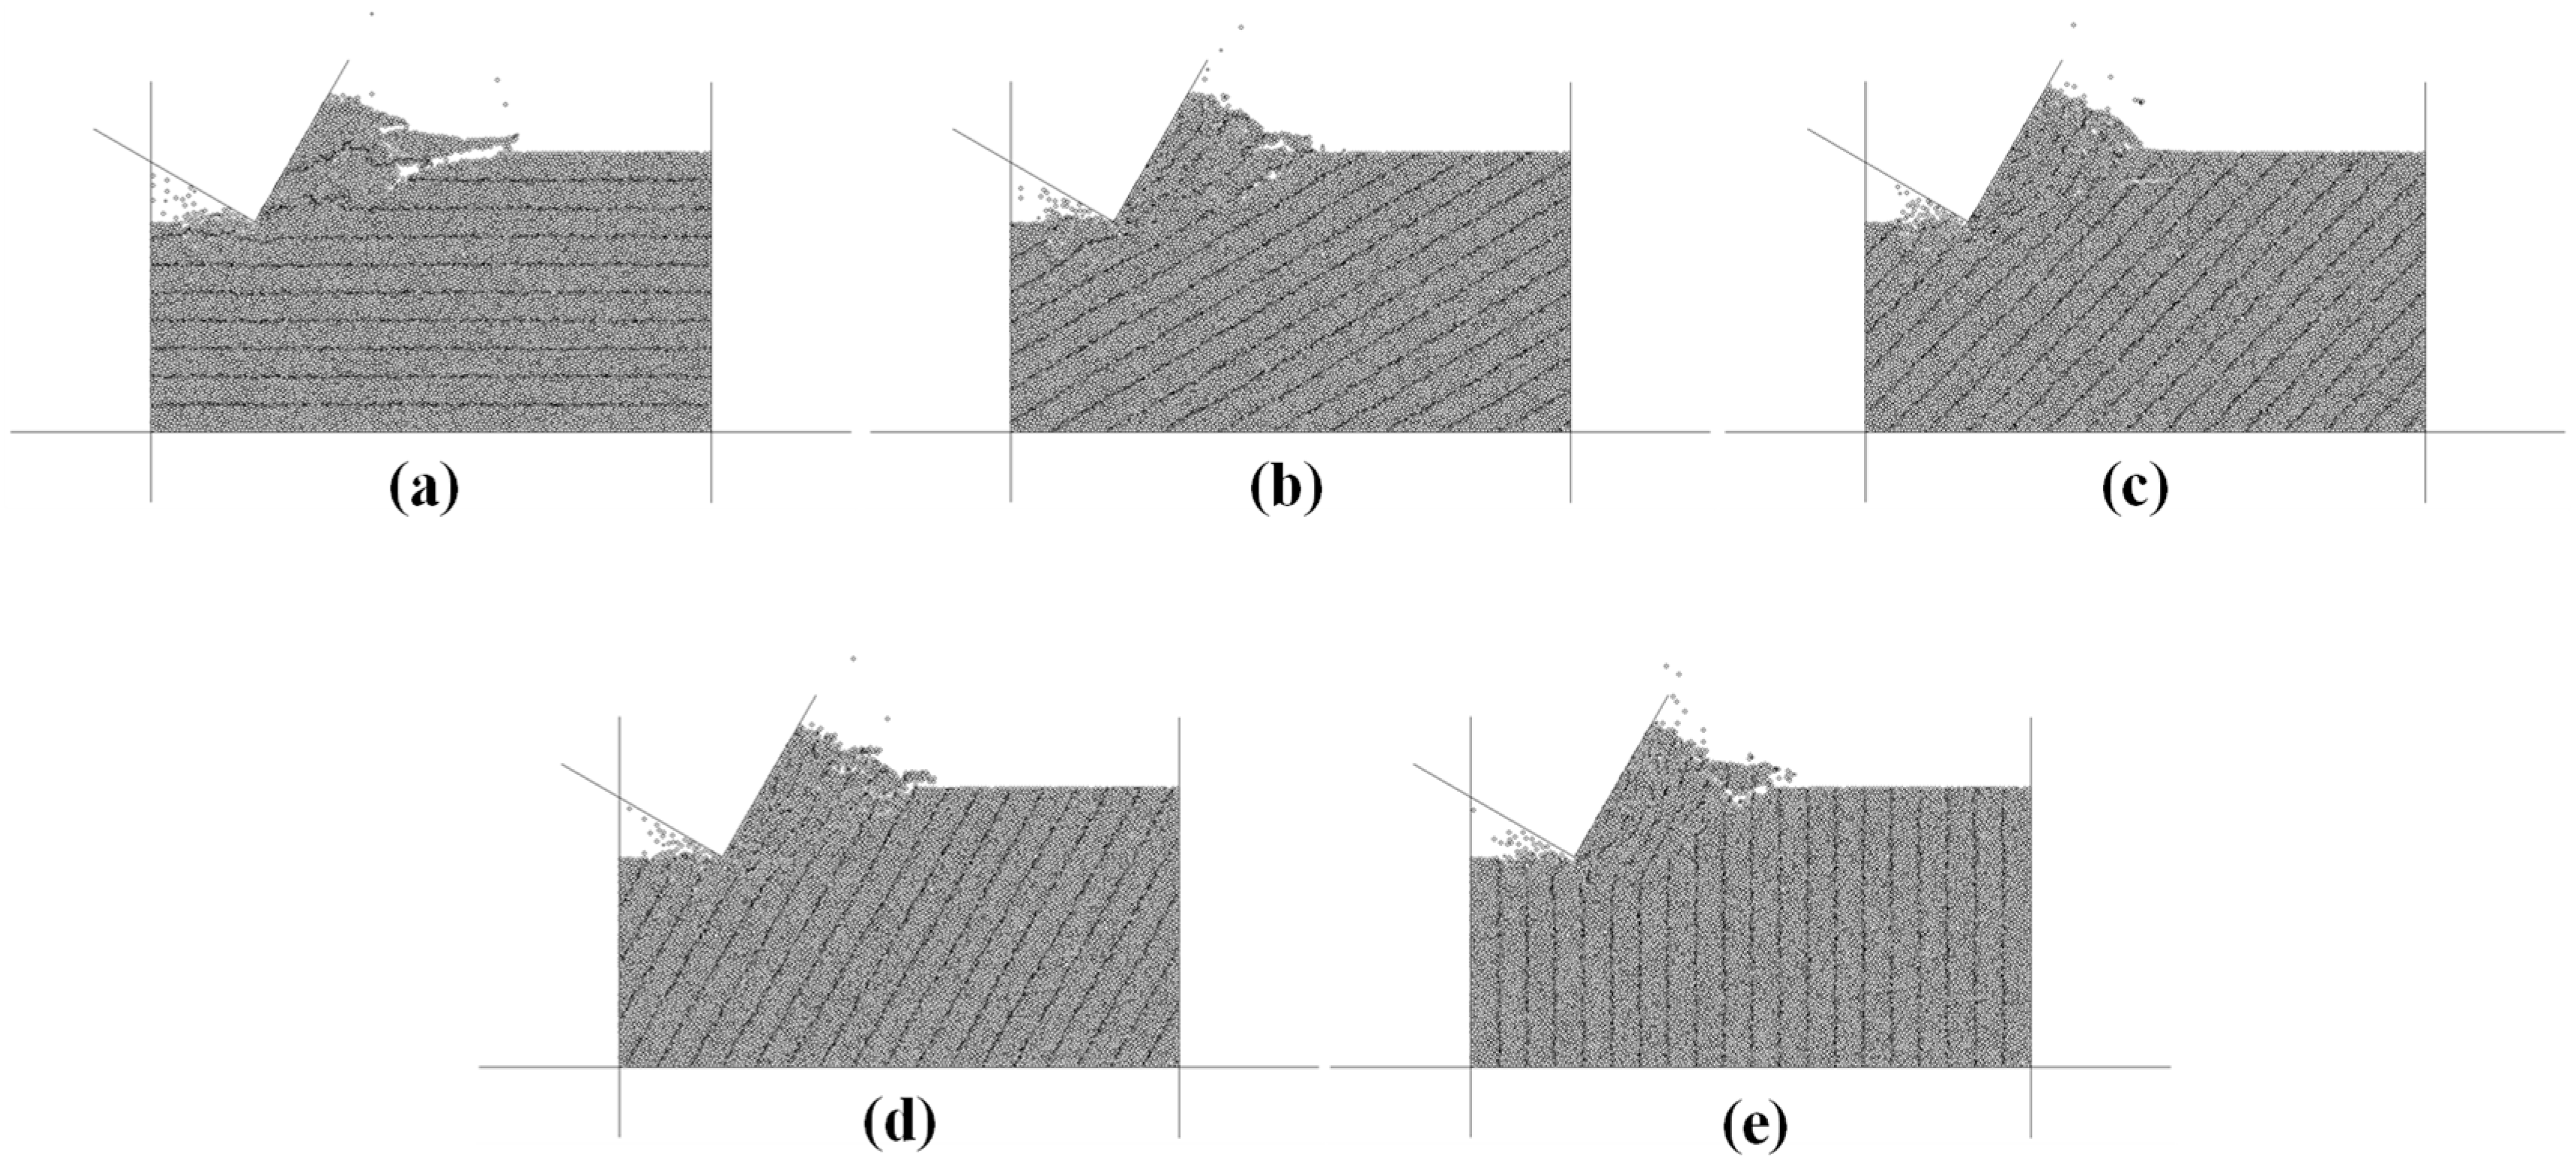
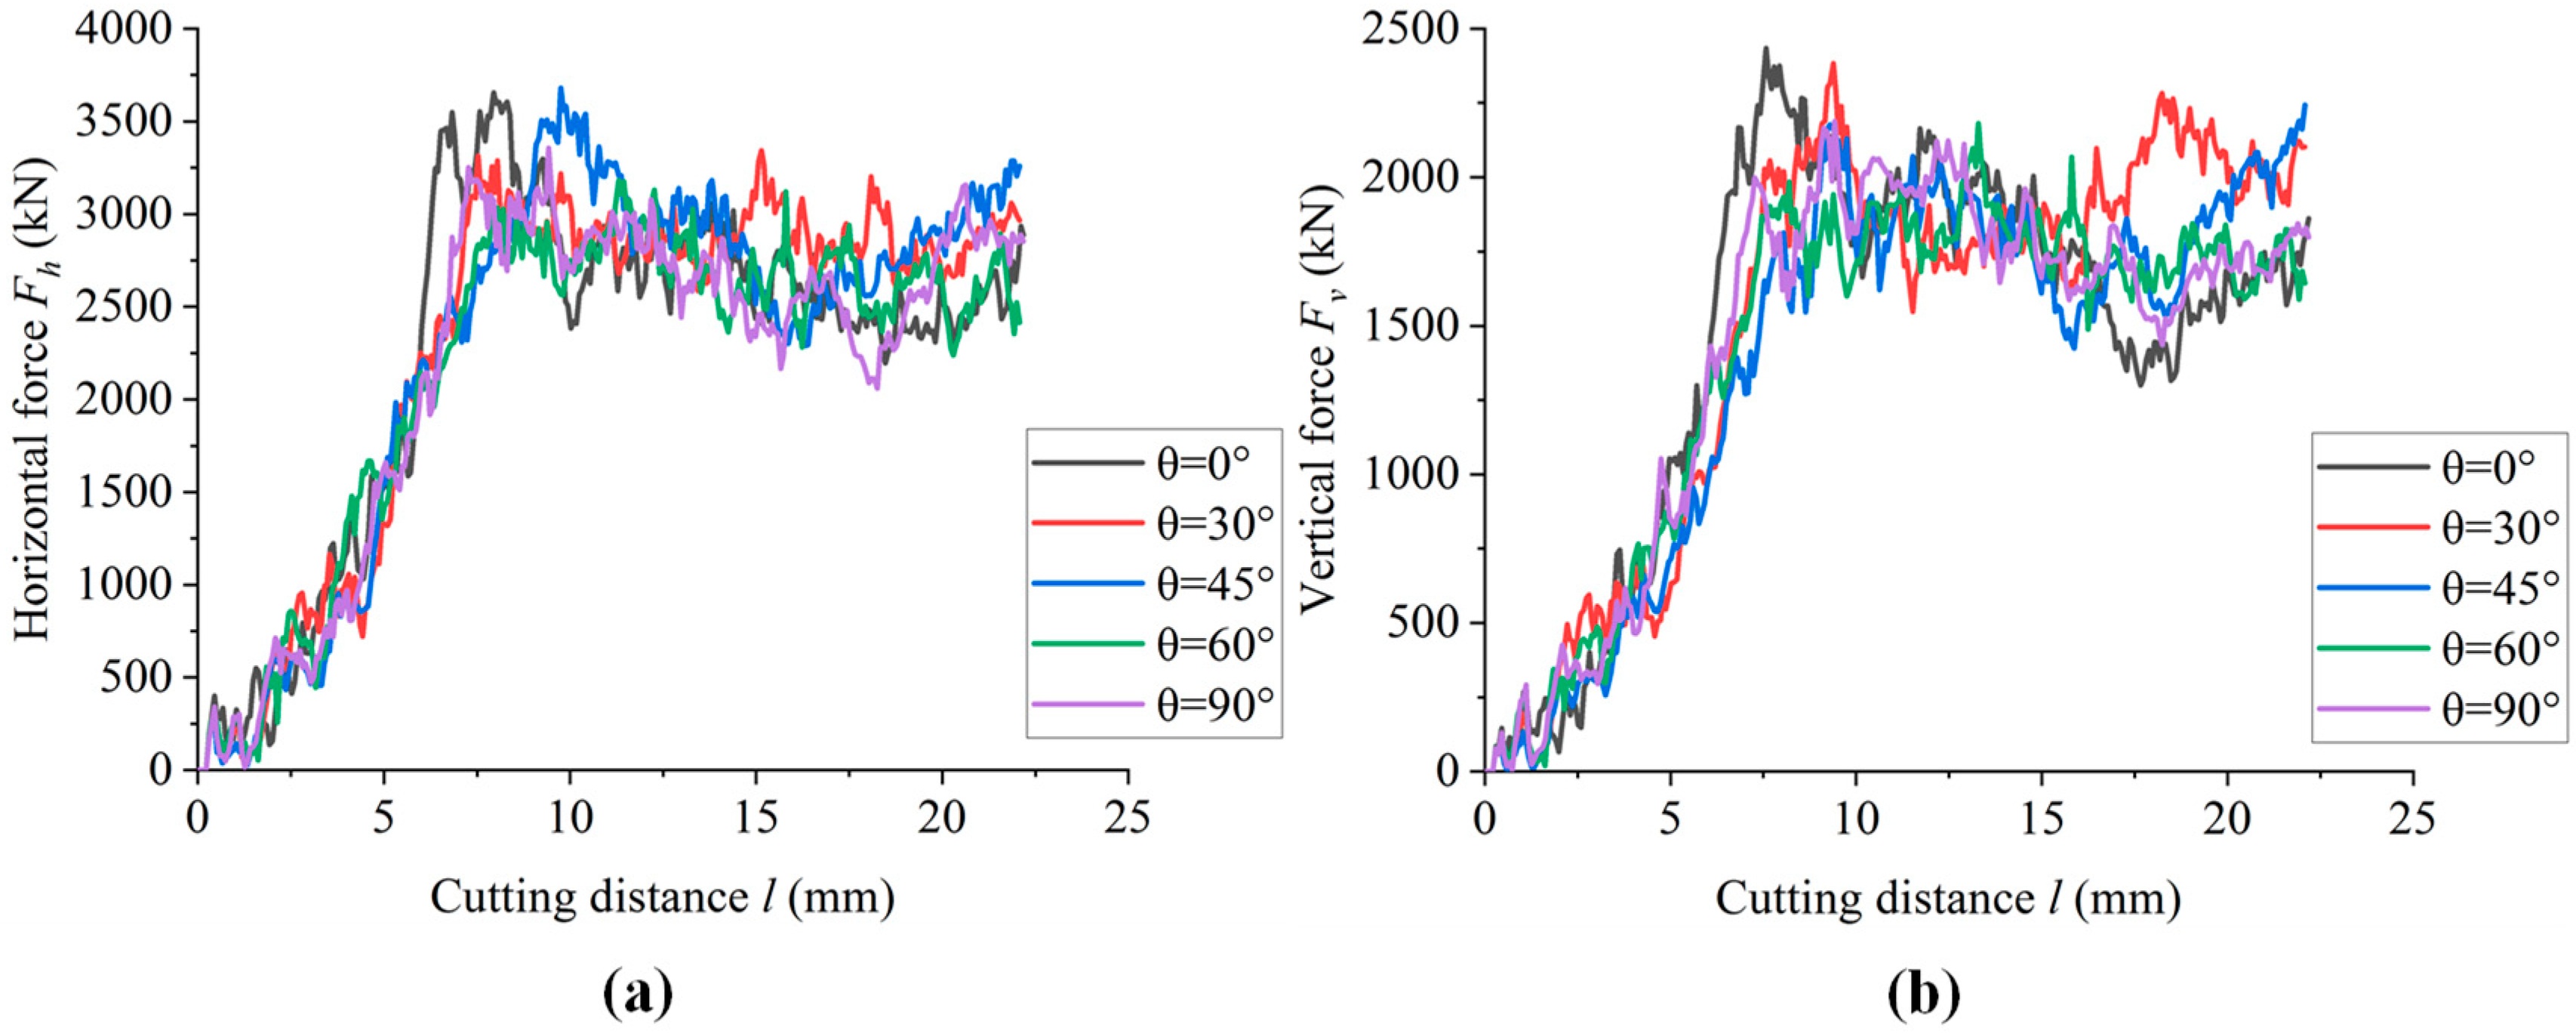
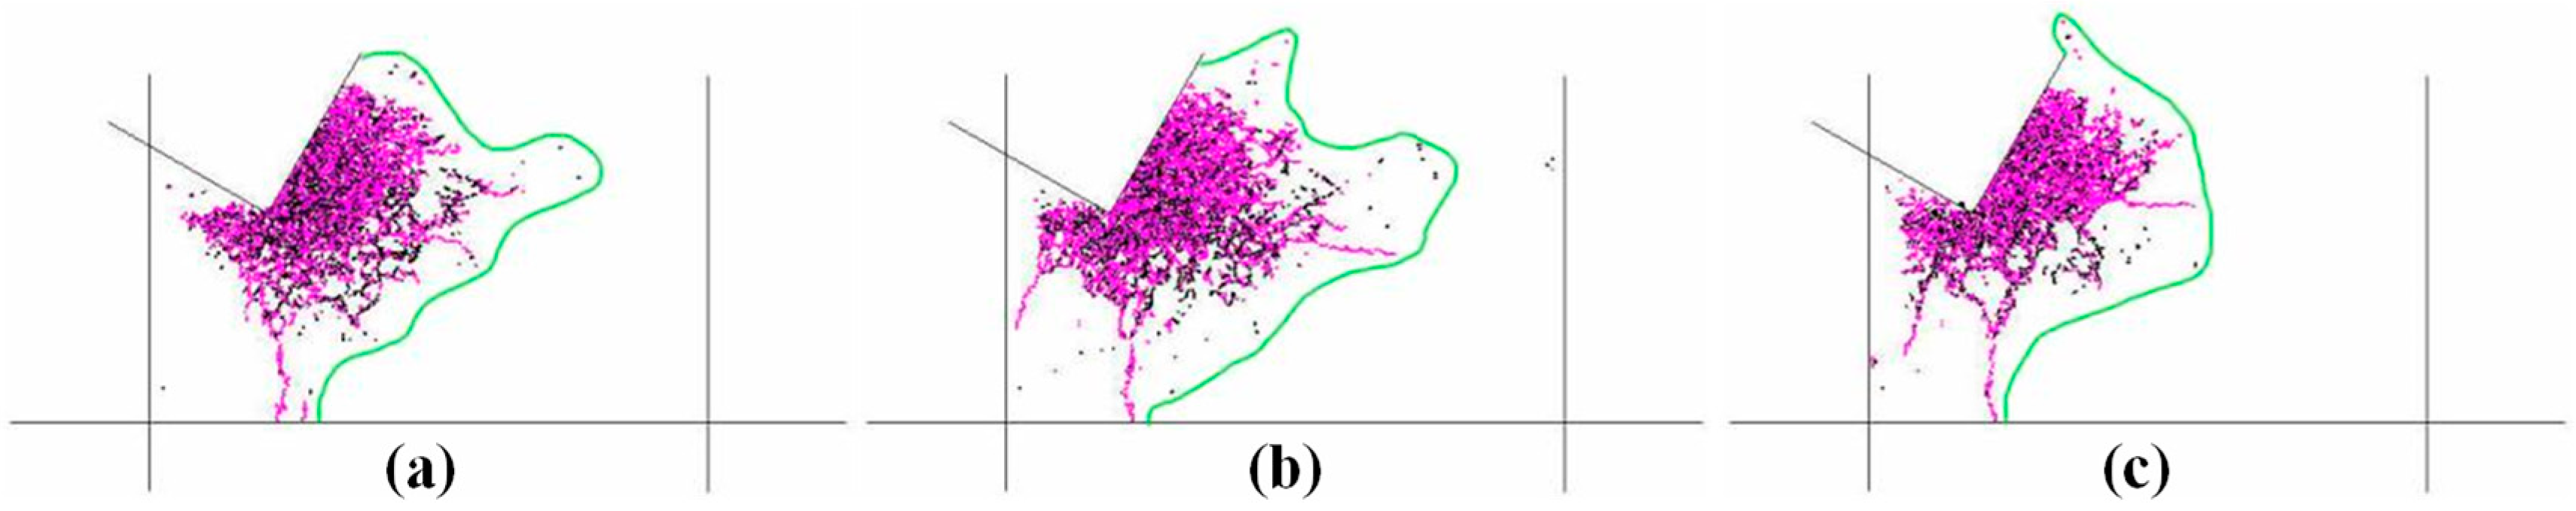
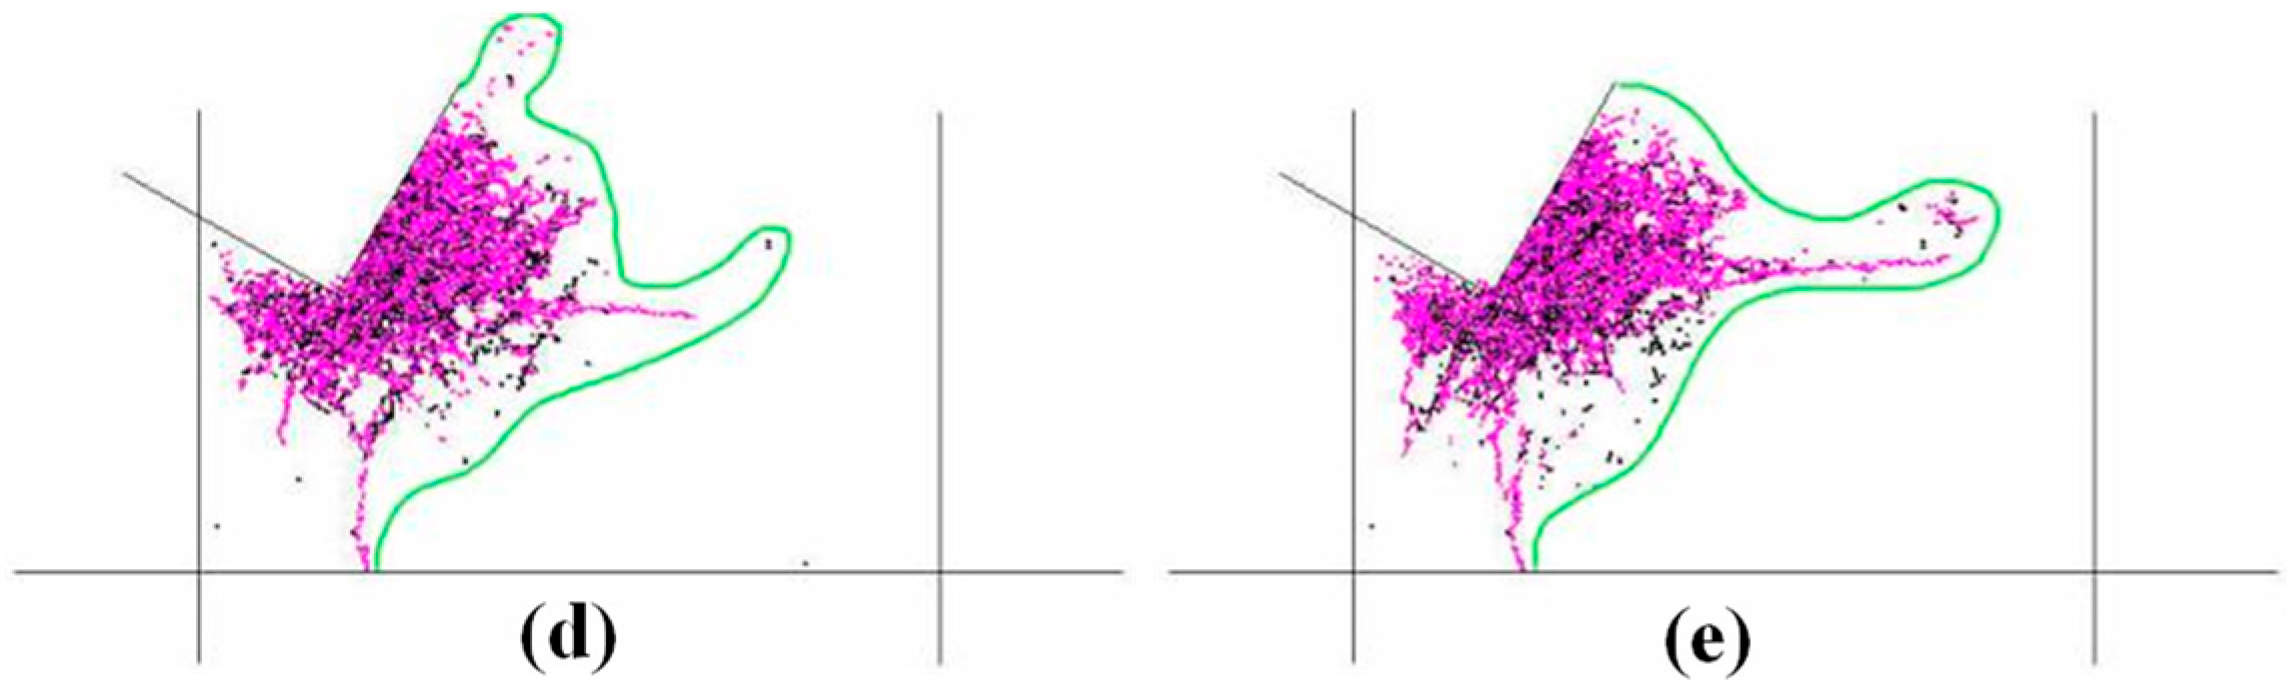
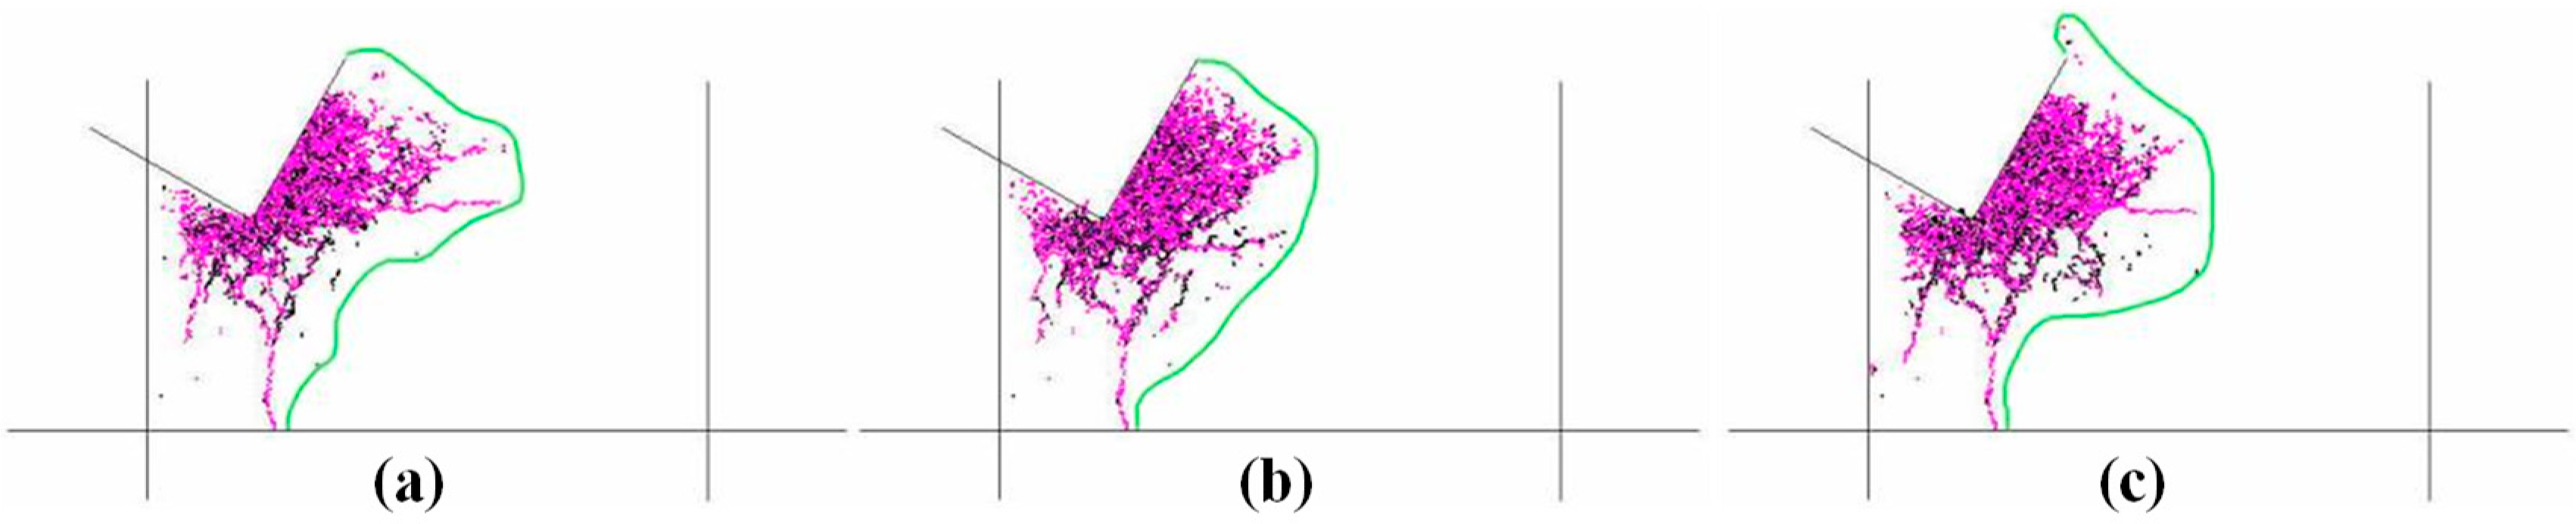
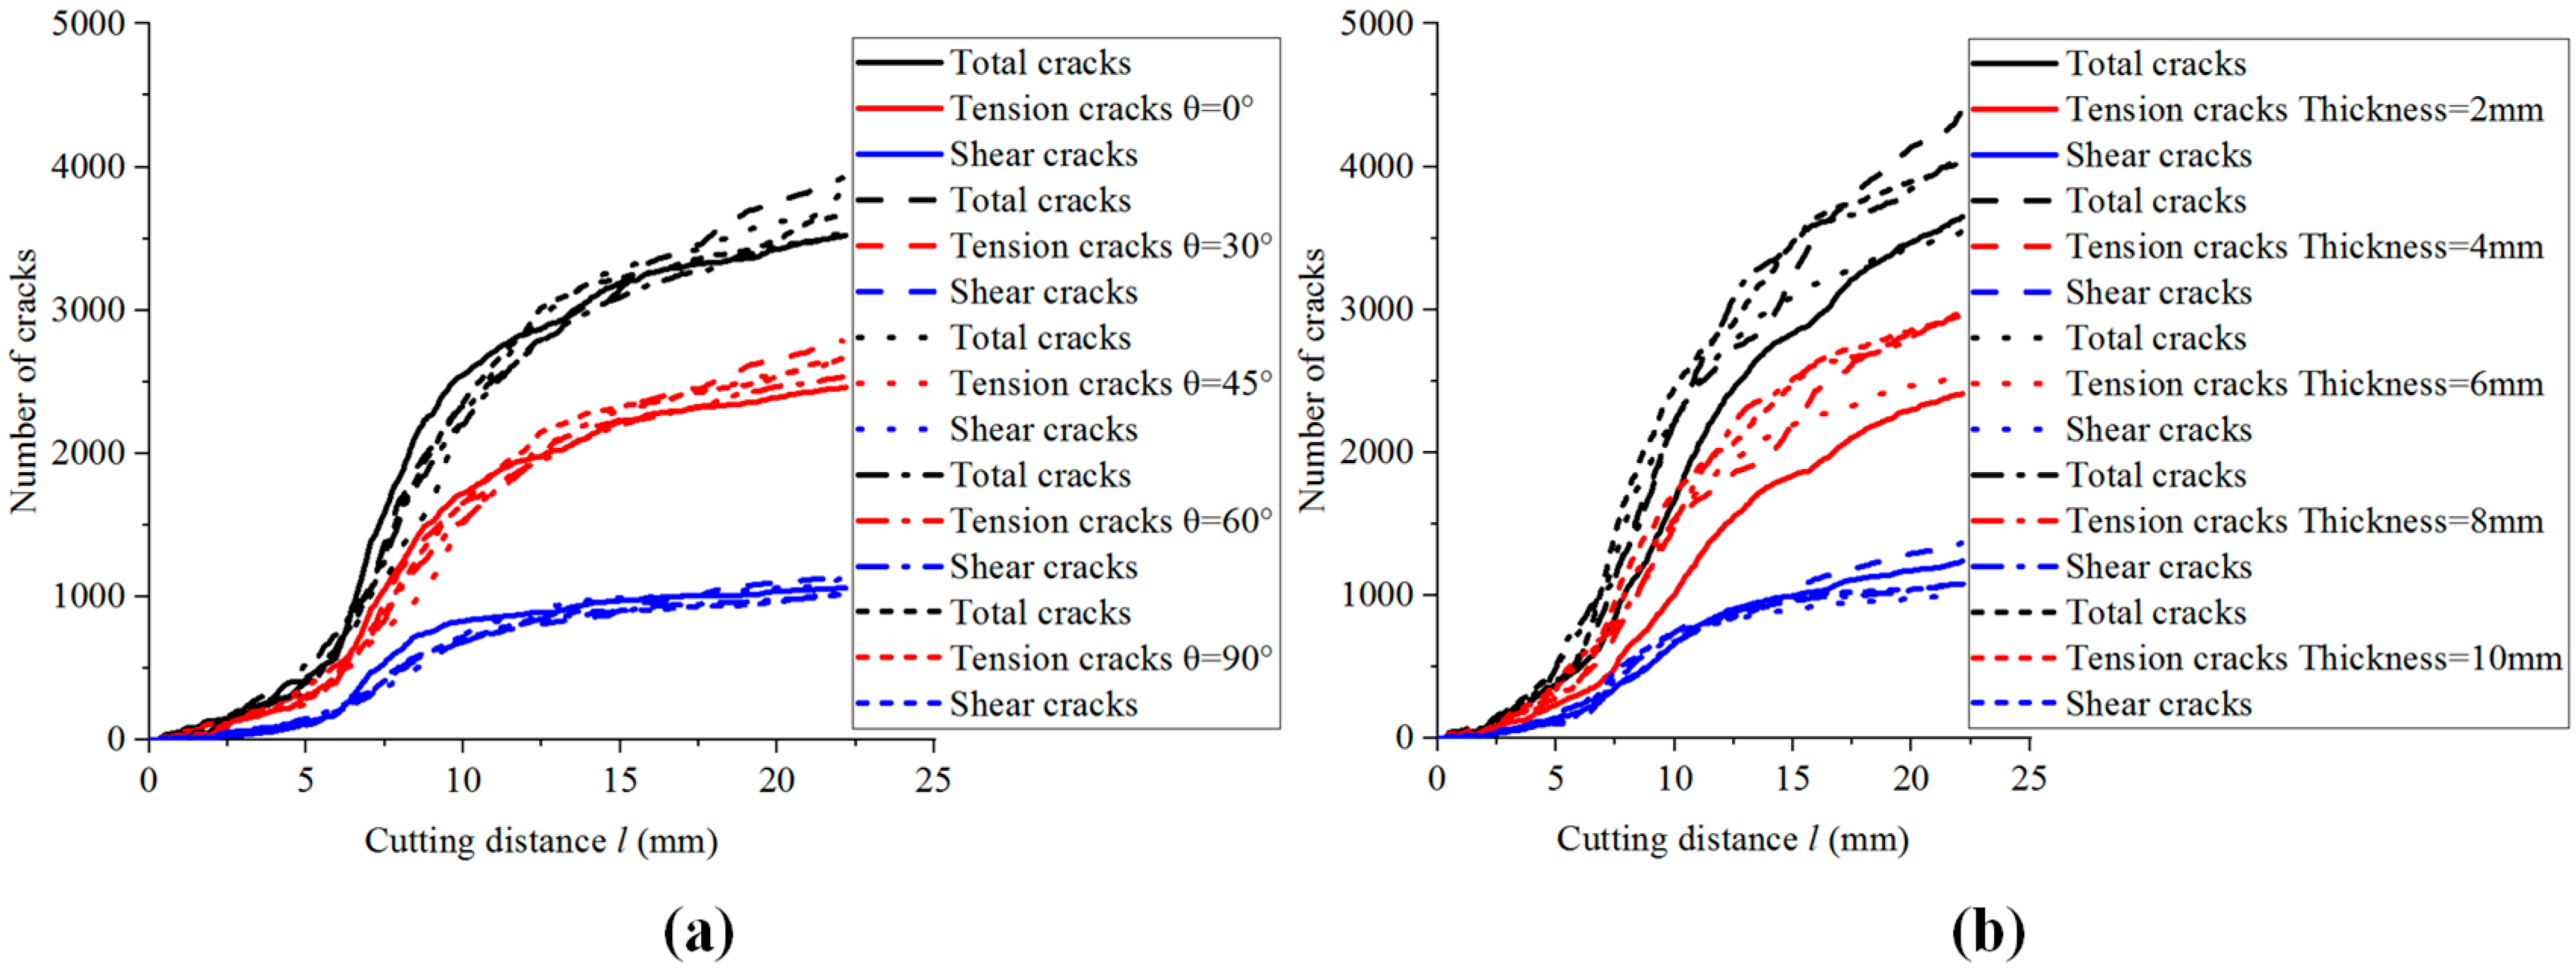
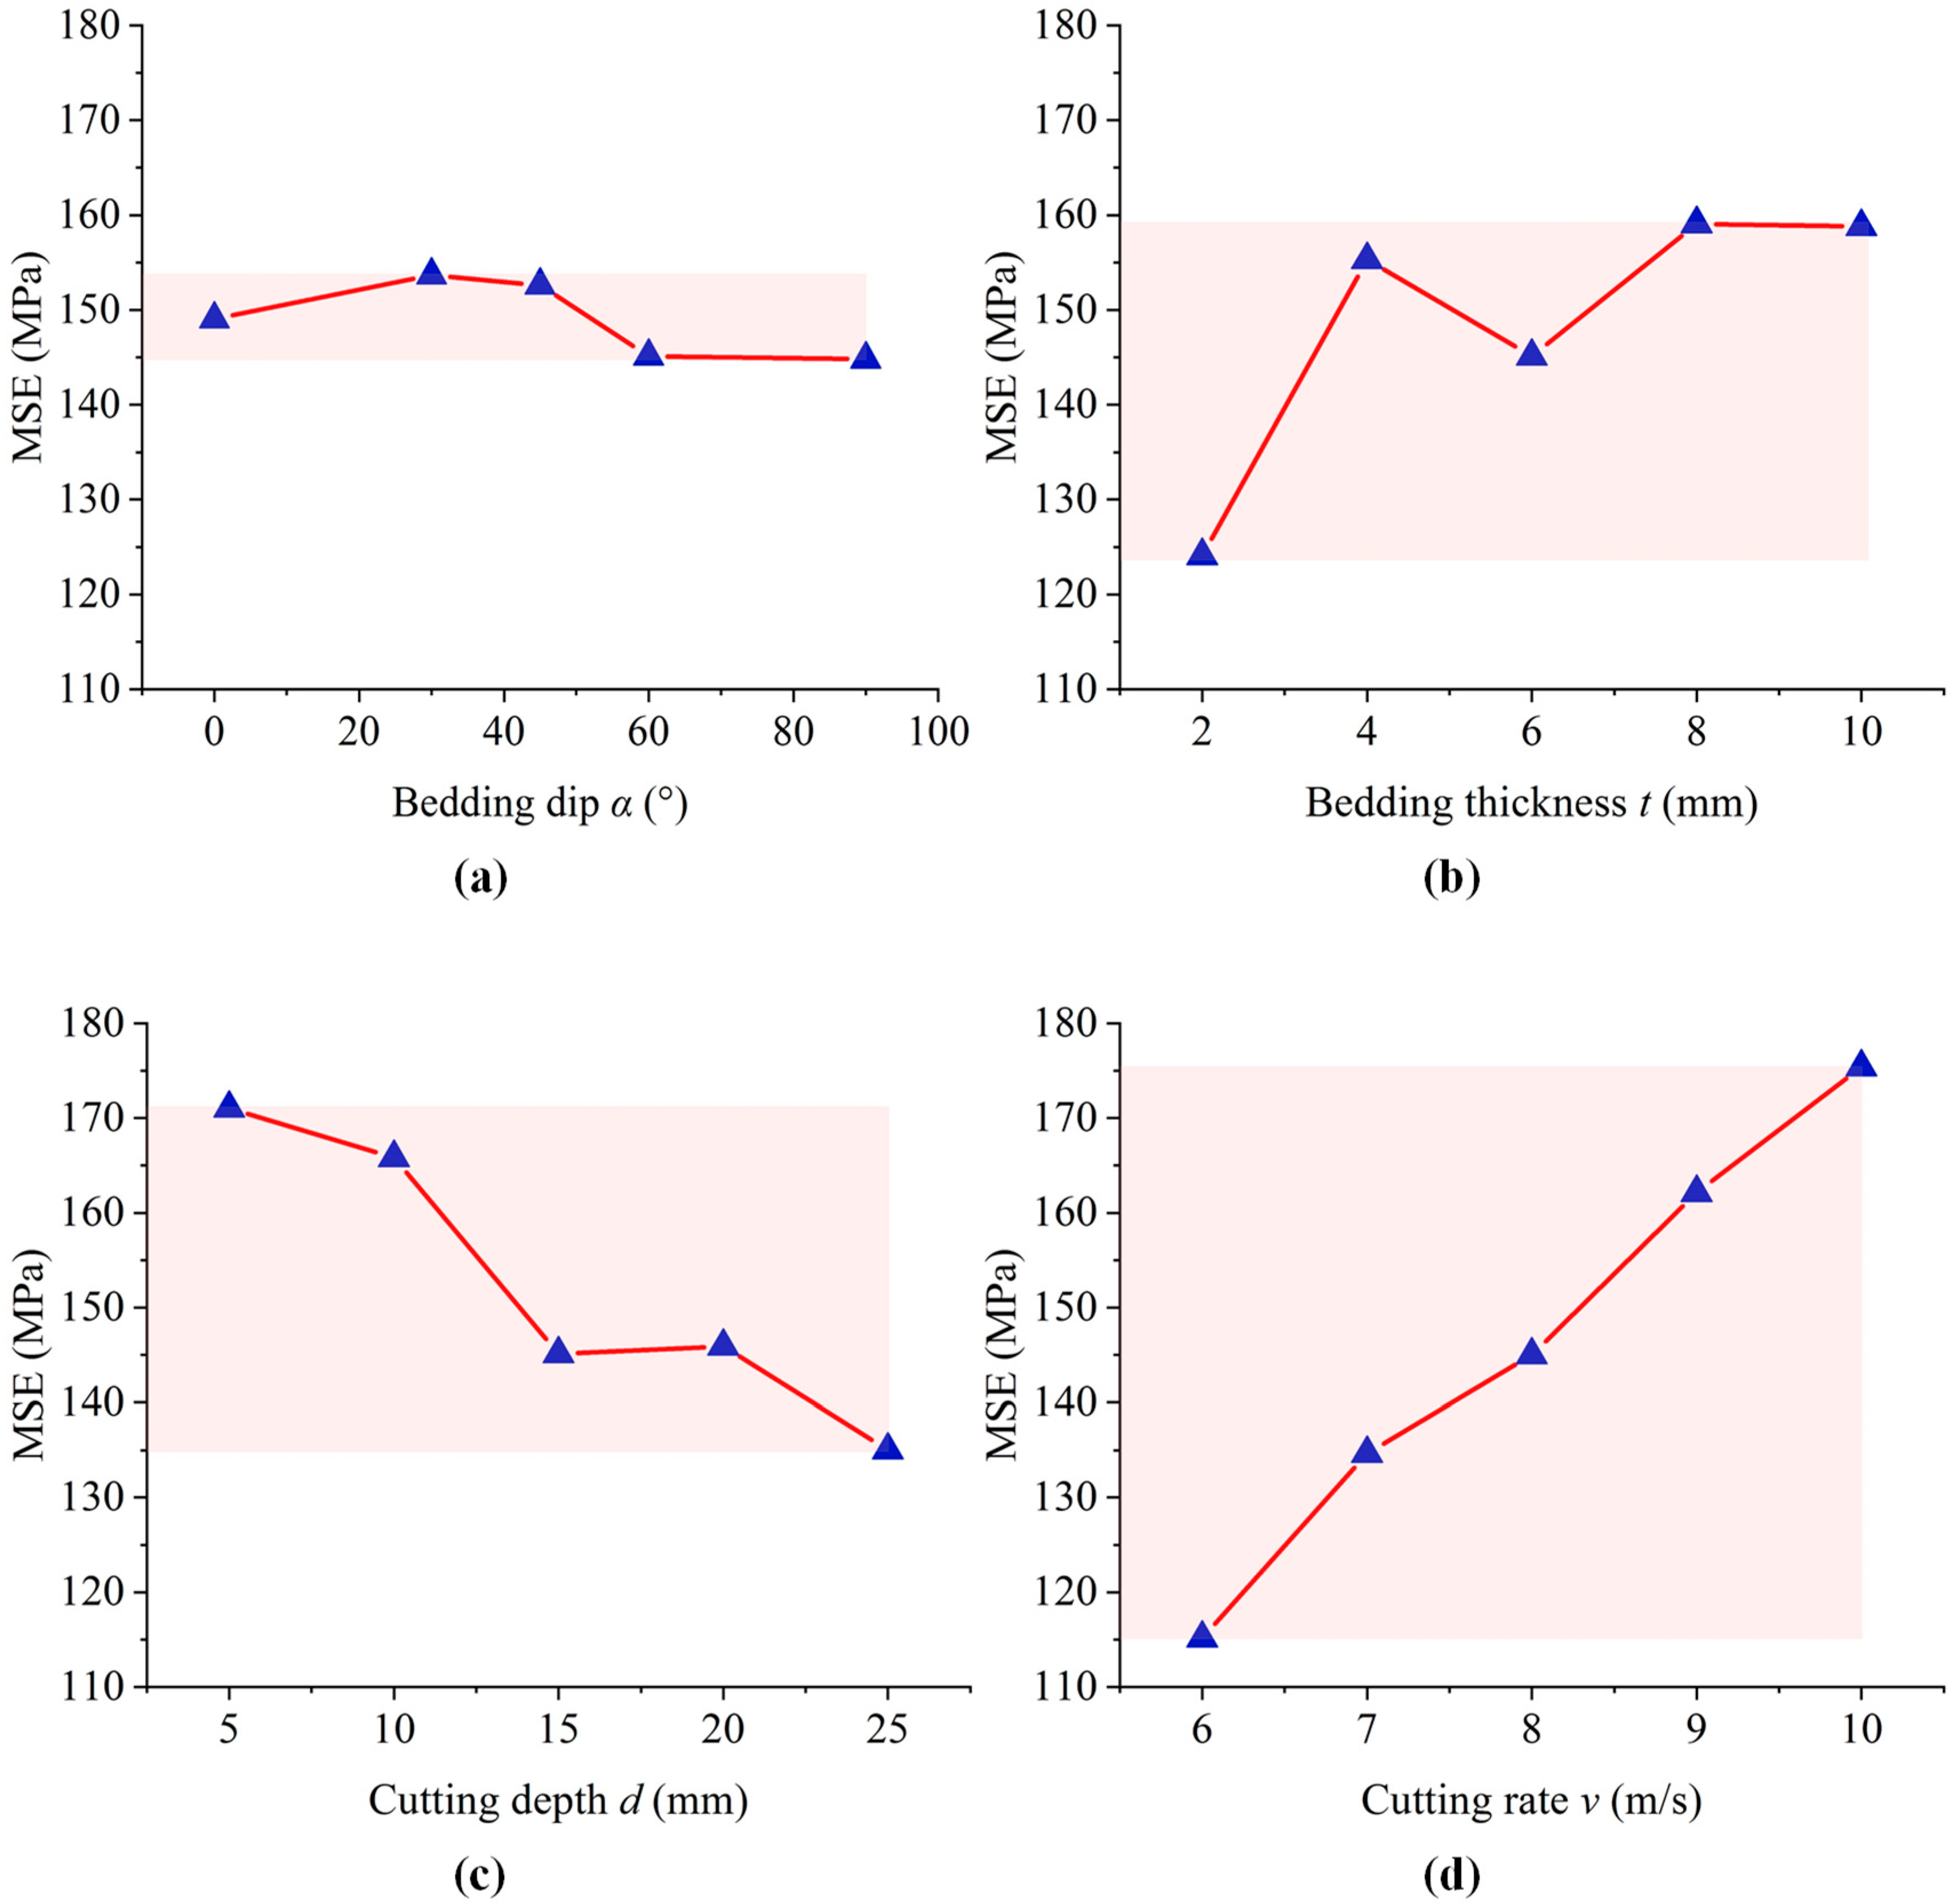
3.1. Effect of Bedding Dip
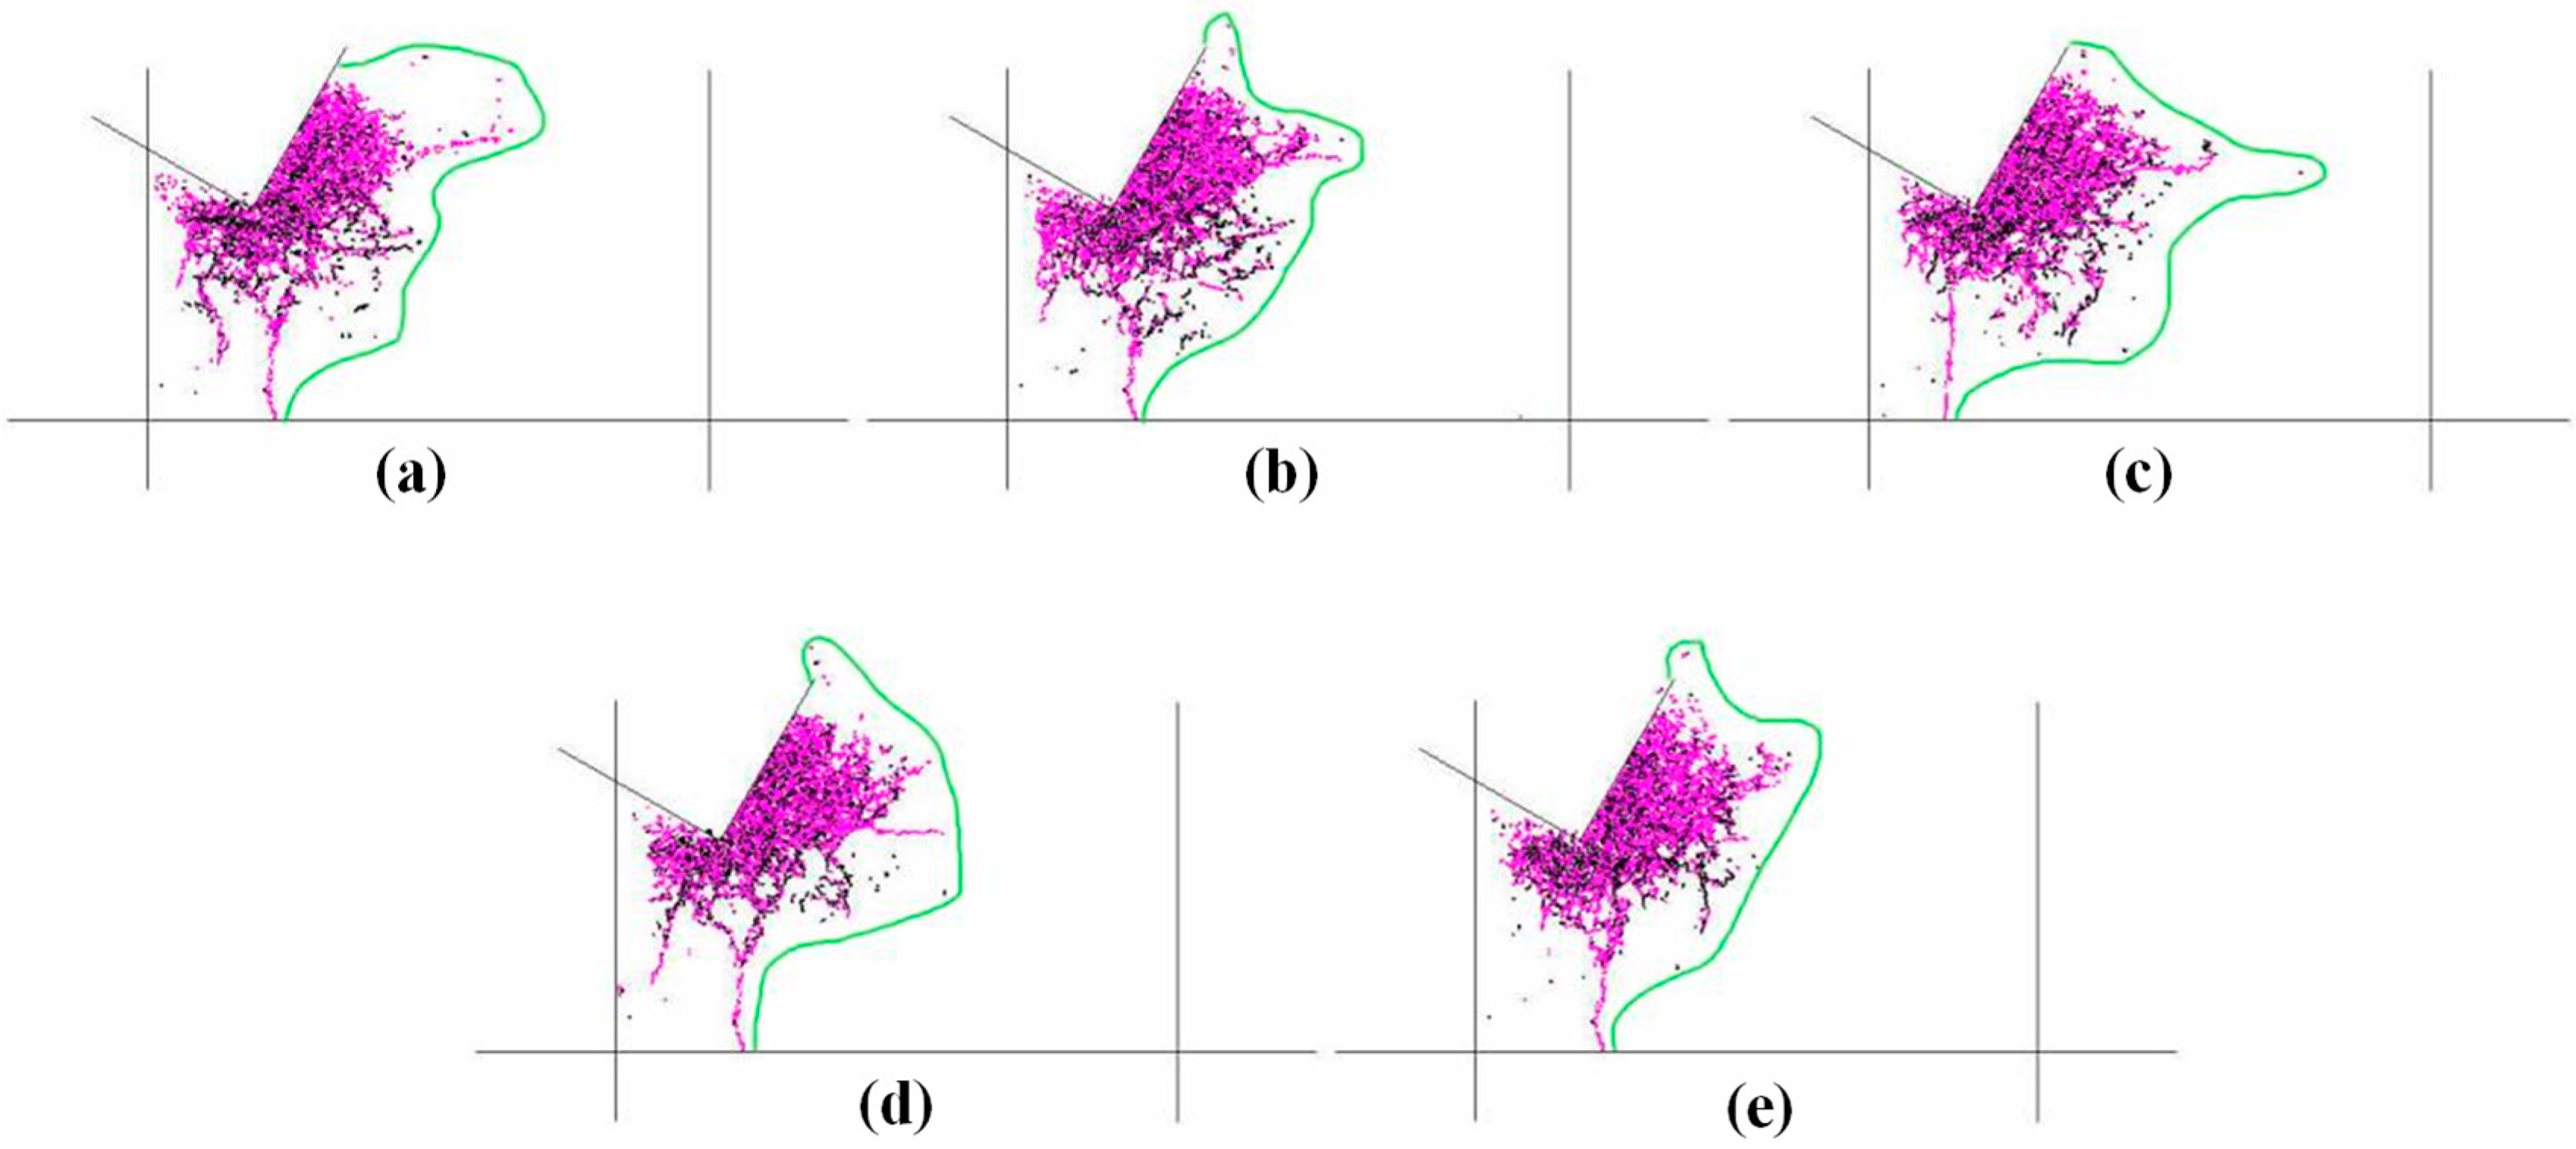
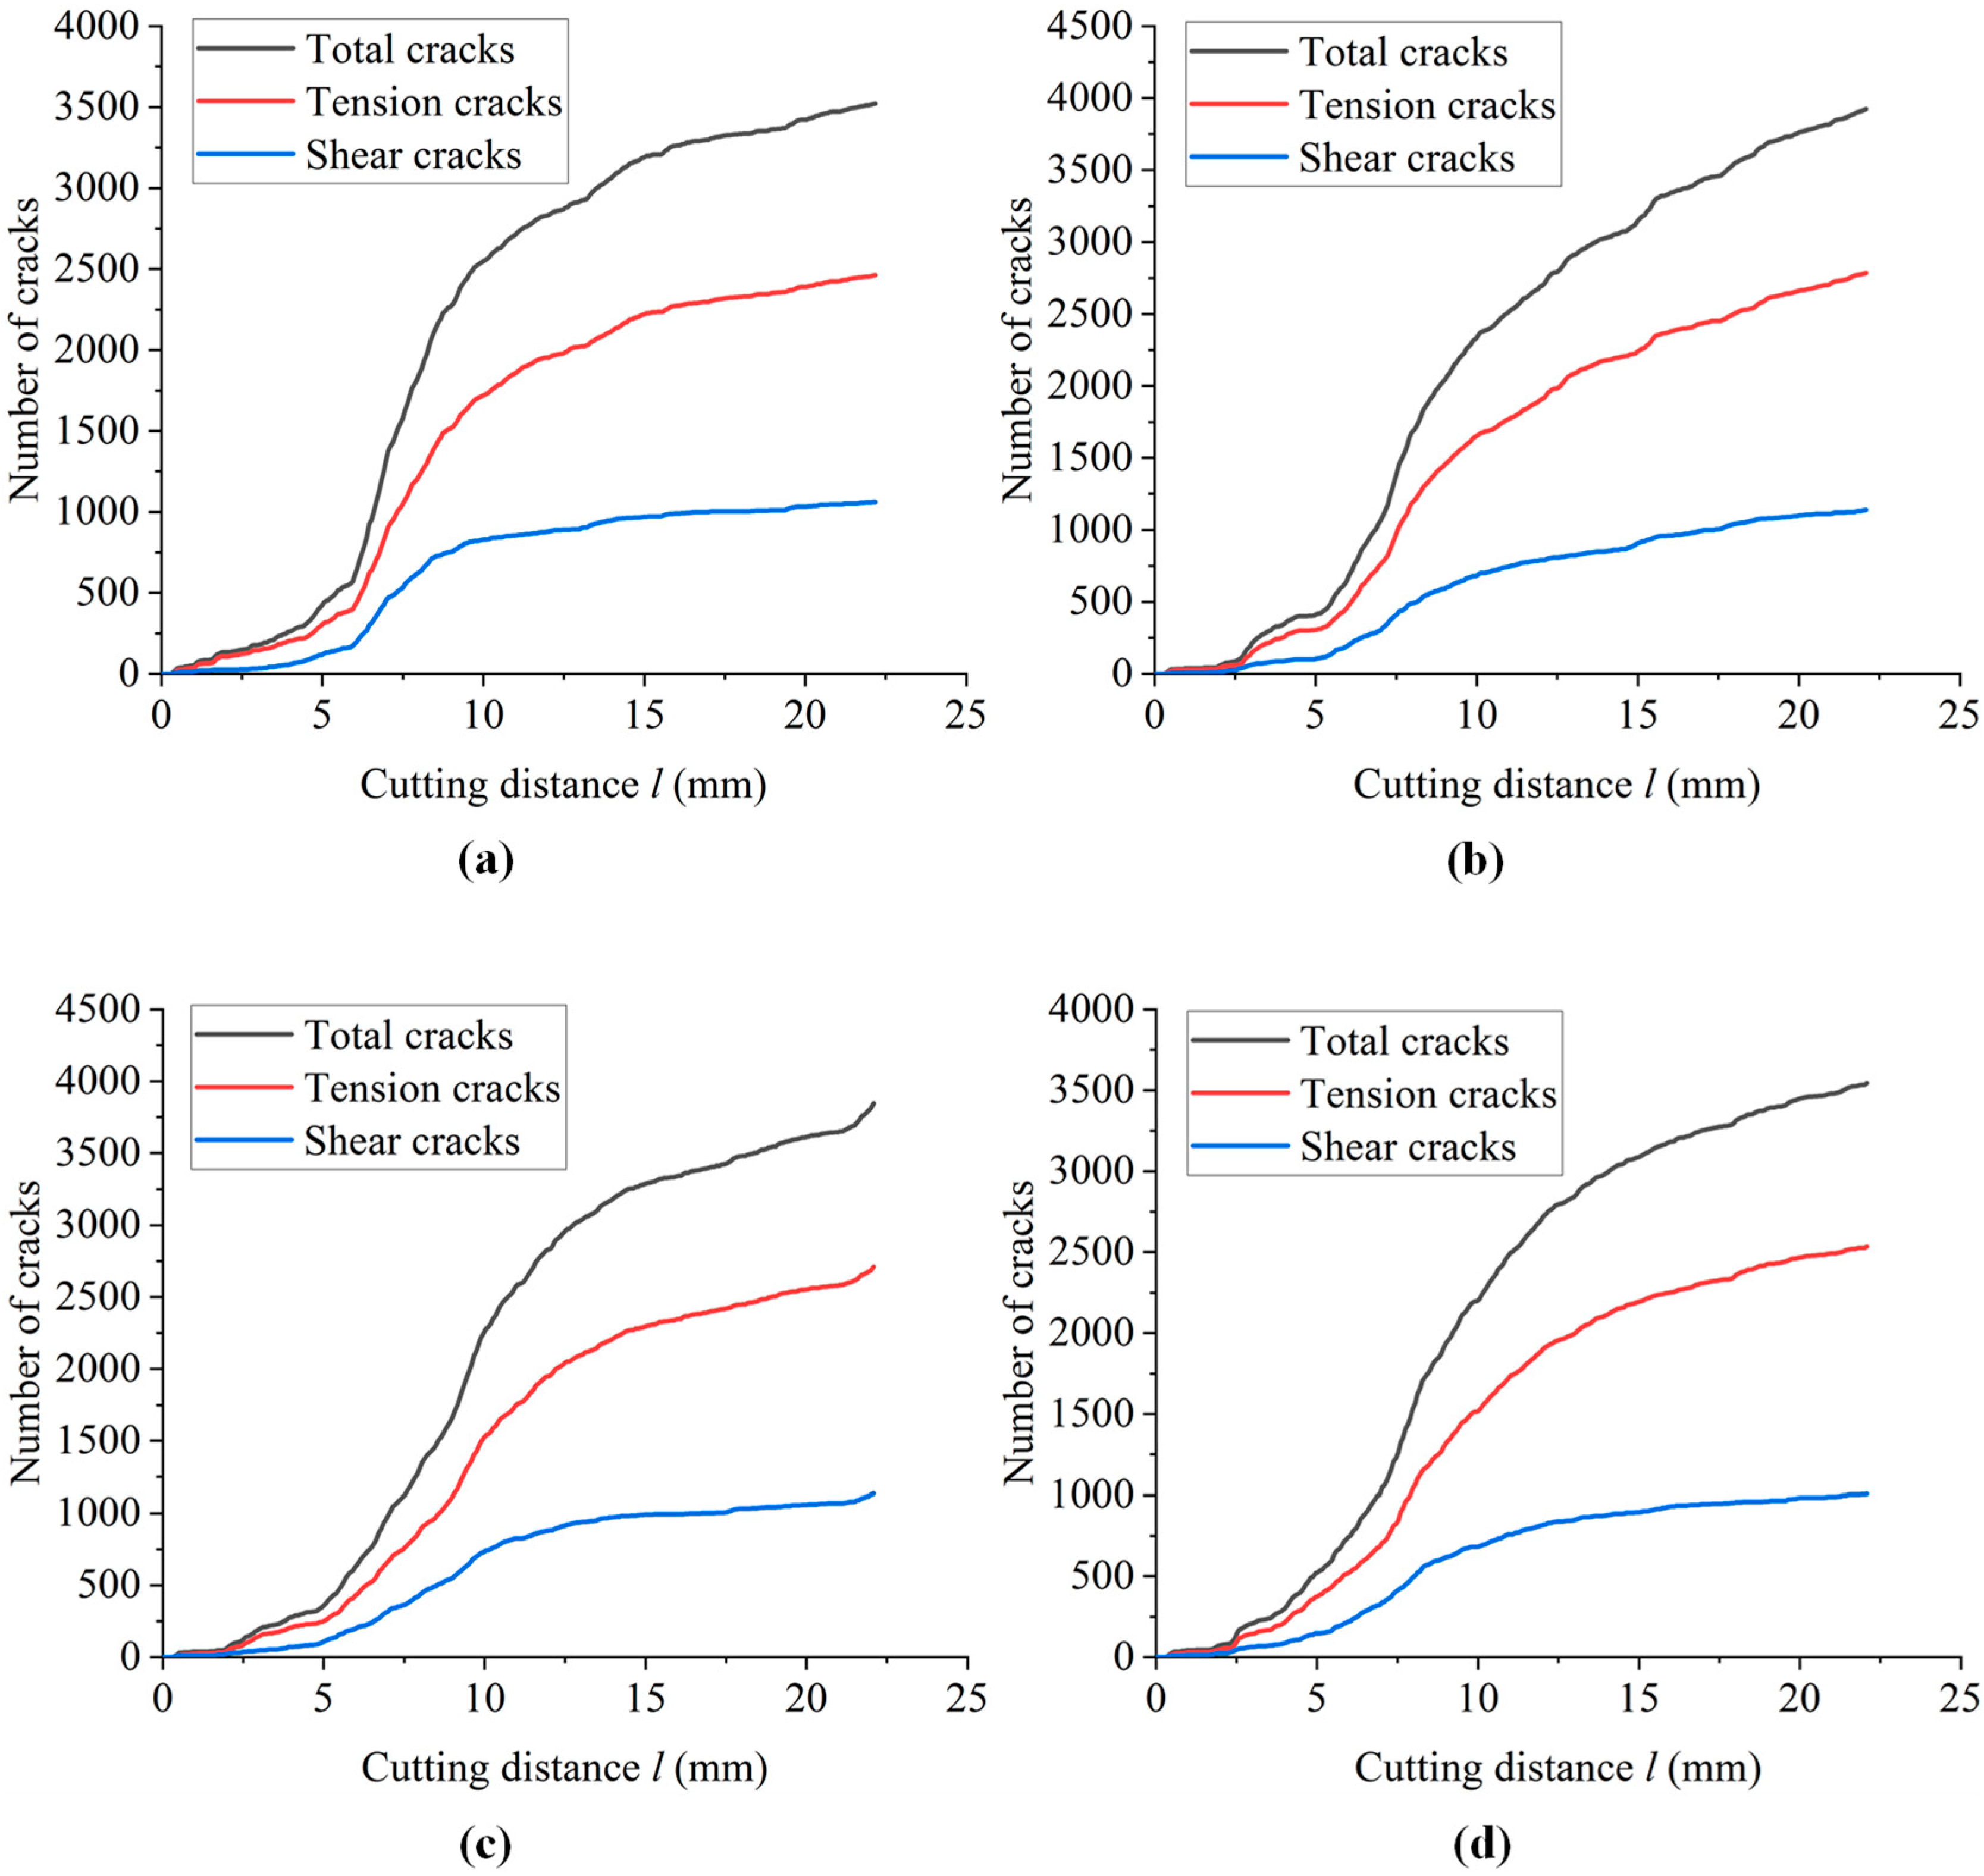
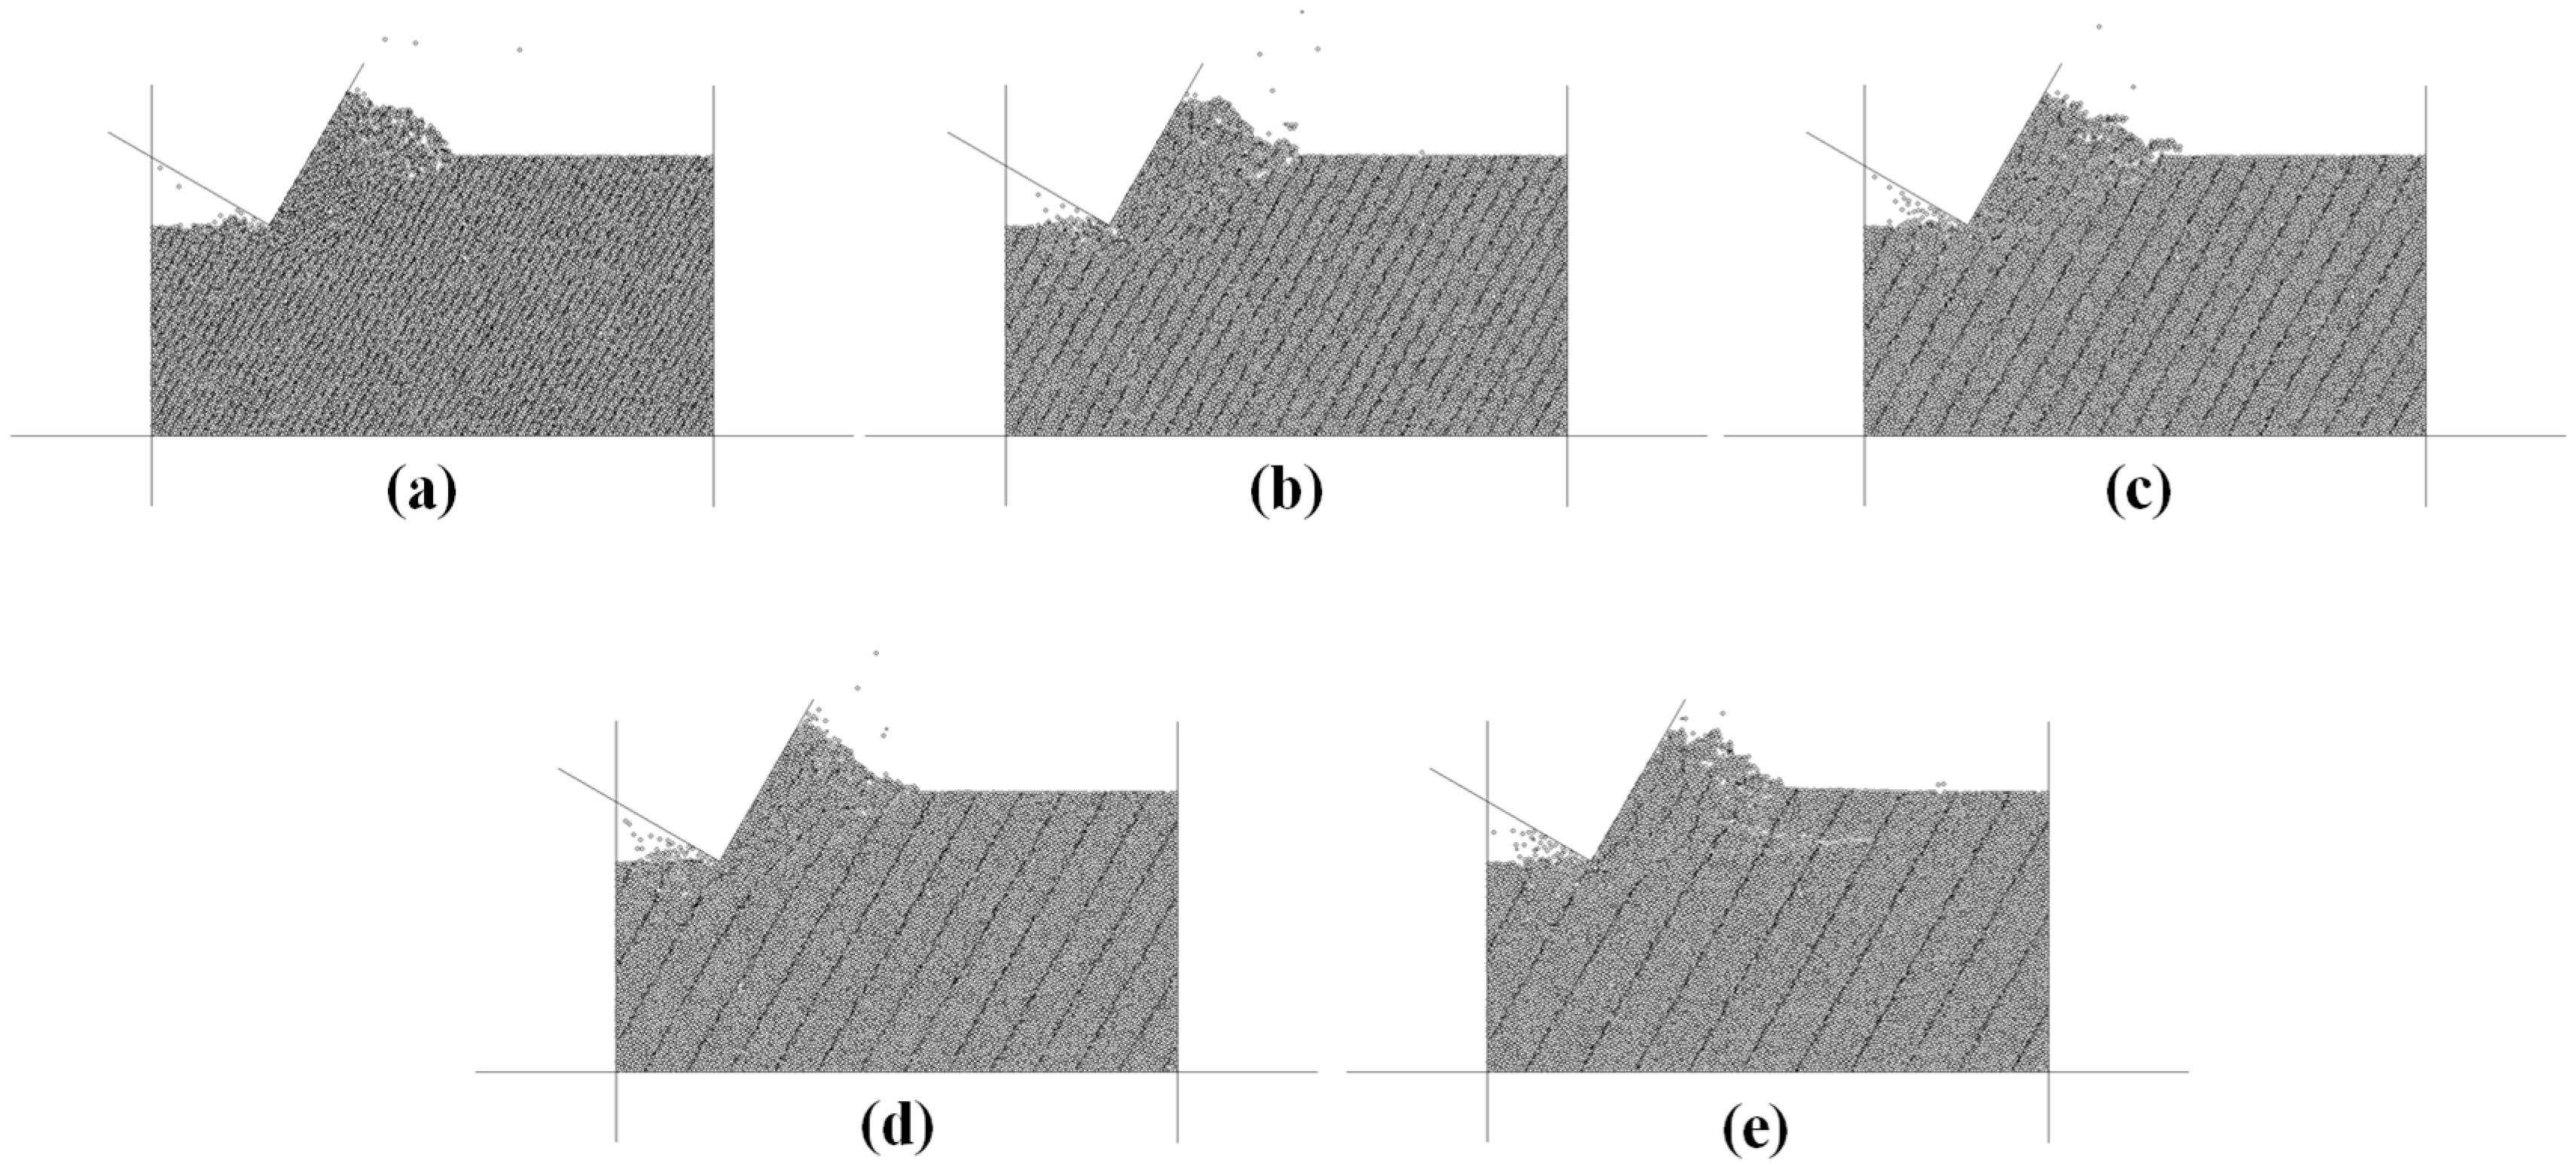
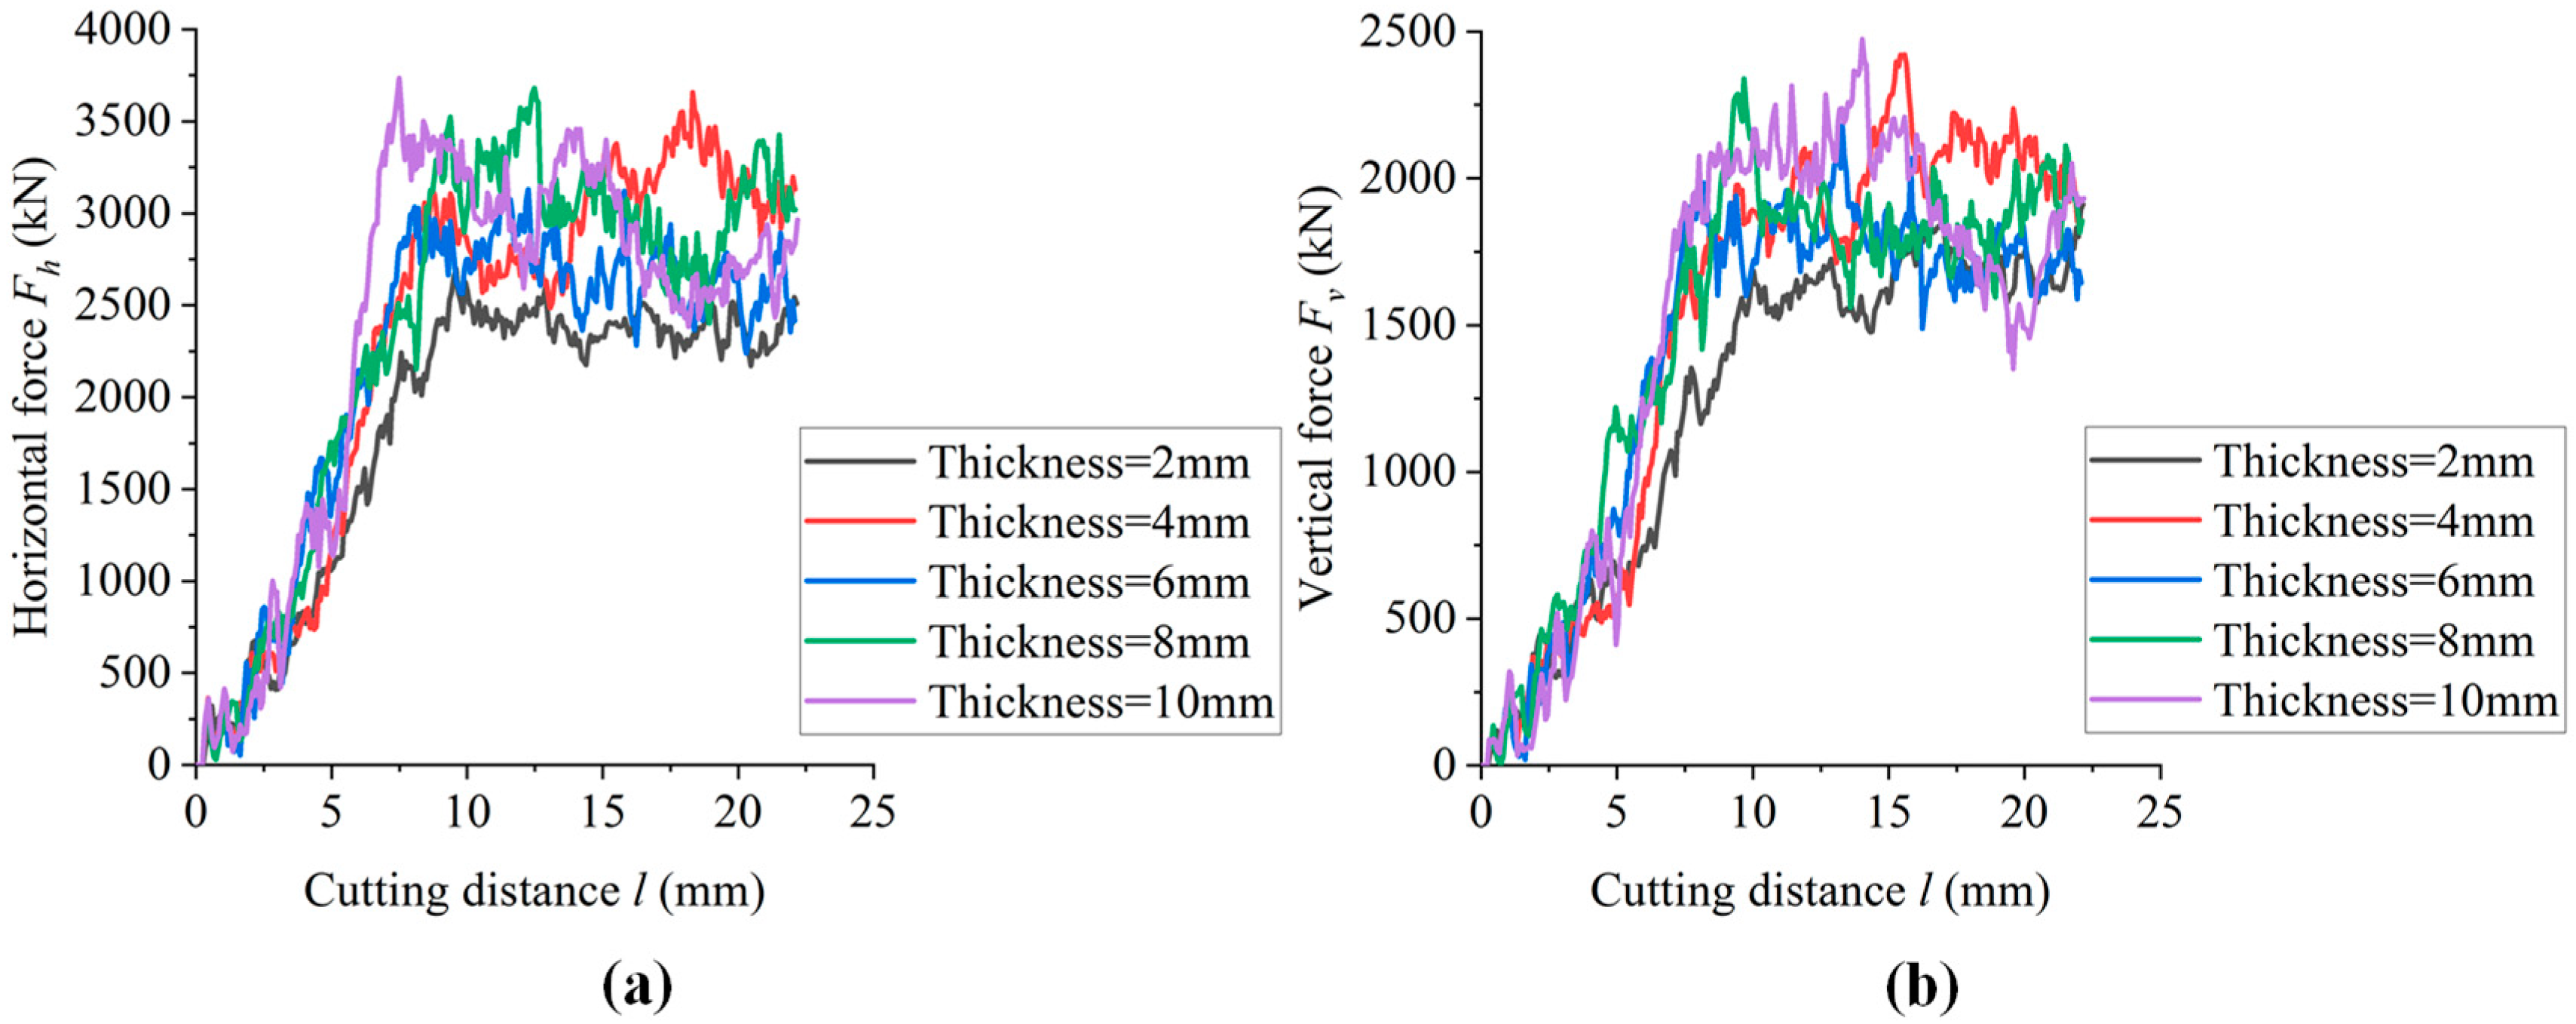
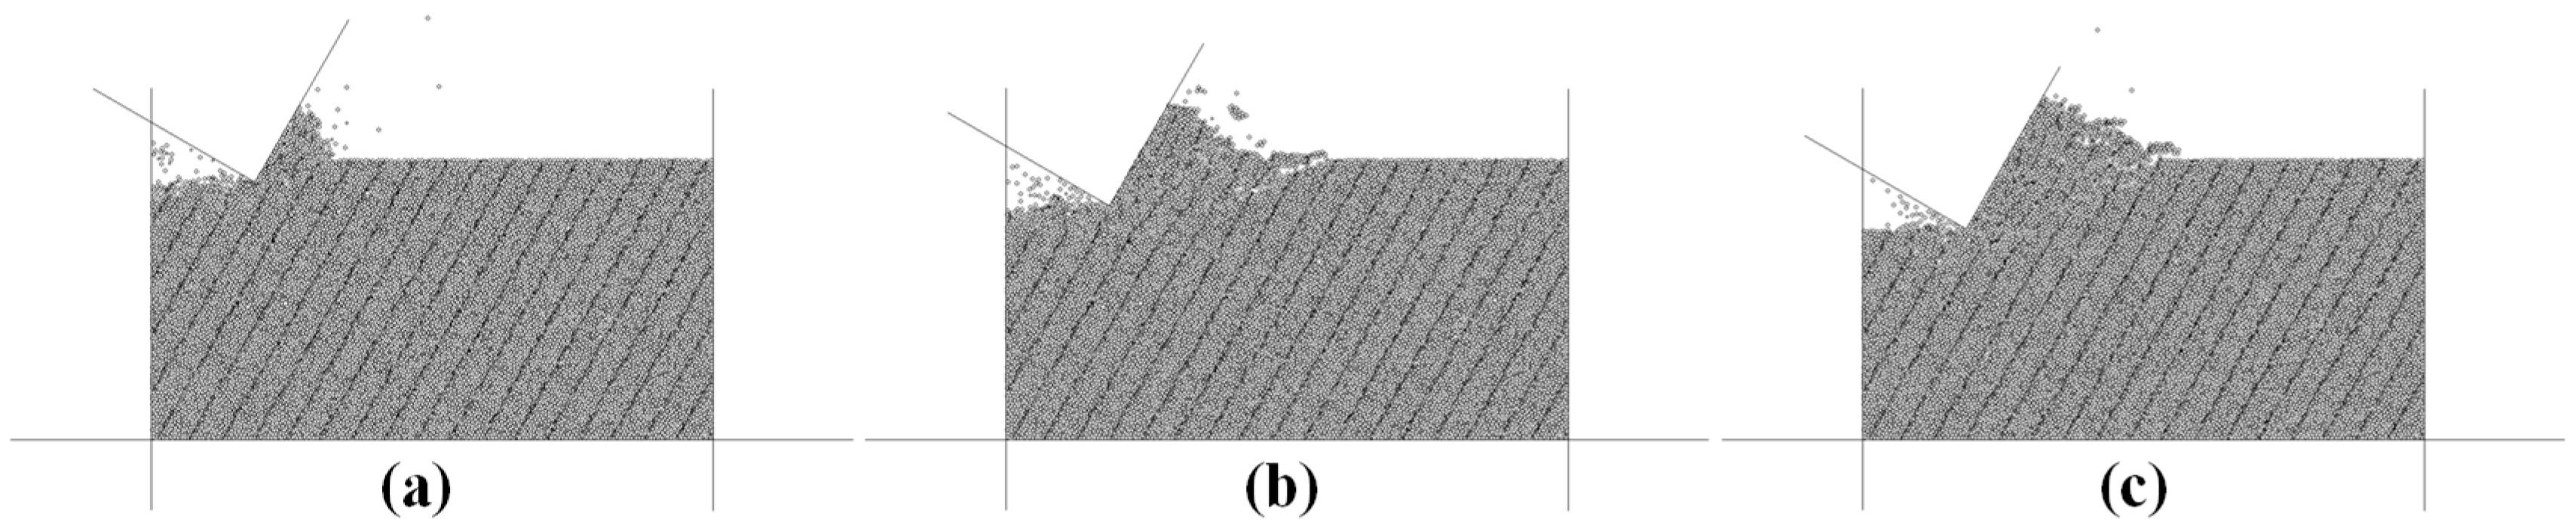
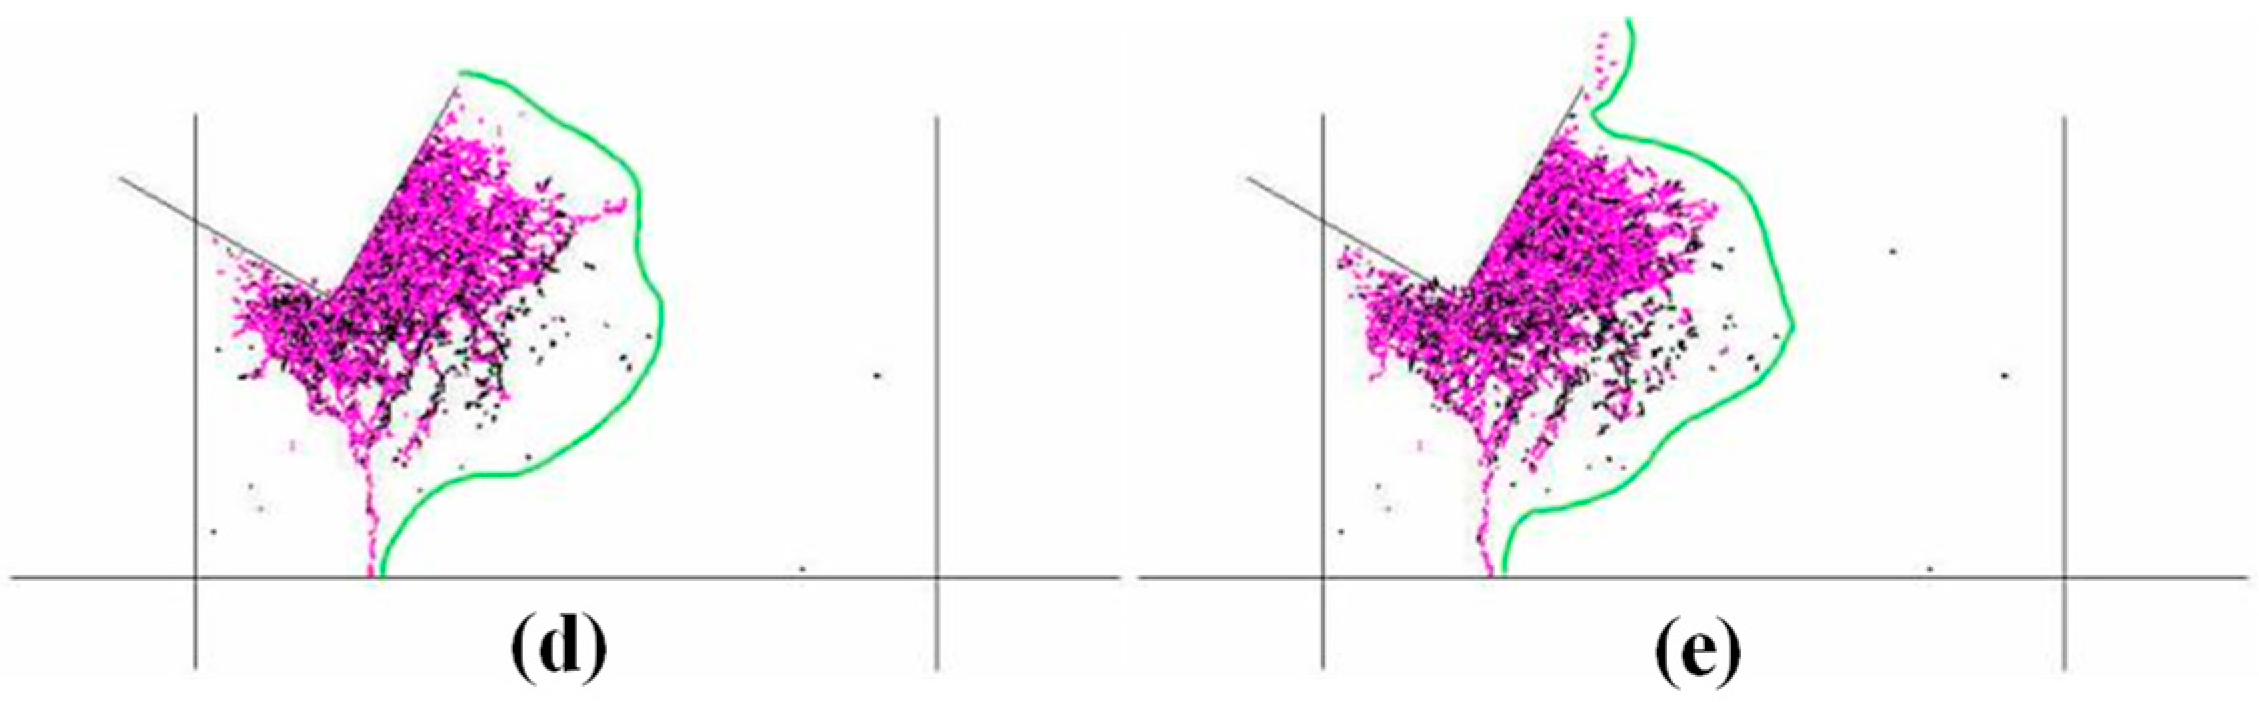
3.2. Effect of Bedding Thickness
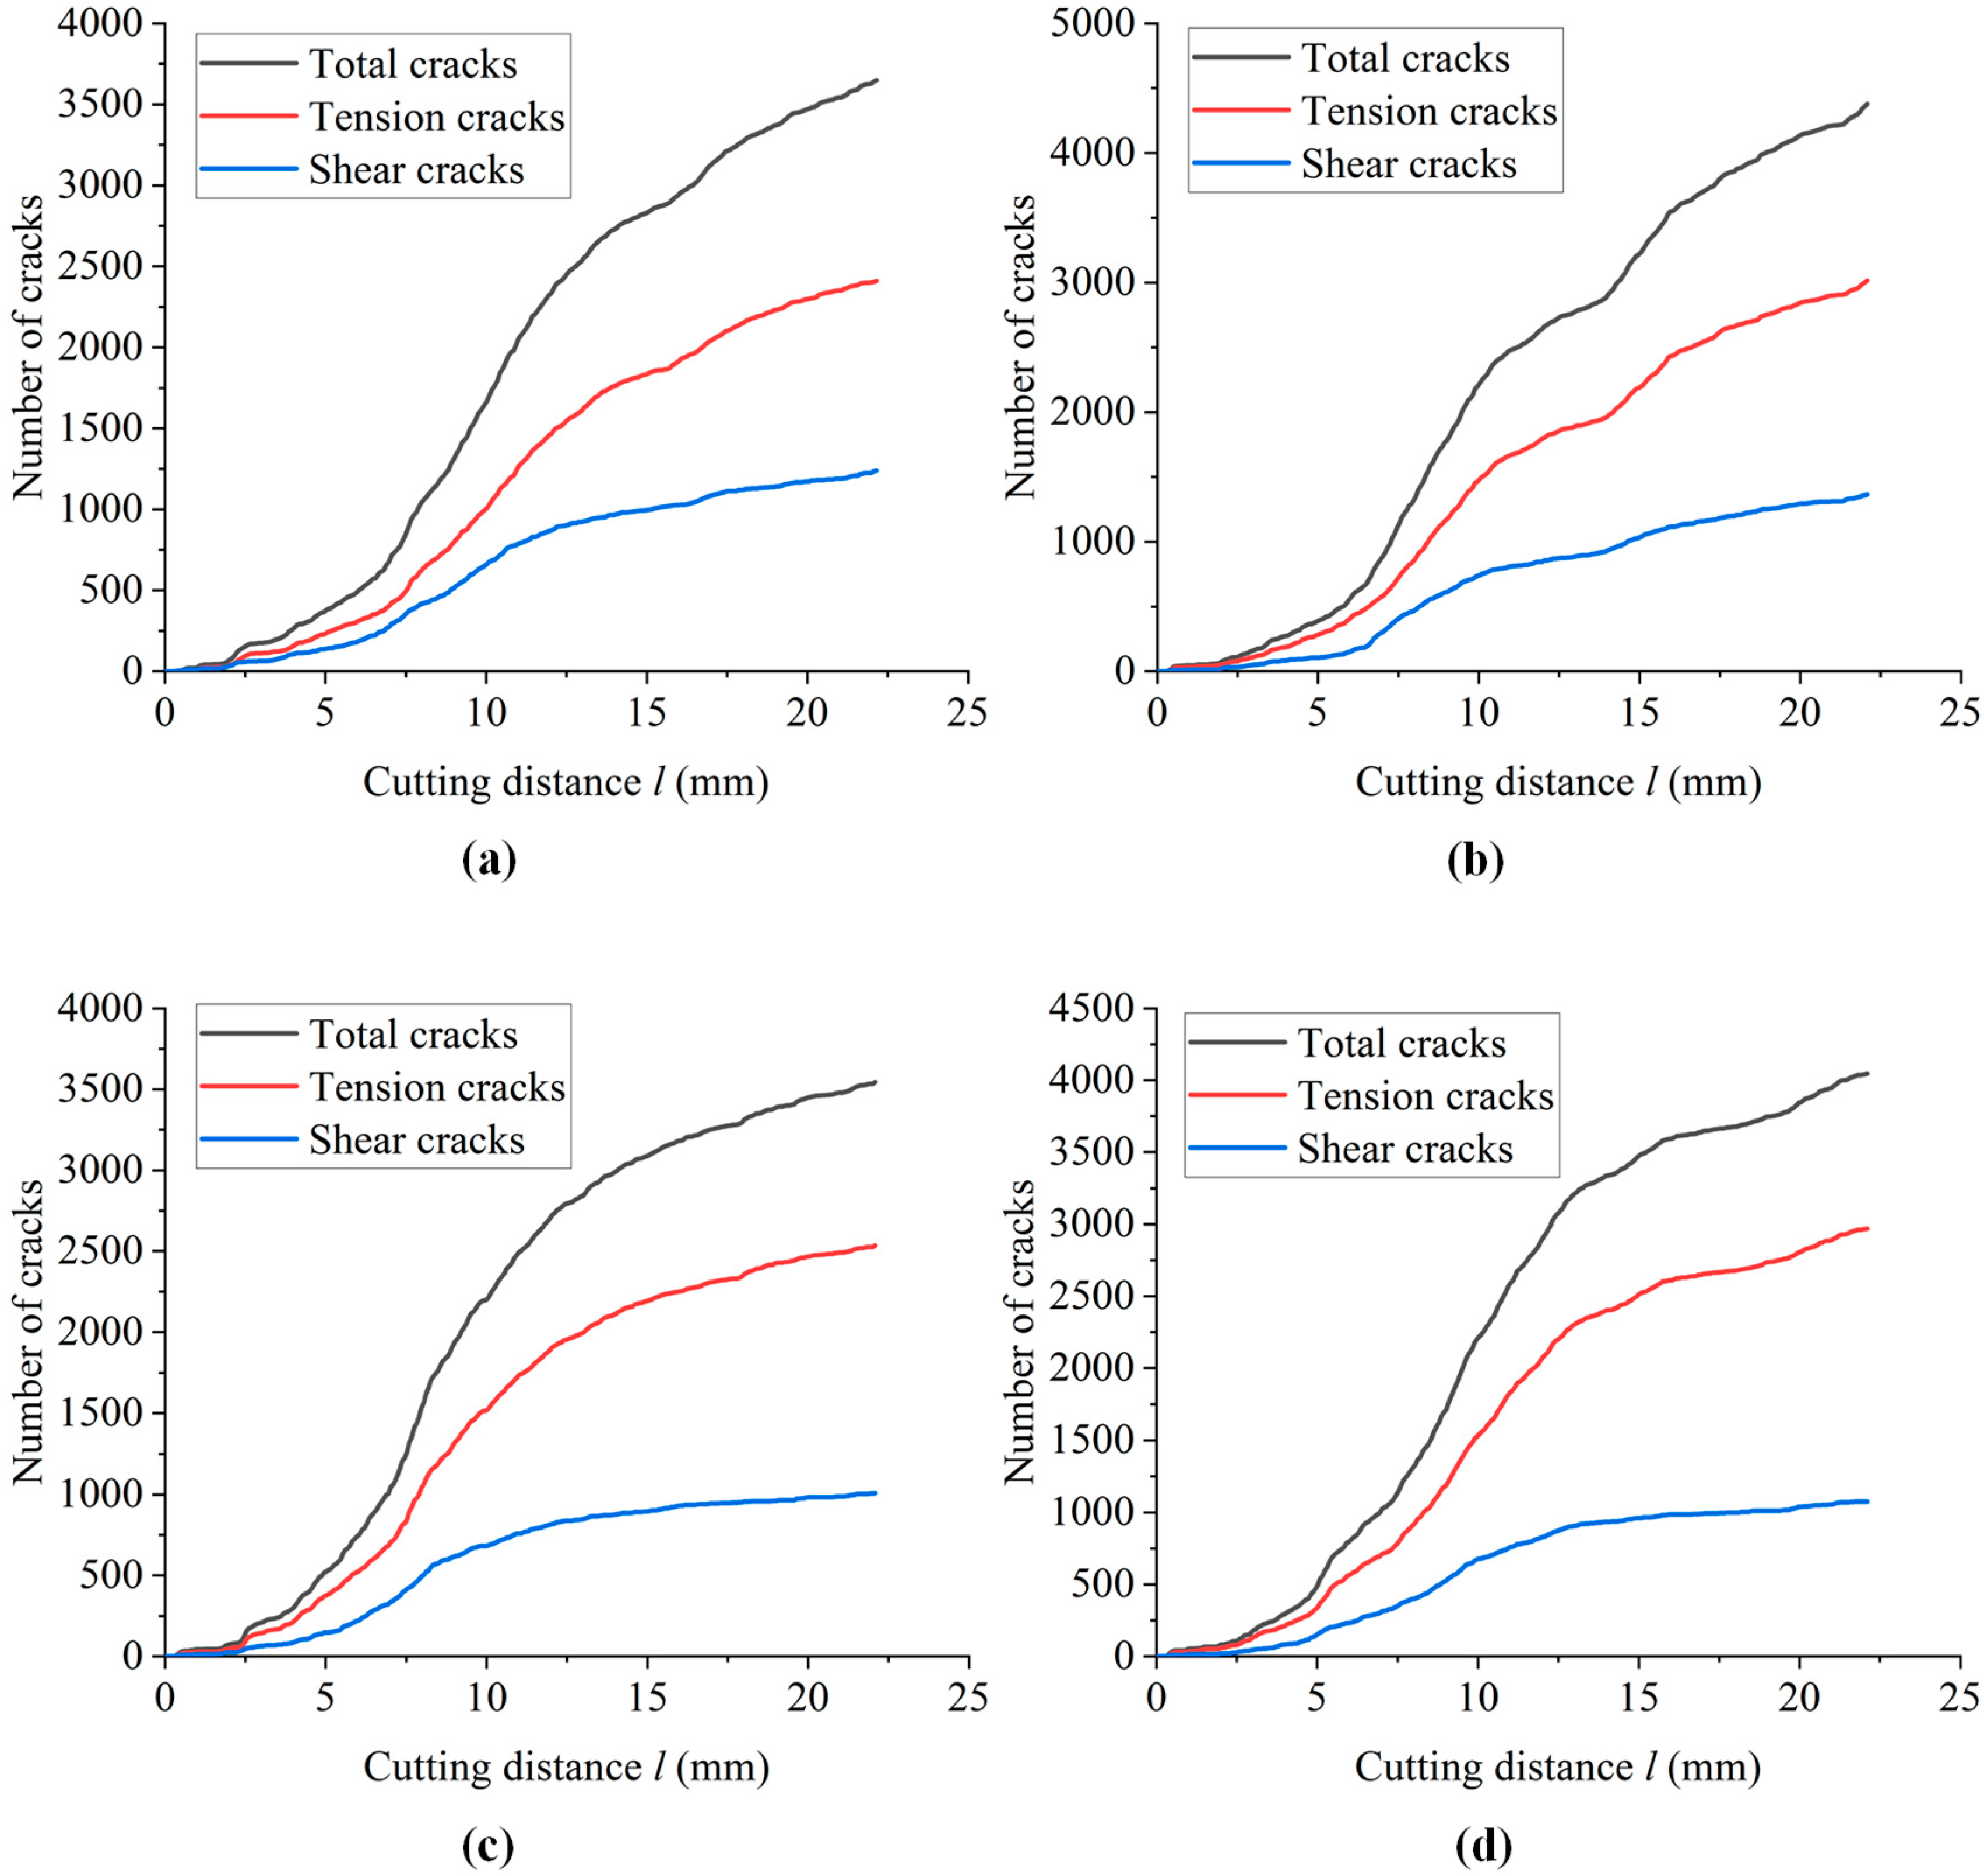
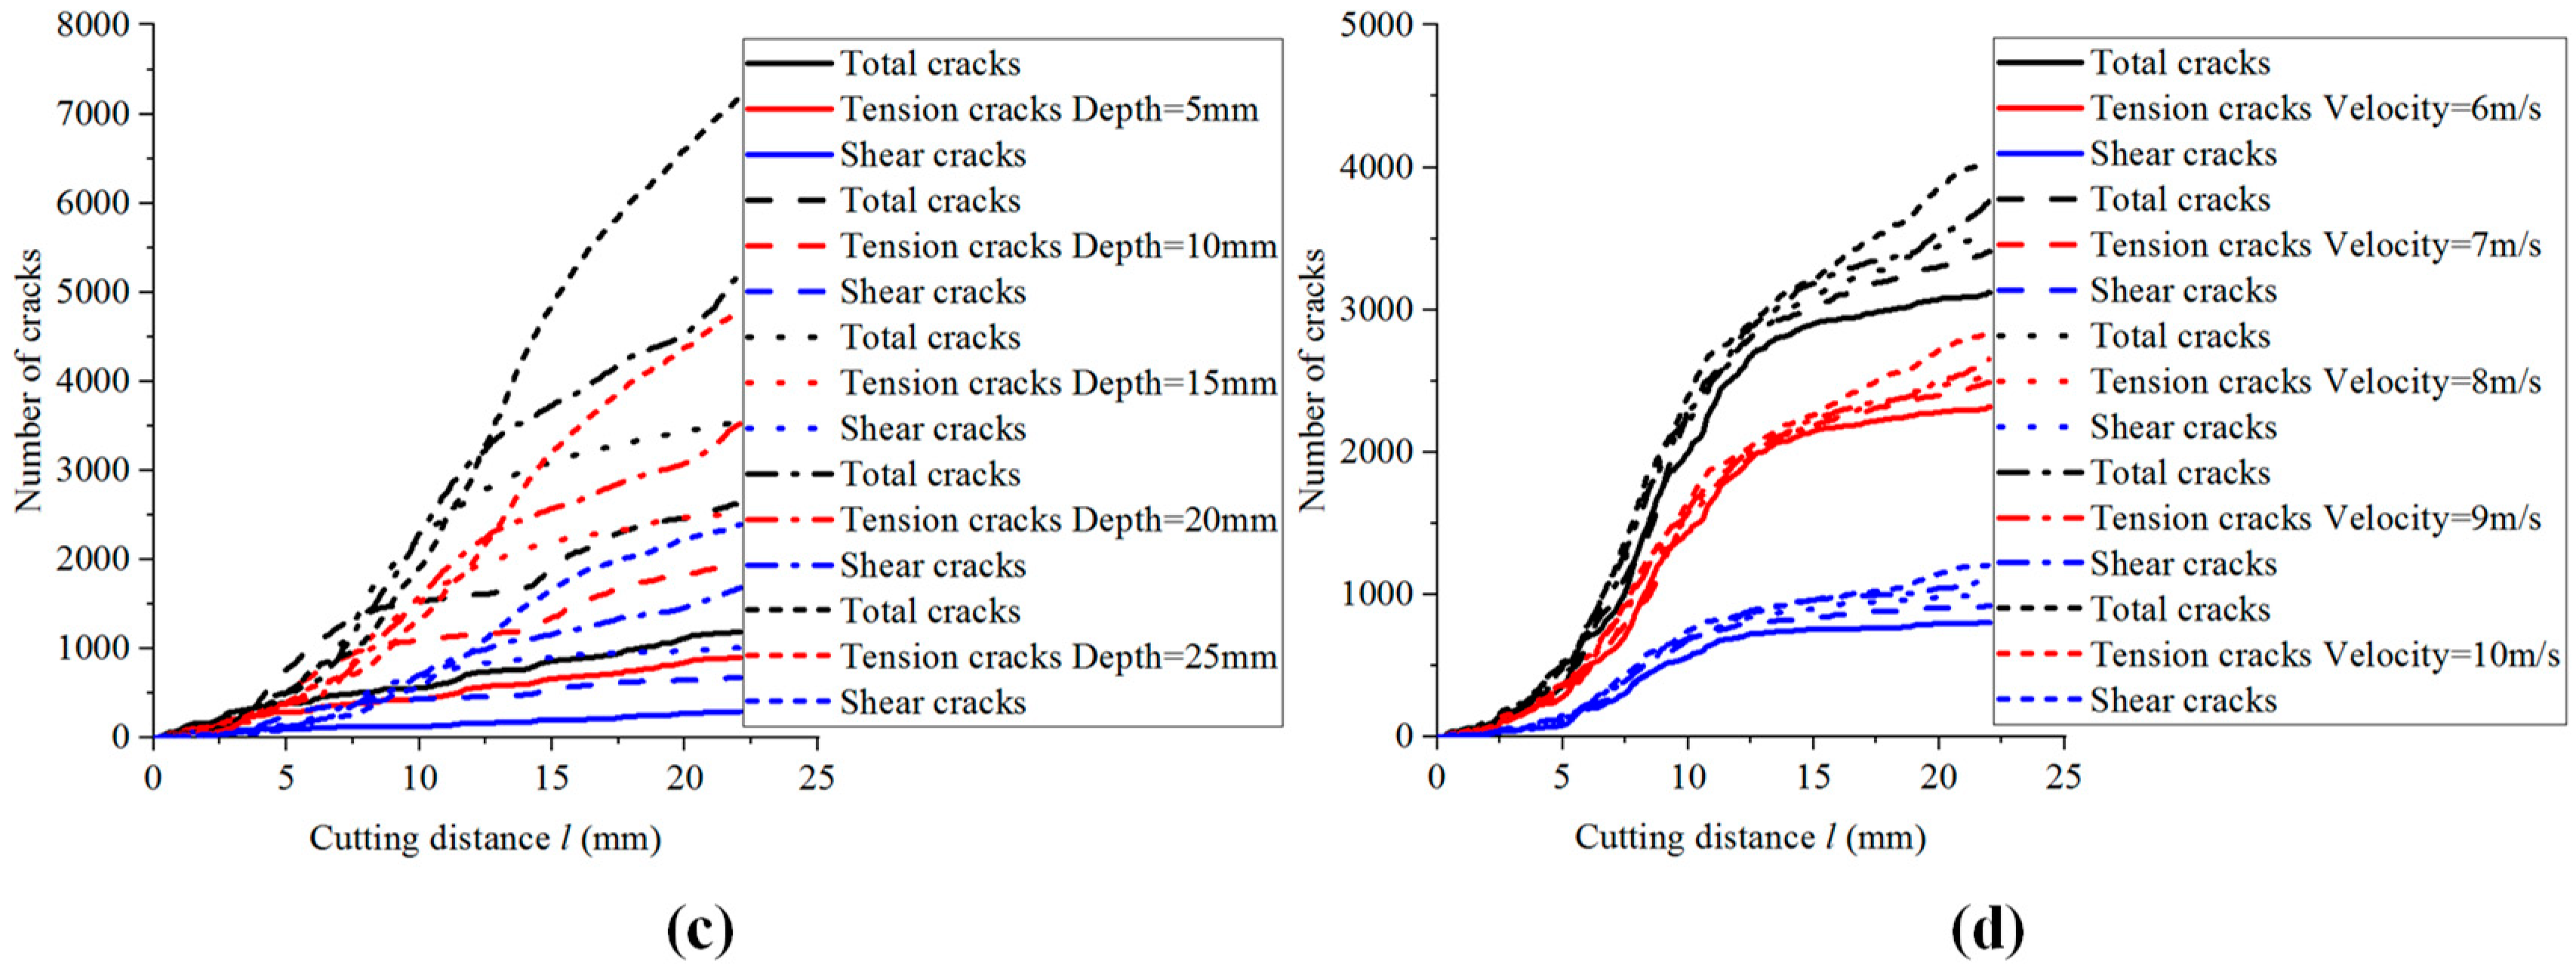
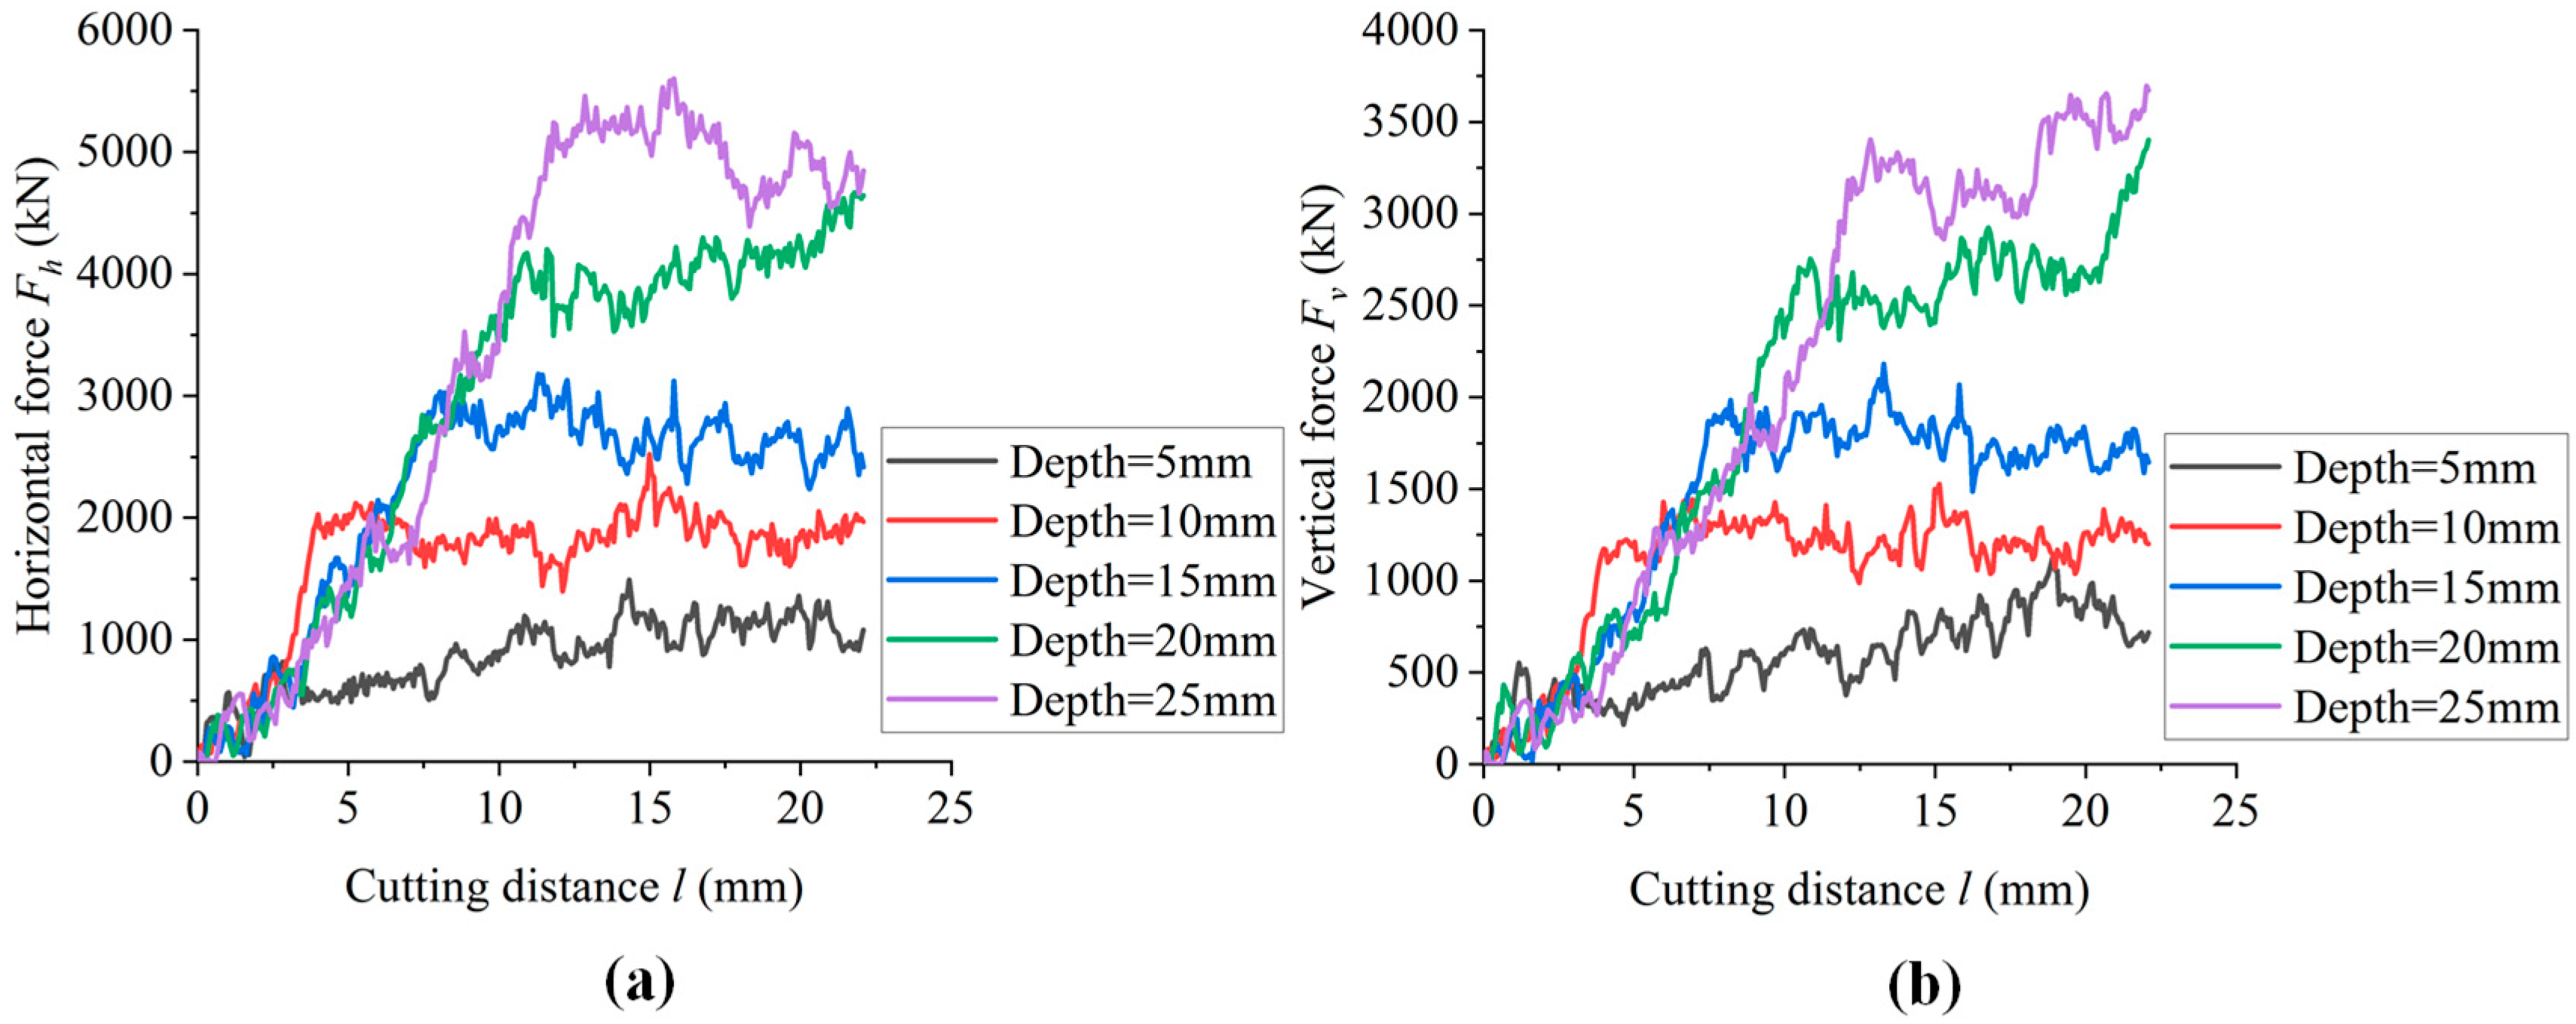
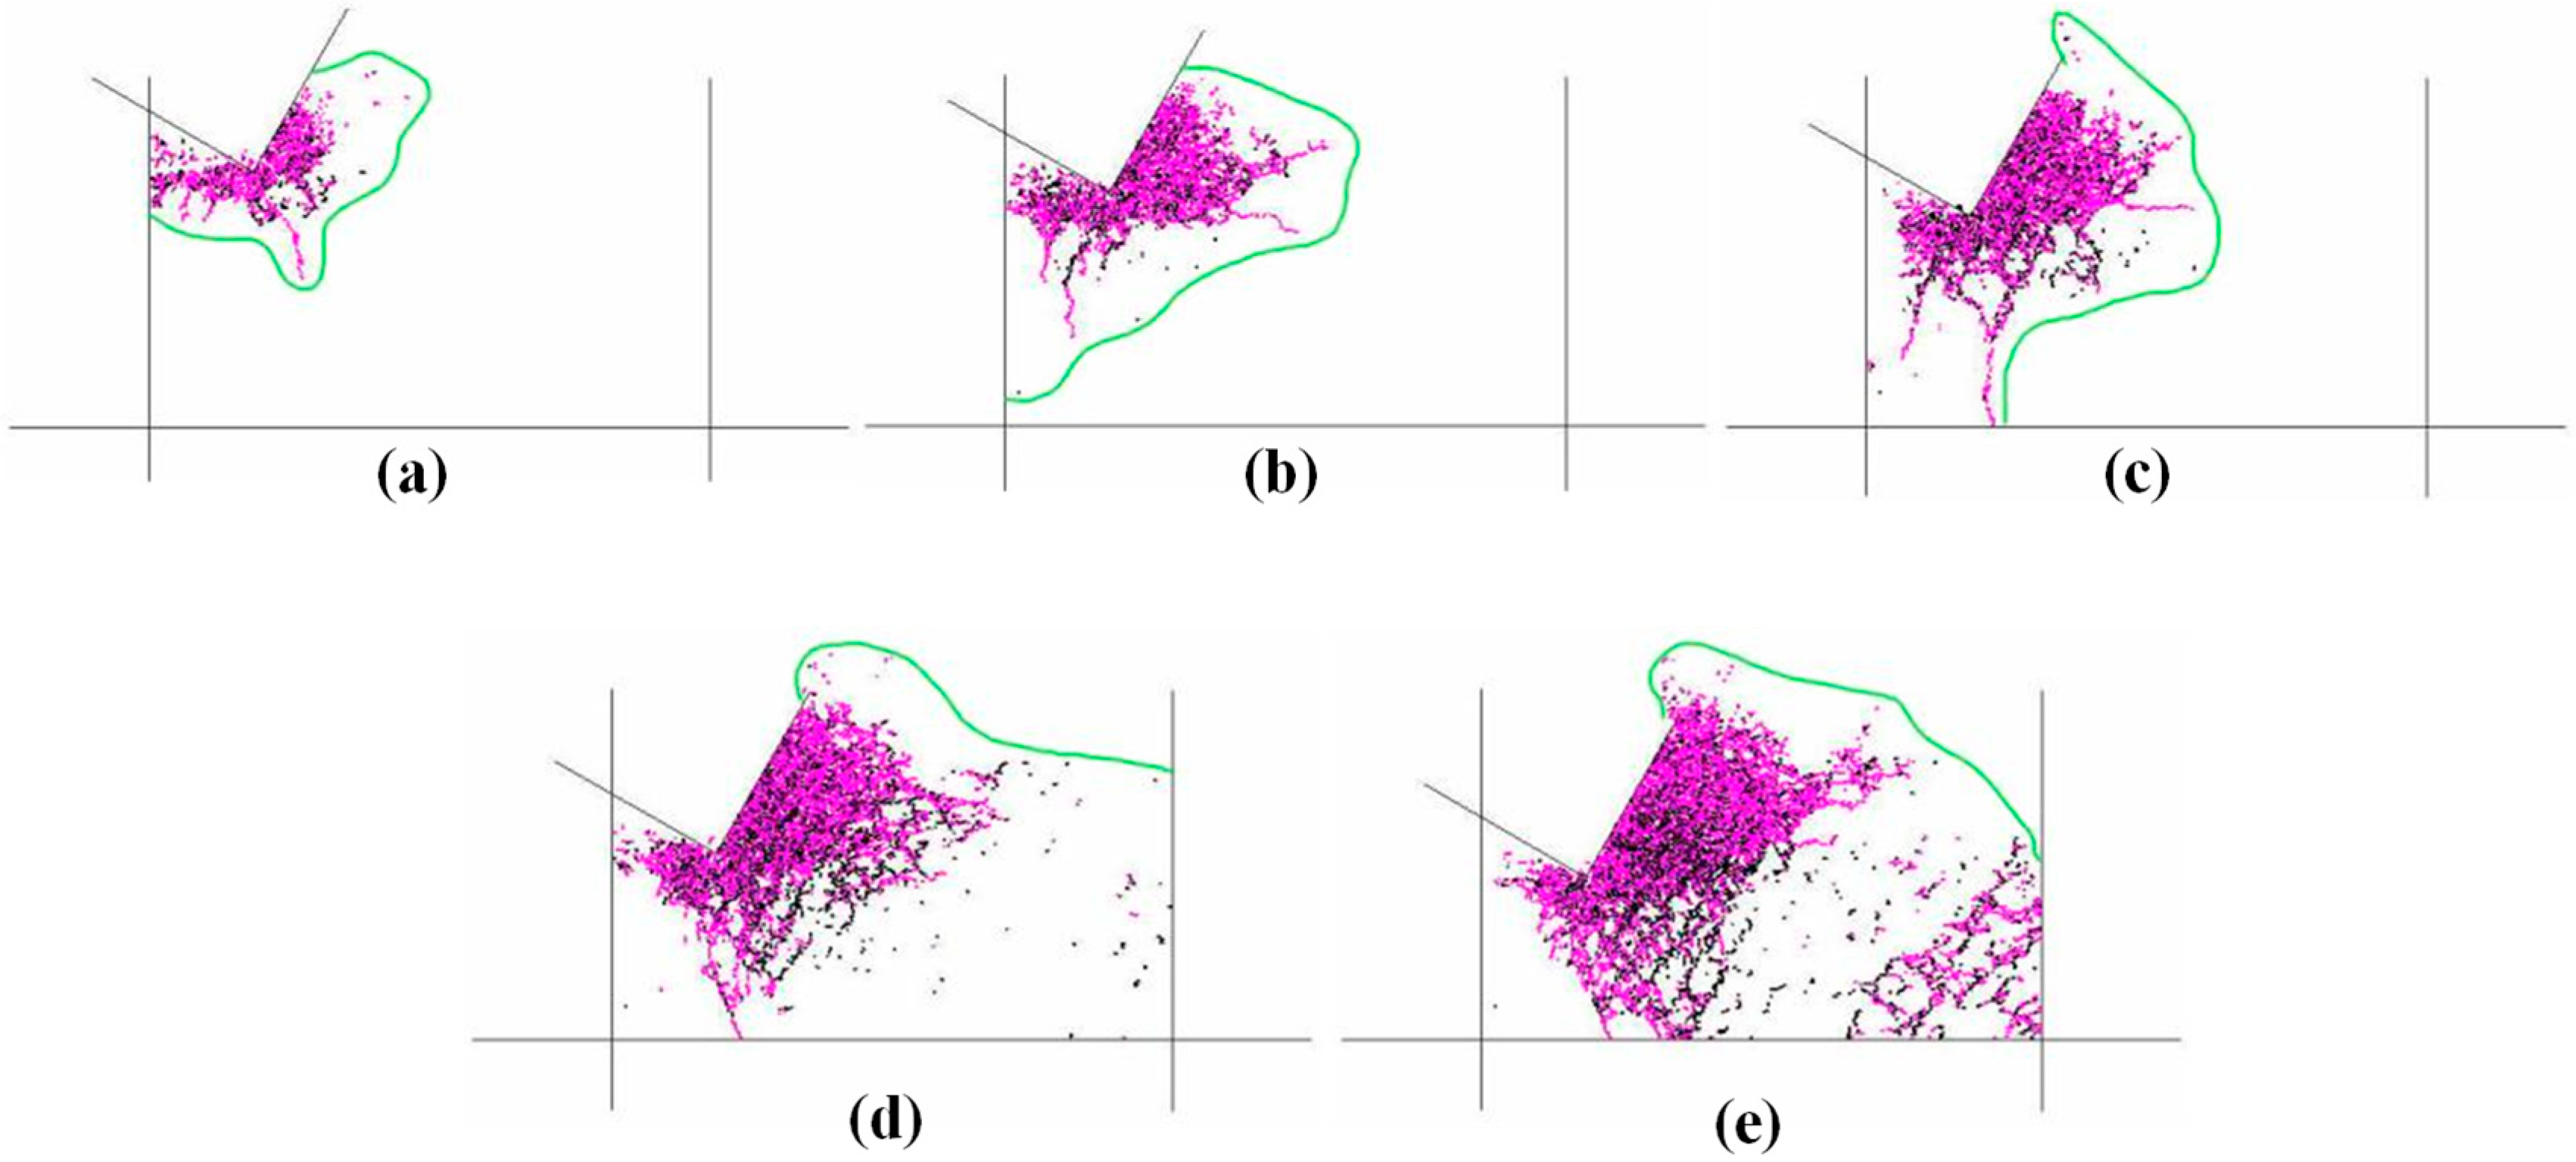
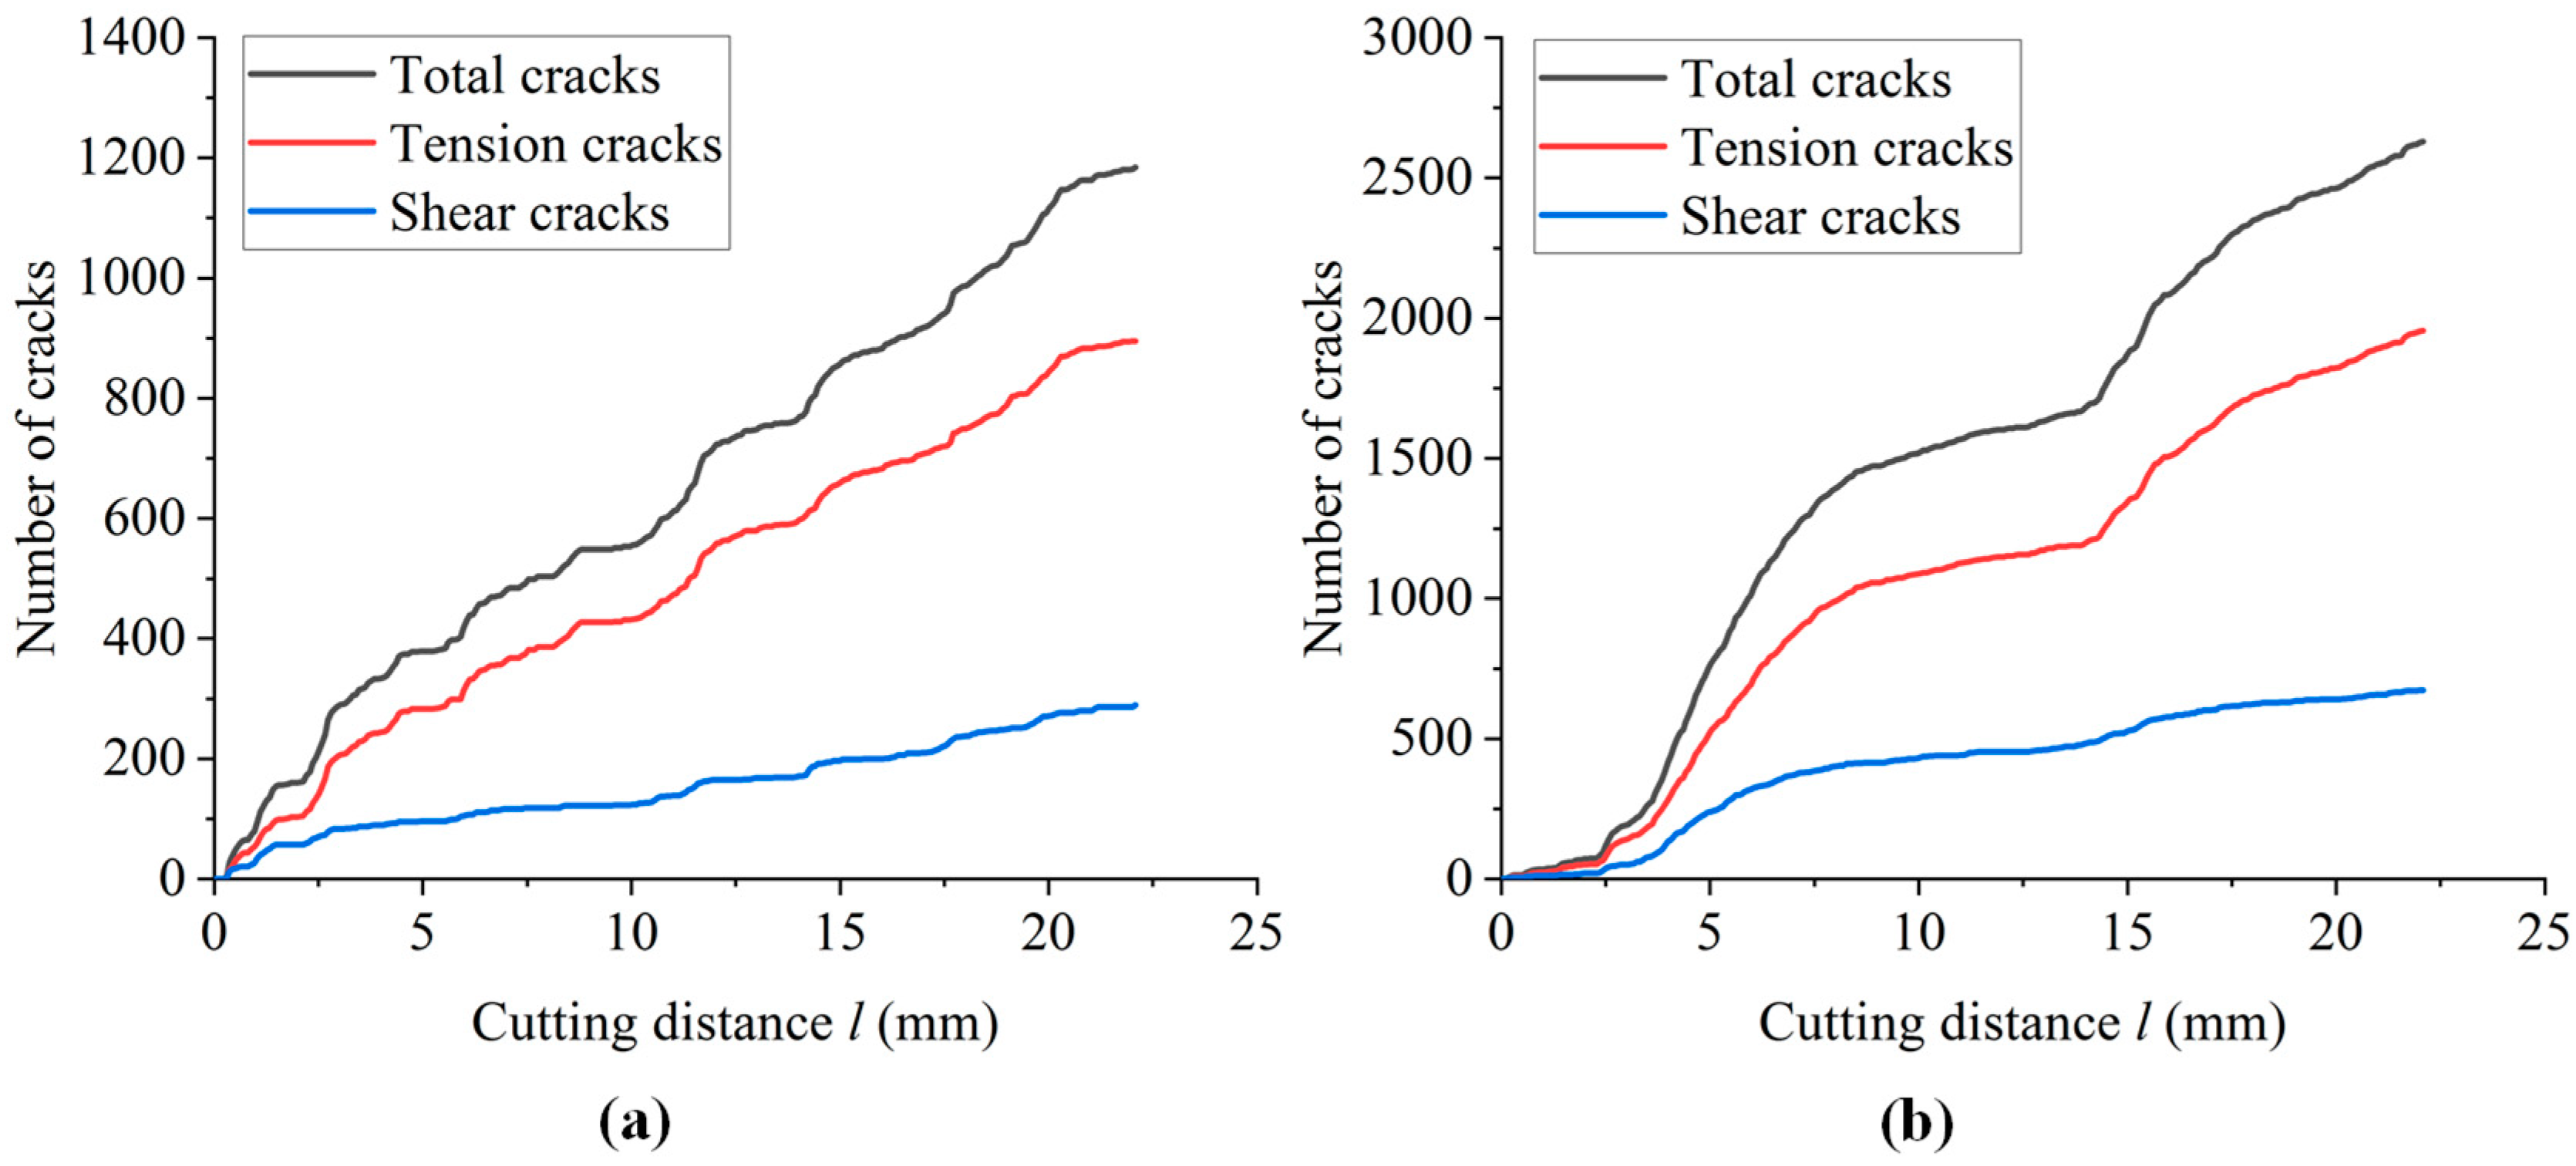
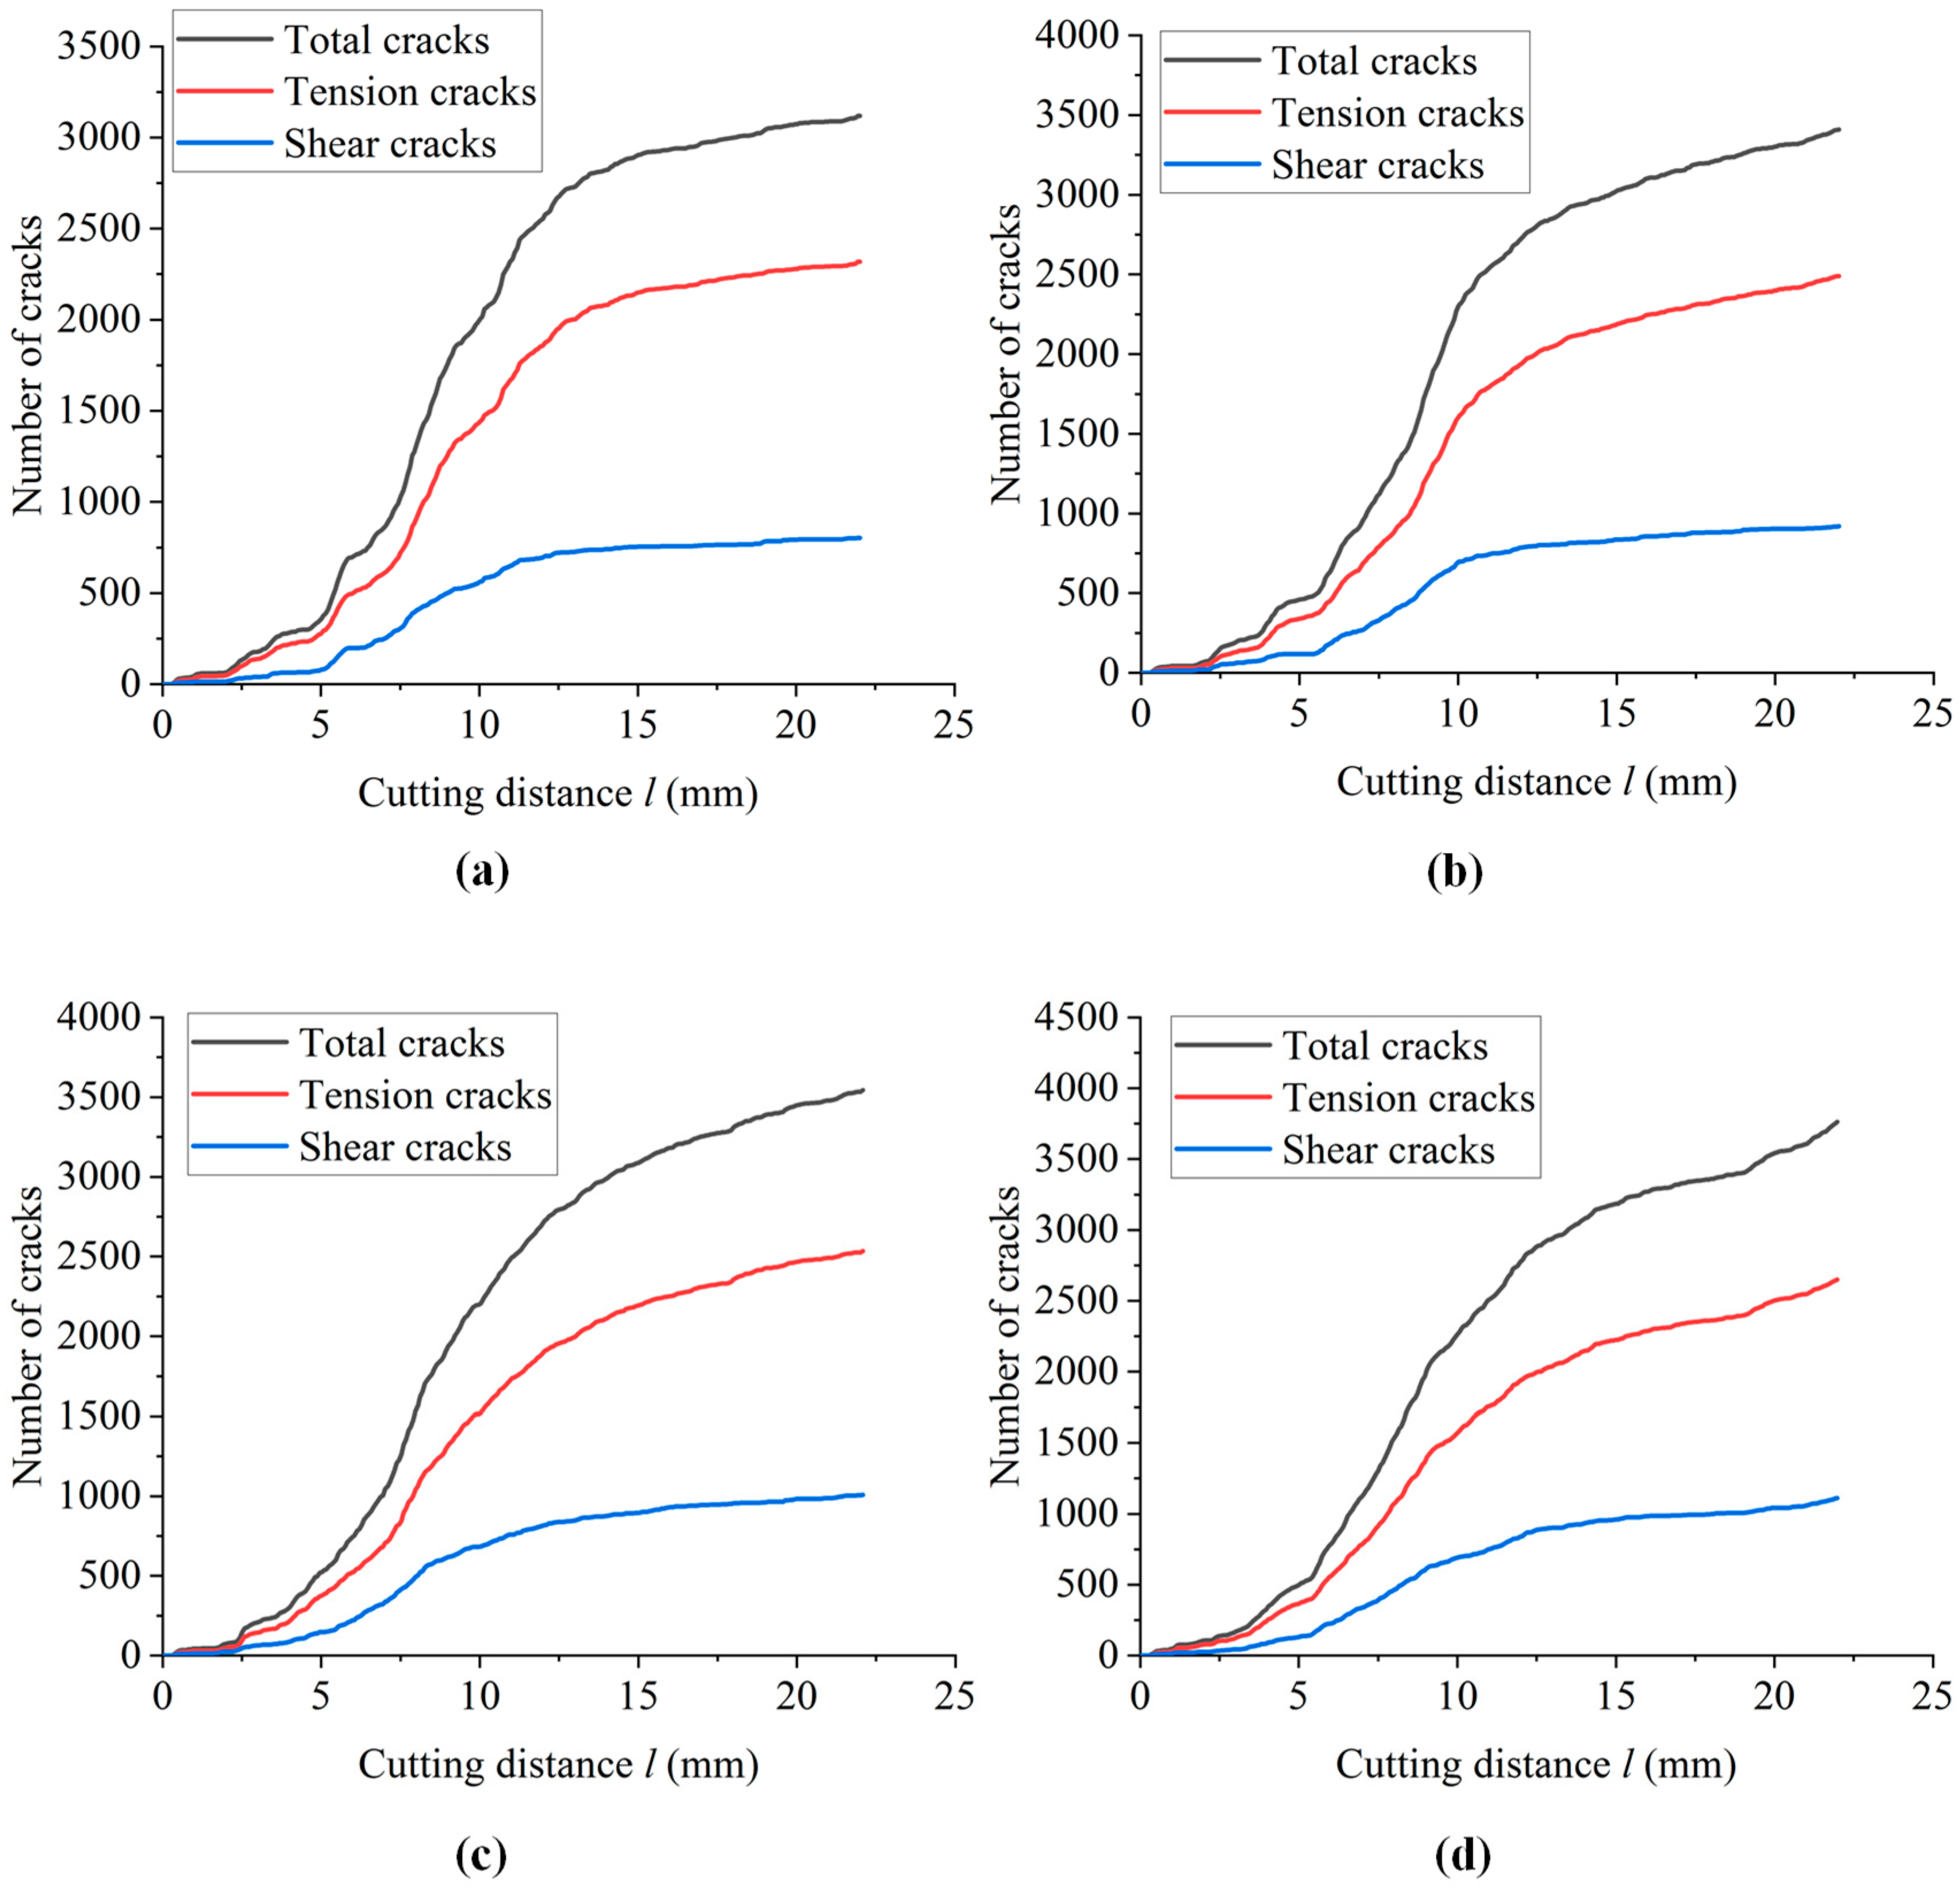
3.3. Effect of Cutting Depth
3.4. Effect of Cutting Rate
4. Discussion
5. Conclusions
- (1)
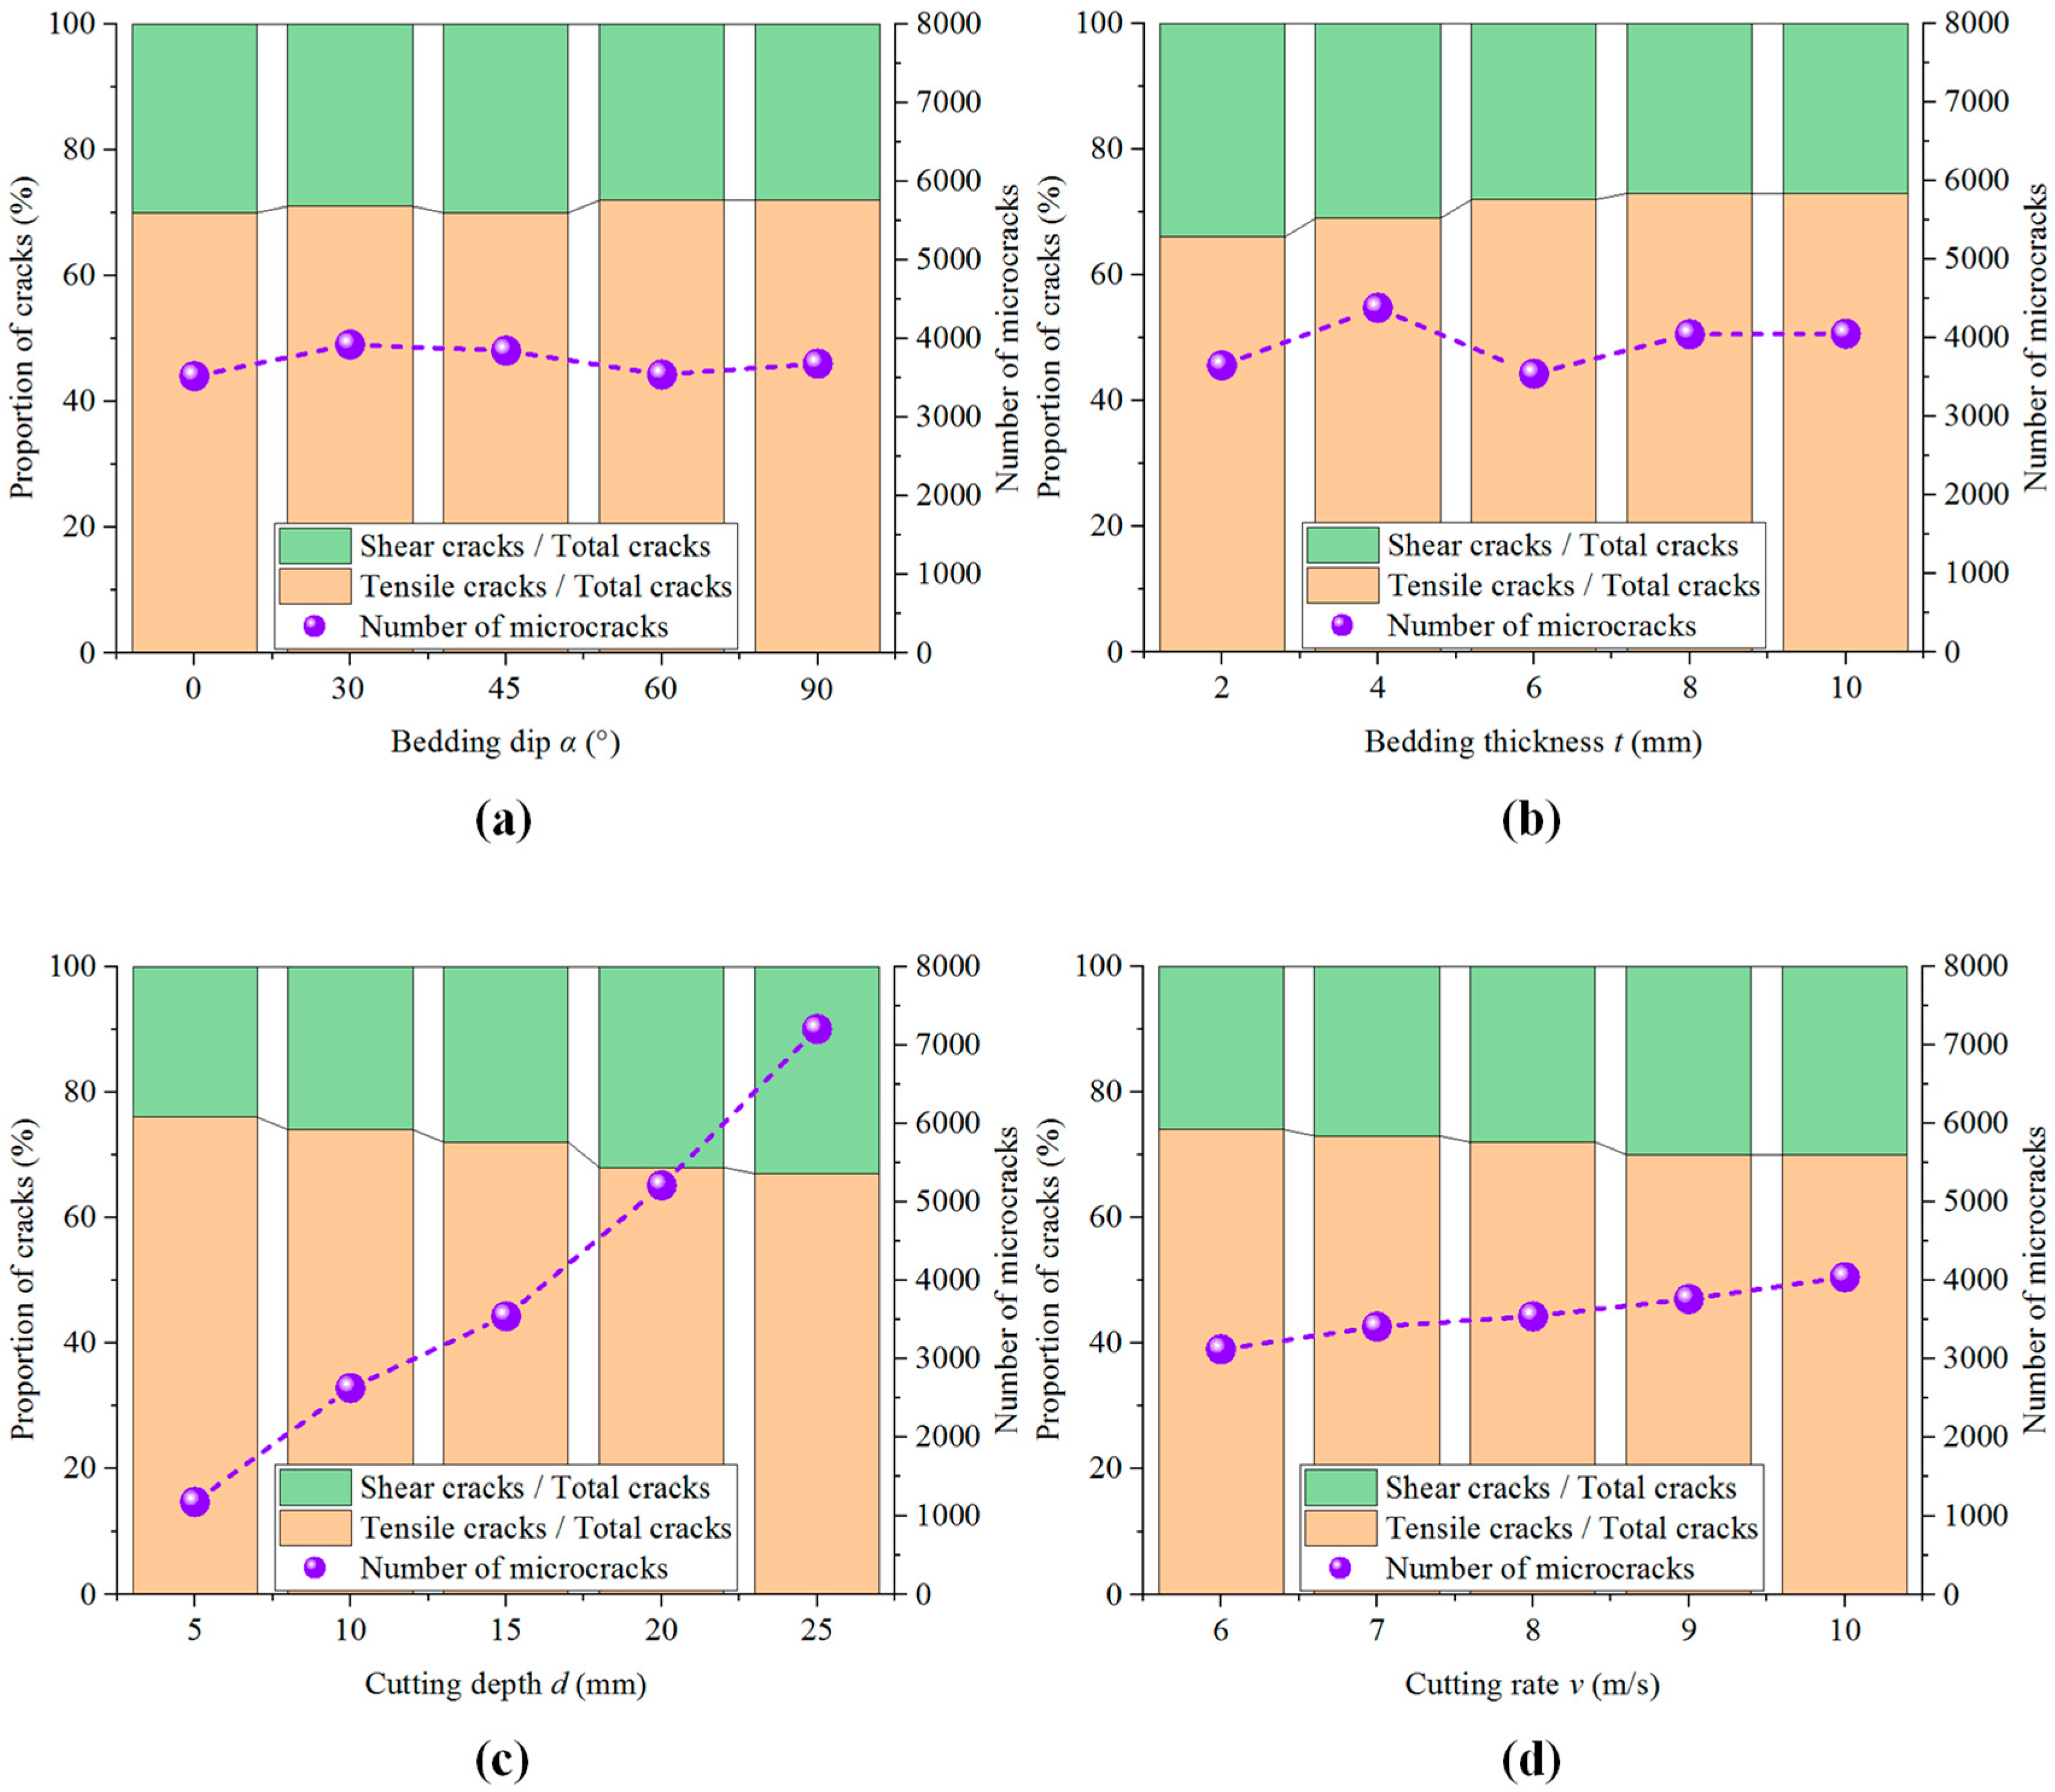
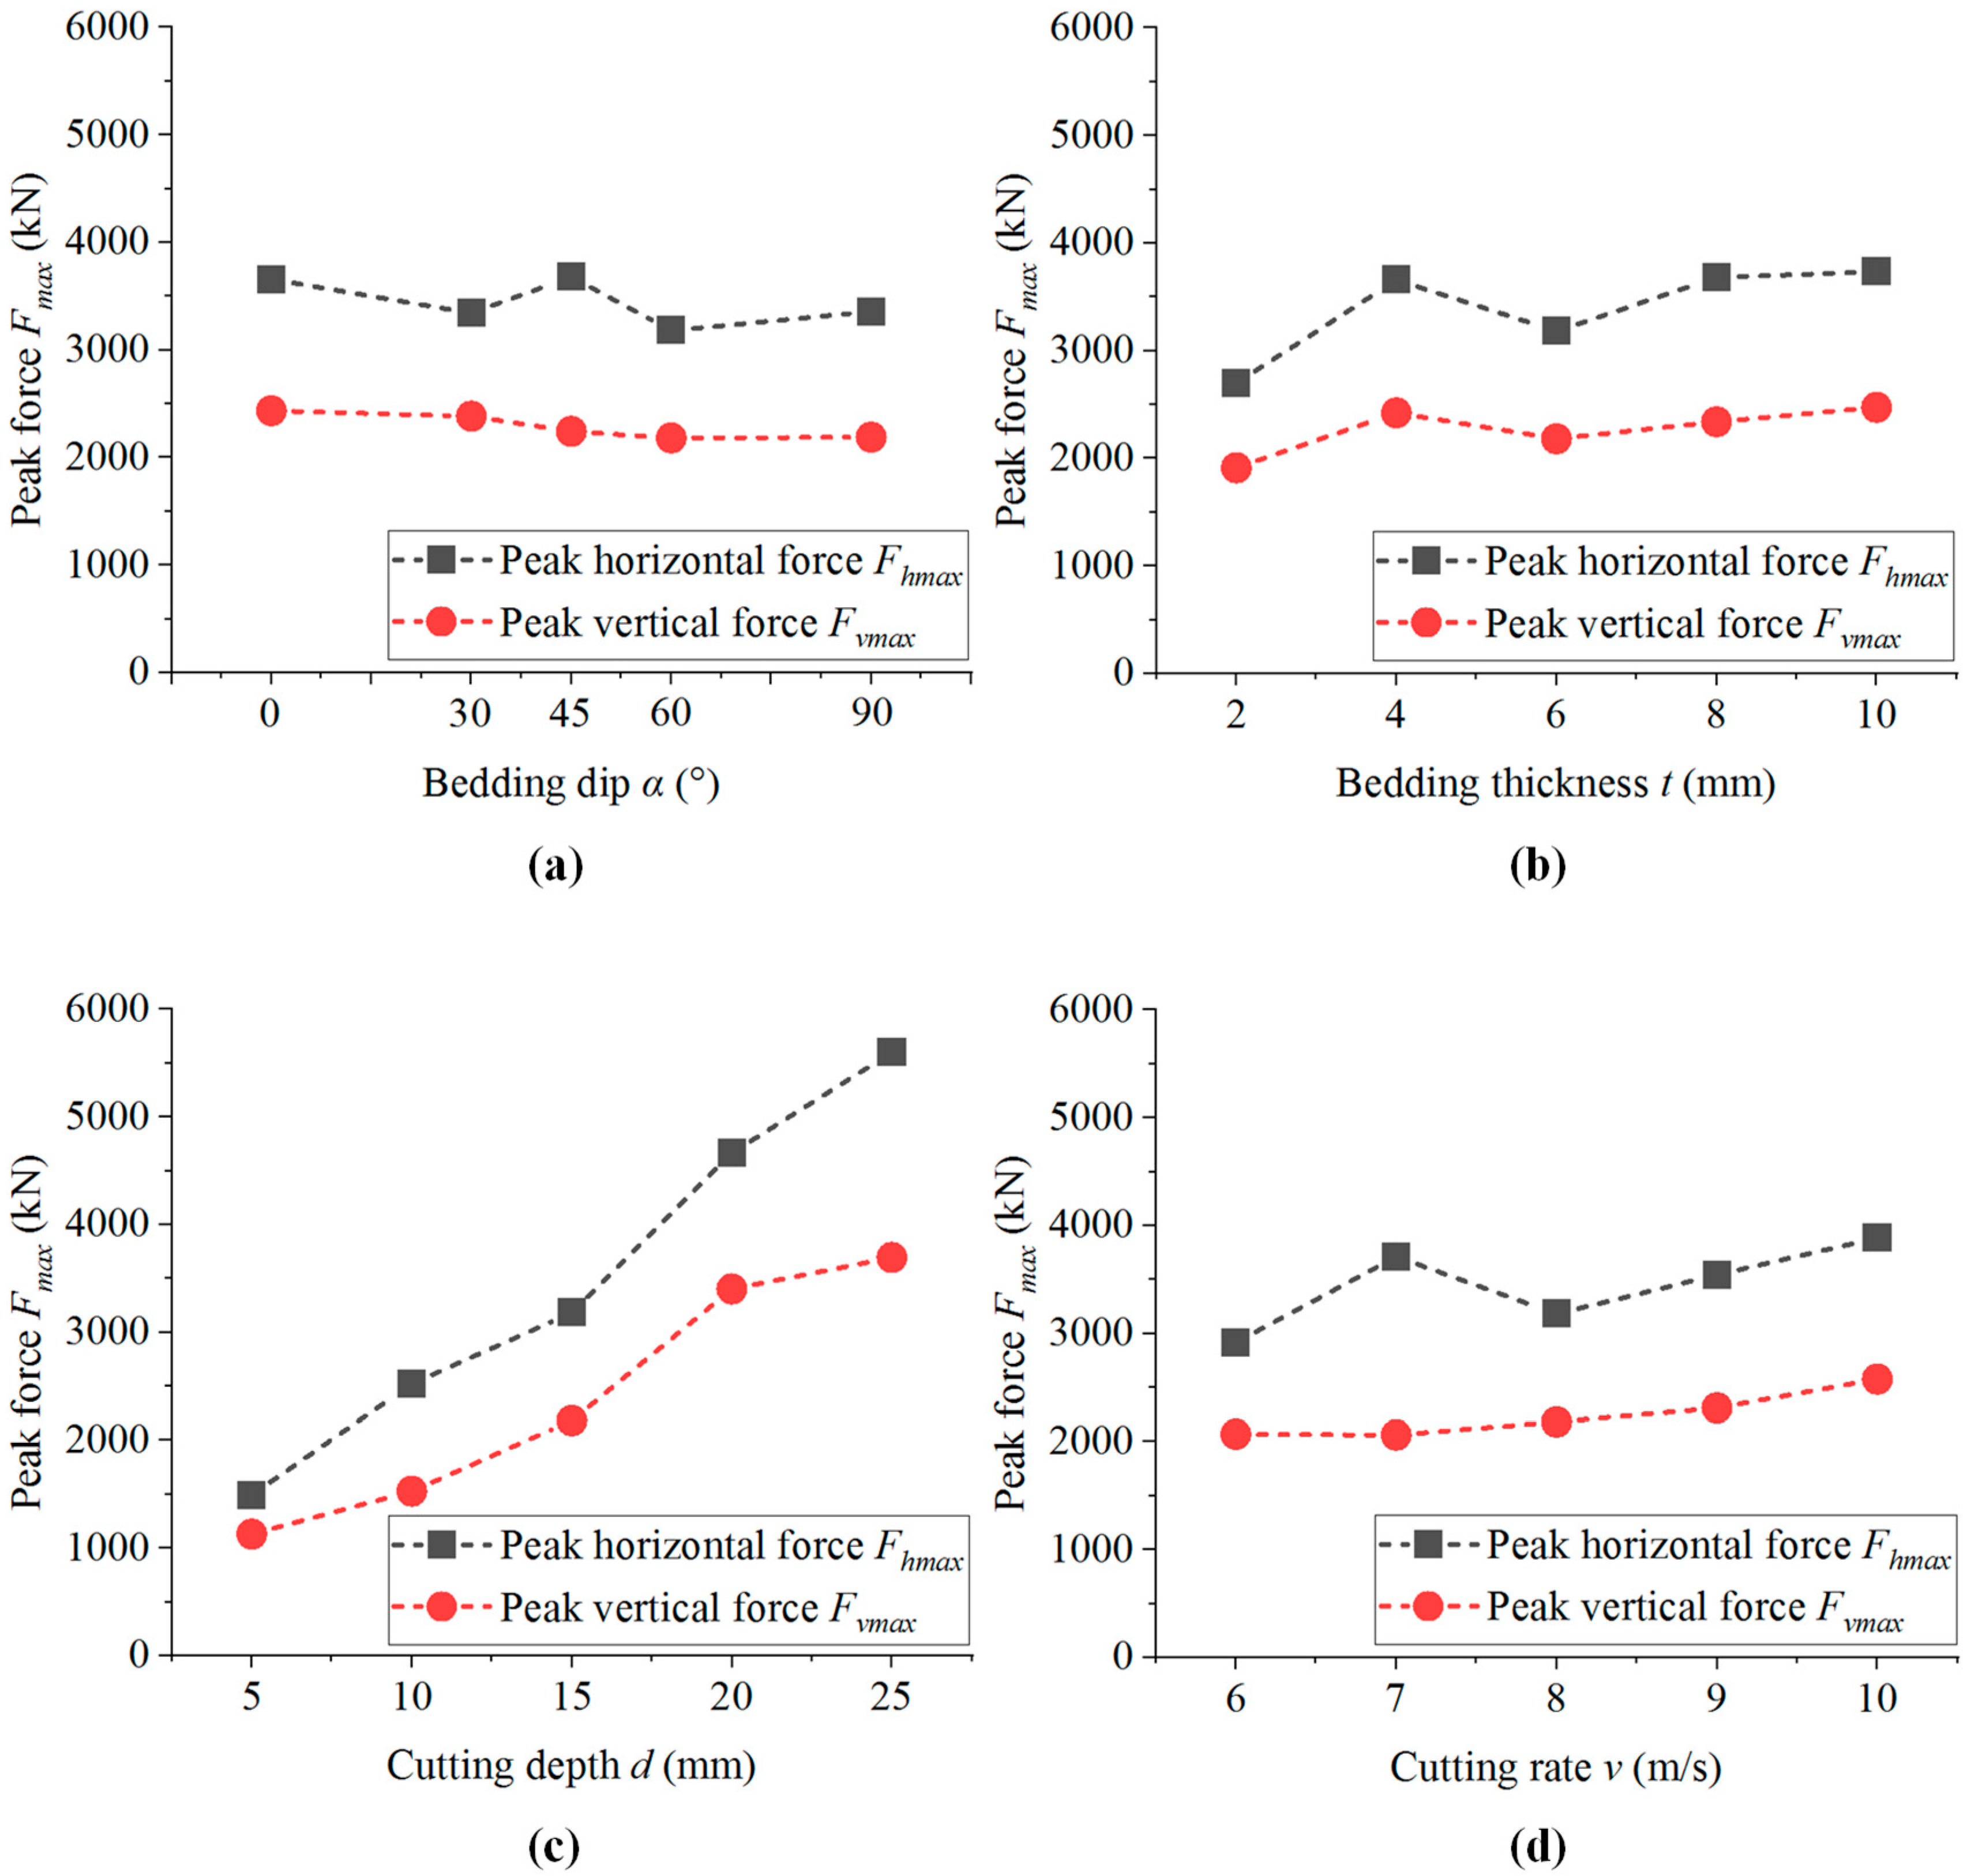
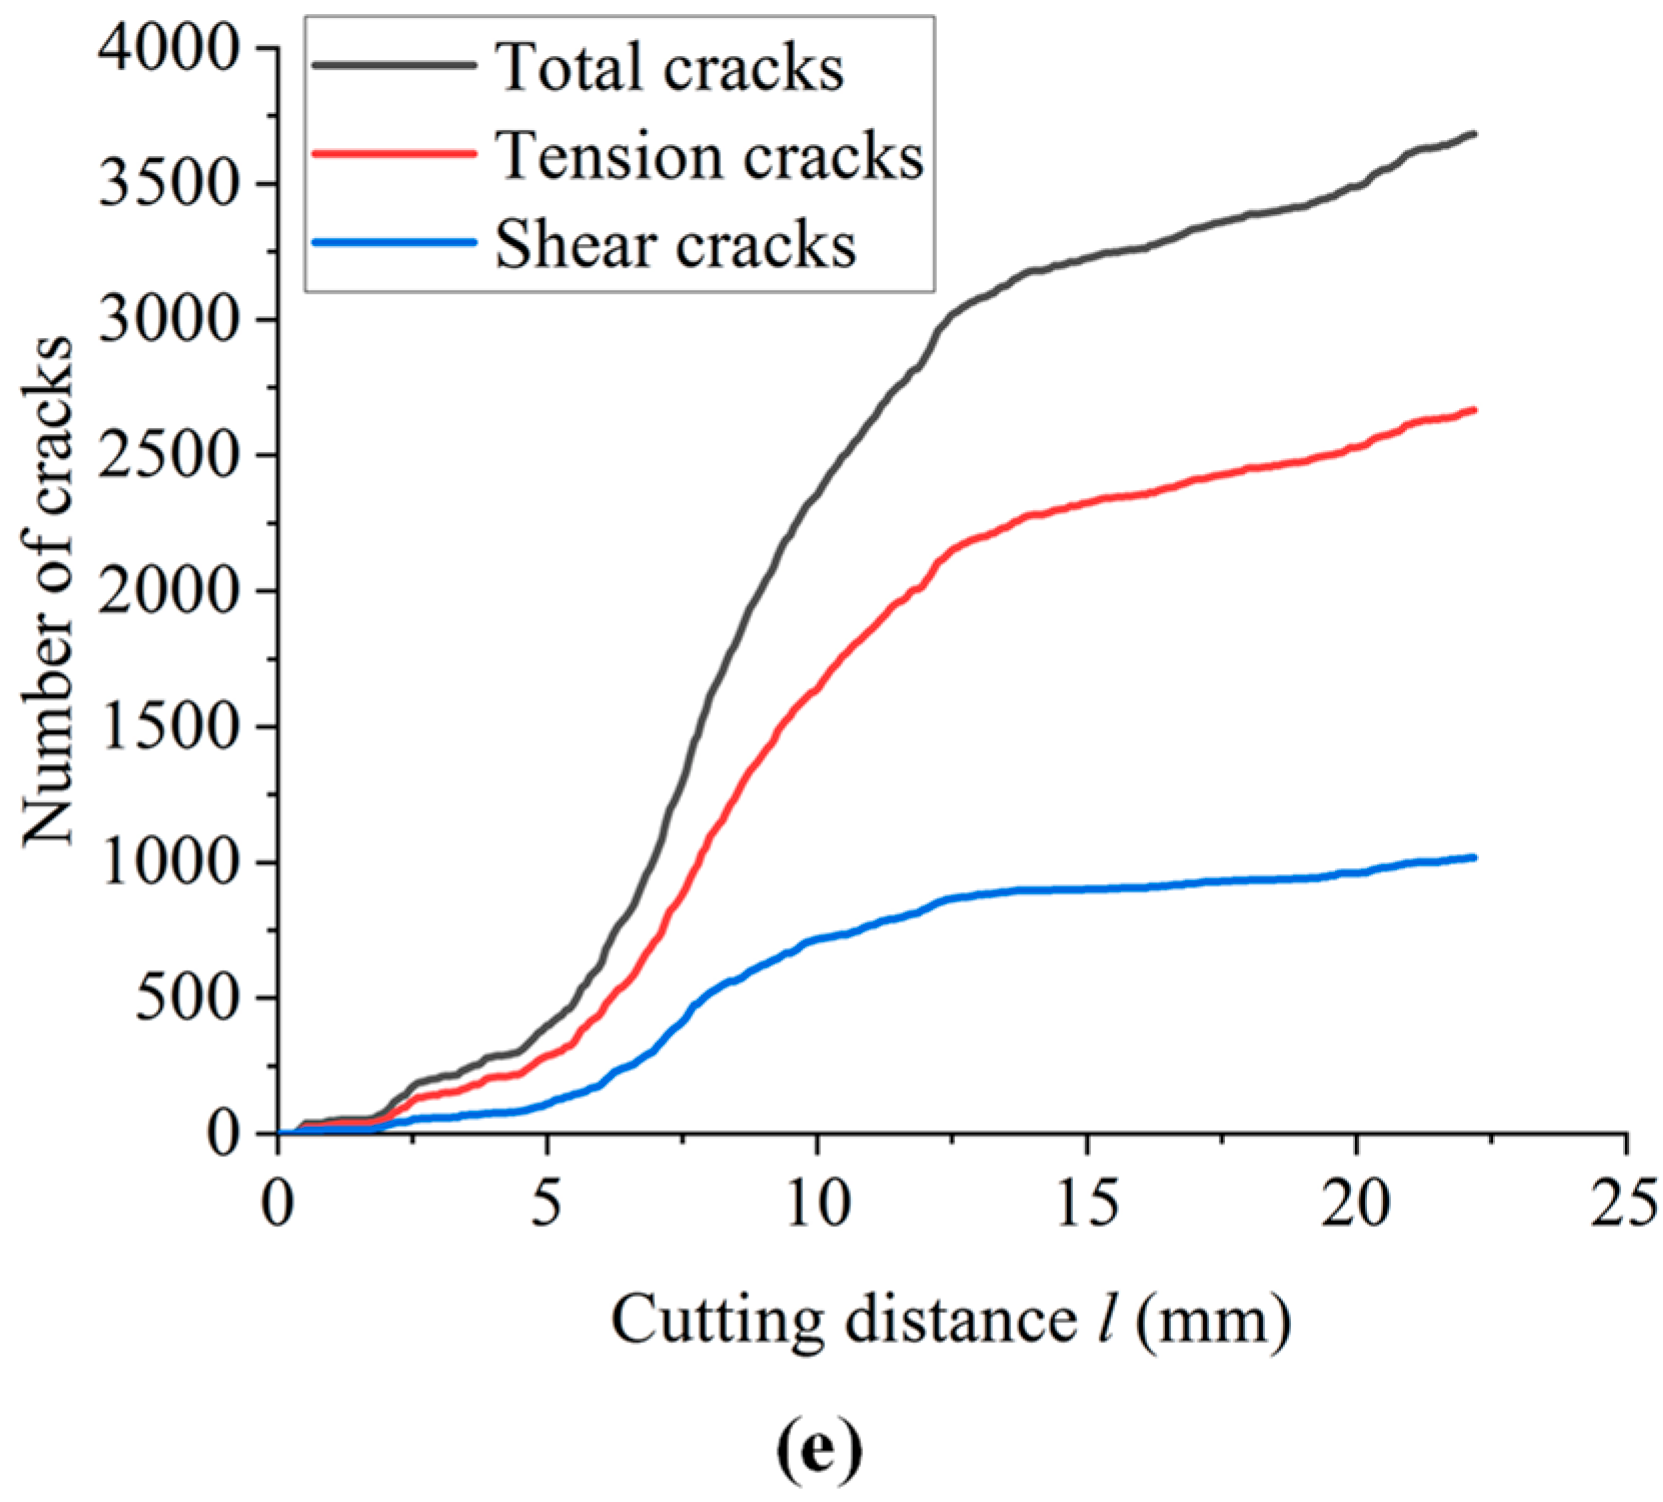
- With the increase in bedding dip, the number and area of microcracks first increase and then decrease, and the proportion of tensile cracks is relatively unchanged. There is no significant change in the morphology of the failure-affected zone, and the average particle size of the cutting fragments decreases first and then increases. The horizontal force and vertical force of the cutter are gradually reduced. Shale with smaller bedding angle is more likely to be damaged by cutting. In the actual steering drilling process, the optimal drilling efficiency can be obtained by adjusting the drilling direction.
- (2)
- With the increase in bedding thickness, microcracks continue to extend in a horizontal direction, the total number of cracks fluctuates, and the proportion of tensile cracks increases. The failure-affected zone is conically extended in the horizontal direction, and the average size of the cutting fragments gradually increases. The horizontal force and vertical force of the cutter gradually increase. Shale with smaller bedding thickness is more likely to be damaged by cutting. Therefore, the bit diameter and drilling parameters used in this simulation are applicable to a shale formation with smaller thickness.
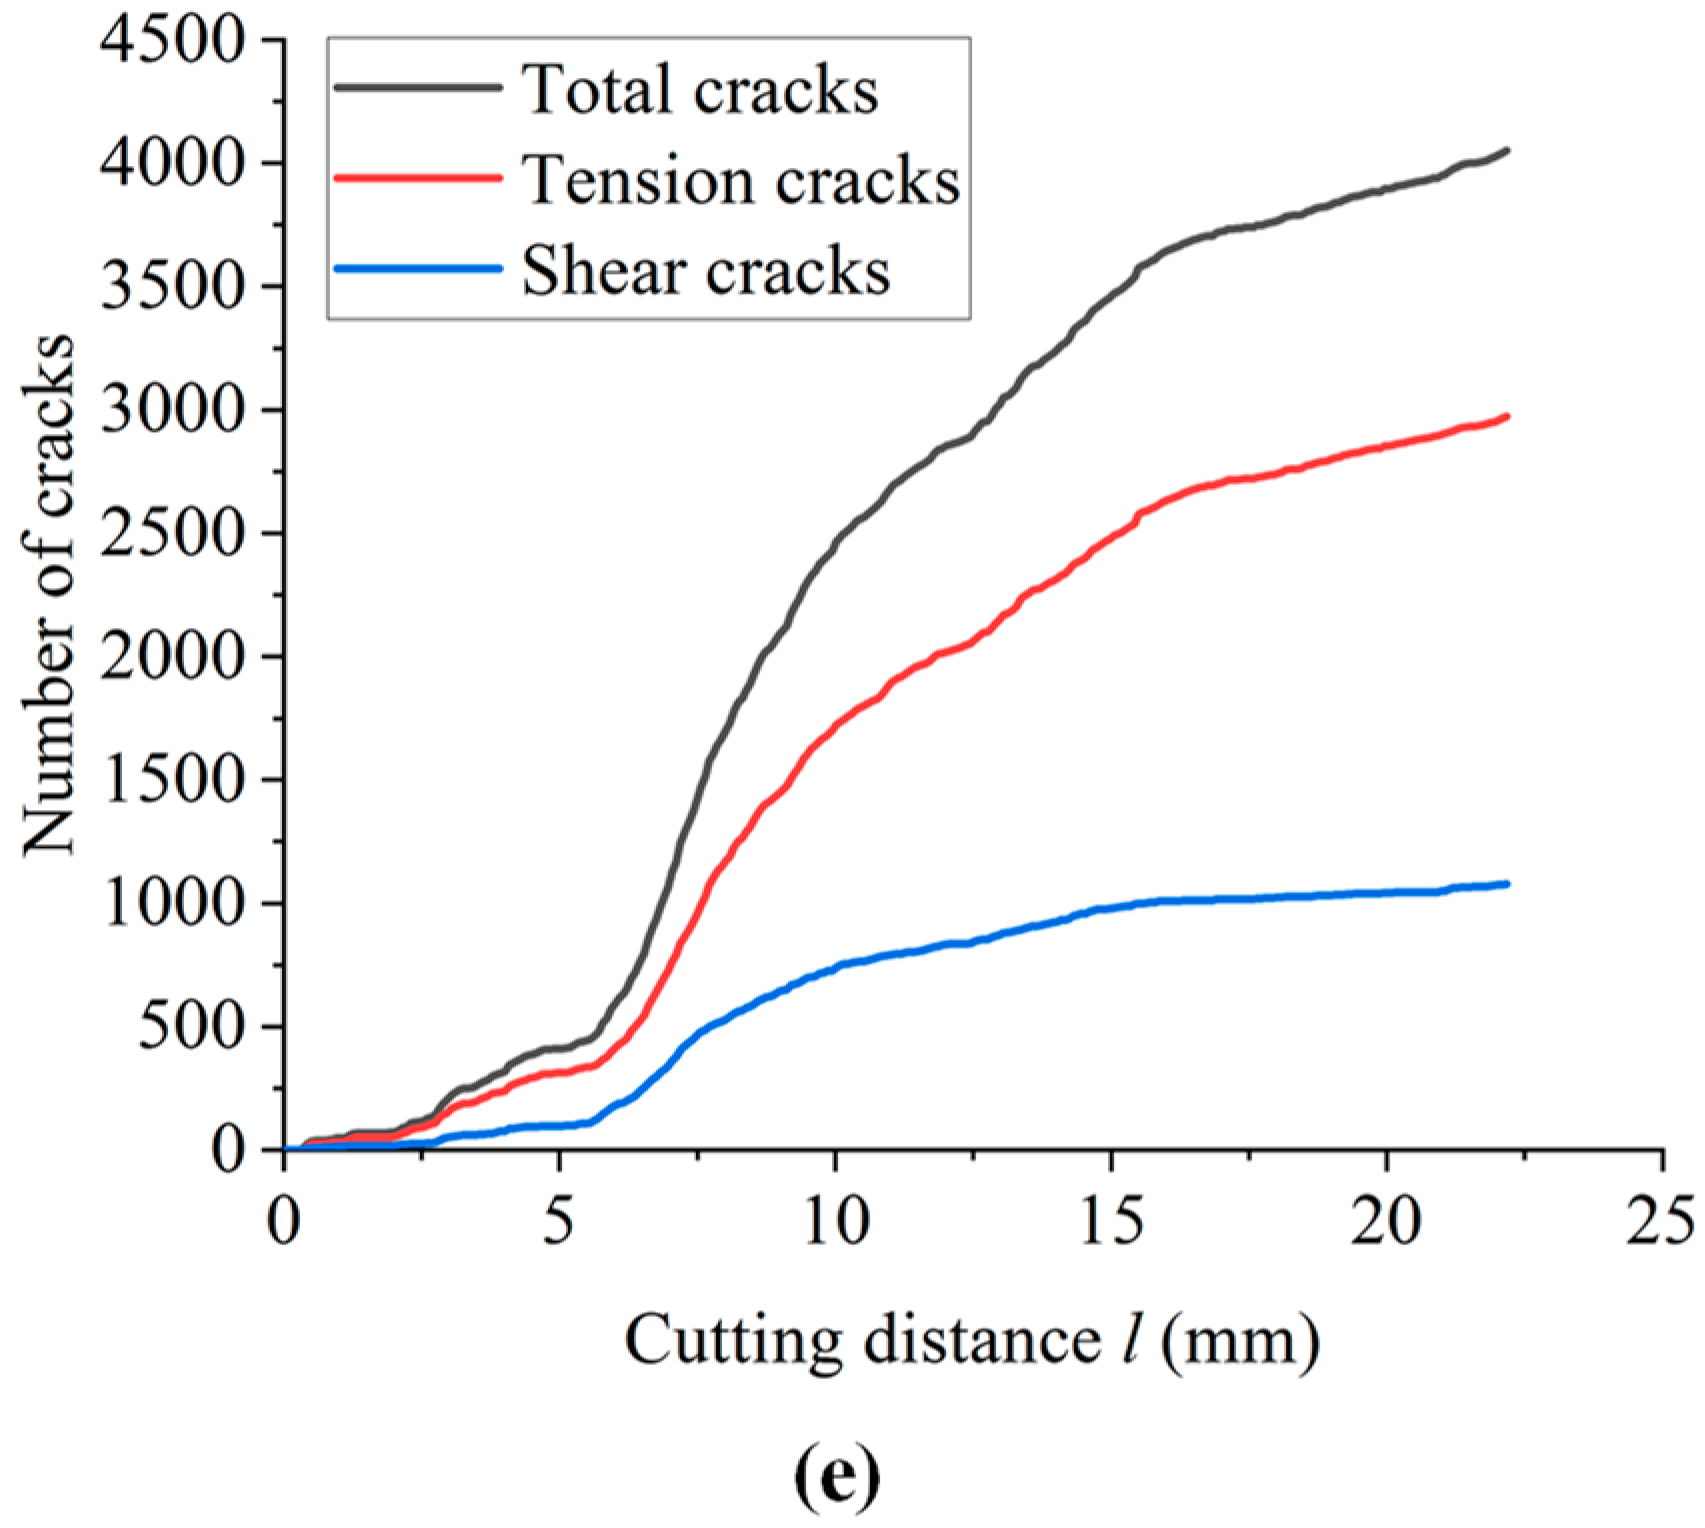
- (3)
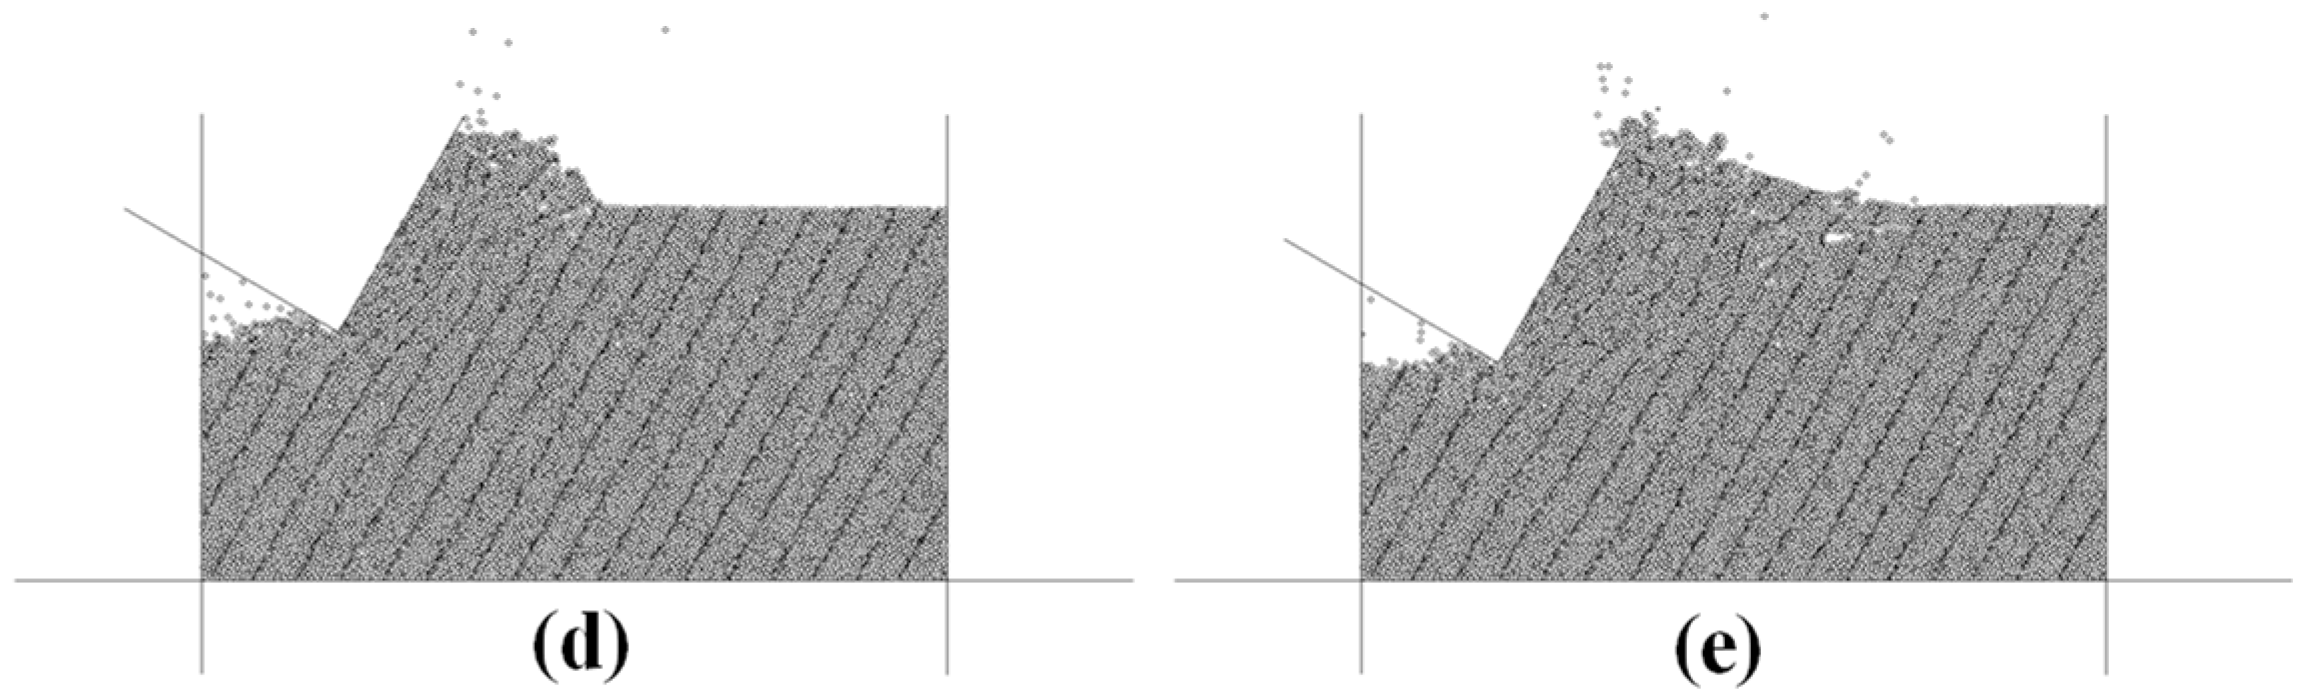
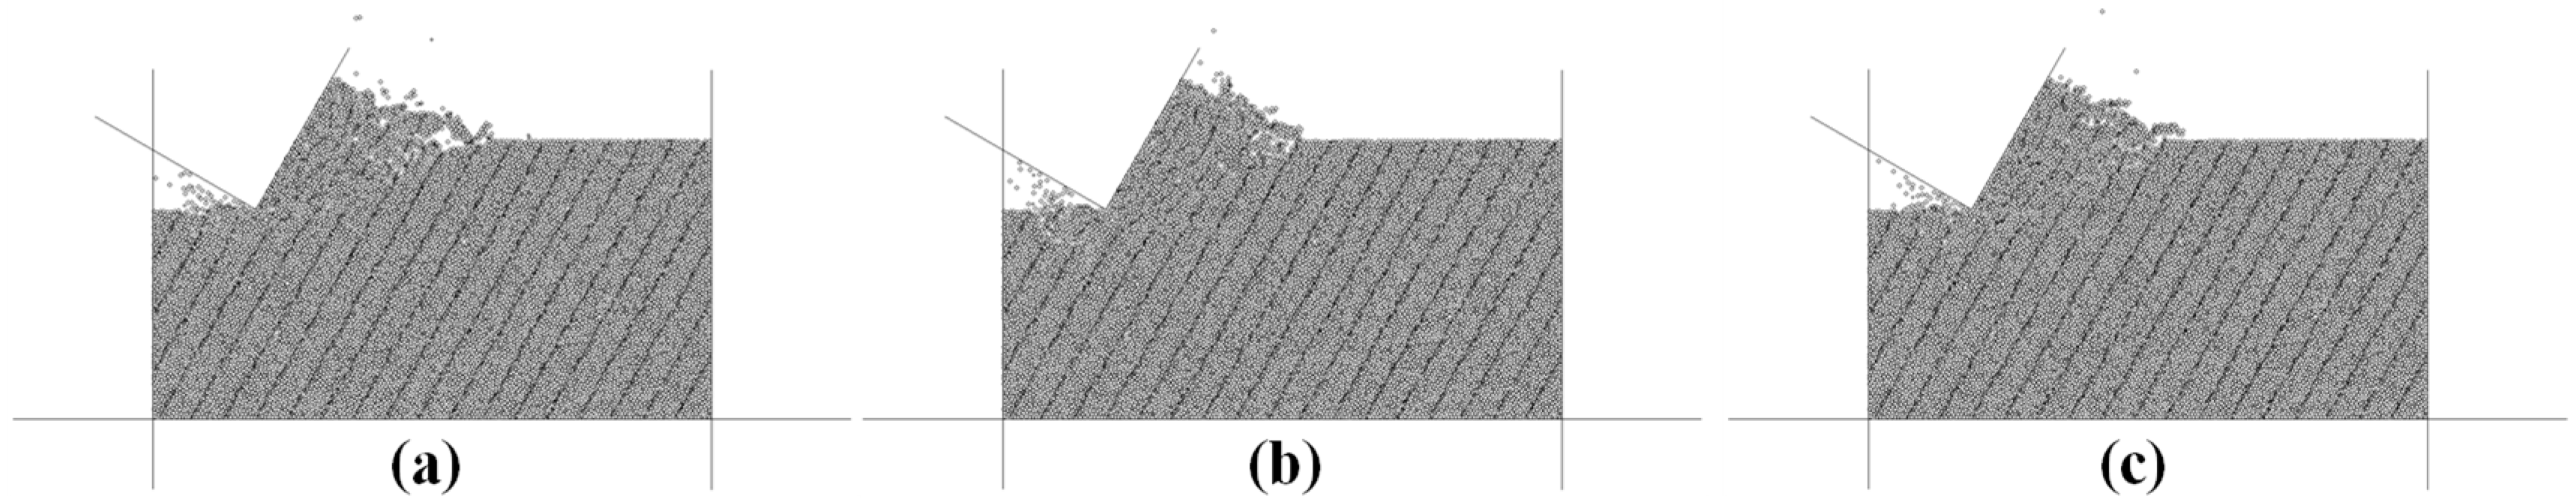
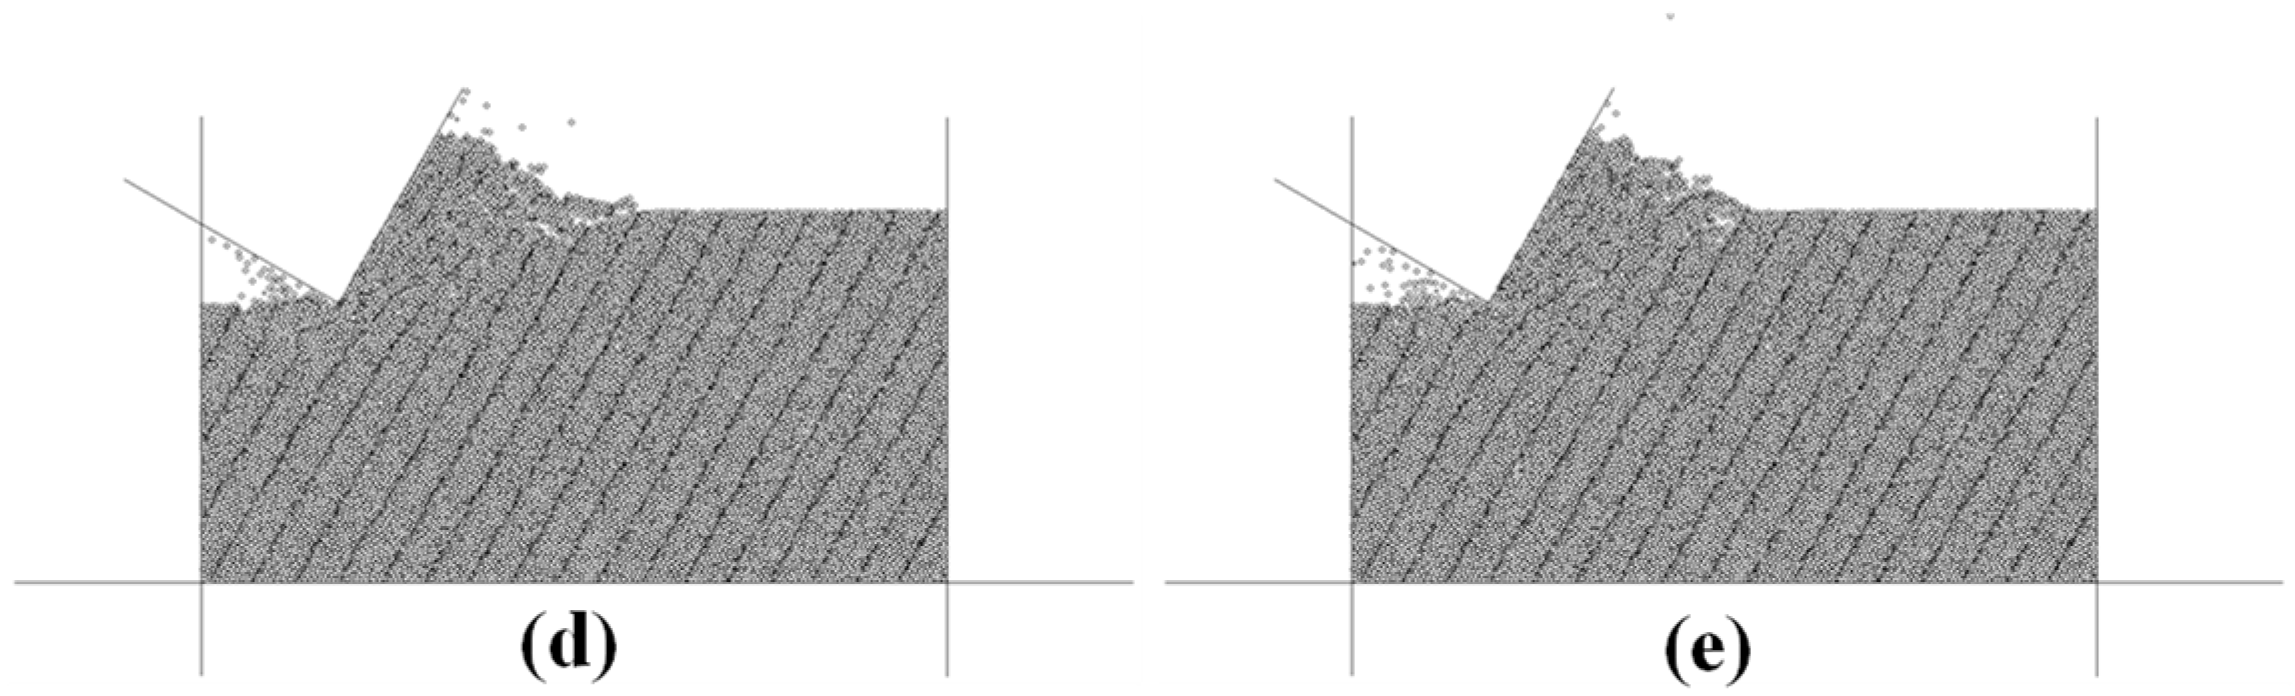
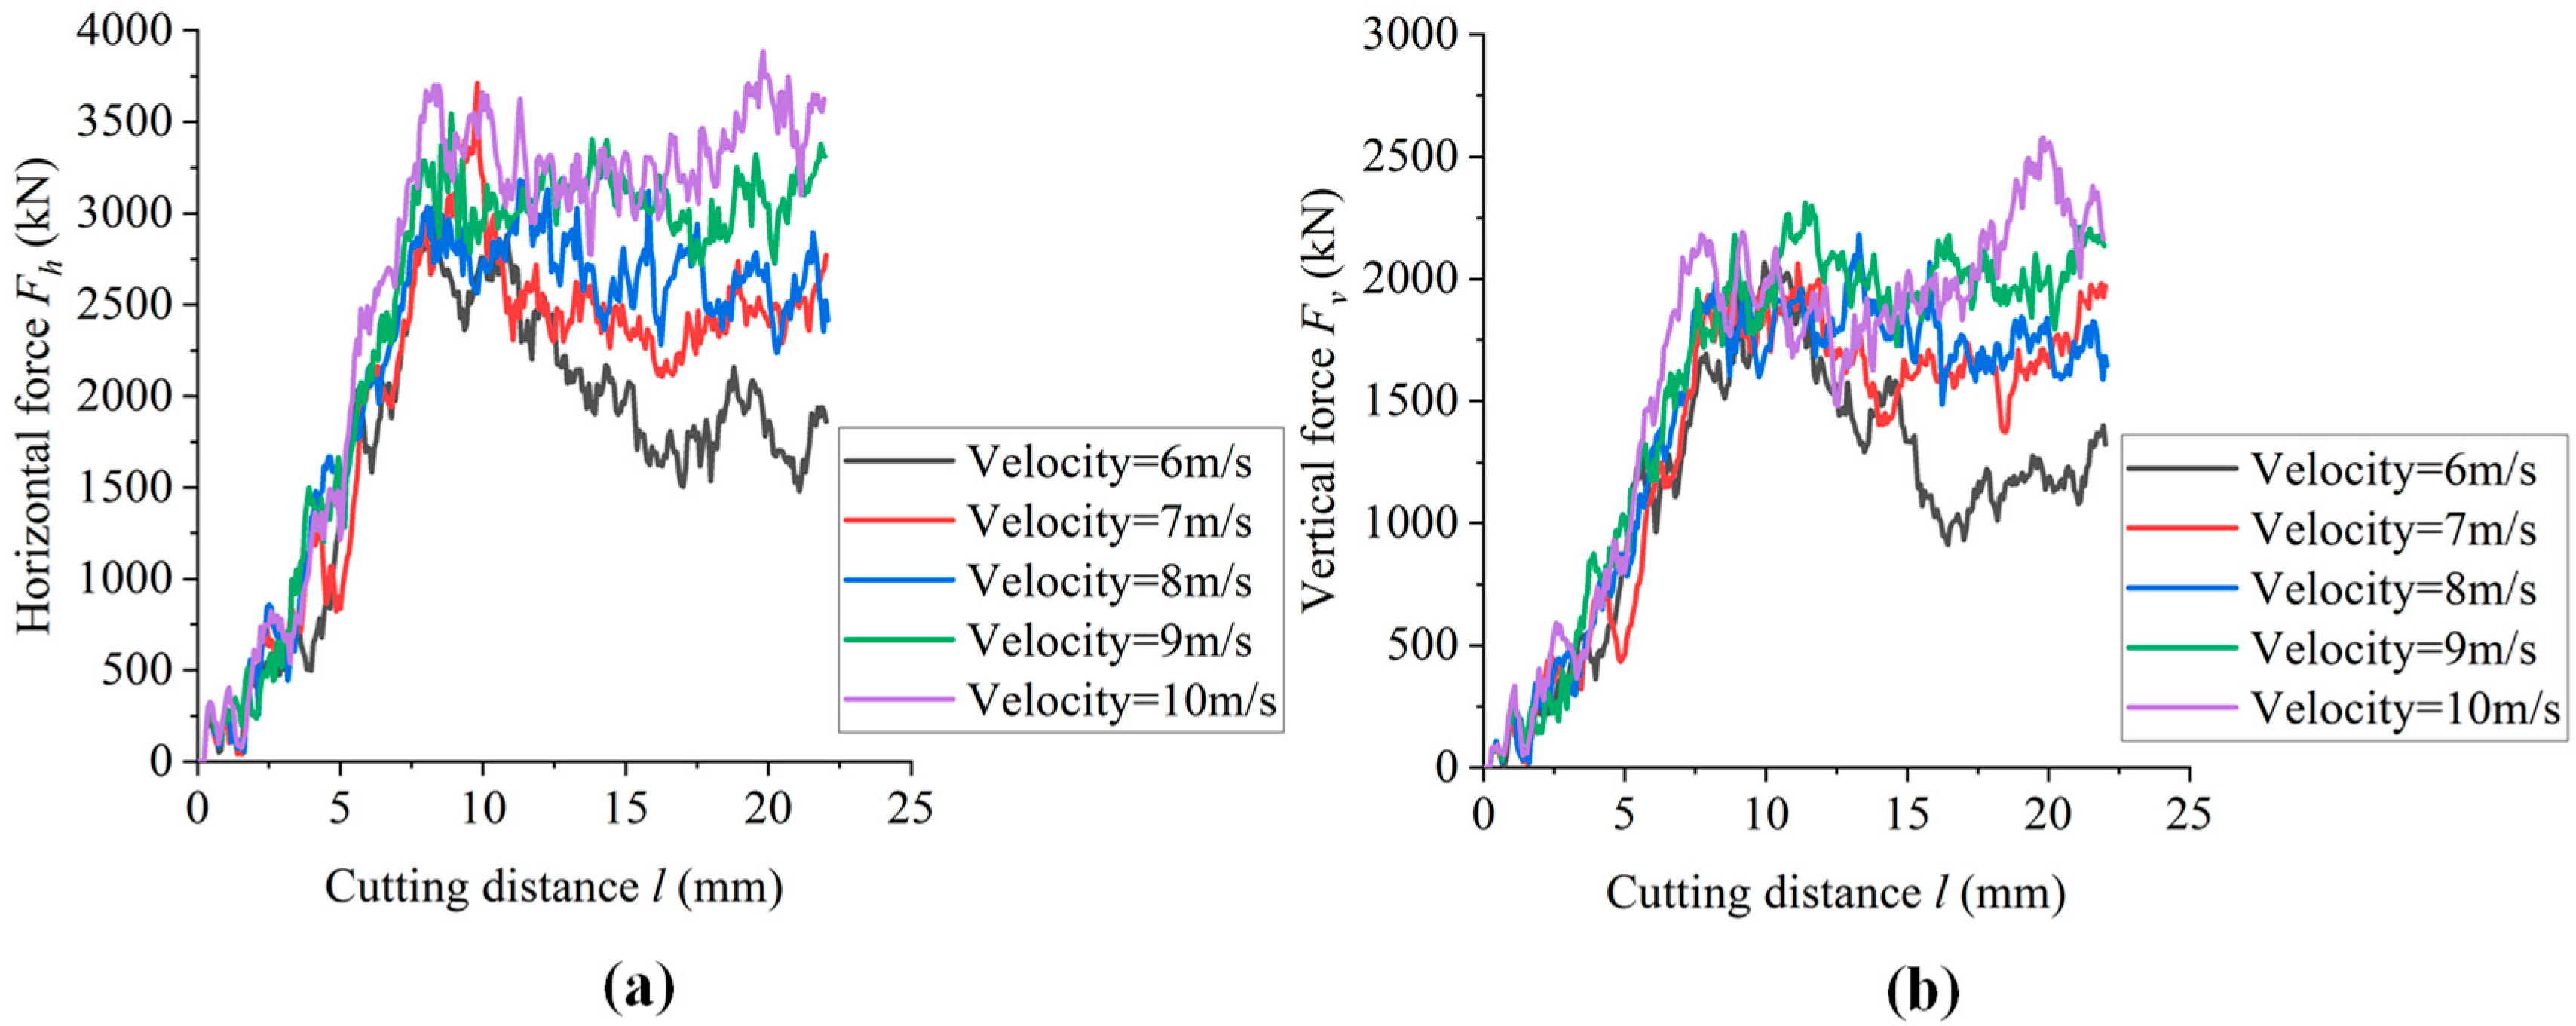
- With the increase in cutting depth and cutting rate, the number and area of microcracks increase, and the proportion of shear cracks increases. The area of the damage zone increases, and the size of the cutting fragments decreases. The horizontal force and vertical force of the cutter significantly increase. The greater the cutting depth and cutting rate, the higher the drilling efficiency. In the actual guided drilling, when the PDC drill teeth expose the bit matrix at a higher height and the PDC bit rotates at a higher speed, the drilling efficiency is higher.
Author Contributions
Funding
Institutional Review Board Statement
Informed Consent Statement
Data Availability Statement
Conflicts of Interest
References
- Cai, C.; Zhang, P.; Xu, D.; Yang, X.; Zhou, Y. Composite rock-breaking of high-pressure CO2 jet and polycrystalline-diamond-compact (PDC) cutter using a coupled SPH/FEM model. Int. J. Min. Sci. Technol. 2022, 32, 1115–1124. [Google Scholar] [CrossRef]
- Li, Y.; Chen, Z.; Ye, Y.; Yang, Y. Combined finite-discrete element method for modeling the interaction between single PDC cutter and brittle rock. J. Pet. Sci. Eng. 2021, 207, 109133. [Google Scholar] [CrossRef]
- Zhang, C.; Yang, Y.; Qi, Q.; Ren, H.; Wang, J. Research on numerical drilling technology of mesh-like cutting PDC bit. Energy Rep. 2021, 7, 2068–2080. [Google Scholar] [CrossRef]
- Davarpanah, A.; Mirshekari, B.; Jafari, B.T.; Hemmati, M. Integrated production logging tools approach for convenient experimental individual layer permeability measurements in a multi-layered fractured reservoir. J. Pet. Explor. Prod. Technol. 2018, 8, 743–751. [Google Scholar] [CrossRef] [Green Version]
- Davarpanah, A.; Shirmohammadi, R.; Mirshekari, B.; Aslani, A. Analysis of hydraulic fracturing techniques: Hybrid fuzzy approaches. Arab. J. Geosci. 2019, 12, 402. [Google Scholar] [CrossRef]
- Amri, M.; Pelfrene, G.; Gerbaud, L.; Sellami, H.; Tijani, M. Experimental investigations of rate effects on drilling forces under bottomhole pressure. J. Pet. Sci. Eng. 2016, 147, 585–592. [Google Scholar] [CrossRef]
- Davarpanah, A.; Nassabeh, S.M.M.; Mirshekari, B. Optimization of drilling parameters by analysis of formation strength properties with utilization of mechanical specific energy. Open J. Geol. 2017, 7, 1590–1602. [Google Scholar] [CrossRef] [Green Version]
- Guo, S.; Qi, S. Numerical study on progressive failure of hard rock samples with an unfilled undulate joint. Eng. Geol. 2015, 193, 173–182. [Google Scholar] [CrossRef]
- Guo, S.; Qi, S.; Zhan, Z.; Zheng, B. Plastic-strain-dependent strength model to simulate the cracking process of brittle rocks with an existing non-persistent joint. Eng. Geol. 2017, 231, 114–125. [Google Scholar] [CrossRef]
- Huang, X.; Qi, S.; Liu, Y.; Zhan, Z. Stress wave propagation through viscous-elastic jointed rock masses using propagator matrix method (PMM). Geophys. J. Int. 2014, 200, 452–470. [Google Scholar] [CrossRef]
- Huang, X.; Qi, S.; Xia, K.; Shi, X. Particle crushing of a filled fracture during compression and its effect on stress wave propagation. J. Geophys. Res. Solid Earth 2018, 123, 5559–5587. [Google Scholar] [CrossRef]
- Zheng, B.; Qi, S. A new index to describe joint roughness coefficient (JRC) under cyclic shear. Eng. Geol. 2016, 212, 72–85. [Google Scholar] [CrossRef]
- Zheng, B.; Qi, S.; Luo, G.; Liu, F.; Huang, X.; Guo, S. Characterization of discontinuity surface morphology based on 3D fractal dimension by integrating laser scanning with ArcGIS. Bull. Eng. Geol. Environ. 2021, 80, 2261–2281. [Google Scholar] [CrossRef]
- Qi, S.; Zheng, B.; Wu, F.; Huang, X.; Guo, S.; Zhan, Z.; Zou, Y.; Barla, G. A new dynamic direct shear testing device on rock joints. Rock Mech. Rock Eng. 2020, 53, 4787–4798. [Google Scholar] [CrossRef]
- Qi, S.; Macciotta, R.; Shou, K.; Saroglou, C. Preface to the Special Issue on “Advances in Rock Mass Engineering Geomechanics”. Eng. Geol. 2020, 272, 105642. [Google Scholar] [CrossRef]
- Lu, J.; Weerasooriya, U.P.; Pope, G.A. Investigation of gravity-stable surfactant floods. Fuel 2014, 124, 76–84. [Google Scholar] [CrossRef]
- Liu, Y.; Li, J.; Wang, Z.; Wang, S.; Dong, Y. The role of surface and subsurface integration in the development of a high-pressure and low-production gas field. Environ. Earth Sci. 2015, 73, 5891–5904. [Google Scholar] [CrossRef]
- Zhong, H.; Yang, T.; Yin, H.; Lu, J.; Zhang, K.; Fu, C. Role of alkali type in chemical loss and ASP-flooding enhanced oil recovery in sandstone formations. SPE Reserv. Eval. Eng. 2020, 23, 431–445. [Google Scholar] [CrossRef]
- Liu, W.; Qian, X.; Li, T.; Zhou, Y.; Zhu, X. Investigation of the tool-rock interaction using Drucker-Prager failure criterion. J. Pet. Sci. Eng. 2019, 173, 269–278. [Google Scholar] [CrossRef]
- Warren, T.M.; Sinor, L.A. PDC bits: What’s needed to meet tomorrow’s challenge. In Proceedings of the University of Tulsa Centennial Petroleum Engineering Symposium, Tulsa, OK, USA, 29–31 August 1994; OnePetro: Richardson, TX, USA, 1994. [Google Scholar] [CrossRef]
- Cheng, Z.; Li, G.; Huang, Z.; Sheng, M.; Wu, X.; Yang, J. Analytical modelling of rock cutting force and failure surface in linear cutting test by single PDC cutter. J. Pet. Sci. Eng. 2019, 177, 306–316. [Google Scholar] [CrossRef]
- Gerbaud, L.; Menand, S.; Sellami, H. PDC bits: All comes from the cutter/rock interaction. In Proceedings of the IADC/SPE Drilling Conference, Miami, FL, USA, 21–23 February 2006; OnePetro: Richardson, TX, USA, 2006. [Google Scholar] [CrossRef]
- Bellin, F.; Dourfaye, A.; King, W.; Thigpen, M. The current state of PDC bit technology. World Oil 2010, 231, 67–71. [Google Scholar]
- Niu, S.; Zheng, H.; Yang, Y.; Chen, L. Experimental study on the rock-breaking mechanism of disc-like hybrid bit. J. Pet. Sci. Eng. 2018, 161, 541–550. [Google Scholar] [CrossRef]
- Franca, L.F. A bit–rock interaction model for rotary–percussive drilling. Int. J. Rock Mech. Min. Sci. 2011, 48, 827–835. [Google Scholar] [CrossRef]
- Rostamsowlat, I.; Akbari, B.; Evans, B. Analysis of rock cutting process with a blunt PDC cutter under different wear flat inclination angles. J. Pet. Sci. Eng. 2018, 171, 771–783. [Google Scholar] [CrossRef]
- Brett, J.F.; Warren, T.M.; Behr, S.M. Bit whirl: A new theory of PDC bit failure. In Proceedings of the SPE Annual Technical Conference and Exhibition, San Antonio, TX, USA, 8–11 October 1989; OnePetro: Richardson, TX, USA, 1989. [Google Scholar] [CrossRef]
- Ma, Y.; Huang, Z.; Li, Q.; Zhou, Y.; Peng, S. Cutter layout optimization for reduction of lateral force on PDC bit using Kriging and particle swarm optimization methods. J. Pet. Sci. Eng. 2018, 163, 359–370. [Google Scholar] [CrossRef]
- Akbari, B. Polycrystalline Diamond Compact Bit-Rock Interaction; Memorial University of Newfoundland: St. Joh’s, NL, Canada, 2011. [Google Scholar]
- Yahiaoui, M.; Paris, J.Y.; Delbé, K.; Denape, J.; Gerbaud, L.; Dourfaye, A. Independent analyses of cutting and friction forces applied on a single polycrystalline diamond compact cutter. Int. J. Rock Mech. Min. Sci. 2016, 85, 20–26. [Google Scholar] [CrossRef]
- Yahiaoui, M.; Paris, J.Y.; Delbé, K.; Denape, J.; Gerbaud, L.; Colin, C.; Ther, O.; Dourfaye, A. Quality and wear behavior of graded polycrystalline diamond compact cutters. Int. J. Refract. Met. Hard Mater. 2016, 56, 87–95. [Google Scholar] [CrossRef]
- Akbari, B.; Miska, S. The effects of chamfer and back rake angle on PDC cutters friction. J. Nat. Gas Sci. Eng. 2016, 35, 347–353. [Google Scholar] [CrossRef]
- Hungerford, F.; Ren, T. Poly-crystalline Diamond Drill Bit Development. In the 14th Coal Operators’ Conference; University of Wollongong, The Australasian Institute of Mining and Metallurgy and Mine Managers Association of Australia: Wollongong, NSW, Australia, 2014; pp. 293–300. [Google Scholar]
- Teale, R. The concept of specific energy in rock drilling. Int. J. Rock Mech. Min. Sci. Geomech. Abstr. 1965, 2, 57–73. [Google Scholar] [CrossRef]
- Rabia, H. Specific energy as a criterion for bit selection. J. Pet. Technol. 1985, 37, 1225–1229. [Google Scholar] [CrossRef]
- Pessier, R.C.; Fear, M.J. Quantifying common drilling problems with mechanical specific energy and a bit-specific coefficient of sliding friction. In Proceedings of the 67th Annual Technical Conference and Exhibition, Paper SPE 24584, Washington, DC, USA, 4 October 1992. [Google Scholar] [CrossRef]
- Zijsling, D.H. Single cutter testing-a key for PDC bit development. In Proceedings of the SPE Offshore Europe, Aberdeen, UK, 8–11 September 1987. [Google Scholar] [CrossRef]
- Kaitkay, P.; Lei, S. Experimental study of rock cutting under external hydrostatic pressure. J. Mater. Process. Technol. 2005, 159, 206–213. [Google Scholar] [CrossRef]
- Richard, T.; Coudyzer, C.; Desmette, S. Influence of groove geometry and cutter inclination in rock cutting. In Proceedings of the 44th US Rock Mechanics Symposium and 5th US-Canada Rock Mechanics Symposium, Salt Lake City, UT, USA, 27–30 June 2010; OnePetro: Richardson, TX, USA, 2010. [Google Scholar]
- Rafatian, N.; Miska, S.; Ledgerwood, L.W.; Ahmed, R.; Yu, M.; Takach, N. Experimental study of MSE of a single PDC cutter interacting with rock under simulated pressurized conditions. SPE Drill. Complet. 2010, 25, 10–18. [Google Scholar] [CrossRef]
- Rajabov, V.; Miska, S.; Mortimer, L.; Yu, M.; Ozbayoglu, E. The effects of back rake and side rake angles on mechanical specific energy of single PDC cutters with selected rocks at varying depth of cuts and confining pressures. In Proceedings of the IADC/SPE Drilling Conference and Exhibition, San Diego, CA, USA, 6–8 March 2012; OnePetro: Richardson, TX, USA, 2012. [Google Scholar] [CrossRef]
- Akbari, B.; Miska, S.Z.; Yu, M.; Rahmani, R. The effects of size, chamfer geometry, and back rake angle on frictional response of PDC cutters. In Proceedings of the 48th US Rock Mechanics/Geomechanics Symposium, Minneapolis, MN, USA, 1–4 June 2014; OnePetro: Richardson, TX, USA, 2014. [Google Scholar]
- Che, D.; Zhang, W.; Ehmann, K. Chip formation and force responses in linear rock cutting: An experimental study. J. Manuf. Sci. Eng. 2017, 139, 011011. [Google Scholar] [CrossRef]
- Doshvarpassand, S.; Richard, T.; Mostofi, M. Effect of groove geometry and cutting edge in rock cutting. J. Pet. Sci. Eng. 2017, 151, 1–12. [Google Scholar] [CrossRef]
- Cheng, Z.; Sheng, M.; Li, G.; Huang, Z.; Shi, H.; Dai, X.; Guo, Z. Cracks imaging in linear cutting tests with a PDC cutter: Characteristics and development sequence of cracks in the rock. J. Pet. Sci. Eng. 2019, 179, 1151–1158. [Google Scholar] [CrossRef]
- Caicedo, H.U.; Calhoun, W.M.; Ewy, R.T. Unique ROP predictor using bit-specific coefficient of sliding friction and mechanical efficiency as a function of confined compressive strength impacts drilling performance. In Proceedings of the SPE/IADC Drilling Conference, Amsterdam, The Netherlands, 23–25 February 2005; OnePetro: Richardson, TX, USA, 2005. [Google Scholar] [CrossRef]
- Armenta, M. Identifying inefficient drilling conditions using drilling-specific energy. In Proceedings of the SPE Annual Technical Conference and Exhibition, Denver, CO, USA, 21–24 September 2008; OnePetro: Richardson, TX, USA, 2008. [Google Scholar] [CrossRef]
- Mohan, K.; Adil, F.; Samuel, R. Tracking drilling efficiency using hydro-mechanical specific energy. In Proceedings of the SPE/IADC Drilling Conference and Exhibition, Amsterdam, The Netherlands, 17–19 March 2009; OnePetro: Richardson, TX, USA, 2009. [Google Scholar] [CrossRef]
- Johnson, K.L. The correlation of indentation experiments. J. Mech. Phys. Solids 1970, 18, 115–126. [Google Scholar] [CrossRef]
- Alehossein, H.; Detournay, E.; Huang, H. An analytical model for the indentation of rocks by blunt tools. Rock Mech. Rock Eng. 2000, 33, 267–284. [Google Scholar] [CrossRef]
- Chen, L.; Labuz, J.F. Indentation of rock by wedge-shaped tools. Int. J. Rock Mech. Min. Sci. 2006, 43, 1023–1033. [Google Scholar] [CrossRef]
- Hareland, G.; Nygaard, R.; Yan, W.; Wise, J.L. Cutting efficiency of a single PDC cutter on hard rock. J. Can. Pet. Technol. 2009, 48, 60–65. [Google Scholar] [CrossRef]
- Detournay, E.; Defourny, P. A phenomenological model for the drilling action of drag bits. Int. J. Rock Mech. Min. Sci. Geomech. Abstr. 1992, 29, 13–23. [Google Scholar] [CrossRef]
- Ju, P.; Tian, D.; Wang, C.; Tian, H. Theoretical and simulation analysis on rock breaking mechanical properties of arc-shaped PDC bit. Energy Rep. 2021, 7, 6690–6699. [Google Scholar] [CrossRef]
- Evans, I. Theory of the cutting force for point-attack picks. Int. J. Min. Miner. Eng. 1984, 2, 63–71. [Google Scholar] [CrossRef]
- Goktan, R.M. A suggested improvement on Evans’ cutting theory for conical bits. In Proceedings of the Fourth Symposium on Mine Mechanization Automation, Brisbane, Australia, 6–9 July 1997; Volume 1, pp. 57–61. [Google Scholar]
- Chen, P.; Meng, M.; Miska, S.; Yu, M.; Ozbayoglu, E.; Takach, N. Study on integrated effect of PDC double cutters. J. Pet. Sci. Eng. 2019, 178, 1128–1142. [Google Scholar] [CrossRef]
- Yang, Y.; Zhang, C.; Lin, M.; Chen, L. Research on rock-breaking mechanism of cross-cutting PDC bit. J. Pet. Sci. Eng. 2018, 161, 657–666. [Google Scholar] [CrossRef]
- Kuru, E.; Wojtanowicz, A.K. An experimental study of sliding friction between PDC drill cutters and rocks. Int. J. Rock Mech. Min. Sci. Geomech. Abstr. 1995, 32, 277–283. [Google Scholar] [CrossRef]
- Chen, Y. Experimental study of rock-breaking with an offset single cone bit. Pet. Sci. 2008, 5, 179–182. [Google Scholar] [CrossRef] [Green Version]
- Pavlovskaia, E.; Hendry, D.C.; Wiercigroch, M. Modelling of high frequency vibro-impact drilling. Int. J. Mech. Sci. 2015, 91, 110–119. [Google Scholar] [CrossRef] [Green Version]
- Jaime, M.C. Numerical Modeling of Rock Cutting and Its Associated Fragmentation Process Using the Finite Element Method. Ph.D. Thesis, University of Pittsburgh, Pittsburgh, PA, USA, 2011. [Google Scholar]
- Zhou, Y.; Zhang, W.; Gamwo, I.; Lin, J.S. Mechanical specific energy versus depth of cut in rock cutting and drilling. Int. J. Rock Mech. Min. Sci. 2017, 100, 287–297. [Google Scholar] [CrossRef]
- Martinez, I.R.; Fontoura, S.; Inoue, N.; Carrapatoso, C.; Lourengo, A.; Curry, D. Simulation of single cutter experiments in evaporites through finite element method. In Proceedings of the SPE/IADC Drilling Conference, Amsterdam, The Netherlands, 5–7 March 2013; OnePetro: Richardson, TX, USA, 2013. [Google Scholar] [CrossRef]
- Zhao, Y.; Zhang, C.; Zhang, Z.; Gao, K.; Li, J.; Xie, X. The rock breaking mechanism analysis of axial ultra-high frequency vibration assisted drilling by single PDC cutter. J. Pet. Sci. Eng. 2021, 205, 108859. [Google Scholar] [CrossRef]
- Li, Y.; Zhang, T.; Tian, Z.; Zheng, Y.; Yang, Z. Simulation on compound percussive drilling: Estimation based on multidimensional impact cutting with a single cutter. Energy Rep. 2021, 7, 3833–3843. [Google Scholar] [CrossRef]
- Mendoza, J.A.; Gamwo, I.K.; Zhang, W.; Lin, J.S. Considerations for discrete modeling of rock cutting. In Proceedings of the 45th US Rock Mechanics/Geomechanics Symposium, San Francisco, CA, USA, 26–29 June 2011; OnePetro: Richardson, TX, USA, 2011. [Google Scholar]
- Akbari, B.; Butt, S.D.; Munaswamy, K.; Arvani, F. Dynamic single PDC cutter rock drilling modeling and simulations focusing on rate of penetration using distinct element method. In Proceedings of the 45th US Rock Mechanics/Geomechanics Symposium, San Francisco, CA, USA, 26–29 June 2011; OnePetro: Richardson, TX, USA, 2011. [Google Scholar]
- Zhou, Y.; Yin, S.; Zhao, D. Effect of static loading on rock fragmentation efficiency under ultrasonic vibration. Geotech. Geol. Eng. 2019, 37, 3497–3505. [Google Scholar] [CrossRef]
- Wang, S.; Sloan, S.W.; Liu, H.; Tang, C. Numerical simulation of the rock fragmentation process induced by two drill bits subjected to static and dynamic (impact) loading. Rock Mech. Rock Eng. 2011, 44, 317–332. [Google Scholar] [CrossRef]
- Zhu, X.; Luo, Y.; Liu, W. The rock breaking and ROP increase mechanisms for single-tooth torsional impact cutting using DEM. Pet. Sci. 2019, 16, 1134–1147. [Google Scholar] [CrossRef] [Green Version]
- Tang, Q.; Zhao, D.; Zhou, Y.; Zhang, Z. Discrete element simulation for investigating fragmentation mechanism of hard rock under ultrasonic vibration loading. Energy Sci. Eng. 2020, 8, 3805–3822. [Google Scholar] [CrossRef]
- Fu, Z.; Tergeist, M.; Kueck, A.; Ostermeyer, G.P. Investigation of the cutting force response to a PDC cutter in rock using the discrete element method. J. Pet. Sci. Eng. 2022, 213, 110330. [Google Scholar] [CrossRef]
- Zhang, H.; Ni, H.; Wang, Z.; Huang, B.; Liu, S.; Xu, X.; Liu, C. Discrete element modeling and simulation study on cutting rock behavior under spring-mass-damper system loading. J. Pet. Sci. Eng. 2022, 209, 109872. [Google Scholar] [CrossRef]
- Rojek, J.; Onate, E.; Labra, C.; Kargl, H. Discrete element simulation of rock cutting. Int. J. Rock Mech. Min. Sci. 2011, 48, 996–1010. [Google Scholar] [CrossRef]
- Liu, W.; Zhu, X. Experimental study of the force response and chip formation in rock cutting. Arab. J. Geosci. 2019, 12, 457. [Google Scholar] [CrossRef]
- Li, X.; Zhang, Q.; Li, J.; Zhao, J. A numerical study of rock scratch tests using the particle-based numerical manifold method. Tunn. Undergr. Space Technol. 2018, 78, 106–114. [Google Scholar] [CrossRef]
- Gong, Q.; Zhao, J.; Jiao, Y. Numerical modeling of the effects of joint orientation on rock fragmentation by TBM cutters. Tunn. Undergr. Space Technol. 2005, 20, 183–191. [Google Scholar] [CrossRef]
- Liu, X.; Xu, M.; Qin, P. Joints and confining stress influencing on rock fragmentation with double disc cutters in the mixed ground. Tunn. Undergr. Space Technol. 2019, 83, 461–474. [Google Scholar] [CrossRef]
- Sheng, M.; Cheng, Z.; Gao, S.; Shi, H.; Zhang, Y. Shale bedding planes control rock removal behaviors of PDC cutter: Single cutter experiment. J. Pet. Sci. Eng. 2020, 185, 106640. [Google Scholar] [CrossRef]
- Zhu, X.; Liu, W.; Jia, Y. Investigation on the mechanism of laminated rock fragmentation under the action of cutting and indenting. Chin. J. Undergr. Space Eng. 2018, 14, 444–451. (In Chinese) [Google Scholar]
- Su, O.; Akcin, N.A. Numerical simulation of rock cutting using the discrete element method. Int. J. Rock Mech. Min. Sci. 2011, 48, 434–442. [Google Scholar] [CrossRef]
- Su, O. Simulation of rock cutting mechanism and characterization of failure mode in PFC3D. In Proceedings of the ISRM SINOROCK 2013, Shanghai, China, 18–20 June 2013; OnePetro: Richardson, TX, USA, 2013. [Google Scholar]
- Cundall, P.A. A computer model for simulating progressive, large-scale movement in blocky rock system. In Proceedings of the International Symposium on Rock Mechanics, Nancy, France, 4–6 October 1971. [Google Scholar]
- Itasca. PFC2D (Particle Flow Code in Two Dimensions), Version 3.1: General Formulation; Itasca Consulting Group Inc.: Minneapolis, MN, USA, 2004. [Google Scholar]
- Rahman, M.; Abdeli, M.; Miedema, S.; Schott, D. Simulation of Passive Soil Failure and Cutting Processes in Sand. In Proceedings of the International Conference on Offshore Mechanics and Arctic Engineering, Rotterdam, The Netherlands, 19–24 June 2011; Volume 44397, pp. 809–823. [Google Scholar] [CrossRef]
- Zhang, Q.; Han, Z.; Ning, S.; Liu, Q.; Guo, R. Numerical simulation of rock cutting in different cutting mode using the discrete element method. J. GeoEngineering 2015, 10, 35–43. [Google Scholar] [CrossRef]
- Yasitli, N.E.; Bayram, F.; Unver, B.; Ozcelik, Y. Determination of reactional cutting forces on a circular sawblade machine by using experimental studies and numerical modelling. Proc. Inst. Mech. Eng. Part C J. Mech. Eng. Sci. 2012, 226, 775–784. [Google Scholar] [CrossRef]
- Li, P.; Jiang, S.; Tang, D.; Xu, B. A PFC3D-based numerical simulation of cutting load for lunar rock simulant and experimental validation. Adv. Space Res. 2017, 59, 2583–2599. [Google Scholar] [CrossRef]
- Challamel, N.; Sellami, H. Application of yield design for understanding rock cutting mechanism. In Proceedings of the SPE/ISRM Rock Mechanics in Petroleum Engineering, Trondheim, Norway, 8–10 July 1998; OnePetro: Richardson, TX, USA, 1998. [Google Scholar] [CrossRef]
- Glowka, D.A. Development of a Method for Predicting the Performance and Wear of PDC (Polycrystalline Diamond Compact) Drill Bits; Sandia National Labs.: Albuquerque, NM, USA, 1987. [Google Scholar] [CrossRef] [Green Version]
- Wojtanowicz, A.K.; Kuru, E. Mathematical modeling of PDC bit drilling process based on a single-cutter mechanics. J. Energy Resour. Technol. 1993, 115, 247–256. [Google Scholar] [CrossRef]
- Fairhurst, C.; Lacabanne, W.D. Hard rock drilling techniques. Mine Quarry Eng. 1957, 23, 157–161. [Google Scholar]
- Zijsling, D.H. Analysis of temperature distribution and performance of polycrystalline diamond compact bits under field drilling conditions. In Proceedings of the SPE Annual Technical Conference and Exhibition, Houston, TX, USA, 16–19 September 1984; OnePetro: Richardson, TX, USA, 1984. [Google Scholar] [CrossRef]
- Wise, J.L.; Hareland, G.; Yan, W.; Nygaard, R. Cutting Efficiency of a Single PDC Cutter on Hard Rock; Sandia National Lab. (SNL-NM): Albuquerque, NM, USA, 2007. [Google Scholar]
- Liu, S.; Liu, H.; Wang, S.; Hu, B.; Zhang, X. Direct shear tests and PFC2D numerical simulation of intermittent joints. Chin. J. Rock Mech. Eng. 2008, 27, 1828–1836. (In Chinese) [Google Scholar]
- Zhou, Y.; Misra, A.; Wu, S.; Zhang, X. Macro-and meso-analyses of rock joint direct shear test using particle flow theory. Chin. J. Rock Mech. Eng. 2012, 31, 1245–1256. (In Chinese) [Google Scholar]
- Xia, L.; Zeng, Y.; Luo, R.; Liu, W. Influence of bedding planes on the mechanical characteristics and fracture pattern of transversely isotropic rocks in direct shear tests. Shock Vib. 2018, 2018, 6479031. [Google Scholar] [CrossRef]
- Huan, J.; Zhang, Z.; Li, N. Particle flow simulation of staggered joint rock by direct shear tests. Hydro-Sci. Eng. 2018, 4, 9–17. (In Chinese) [Google Scholar]
- Yang, S.; Yin, P.; Huang, Y. Experiment and discrete element modelling on strength, deformation and failure behaviour of shale under Brazilian compression. Rock Mech. Rock Eng. 2019, 52, 4339–4359. [Google Scholar] [CrossRef]
- Lv, Y.; Li, H.; Zhu, X.; Tang, L. Bonded-cluster simulation of rock-cutting using PFC2D. Clust. Comput. 2017, 20, 1289–1301. [Google Scholar] [CrossRef]


| Parameter | Signal | Value |
|---|---|---|
| minimum ball radius | Rmin (mm) | 0.3 |
| parallel bond radius multiplier | Rrat | 1.6 |
| ball stiffness ratio | kn/ks | 1 |
| ball-ball contact modulus | Ec (GPa) | 9 |
| ball friction coefficient | μ | 0.5 |
| parallel bond modulus | pb_Ec (GPa) | 9 |
| parallel bond stiffness ratio | pb_kn/pb_ks | 1 |
| parallel bond normal strength | pb_sn (MPa) | 65 ± 10 |
| parallel bond shear strength | pb_ss (MPa) | 55 ± 10 |
| Parameter | Signal | Value |
|---|---|---|
| contact bond normal strength | n_bond (MPa) | 30 |
| contact bond shear strength | s_bond (MPa) | 25 |
| friction coefficient | μ | 0.25 |
| normal stiffness | kn (GPa) | 2 |
| shear stiffness | ks (GPa) | 0.4 |
| Test Sequence | Factors | Level Value | Fixed Factors |
|---|---|---|---|
| Number 1 | Bedding dip | 0°, 30°, 45°, 60°, 90° | Bedding thickness: 6 mm, cutting depth: 15 mm, cutting rate: 8 m/s |
| Number 2 | Bedding thickness | 2 mm, 4 mm, 6 mm, 8 mm, 10 mm | Bedding dip: 60°, cutting depth: 15 mm, cutting rate: 8 m/s |
| Number 3 | Cutting depth | 5 mm, 10 mm, 15 mm, 20 mm, 25 mm | Bedding dip: 60°, bedding thickness: 6 mm, cutting rate: 8 m/s |
| Number 4 | Cutting rate | 6 m/s, 7 m/s, 8 m/s, 9 m/s, 10 m/s | Bedding dip: 60°, bedding thickness: 6 mm, cutting depth: 15 mm |
Disclaimer/Publisher’s Note: The statements, opinions and data contained in all publications are solely those of the individual author(s) and contributor(s) and not of MDPI and/or the editor(s). MDPI and/or the editor(s) disclaim responsibility for any injury to people or property resulting from any ideas, methods, instructions or products referred to in the content. |
© 2023 by the authors. Licensee MDPI, Basel, Switzerland. This article is an open access article distributed under the terms and conditions of the Creative Commons Attribution (CC BY) license (https://creativecommons.org/licenses/by/4.0/).
Share and Cite
Zhang, X.; Huang, X.; Qi, S.; Zheng, B.; Guo, S.; Lu, W. Numerical Simulation on Shale Fragmentation by a PDC Cutter Based on the Discrete Element Method. Energies 2023, 16, 965. https://doi.org/10.3390/en16020965
Zhang X, Huang X, Qi S, Zheng B, Guo S, Lu W. Numerical Simulation on Shale Fragmentation by a PDC Cutter Based on the Discrete Element Method. Energies. 2023; 16(2):965. https://doi.org/10.3390/en16020965
Chicago/Turabian StyleZhang, Xiaohui, Xiaolin Huang, Shengwen Qi, Bowen Zheng, Songfeng Guo, and Wei Lu. 2023. "Numerical Simulation on Shale Fragmentation by a PDC Cutter Based on the Discrete Element Method" Energies 16, no. 2: 965. https://doi.org/10.3390/en16020965
APA StyleZhang, X., Huang, X., Qi, S., Zheng, B., Guo, S., & Lu, W. (2023). Numerical Simulation on Shale Fragmentation by a PDC Cutter Based on the Discrete Element Method. Energies, 16(2), 965. https://doi.org/10.3390/en16020965