Article

Drag Reduction in the Flow of Aqueous Solutions of a Mixture of Cocamidopropyl Betaine and Cocamide DEA

by
Jacek Różański
*,
Sylwia Różańska
,
Piotr Tomasz Mitkowski
,
Waldemar Szaferski
,
Patrycja Wagner
and
Adrianna Frankiewicz
Department of Chemical Engineering and Equipment, Faculty of Chemical Technology, Poznan University of Technology, ul. Berdychowo 4, PL 60-965 Poznan, Poland
*
Author to whom correspondence should be addressed.
Energies 2021, 14(9), 2683; https://doi.org/10.3390/en14092683
Submission received: 19 March 2021 / Revised: 22 April 2021 / Accepted: 30 April 2021 / Published: 7 May 2021
(This article belongs to the Special Issue Multiphase Flows)

Abstract

:
The study presents results of rheological tests and measurements of pressure drops occurring during the flow of aqueous solutions of a mixture of drag reducing surfactants: cocamidopropyl betaine (CAPB, zwitterionic surfactant) and cocamide DEA (nonionic surfactant) through straight pipes. Tests were carried out at different CAPB/DEA weight ratios and different total concentrations of surfactants in the solution. Rheological measurements demonstrate the formation of a shear-induced structure (SIS) in the temperature range below 10 °C, which provides evidence for the presence of wormlike micelles in CAPB/DEA solutions. Drag reduction was observed during the flow of CAPB/DEA solutions in the temperature range from 3 to 45 °C, however, above 25 °C the degree of drag reduction was markedly decreased. The lower temperature limit at which drag reduction occurs depends on the CAPB and DEA weight ratio in the solution. In the range of higher temperatures, during the flow of CAPB/DEA solutions (similarly to flexible-chain polymer solutions) the onset of drag reduction is noted above a certain critical value of the Rec,0 number, whose value depends on the temperature of the solution, diameter of the pipe and the weight ratio of surfactants. At the same time, the critical value of wall shear stress τw,c0 corresponding to the critical value of Rec,0 is approximately independent of pipe diameter. The critical value of the Rec,0 number has been linked to the clouding of CAPB/DEA solutions.

1. Introduction

The addition of small quantities of certain surfactants, polymers and their mixtures to water can dramatically reduce the frictional drag [1,2,3,4,5]. A necessary condition for the existence of the drag reduction phenomenon in the solution is the creation of microstructure built of long micellar associates called thread- or wormlike micelles [1]. Polymer solutions degrade mechanically when shear stresses are applied. For this reason, they cannot be used in closed flow systems. Micellar microstructure also undergoes the mechanical degradation above a critical shear stress τc. However, in contrast to the polymers, it has the ability to self recovery when the value of shear stress will be reduced below the critical value τc [6,7], therefore, solutions of surfactants may find application in district heating and cooling systems.
The phenomenon of drag reduction can be induced by nonionic, cationic, anionic and amphoteric surfactants, however, the majority of studies published to date are concerned with cationic surfactants [8,9]. The benefits of cationic surfactants include stability and good performance within a broad temperature range [10]. The disadvantage is the rather high toxicity of quaternary ammonium compounds on marine organisms and the slow biodegradation [11]. In the range of low temperatures, cationic surfactants can be replaced by more environmentally friendly nonionic surfactants.
The first studies investigating drag reduction produced by nonionic surfactants were published by Zakin and Chiang [12] and Zakin and Lui [13]. The authors showed that the maximum drag reduction in the flow of solutions of polyoxyethylated alcohol mixtures occurred near their cloud point.
Hellsten and Harwigsson [14] designed a mixture of two nonionic surfactants: one consisting of ethoxylated unsaturated fatty alcohols (mainly oleyl alcohol) and the other of ethoxylated unsaturated fatty acid ethanolamides (mainly oleic acid). Their addition to water at a concentration of 0.4% was found to reduce drag in the temperature range from 5 to 40 °C, with an observable decrease in drag-reducing performance above 25 °C [15,16]. The above-mentioned surfactant mixture is available commercially under the name of SPE 95285.
Another group of nonionic surfactants used as additives causing drag reduction in flows are amine oxides [17,18,19,20,21]. Usui et al. [17] observed lower pressure drops in the flow of a solution of oleyldimethylamineoxide (ODMAO, Aromox, LION AKZO Co., Tokyo, Japan) within the temperature range from 10 to 40 °C. Another commonly used surfactant belonging to the group of amine oxides is oleyldihydoroxyetylamineoxide (ODEAO). An addition of the surfactant to aqueous solutions of propylene glycol (GP) [18] and ethylene glycol (GE) [19] causes a reduction of drag in turbulent flows within the low temperature range. In the flow of aqueous solutions of mixtures containing 0.797% ODEAO plus 30% GP and 0.794% ODEAO plus 50% GE, drag reduction was noted within the temperature ranges from −5 to 10 °C and from −20 to 5 °C, respectively.
The phenomenon of drag reduction can also be induced by using mixtures of various surfactant types. One of the more commonly used mixtures contains N-hexadecylbetaine and sodium dodecylbenzenesulphonate [22,23,24,25] and is available as a ready-made commercial product under the name of SPE 98330 (Akzo Nobel). At the manufacturer’s recommended concentration of 0.15%, an aqueous solution of SPE 98330 maintains its drag-reducing ability in turbulent flows up to the temperature of ca. 71–73 °C [23].
Inaba et al. [26] and Aly et al. [27] employed a mixture of oleyldihydroxyethylamineoxide and cetyldimethylaminoaciticacidbetaine as an additive inducing drag reduction in the temperature range from 5 to 20 °C. Cho et al. [28] observed drag reduction in the flow of a mixture of stearylamineoxide and betaine in the temperature range from 50 to 80 °C.
The present study shows results of rheological tests and measurements of pressure drops during the flow of aqueous solutions of a mixture of drag reducing surfactants: cocamidopropyl betaine (CAPB, a zwitterionic surfactant) and cocamide DEA (a nonionic surfactant) through straight pipes. The CAPB/DEA solutions can be used in the central cooling systems. The occurrence of drag reduction during the flow of CAPB/DEA solutions was discussed in the study [29]. Both surfactants are biodegradable and, at the same time, are corrosion inhibitors [30]. The main aim of the present study was to determine the effect of the weight ratio of the CAPB/DEA mixture components on their rheological properties and the ability to reduce pressure drops.

2. Experimental Apparatus and Procedure
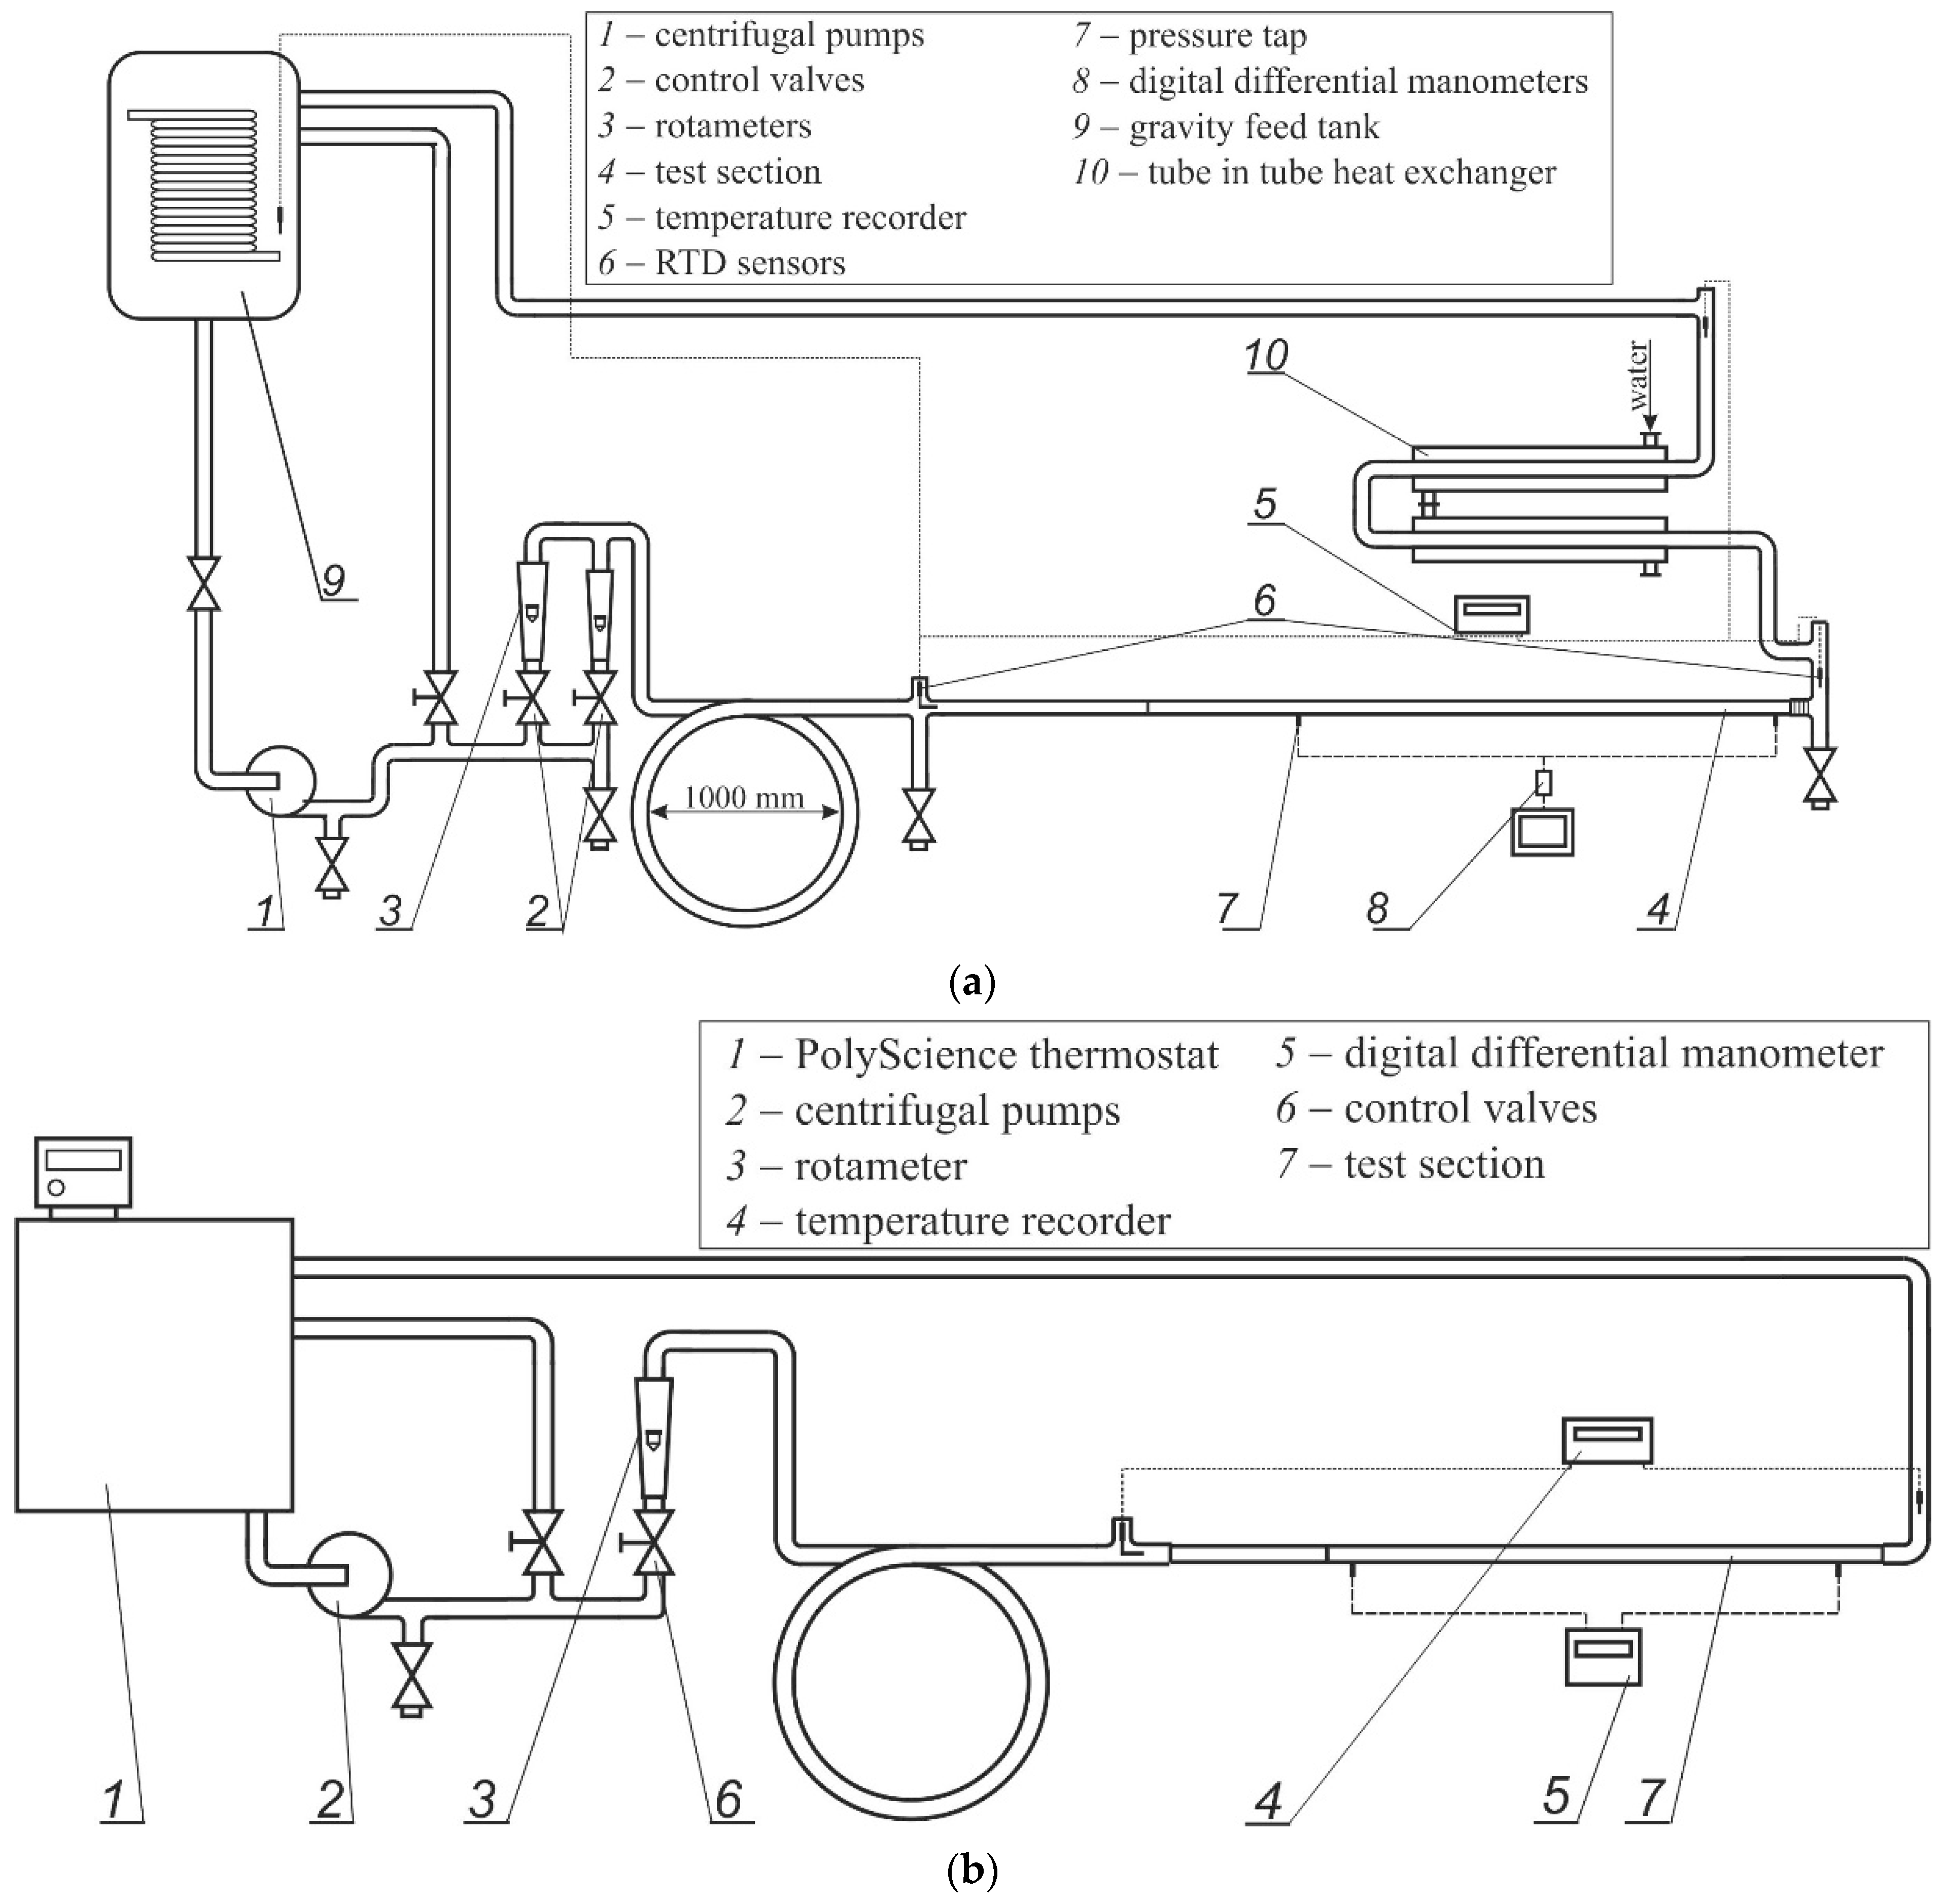
2.1. Test Facility

In the studies two experimental apparatus working in the range of temperature from 20 to 45 °C (Figure 1a) and from 0 to 20 °C (Figure 1b) were used. The first installation was equipped with Grundfos CHI4-30 (1) pump. The experimental apparatus was equipped with two rotameters operating in the ranges of 1.806 × 10⁻⁵–1.806 × 10⁻⁴ m3/s and 1.112 × 10⁻⁴–1.806 × 10⁻³ m3/s. The rotameters were scaled using the weight-tanks. Scaling was made for each surfactant solution and resulted in the accuracy of the volume flow-rate below 1%. From the rotameters, the liquid flowed through a pipe of about 4 m in length and of 38 mm in diameter to the measuring section in which the straight pipes (4) were mounted. The probes (7) mounted in the pipe’s walls were connected to three digital differential manometers (8) with the flexible pipes. The used manometers operated in the following ranges: 0–5 × 10³ Pa (Next Sensors Digitalmanometer DHM2), 0–3.5 × 10⁴ Pa (IMT Manoport model 3922,) and 0–1 × 10⁵ Pa (IMT Tecsis Digicomb) with accuracy of 0.25%, 0.2% and 0.25%, respectively. The temperature was controlled with four RTD sensors located in the gravity feed tank (6), one before and two after the measuring points. Accuracy of temperature measurement was ±0.1 K. Four sections of hydraulically smooth pipes were used in the experimental configuration. The inner diameters of the pipes and the length of the measuring sections L are given in Table 1.
For the lower temperature range, up to 3 °C, the test facility shown in Figure 1b was applied. The flow of the fluid was generated by a Grundfos UPE 25-60B centrifugal pump (2). The temperature of the fluid was maintained at the set level using a PolyScience thermostat (1) equipped with a refrigeration unit with a power rating of 1000 W. The flow rate was adjusted using a valve (6) and a rotameter (3). The temperature of the fluid was measured before the inlet into a section of the measuring pipe and just after its outlet by means of PT100 sensors connected to a HD32.7 RTD Datalogger from Delta OHM (4). The temperature was measured with accuracy to ±0.1 K. The experimental apparatus was fitted out with the single measuring pipe with an internal diameter of 11.1 mm (Table 1).
The friction factor was calculated according to the Darcy–Weisbach equation:
λ = 2 Δ P U 2 ρ D L = τ w 8 U 2 ρ
where ΔP is the measured pressure loss at the L distance of pipe with the inner diameter D, ρ is the density of the solution flowing with mean flow velocity U, and τw is the wall shear stress.
τ w = Δ P D 4 L
For easier comparative analysis, the friction factor can be replaced with the degree of drag reduction which follows the equation:
D R = λ t λ s λ t 100 %
In Equation (3) λt is the friction factor of distilled water, while λs stands for the surfactant solution. The values of λt were calculated from the Prandtl–Kármán equation at the same velocity of the surfactant solution and water.
The reliability of measurement configuration was verified by comparison of experimental friction factor λ for the distilled water with those resulted from the Prandtl–Kármán equation. Deviation of the experimental points from the Prandtl–Kármán equation does not exceed 4.9% (average deviations 2.7%).

2.2. Rheometer

Rheological measurements were carried out on the rotational stress rheometer Physica MCR 501 (Anton Paar) equipped with a concentric cylinder as the measuring geometry (CC27, cup and bob diameters 28.916 mm and 26.666 mm, respectively). All tests were performed in the scanning shear rate mode with increasing shear rate from 5 to 200 s−1 which resulted in the flow curves of surfactant solutions.

2.3. Determination of Cloud Point

The cloud point of CAPB/DEA solutions was evaluated visually in accordance with DIN EN-1890:2006. To this aim, the solutions were first heated to a temperature at which they became visibly clouded. Next, the solutions were cooled down, and the temperature at which they became clear was adopted as the cloud point. The temperature of the fluid was measured using a PT100 sensor connected to a Pt-401 meter from Elmetron. The accuracy of temperature measurement was ±0.1 K.

2.4. Materials

In the study the zwitterionic surfactant cocamidopropyl betaine (CAPB, commercial name: Rokamina K30) and nonionic surfactant cocamide DEA (commercial name: Rokamid KAD) delivered by PCC Exol were used. According to the manufacturer’s data, Rokamina K30 contains 30% of CAPB and 4% of NaCl, while Rokamid KAD contains 92% of DEA. The weight ratios listed in the study refer to the active substance content in the solution. The pH values of the tested solutions were close to neutral (pH ≈ 6.7). Distilled water was used as a solvent. Experiments were carried out at the entrance bulk fluid temperatures varying between 3 and 45 °C. Before each measurement, the investigated fluid was continuously pumped through the experimental apparatus for 48 h.

3. Results and Discussion

3.1. Cloud Point

DEA, the nonionic surfactant used in the tests, is very poorly soluble in water. DEA solutions in pure water were cloudy in the temperature range which was applied for the experiments (from 3 to 45 °C). The solutions of the CAPB/DEA mixture also became cloudy above a certain temperature (cloud point, CP). The defined cloud point values for CAPB/DEA solutions are listed in Table 2.
The solution of the CAPB/DEA mixture at a concentration of 0.12%/0.12% was cloudy within the entire range of temperature changes (from 3 to 25 °C). For other solutions of the CAPB/DEA mixture, the CP value rose along with an increase of the proportion of the zwitterionic surfactant in the mixture. The increase in DEA solubility through an addition of the zwitterionic surfactant is likely a consequence of the formation of charged mixed micelles. This causes repulsion between micelles, hindering their aggregation and thereby raising the CP [31].

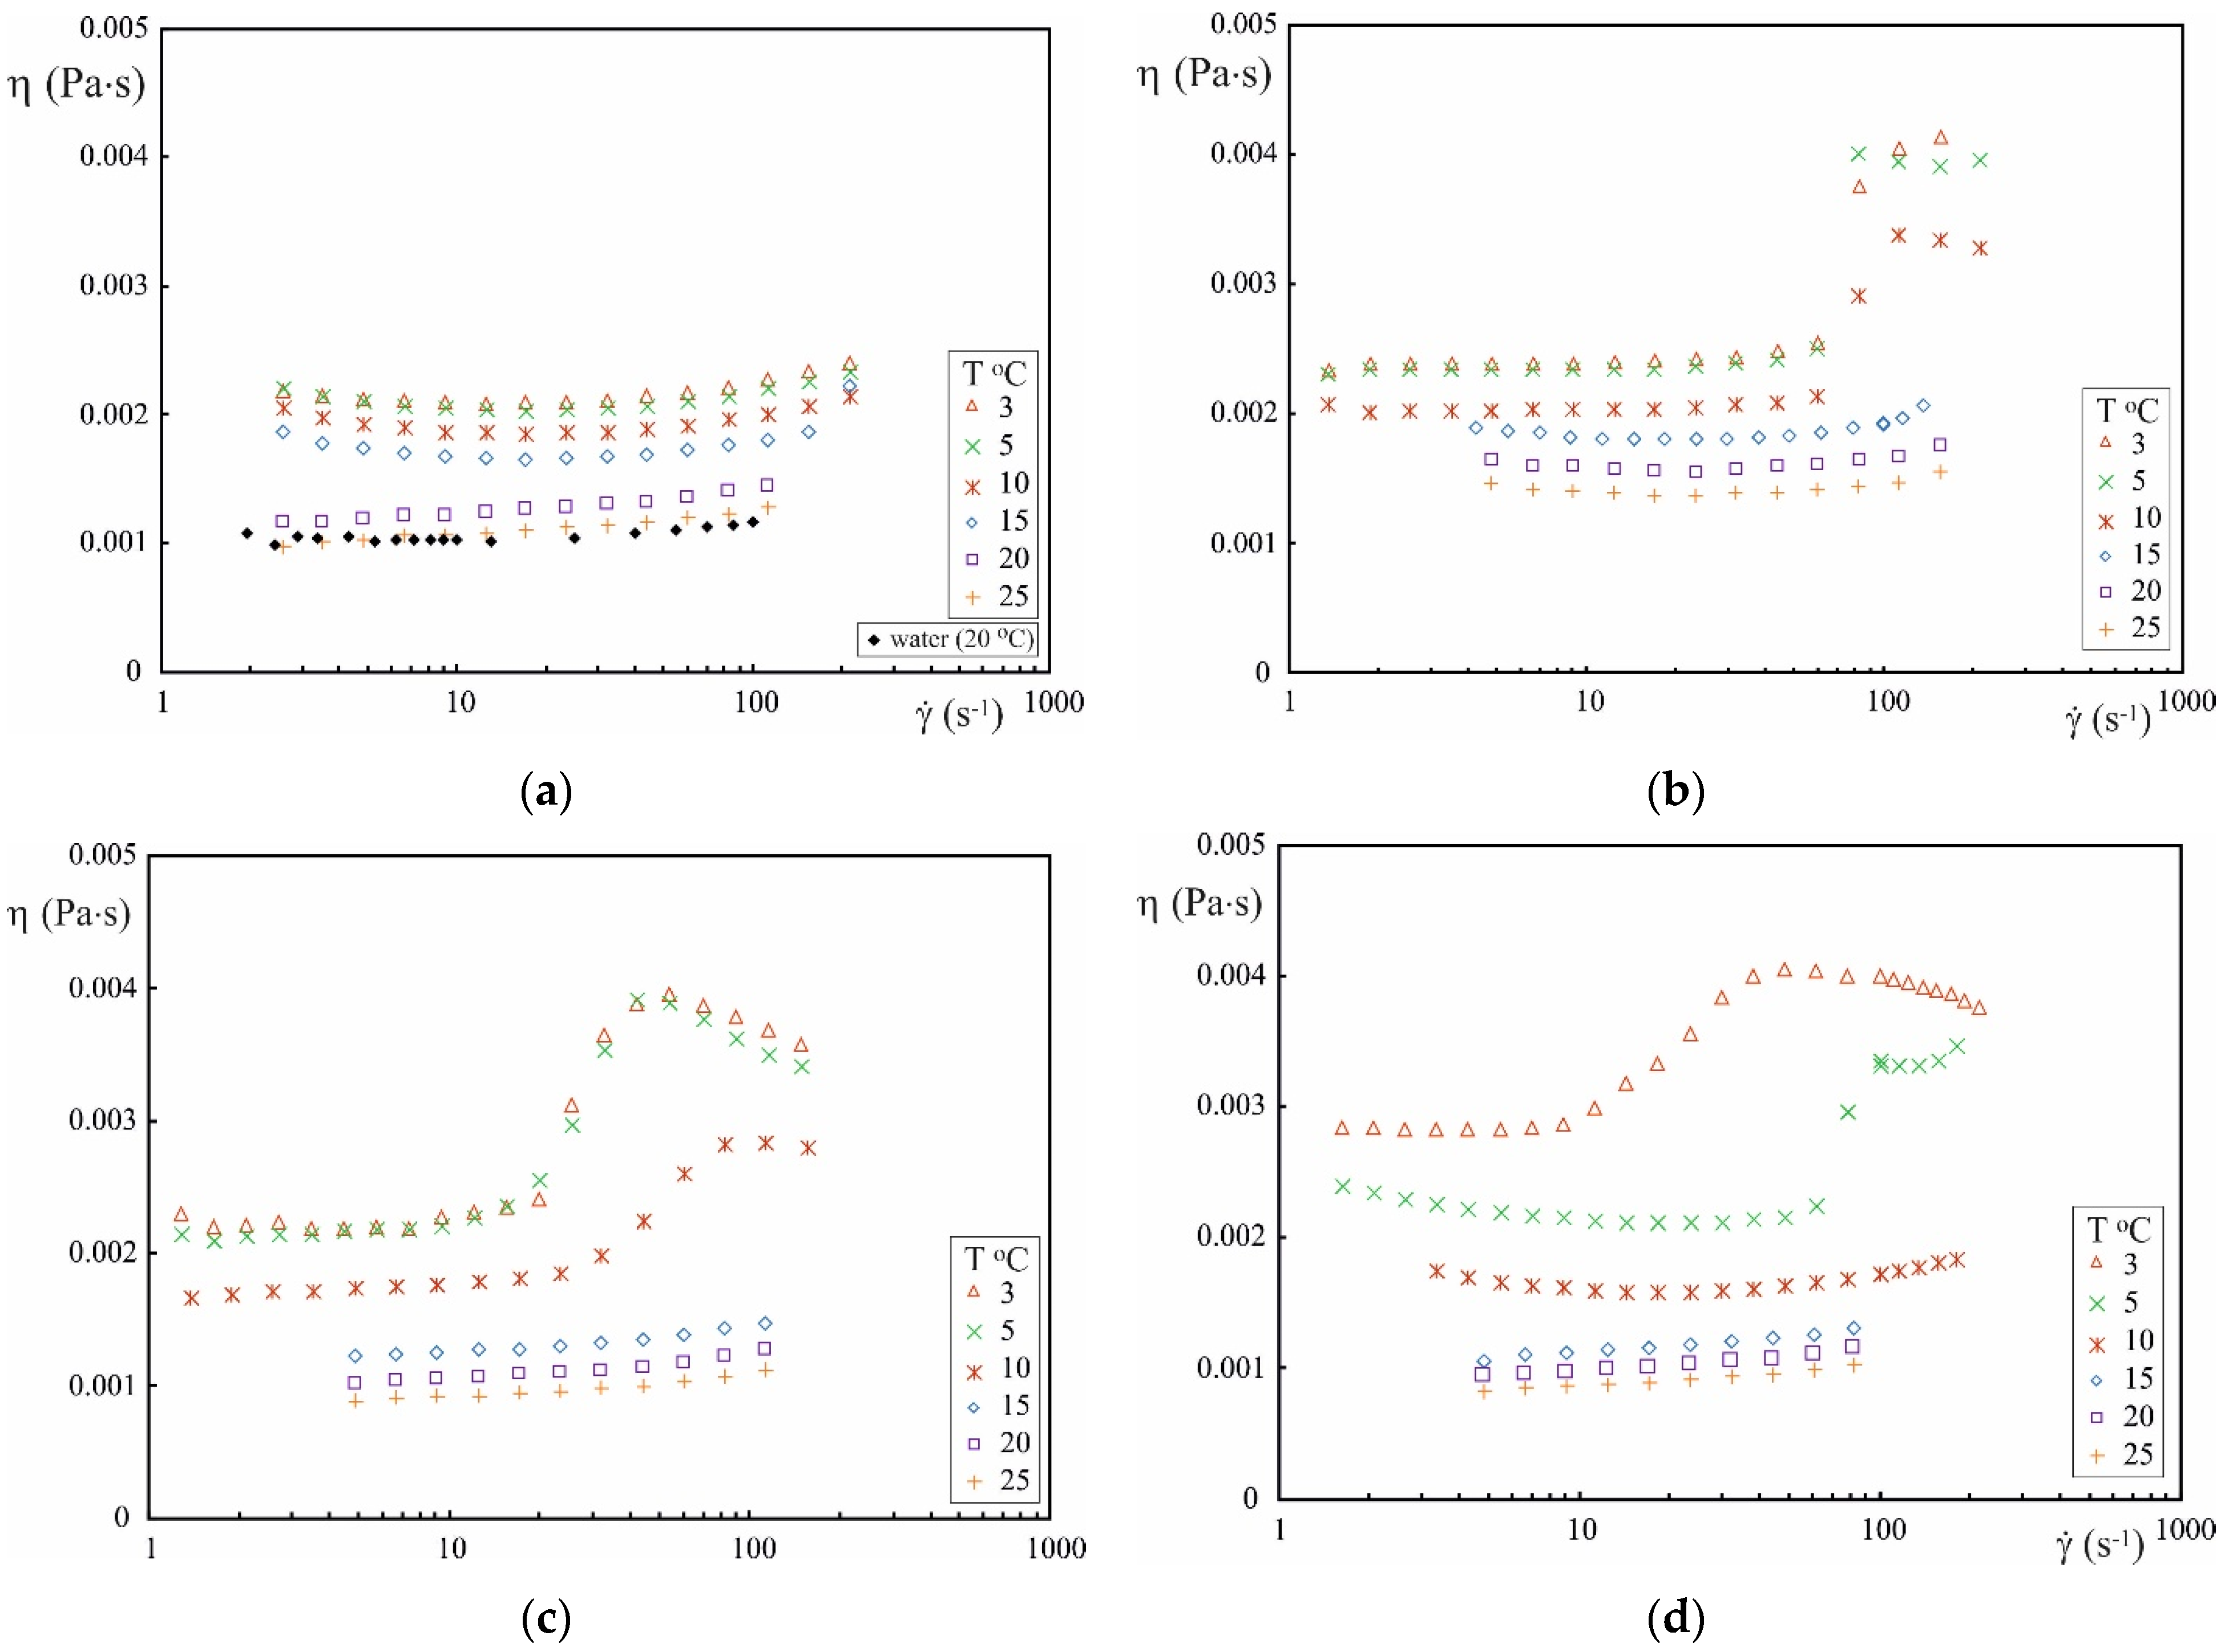
3.2. Rheological Results
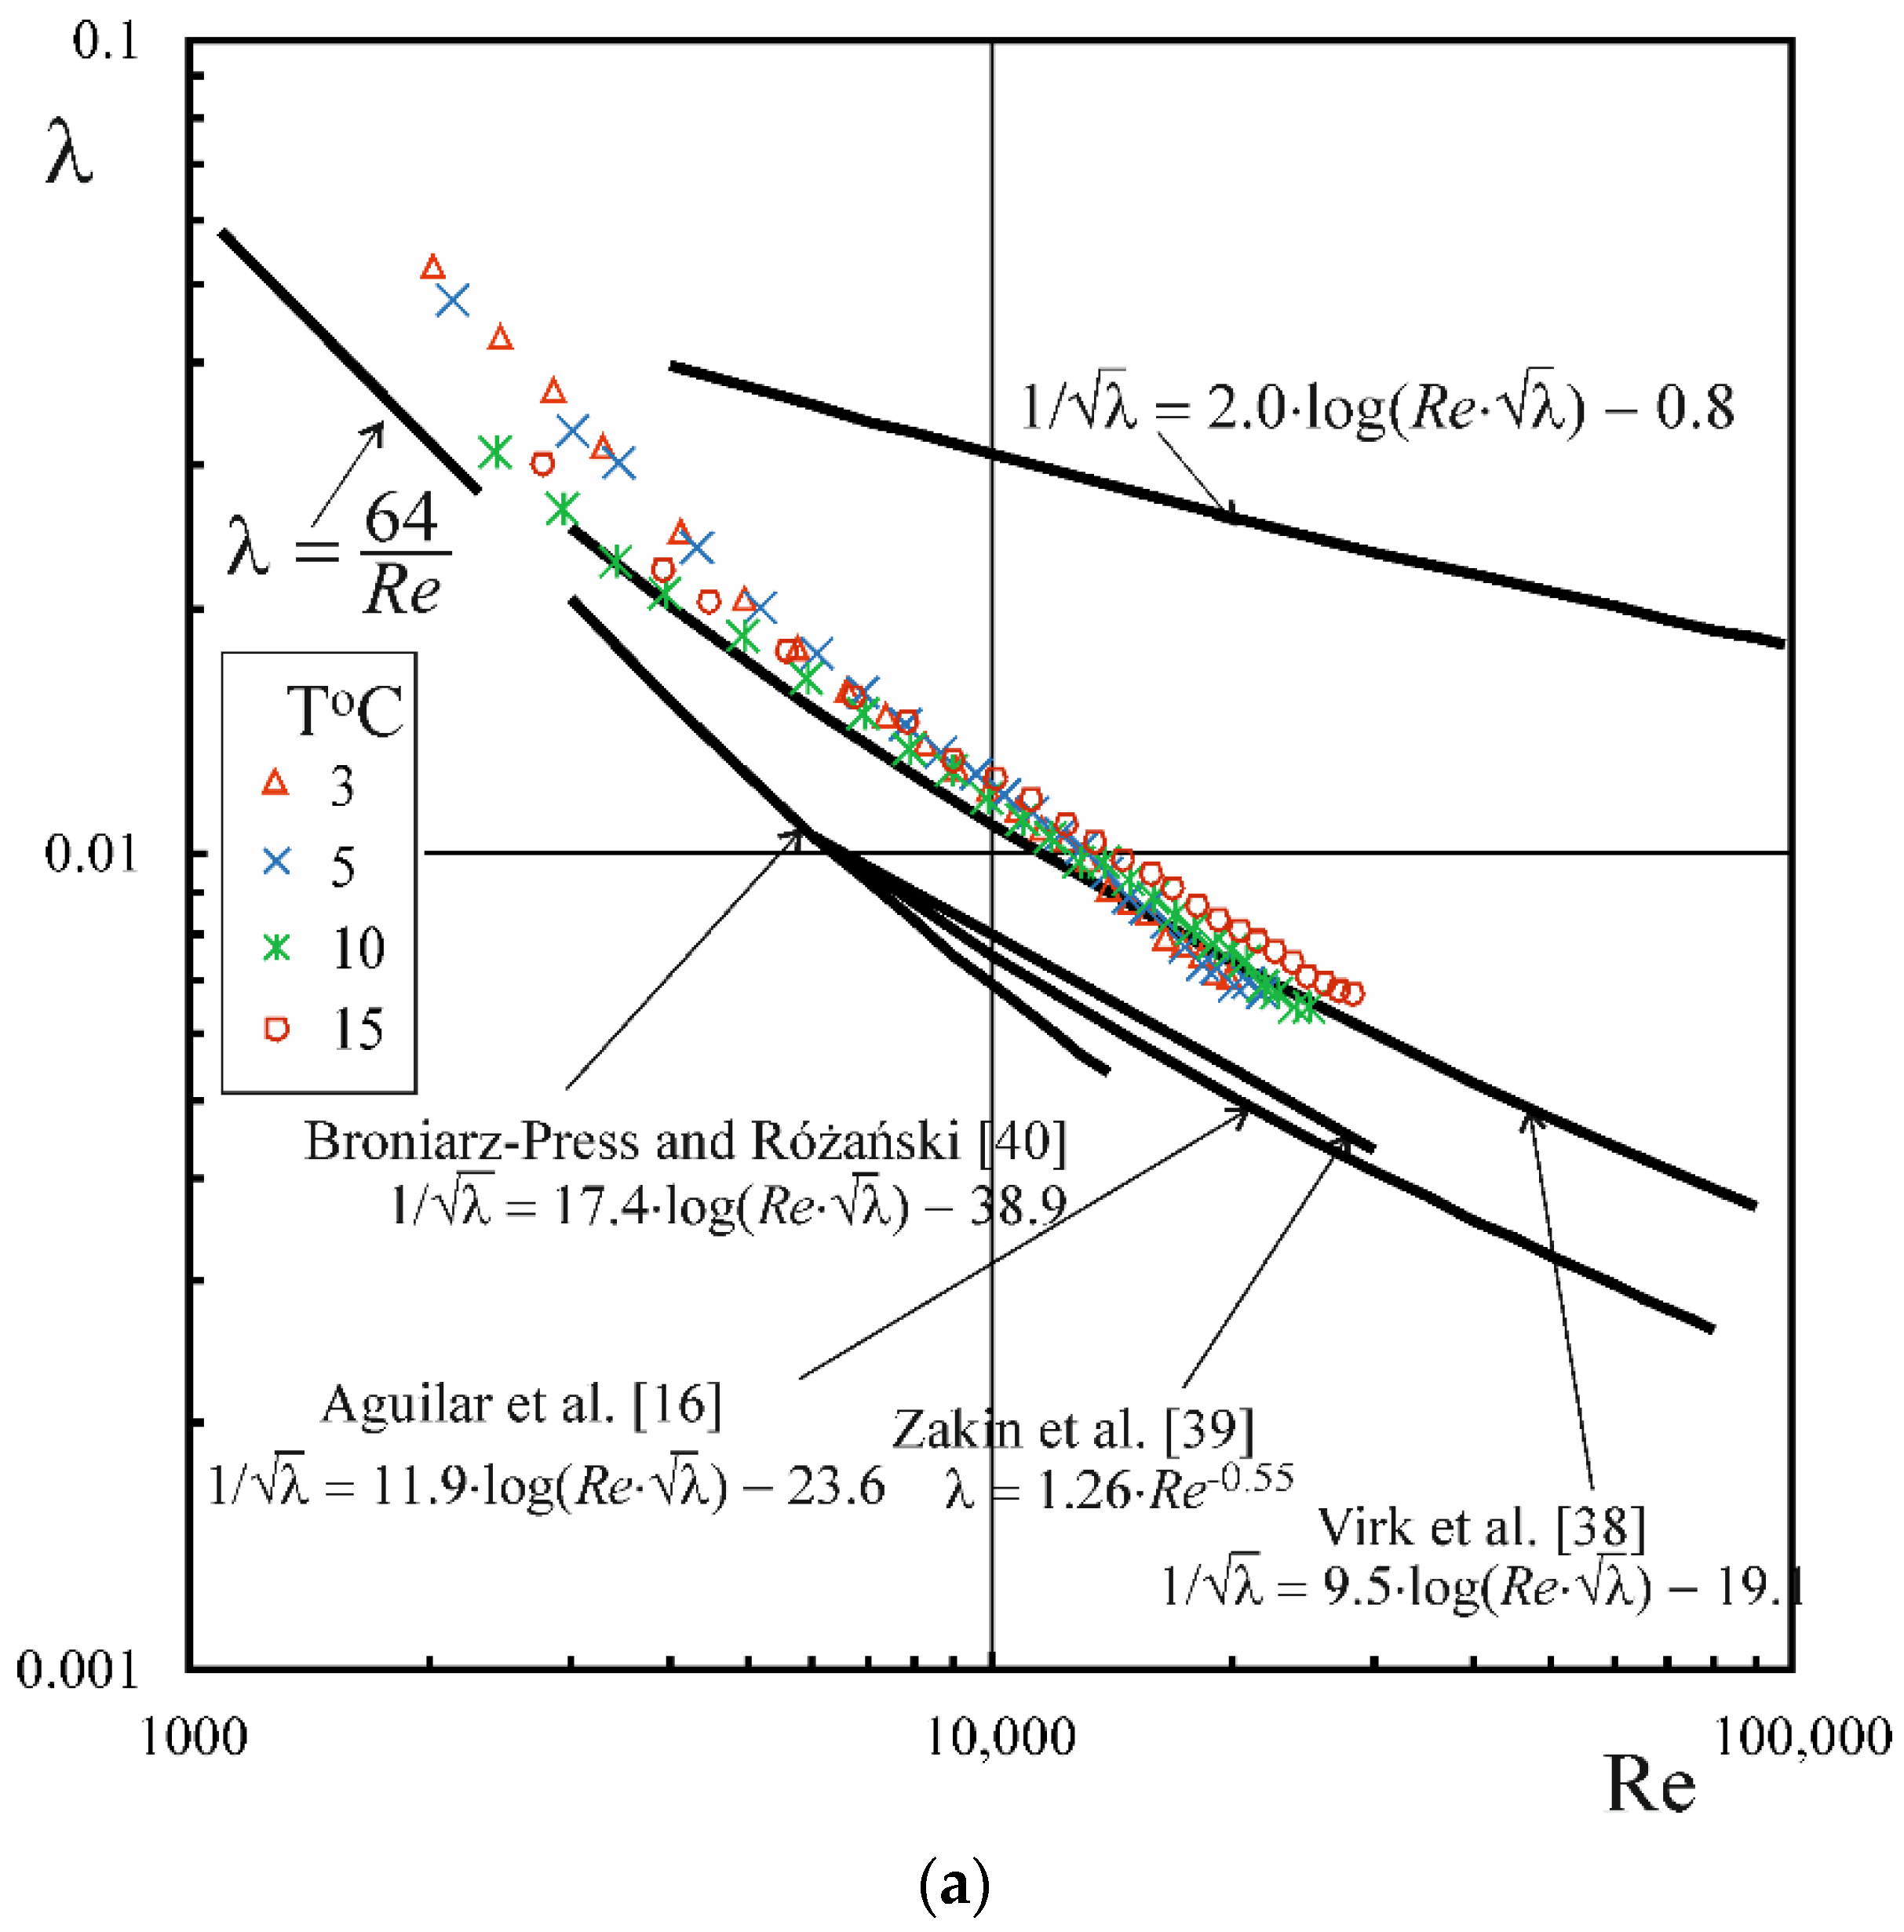
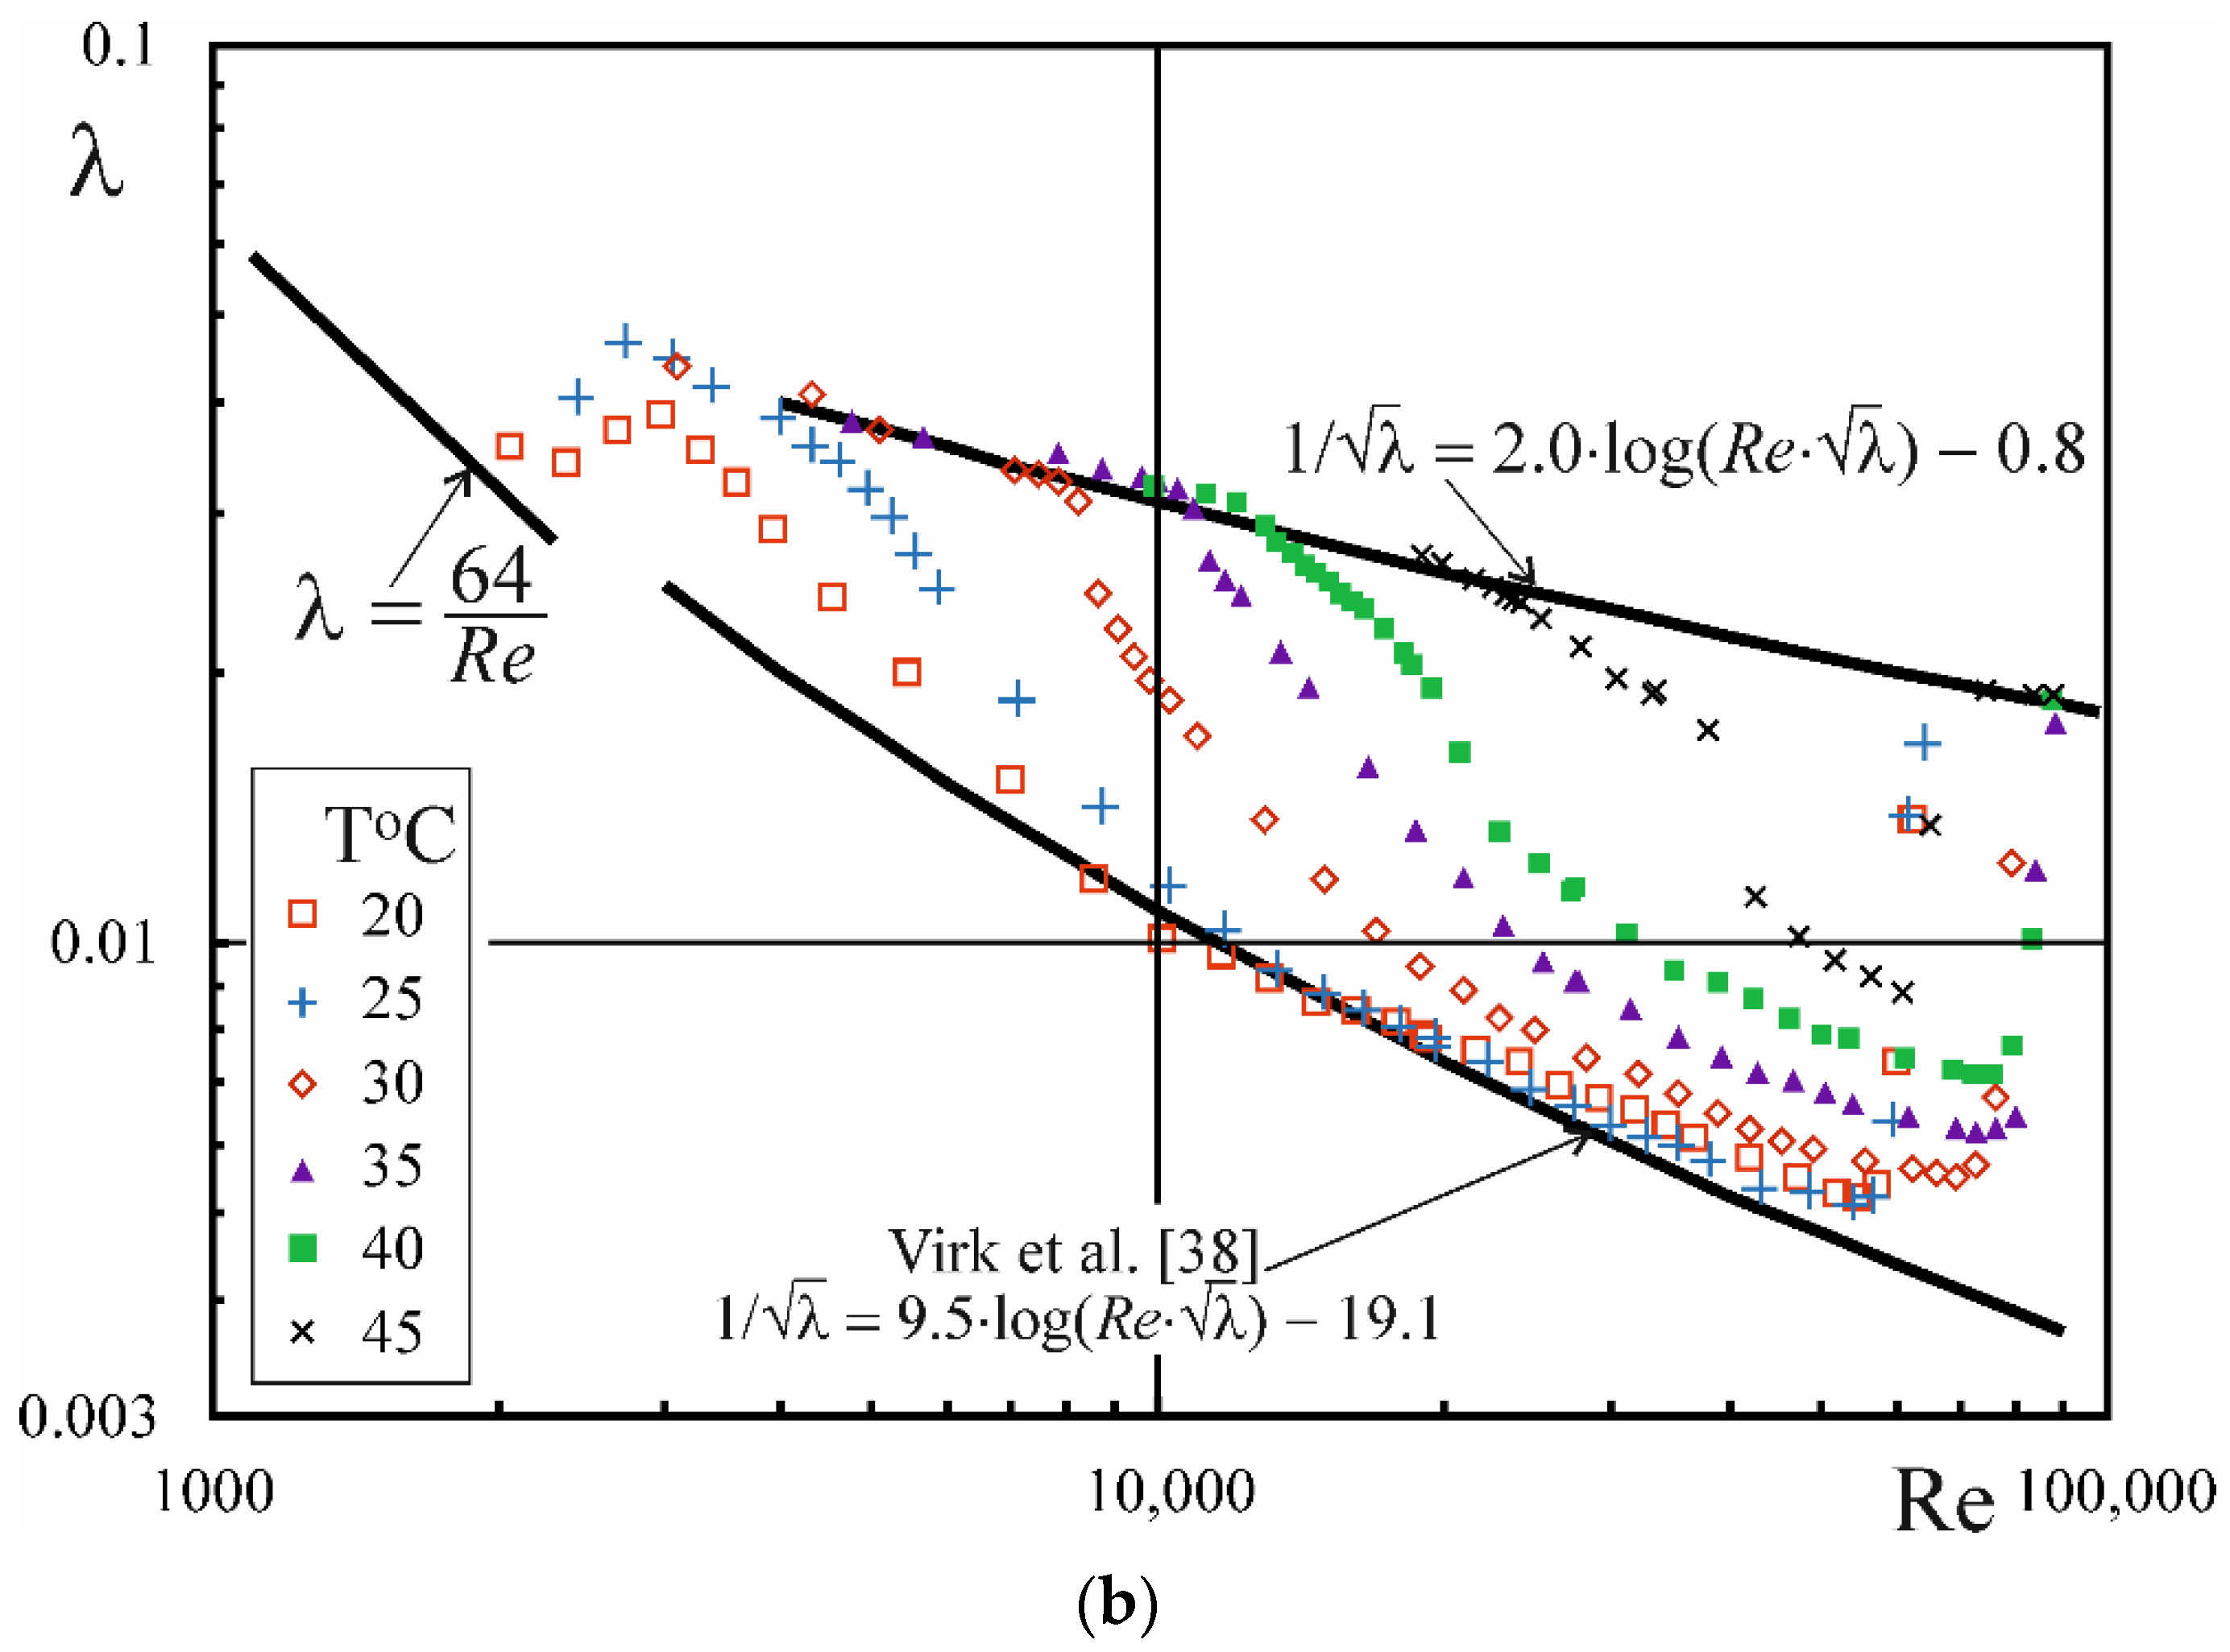
Figure 2 presents viscosity curves obtained for the aqueous solutions of CAPB/DEA with a constant concentration of the zwitterionic surfactant (0.12% wt%) and a variable concentration of the nonionic surfactant. For a solution with a DEA concentration of 0.072 wt%, the viscosity of the solution has an approximately constant value over the entire range of shear rate variations. The increase in DEA concentration to 0.088% caused a rise in viscosity in the temperature range from 3 to 10 °C above the critical shear rate at around γ ˙ c = 78 s−1, followed by stabilization at an approximately constant level. A clear shear thickening range can be observed for solutions at a DEA concentration of 0.1% in the temperature range from 3 to 10 °C (Figure 2c), and at a DEA concentration of 0.12% in the temperature range from 3 to 5 °C (Figure 2d). The finding suggests the formation of a shear-induced structure (SIS). The literature data [32,33,34] show that SIS formation occurs during the flow of surfactant solutions containing wormlike micelles and lyotropic lamellar phases during the formation of multilamellar vesicles. Additionally, the data presented in Figure 2 shows that no shear thickening range was observed on viscosity curves obtained at temperatures T ≥ 15 °C.
It was also found that in the shear thickening range the viscosity of CAPB/DEA solutions at a constant γ ˙ value increased as a function of time, and stabilized at an approximately constant level in less than ca. 70 s (Figures S1–S4). The relationship between viscosity and time during SIS formation is also a characteristic feature of wormlike surfactant solutions [34]. The experimental points shown in Figure 2 were recorded after 120 s, which is why they characterize the rheological properties of CAPB/DEA solutions with fully formed SIS.
A comparison of cloud points (Table 2) with the slope of viscosity curves obtained for CAPB/DEA solutions with concentrations of 0.12%/0.1% and 0.12%/0.12% (Figure 2c,d) reveals that the formation of SIS also occurs in cloudy solutions.
Due to the complex rheological properties of the investigated solutions as presented in Figure 2, the calculated Reynolds number utilizes the physical properties of water in bulk temperatures instead of those for CAPB/DEA solutions. This approach has been successfully used by many researchers [8,9,14,35,36] because of the possibility of using such calculated Reynolds number as the replacement parameter. It also has a practical justification since the Reynolds number calculated in this way, at a given average fluid flow rate, has the same value for a pure solvent and surfactant solution, therefore, it is possible to directly determine the actual flow drag reduction.

3.3. Drug Reduction

Figure 3 shows typical results of pressure drop measurements during the flow of an aqueous solution of CAPB/DEA with a concentration of 0.09%/0.075%. Between the temperatures of 3 and 15 °C, drag reduction occurs in the range of transitional and turbulent flows (Figure 3a).
The deviation of experimental points from the Hagen–Poiseuille theoretical relation for a solution at temperatures of 3 and 5 °C stems from the convention adopted for the calculation of the Reynolds number on the basis of pure water, whereas the actual viscosity of these solutions can be higher due to SIS formation.
The rise in temperature to 20 °C causes a characteristic inflection visible on the λ = f(Re) curve above Re = 2300, which demonstrates the emergence of the transitional flow range. At higher temperatures, drag reduction begins in the turbulent flow range above the critical value of the Reynolds number Rec,0. Similarly to the flow of other drag-reducing surfactant solutions [1,37], the phenomenon of drag reduction begins to disappear rapidly above the critical Reynolds number Rec,I, and disappears completely above Rec,II. The further course of experimental points is consistent with the line described by the Prandtl–Kármán equation.
Figure 3a also shows maximum drag reduction asymptotes (MDRA) proposed by Virk et al. [38] for polymer solutions, and by Zakin et al. [39], Aguilara et al. [16], and Broniarz-Press and Różański [40] for surfactant solutions. The data indicate that the maximum drag reduction in the flow of CAPB/DEA solutions is defined by the equation put forward by Virk et al. [38]. Tamano et al. [41] also found that maximum drag reduction and turbulence statistics for nonionic Aromox solutions were similar to those for polymer solutions, rather than cationic solutions. The Supplementary Materials contains additional dependencies of the friction coefficient on the Reynolds number for one-component DEA and CAPB solutions and a comparison of the test results obtained for the CAPB/DEA solution obtained in both experimental apparatus (Figures S5 and S6). These data show that during the flow of one-component solutions, the reduction of flow resistance does not occur, and the results obtained with use of both experimental apparatus are similar to each other.
Figure 4 illustrates the relationship between the friction factor λ as a function of the Reynolds number for solutions with a constant concentration of CAPB (0.12%) and variable concentrations of DEA. An increase in nonionic surfactant concentration leads primarily to changes in critical values of the Reynolds numbers Rec,0 and Rec,I, and critical wall shear stresses τwc,0 and τwc,I (Table 3). For solutions with DEA concentrations of 0.072 wt% and 0.088 wt%, the Rec,0 value equals approximately 4050. An increase in DEA concentration to 0.1 wt% and 0.12 wt% causes the Rec,0 number to rise to 4380 and 8860, respectively.
More complex changes can be observed for the critical Rec,I number. For solutions with DEA concentrations of 0.088 wt% and 0.1 wt%, the critical value of the Rec,I number was not achieved, which indicates that at these concentrations of a nonionic surfactant it will have the highest value. Both an increase and a decrease in DEA concentration reduces the critical Rec,I number and, consequently, also the critical wall shear stresses τwc,I.
At the same time, the data in Figure 5 show that at a constant CAPB/DEA weight ratio = 1.2 the values of the critical Reynolds numbers Rec,0 do not depend on the concentration of the surfactants (the Rec,0 value is approximately 4400). Similarly to other drag-reducing surfactants [1], an increase in the concentration of the CAPB/DEA mixture triggers an increase in the critical values of the Reynolds numbers Rec,I and Rec,II.
Figure 6 shows results of pressure drop measurements performed during the flow of a CAPB/DEA solution at a temperature of 30 °C through pipes of different diameters. Both the value of the critical Rec,0 number and the friction factor are strongly dependent on the pipe diameter. The data listed in Table 4 also point to the fact that the value of critical shear stresses τw,c0 is approximately independent of the pipe diameter. Similar observations for a solution of the cationic surfactant Ethoquad T13/27 with an addition of sodium salicylate (NaSal) were presented in the study by Gasljevic et al. [15].
The causes of the critical Rec,0 number, and hence the effect of diameter observed in the flow of surfactant solutions, have not been elucidated yet. However, Virk and Wagger [42] proposed an explanation of the phenomenon for polymer solutions. The authors distinguished two drag reduction types: A and B. Type A is characteristic of flexible-chain polymers which assume a coiled configuration in a solution in the steady state. When the flow exceeds a defined critical value of the shear stresses, the polymer chains in the solution become uncoiled, which is manifested by a reduction in pressure drop. The greater the pipe diameter, the higher the Reynolds number at which the critical shear stress occurs. If the critical value of shear stresses is achieved in the laminar flow range, a reduction in pressure drop is observed at the end of that range. However, if it takes place in the turbulent flow range, the onset of drag reduction along with an increase in pipe diameter is noted at higher values of the Reynolds number, resulting in the emergence of the diameter effect. Type B of drag reduction is characteristic of rigid-chain polymers which occur in an uncoiled form in steady-state solutions. As there is no need for polymer molecules stretching, drag reduction occurs every time with the end of the laminar flow range.
Figure 7 presents a photograph of a measuring cylinder containing a sample of a CAPB/DEA solution with a concentration of 0.12%/0.12%, collected from the test facility. Initially, the surfactant solution is cloudy within the entire volume, however two distinct phases can be noted after 48 h. The upper phase, which has a much smaller volume, most likely contains a major proportion of CAPB and DEA. Another experiment was also conducted to measure the pressure drop during the flow of a CAPB/DEA solution which was left undisturbed for 48 h. The data in Figure 8 show that immediately after pump activation pressure drops recorded during the flow of the CAPB/DEA solution were similar to pressure drops accompanying the flow of pure water. Nevertheless, as the time elapses, the pressure drops become smaller and after ca. 200 s they stabilize at a constant low level. If the flow of the fluid is stopped, and the pump is activated again after 10 min, pressure drops settle almost immediately at a constant low level.
Results obtained in that experiment demonstrate that the precondition for drag reduction during the flow of cloudy CAPB/DEA solutions is the presence of a surfactant-rich dispersed phase. At the same time, the presences of critical wall shear stress values τw,c0 indicate that changes in the microstructure of fluid occur during the flow, which lead to a reduction in pressure losses. From the data shown in Figure 3 it follows that the drag reduction in CAPB/DEA solutions begins at the end of the laminar flow range already at a temperature of 15 °C, even though the solution did not become clear until the temperature level of 9 °C. In this case, the value of the shear stress τw,c0 required for the formation of drag reduction microstructure was most probably achieved within the laminar flow range.
It should be noted that, based on the results of pressure loss measurements and rheological tests presented in this paper, it is impossible to explain the reasons for the occurrence of the critical Reynolds number Rec,0. Understanding the changes in the microstructure of CAPB/DEA solutions during the flow requires understanding the morphology of cloudy solution in the rest and flow.
The weight ratio of the components of the CAPB/DEA mixture also affects the value of the lower temperature at which drag reduction is observed. The data in Figure 9b show that at a temperature of 10 °C the DR parameter in the DEA concentration range between 0.072 wt% and 0.12 wt% achieves the level of ca. 70%. However, already at 3 °C the maximum value of the DR parameter determined for DEA at a concentration of 0.072 wt% is only 27% (Figure 9a).
From the viscosity curves shown in Figure 2 it follows that at 3 °C the solution of CAPB/DEA at a concentration of 0.12%/0.072% had the lowest viscosity, which proves indirectly that it was affected by the formation of the shortest wormlike micelles. A reduction in the length of wormlike micelles accompanying a decrease in DEA concentration at a given temperature may be an outcome of an increase in micelle surface charge density, which leads to an increased electrostatic repulsion [43].

4. Conclusions

Rheological tests and measurements of pressure drop performed during the flow of aqueous solutions of the CAPB/DEA mixtures lead to the following conclusions:
  • The slope of the viscosity curves generated for aqueous solutions of CAPB/DEA points to the occurrence of the shear thickening range, which is evidence for the formation of shear-induced structure (SIS) and can indicate the presence of wormlike micelles or multilamellar vesicles in the solution.
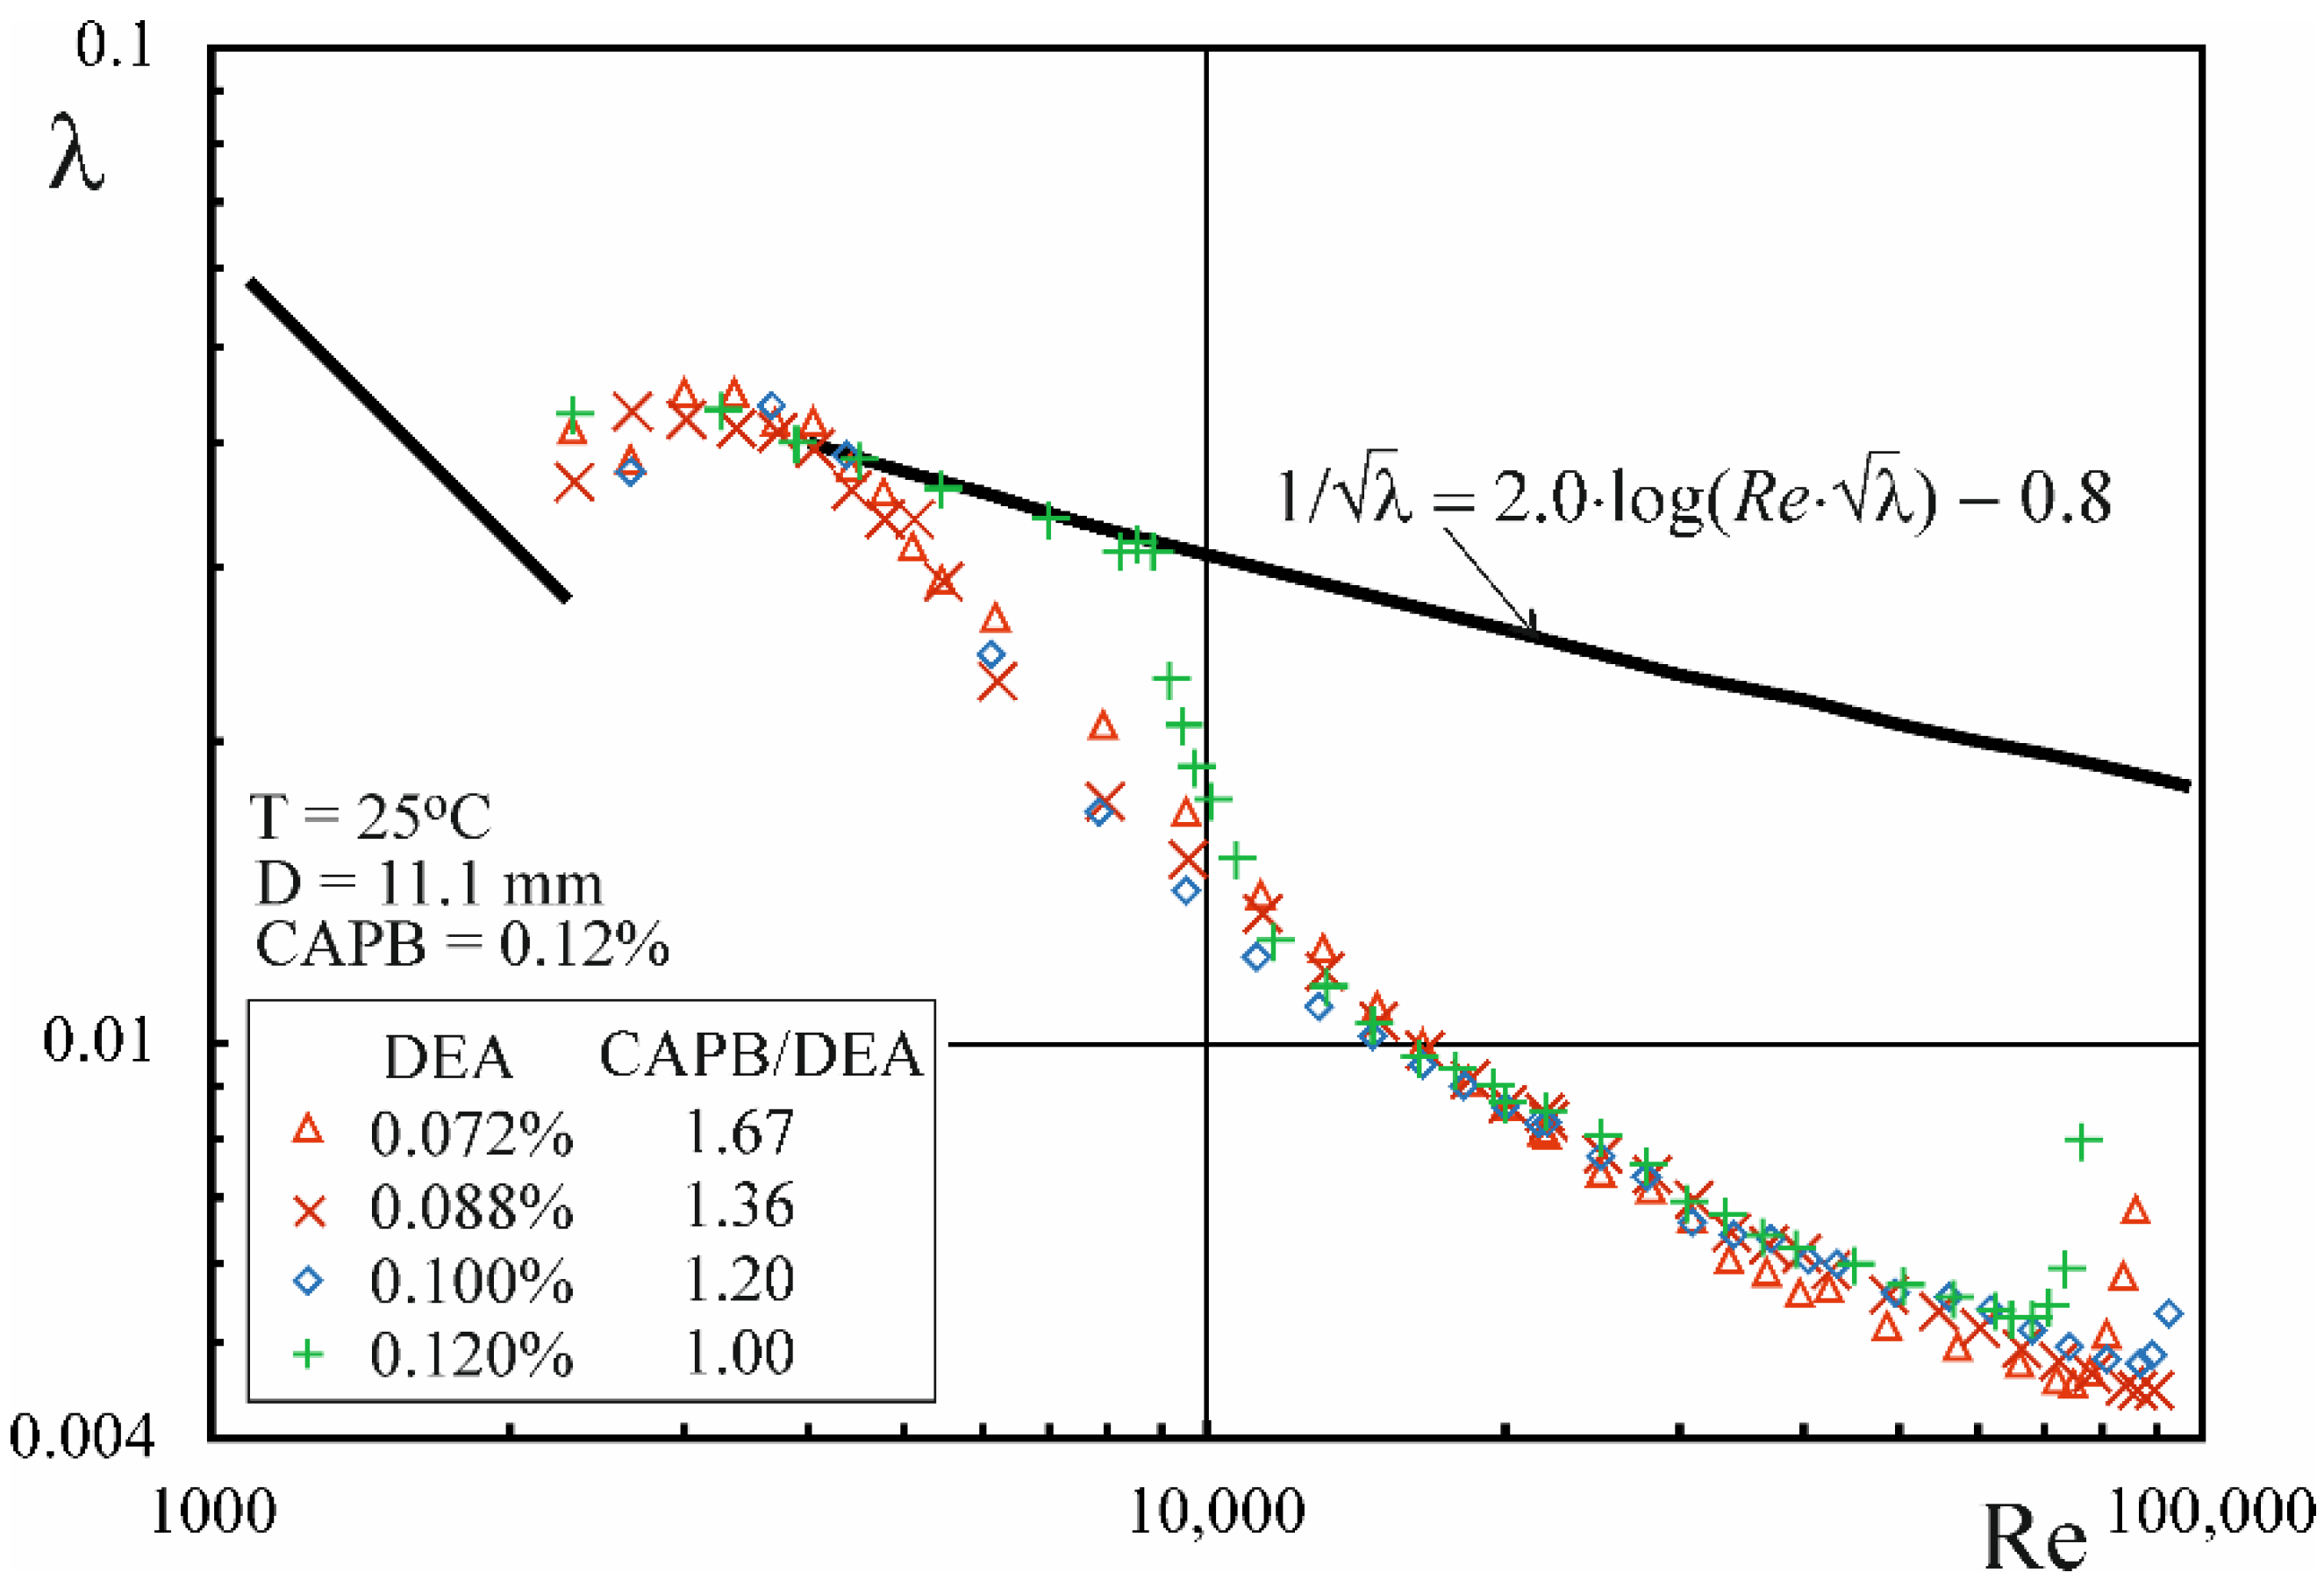
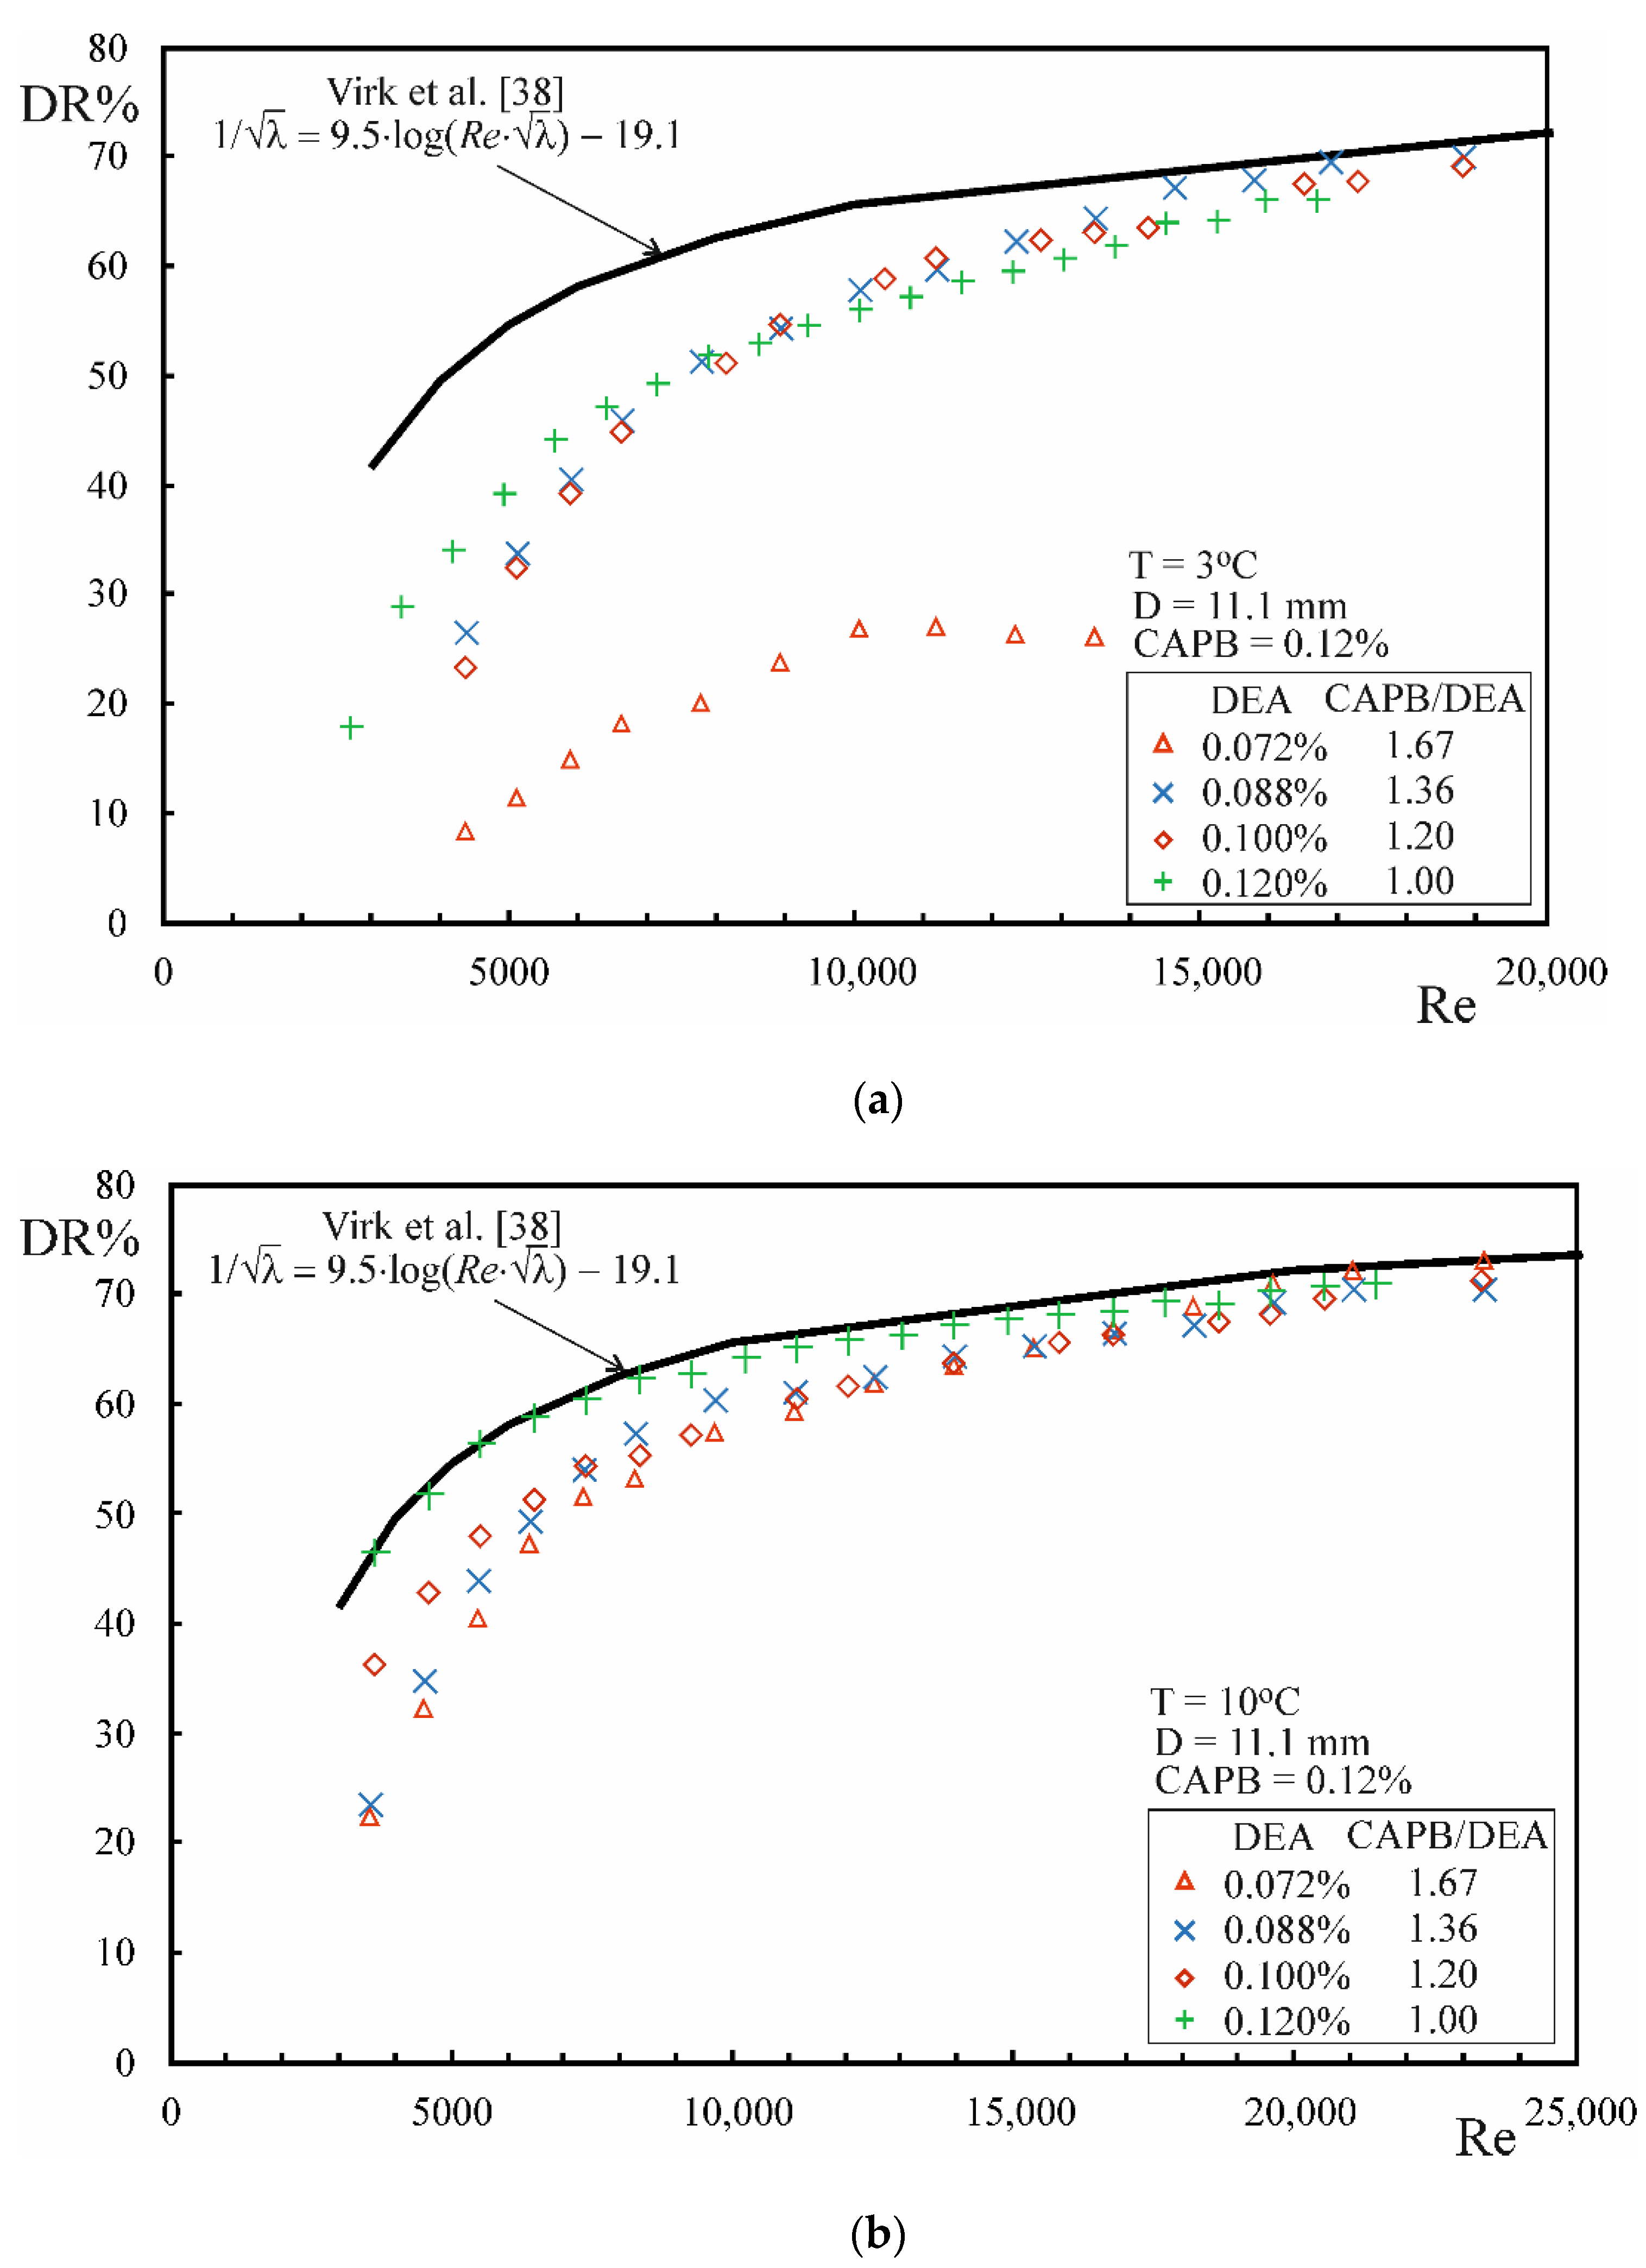
  • The phenomenon of drag reduction occurs during the flow of CAPB/DEA solutions in the temperature range from 3 to 45 °C, whereby the level of drag reduction that approximates the MDRA described by Virk et al. [38] is noted in the temperature range between 3 and 25 °C.
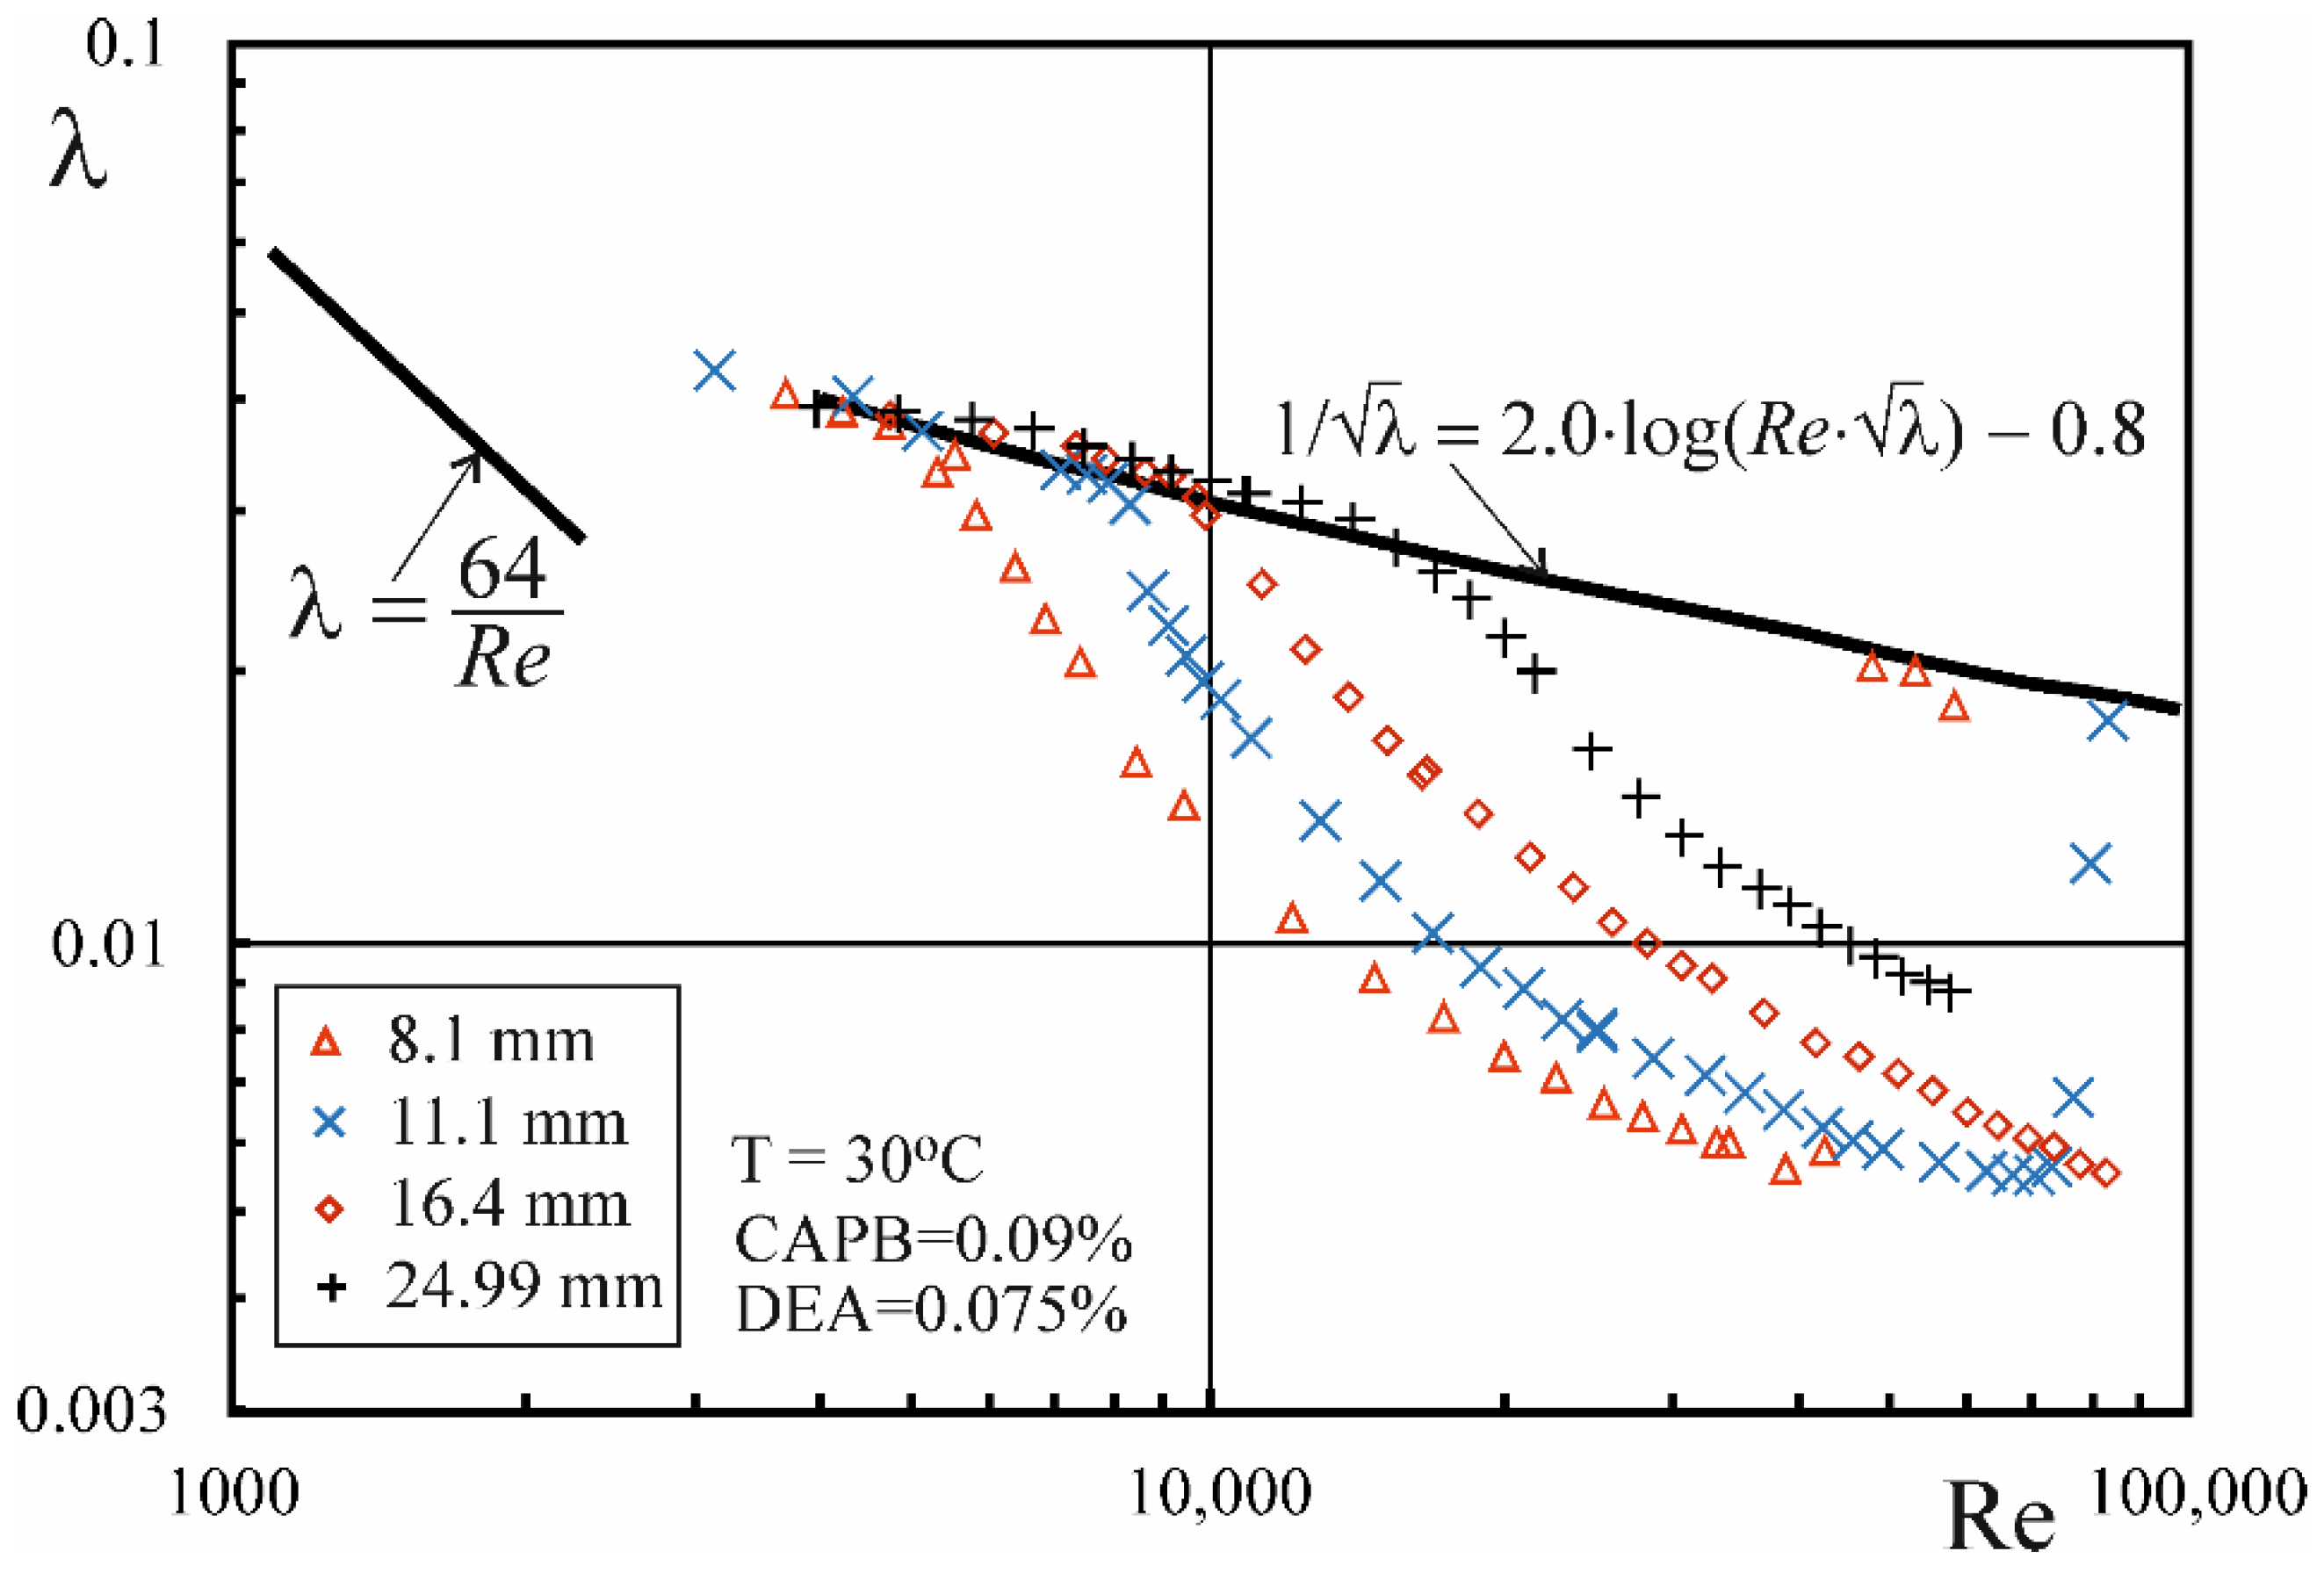
  • In the range of higher temperatures, the onset of drag reduction during the flow of CAPB/DEA solutions occurs above a certain critical value of the Rec,0 number, whose value depends on the temperature of the solution, diameter of the pipe and the weight ratio of surfactants. At the same time, the critical value of the wall shear stress τw,c0 corresponding to the critical value of the Rec,0 number is approximately independent of pipe diameter.
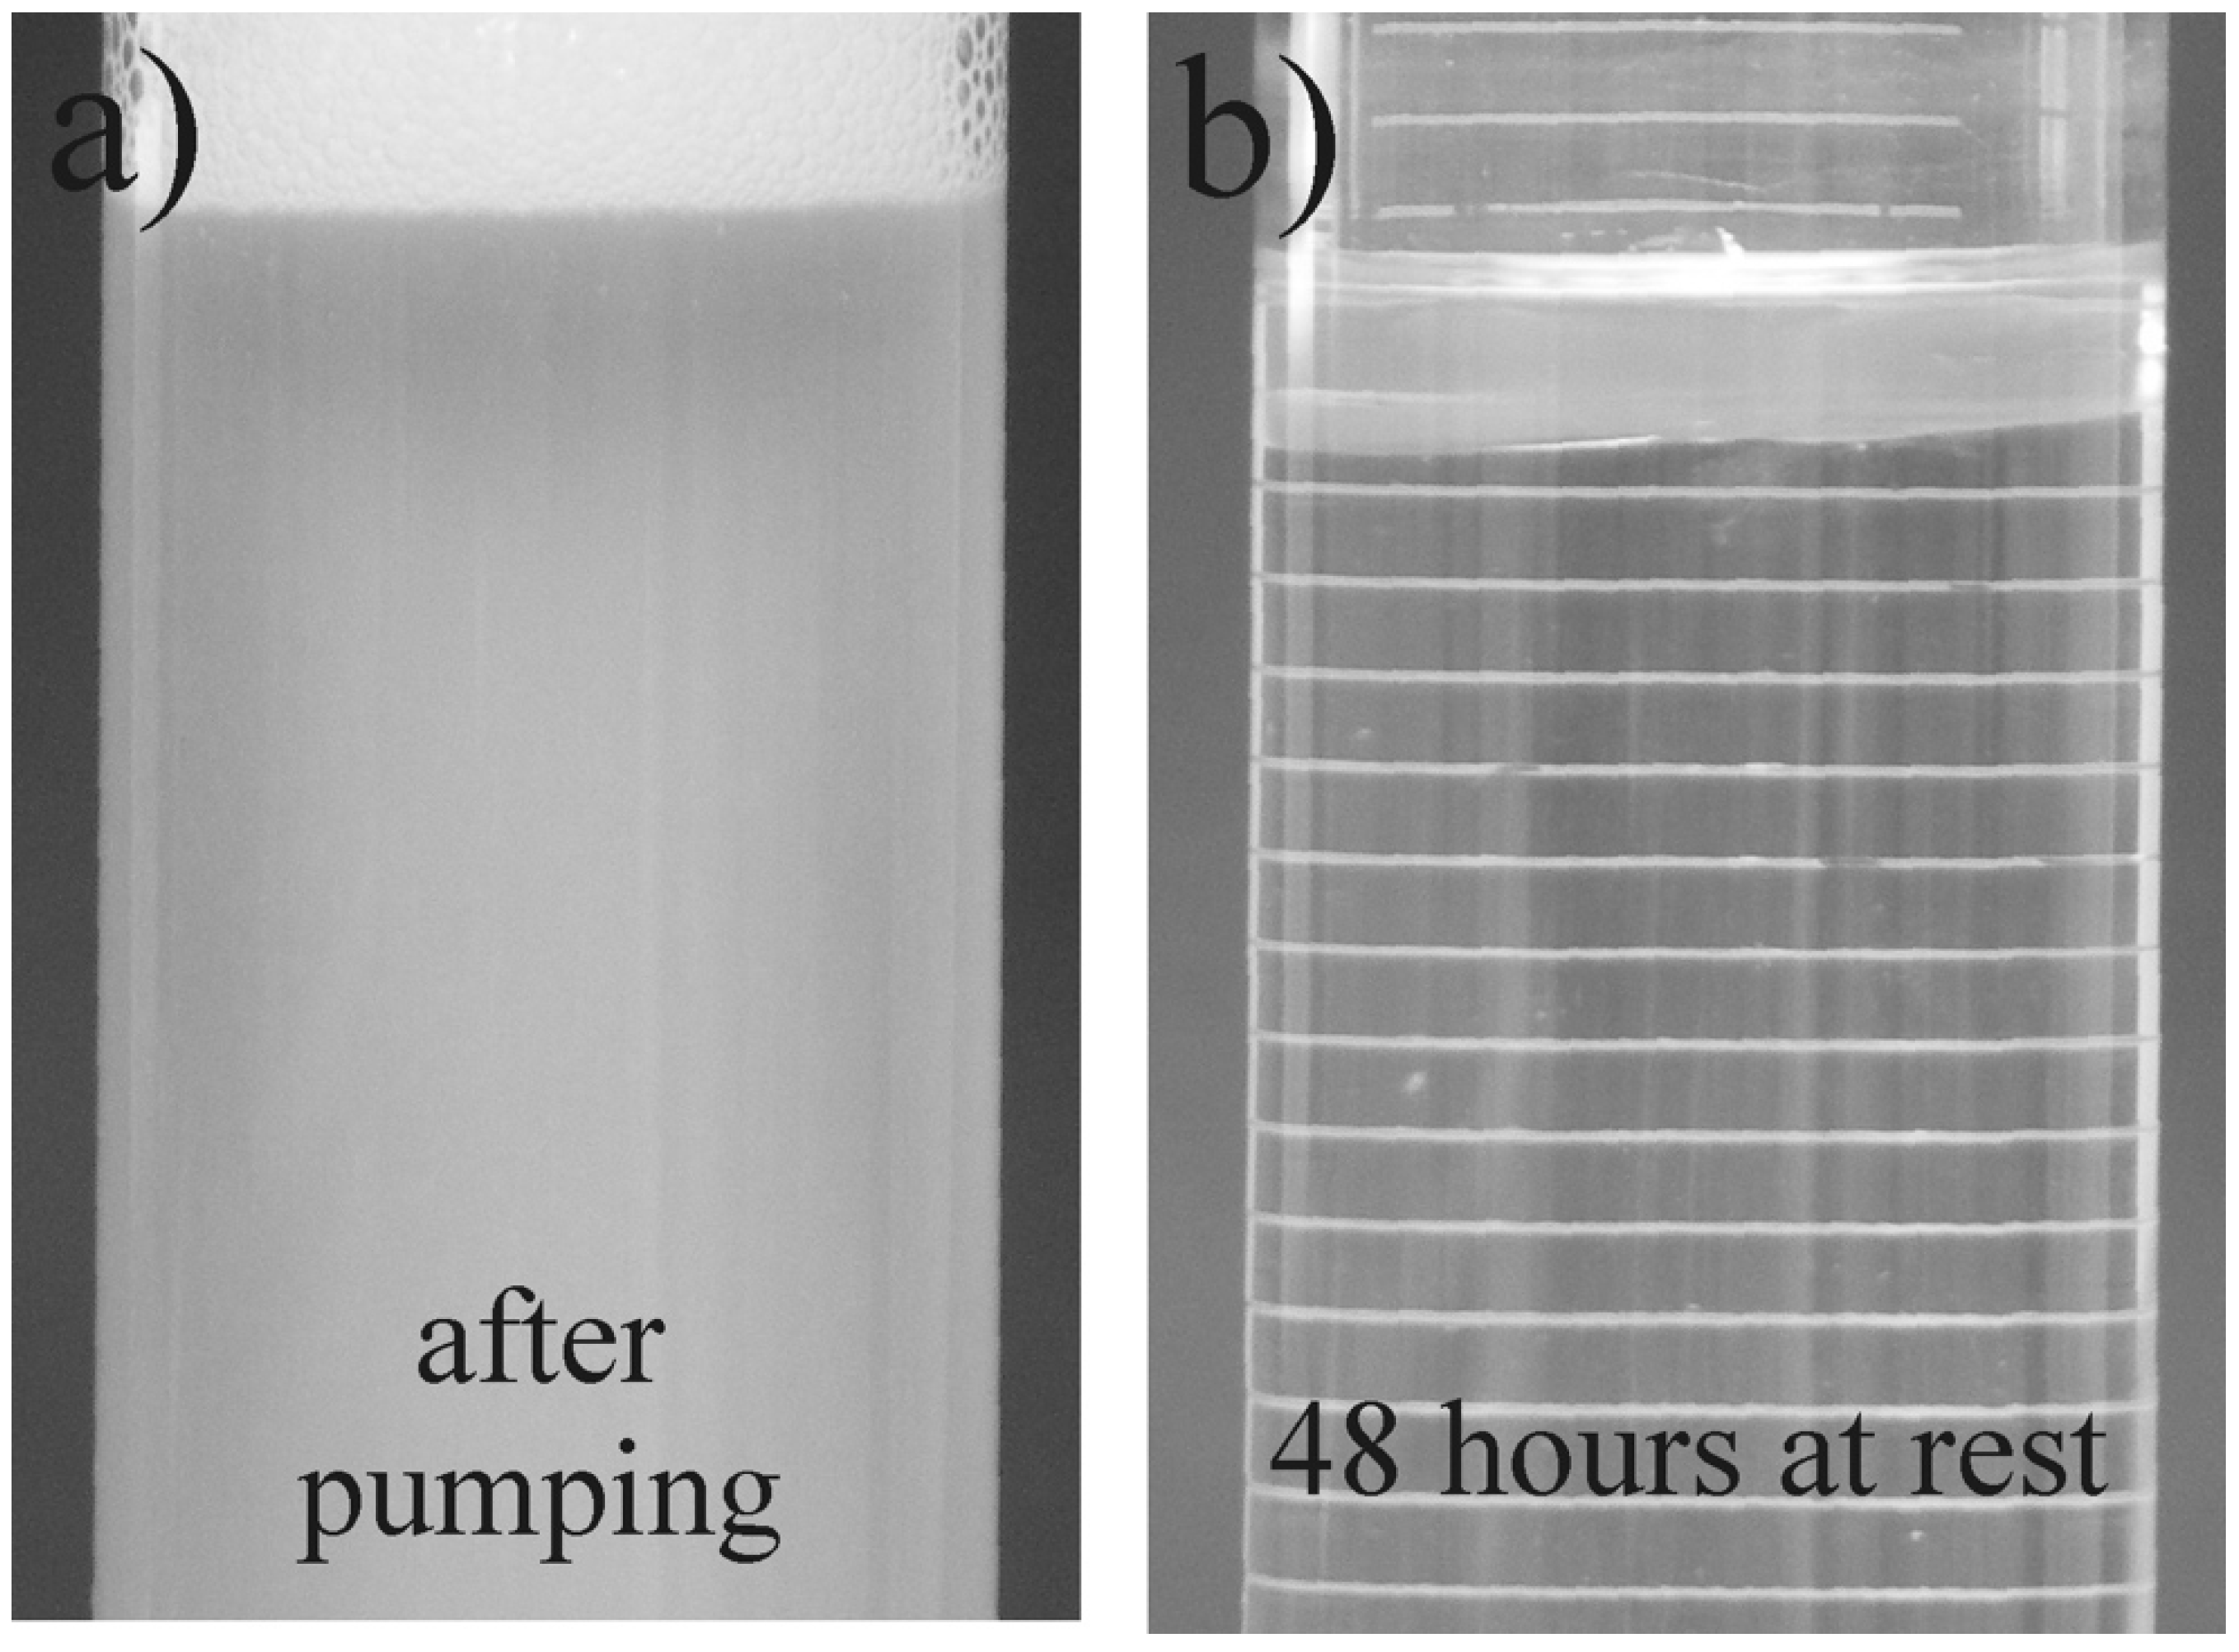
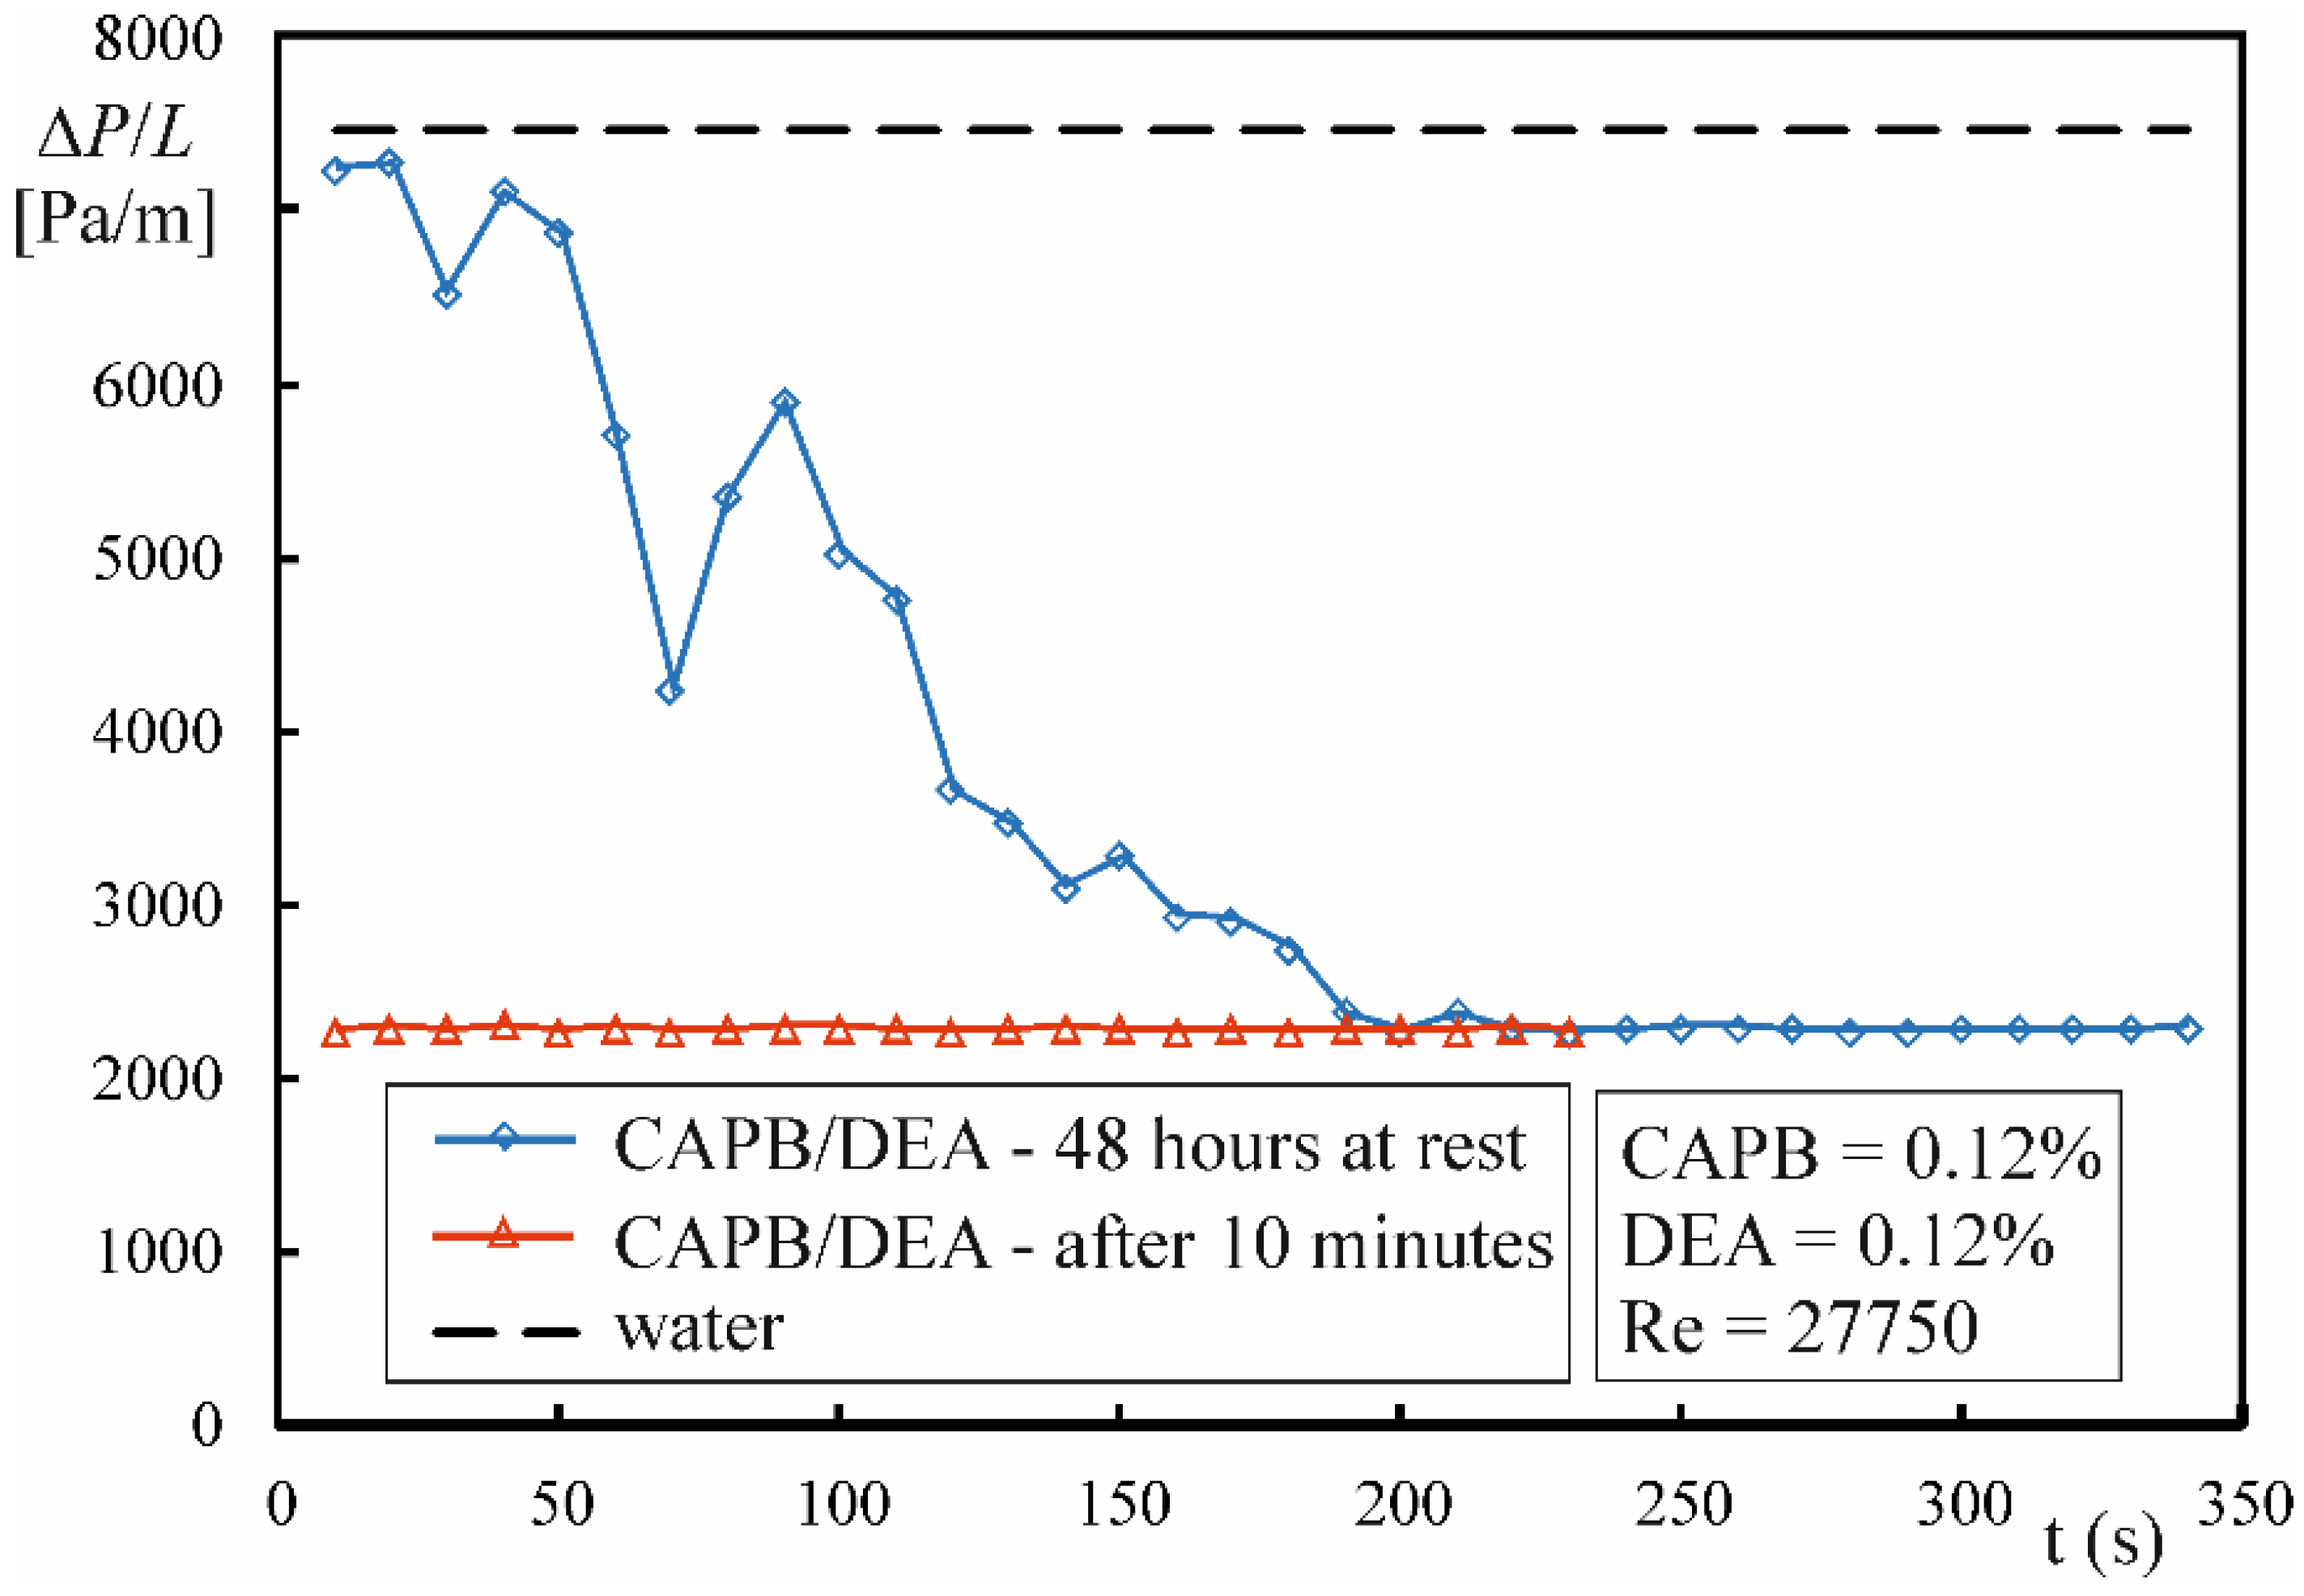
  • The presence of a surfactant-rich disperse phase is a precondition for the emergence of drag reduction during the flow of CAPB/DEA solutions. The critical value of the wall shear stress τw,c0 is most likely responsible for the transformation of solution microstructure during the flow.
  • The lower temperature limit at which drag reduction occurs depends on the CAPB and DEA weight ratio in the solution. However, when the excess of CAPB is too large, it gives rise to an increase in the surface charge of the micelles, leading to their shortening and disappearance of drag reduction.

Supplementary Materials

The following are available online at https://www.mdpi.com/article/10.3390/en14092683/s1, Figure S1: Shear viscosity vs. time for CAPB/DEA solutions with a concentration of 0.12/0.072 wt% and a tempereature 3 °C (a); 10 °C (b) and 25 °C (c), Figure S2: Shear viscosity vs. time for CAPB/DEA solutions with a concentration of 0.12/0.1 wt% and a temperature 3 °C (a); 10 °C (b) and 25 °C (c), Figure S3: Shear viscosity vs. time for CAPB/DEA solutions with a concentration of 0.12/0.12 wt% and a temperaure 3 °C (a); 10 °C (b) and 25 °C (c), Figure S4: Shear viscosity vs. time for CAPB/DEA solutions with a concentration of 0.12/0.88 wt% and a temperature 3 °C (a); 10 °C (b) and 25 °C (c), Figure S5: Comparison of the measurement results of the dependencies of friction coefficient on Reynold number obtained with the experimental set-ups presented in Figure 1a and Figure 1b for CAPB/DEA mixture solutions, Figure S6: Dependence of the friction coefficient on the Reynolds number for single-component solutions of CAPB and DEA.

Author Contributions

Conceptualization and investigations, writing—original draft preparation, J.R.; rheological measurements, review and editing, S.R.; linguistic proofreading, rheological measurements P.T.M.; review and editing, W.S.; pH measurements, P.W.; review and editing, A.F. All authors have read and agreed to the published version of the manuscript.

Funding

This research was funded by the Ministry of Education and Science.

Institutional Review Board Statement

Not applicable.

Informed Consent Statement

Not applicable.

Data Availability Statement

Not applicable.

Conflicts of Interest

The authors declare no conflict of interest.

Nomenclature

Dinner diameter, (m)
DRdrag reduction ratio, (%)
Ldistance between the two pressure taps for ΔP measurements, (m)
ReReynolds number, (UDρ)/η
Ubulk velocity, (m/s)
Greek letters
ΔPpressure drop, (Pa)
λDarcy friction factor
ρfluid density, (kg/m3)
ηshear viscosity, (Pa·s)
τshear stress, (Pa)
τwwall shear stress, (ΔPD)/(4L), (Pa)
γ ˙ shear rate, (s−1)
Subscripts
ccritical
ssurfactant
tturbulent flow

References

  1. Zakin, J.L.; Lu, B.; Bewersdorff, H.W. Surfactant Drag Reduction. Rev. Chem. Eng. 1998, 14, 253–320. [Google Scholar] [CrossRef]
  2. Broniarz-Press, L.; Różański, J.; Różańska, S. Drag Reduction Effect in Pipe Systems and Lquid Falling Film Flow. Rev. Chem. Eng. 2007, 23, 149–245. [Google Scholar] [CrossRef]
  3. Matras, Z.; Malcher, T.; Gzyl-Malcher, B. The Influence of Polymer-Surfactant Aggregates on Drag Reduction. Thin Solid Film 2008, 516, 8848–8851. [Google Scholar] [CrossRef]
  4. Mohsenipour, A.A.; Pal, R. Synergistic Effects of Anionic Surfactant and Nonionic Polymer Additives on Drag Reduction. Chem. Eng. Commun. 2013, 200, 935–958. [Google Scholar] [CrossRef]
  5. Mohsenipour, A.A.; Pal, R. The Role of Surfactants in Mechanical Degradation of Drag-Reducing Polymers. Ind. Eng. Chem. Res. 2013, 52, 1291–1302. [Google Scholar] [CrossRef]
  6. White, A. Flow Characteristics of Complex Soap Systems. Nature 1967, 214, 585–586. [Google Scholar] [CrossRef]
  7. Savins, J.G. A Stress-Controlled Drag-Reduction Phenomenon. Rheol. Acta 1967, 6, 323–367. [Google Scholar] [CrossRef]
  8. Różański, J. Flow of Drag-Reducing Surfactant Solutions in Rough Pipes. J. Non-Newton. Fluid Mech. 2011, 166, 279–288. [Google Scholar] [CrossRef]
  9. Różański, J. Heat Transfer in the Thermal Entrance Region for Drag Reduction Surfactant Solutions in Pipe Flow. Int. J. Heat Mass Transf. 2012, 55, 1113–1125. [Google Scholar]
  10. Lin, Z.; Chou, L.; Lu, B.; Zheng, Y.; Davis, H.T.; Scriven, L.E.; Talmon, Y.; Zakin, J.L. Experimental Studies on Drag Reduction and Rheology of Mixed of Cationic Surfactants with Different Alkyl Chain Lengths. Rheol Acta 2000, 39, 354–359. [Google Scholar] [CrossRef]
  11. Hellsten, M. Drag-Reducing Surfactants. J. Surfactants Deterg. 2002, 5, 65–70. [Google Scholar] [CrossRef]
  12. Zakin, J.L.; Chiang, J.L. Non-Ionic Surfactants as Drag Reducing Additives. Nature 1972, 239, 26–28. [Google Scholar] [CrossRef]
  13. Zakin, J.L.; Lui, H.-L. Variables affecting drag reduction by nonionic surfactant additives. Chem. Eng. Commun. 1983, 23, 77–88. [Google Scholar] [CrossRef]
  14. Hellsten, M.; Harwigsson, I. Use of Alkoxylated Alkanolamide as Friction-Reducing Agent. U.S. Patent No. 5,339,855, 23 August 1994. [Google Scholar]
  15. Gasljevic, K.; Aguilar, G.; Matthys, E.F. On Two Distinct Types of Drag-Reducing Fluids, Diameter Scaling, and Turbulent Profiles. J. Non-Newton. Fluid Mech. 2001, 96, 405–425. [Google Scholar] [CrossRef]
  16. Aguilar, G.; Gasljevic, K.; Matthys, E.F. Asymptotes of Maximum Friction and Heat Transfer Reductions for Drag-Reducing Surfactant Solutions. Int. J. Heat Mass Transf. 2001, 44, 2835–2843. [Google Scholar] [CrossRef]
  17. Usui, H.; Kariyama, H.; Saeki, T.; Sugawara, H.; Wakui, F. Effect of Surfactant Molecular Structure on Turbulent Drag Reduction. Kagaku Kogaku Ronbunshu 1998, 24, 134–137. [Google Scholar] [CrossRef] [Green Version]
  18. Haruki, N.; Inaba, H.; Horibe, A.; Kodama, Y. Flow Resistance and Heat Transfer Characteristics of Organic Brine (Propylene Glycol) Solution by Adding Flow Drag Reduction Additive. Exp. Heat Transf. 2009, 22, 283–299. [Google Scholar] [CrossRef]
  19. Haruki, N.; Inaba, H.; Horibe, A.; Tanaka, S. Viscosity Measurements of Ethylene Glycol Solution with Flow Drag Reduction Additives. Heat Transf. Asian Res. 2006, 35, 553–557. [Google Scholar] [CrossRef]
  20. Tamano, S.; Ikarashi, H.; Morinishi, Y.; Taga, K. Drag Reduction and Degradation of Nonionic Surfactant Solutions with Organic Acid in Turbulent Pipe Flow. J. Non-Newton. Fluid Mech. 2015, 215, 1–7. [Google Scholar] [CrossRef]
  21. Dosunmu, I.T.; Shah, S.N. Turbulent Flow Behavior of Surfactant Solutions in Straight Pipes. J. Petrol Sci. Eng. 2014, 124, 323–330. [Google Scholar] [CrossRef]
  22. Harwigsson, I.; Hellsten, M. Environmentally Acceptable Drag-Reducing Surfactants for District Heating and Cooling. J. Am. Oil Chem. Soc. 1996, 73, 921–928. [Google Scholar] [CrossRef]
  23. Qi, Y.; Kawaguchi, Y.; Christensen, R.N.; Zakin, J.L. Enhancing Heat-Transfer Ability of Drag Reducing Surfactant Solutions with Static Mixer and Honeycombs. Int. J. Heat Mass Transf. 2003, 46, 5161–5173. [Google Scholar] [CrossRef]
  24. Qi, Y.; Kawaguchi, Y.; Lin, Z.; Ewing, M.; Christensen, R.N.; Zakin, J.L. Enhanced Heat Transfer of Drag Reducing Surfactant Solutions with Fluted Tube-in-Tube Heat Exchanger. Int. J. Heat Mass Transf. 2001, 44, 1495–1505. [Google Scholar] [CrossRef]
  25. Myska, J.; Chara, Z. The Effect of Zwitterionic and Cationic Surfactant in Turbulent Flows. Exp. Fluids 2001, 30, 229–236. [Google Scholar] [CrossRef]
  26. Inaba, H.; Aly, W.I.A.; Haruki, N.; Horibe, A. Flow and Heat Transfer Characteristic of Drag Reducing Surfactant Solution in Helically Coiled Pipe. Heat Mass Transf. 2005, 41, 940–952. [Google Scholar] [CrossRef]
  27. Aly, W.I.A.; Inaba, H.; Haruki, N.; Horibe, A. Drag and Heat Transfer Reduction Phenomena of Drag-Reducing Surfactant Solutions in Straight and Helical Pipes. J. Heat Transf. 2006, 128, 800–810. [Google Scholar] [CrossRef]
  28. Cho, S.-H.; Tae, C.-S.; Zaheeruddin, M. Effect of Fluid Velocity, Temperature, and Concentration of Non-Ionic Surfactants on Drag Reduction. Energy Convers. Manag. 2007, 48, 913–918. [Google Scholar] [CrossRef]
  29. Różański, J. Pressure Loss and Heat Transfer during the Flow of Surfactant Solutions. Habilitation Dissertation, Poznan University of Technology, Poznan, Poland, 2015. [Google Scholar]
  30. Keera, S.T.; Deyab, M.A. Effect of Some Organic Surfactants on the Electrochemical Behaviour of Carbon Steel in Formation Water. Coll. Surf. A Physicochem Eng. Asp. 2005, 266, 129–140. [Google Scholar] [CrossRef]
  31. Mukherjee, P.; Padhan, S.K.; Dash, S.; Patel, S.; Mishra, B.K. Clouding Behaviour in Surfactant Systems. Adv. Coll. Interf. Sci. 2011, 162, 59–79. [Google Scholar] [CrossRef]
  32. Hu, Y.; Matthys, E.F. Rheological and Rheo-Optical Characterization of Shear-Induced Structure Formation in a Nonionic Drag-Reducing Surfactant Solution. J. Rheol. 1997, 41, 151–166. [Google Scholar] [CrossRef]
  33. Qi, Y.; Zakin, J.L. Chemical and Rheological Characterization of Drag-Reducing Cationic Surfactant Systems. Ind. Eng. Chem. Res. 2002, 41, 6326–6336. [Google Scholar] [CrossRef]
  34. Lerouge, S.; Berret, J.F. Shear-Induced Transitions and Instabilities in Surfactant Wormlike Micelles. Adv. Polym. Sci. 2010, 230, 1–71. [Google Scholar]
  35. Gasljevic, K.; Matthys, E.F. Friction and Heat Transfer in Drag-Reducing Surfactant Solution Flow Through Curved Pipes and Elbows. Eur. J. Mech. B/Fluids 2009, 28, 641–650. [Google Scholar] [CrossRef]
  36. Tuan, N.A.; Mizunuma, H. High-Shear Drag Reduction of Surfactant Solutions. J. Non-Newton. Fluid Mech. 2013, 198, 71–77. [Google Scholar] [CrossRef]
  37. Gasljevic, K.; Hoyer, K.; Matthys, E.F. Temporary Degradation and Recovery of Drag-Reducing Surfactant Solutions. J. Rheol. 2007, 51, 645–667. [Google Scholar] [CrossRef]
  38. Virk, P.S.; Mickley, H.S.; Smith, K.A. The Ultimate Asymptote and Mean Flow Structure in Toms Phenomenon. J. Appl. Mech. 1970, 37, 488–493. [Google Scholar] [CrossRef]
  39. Zakin, J.L.; Myska, J.; Chara, Z. New Limiting Drag Reduction and Velocity Profile Asymptotes for Nonpolymeric Additives Systems. AIChE J. 1996, 42, 3544–3546. [Google Scholar] [CrossRef]
  40. Broniarz-Press, L.; Różański, J. Region of Maximal Drag Reduction in Flow of Surfactant Solutions. Chem. Proc. Eng. 2004, 28, 733–738. [Google Scholar]
  41. Tamano, S.; Itoh, M.; Kato, K.; Kokota, K. Turbulent Drag Reduction in Nonionic Surfactant Solutions. Phys. Fluids 2010, 22, 055102–055112. [Google Scholar] [CrossRef]
  42. Virk, P.S.; Wagger, D.L. Aspects of Mechanisms in Type B Drag Reduction. In Structure of Turbulence and Drag Reduction; Gyr, A., Ed.; IUTAM Symposium: Zurich, Switzerland, 1989; pp. 202–215. [Google Scholar]
  43. MacKintosh, F.C.; Safran, S.A.; Pincus, P.A. Self-Assembly of Linear Aggregates: The Effect on Electrostatics on Growth. Europhys. Lett. 1990, 12, 697–702. [Google Scholar] [CrossRef] [Green Version]
Figure 1. Experimental apparatus working in the temperature range from 20 to 45 °C (a) and from 0 to 20 °C (b).
Energies 14 02683 g001
Figure 2. Viscosity curves for aqueous solutions of CAPB/DEA (CAPB = 0.12 wt%) at a concentration of DEA 0.072 wt% (a), 0.088 wt% (b), 0.1 wt% (c) and 0.12 wt% (d).
Energies 14 02683 g002
Figure 3. Friction factor versus solvent Reynolds number for CAPB/DEA solutions (0.09%/0.075%; D = 11.1 mm) in the range of temperature from 3 to 15 °C (a) and from 20 to 45 °C (b).
Energies 14 02683 g003aEnergies 14 02683 g003b
Figure 4. The effect of DEA concentration on the course of λ = f(Re).
Energies 14 02683 g004
Figure 5. The effect of total CAPB/DEA concentration on the course of λ = f(Re).
Energies 14 02683 g005
Figure 6. Friction factor for four pipe diameters (8.1, 11.1, 16.4 and 24.99 mm) as a function of apparent Reynolds number for a CAPB/DEA solution.
Energies 14 02683 g006
Figure 7. Image of CAPB/DEA solution, directly after sampling from the experimental set-up (a) and after 48 h (b).
Energies 14 02683 g007
Figure 8. Pressure losses as a function of time for CAPB/DEA solution.
Energies 14 02683 g008
Figure 9. The effect of DEA concentration on DR parameter at 3 °C (a) and 10 °C (b).
Energies 14 02683 g009
Table 1. Pipe dimensions.
Inner Diameter (mm)Pipe Length (mm)Length of Developing
Region (mm)
Length of Measuring
Region (mm)
8.140005003000
11.140009002600
16.440009002600
16.4495613533300
Table 2. Cloud points for CAPB/DEA solutions.
CAPB (wt%)DEA (wt%)CP (°C)
0.090.0759
0.120.07224
0.120.08817
0.120.1004
0.120.120Entire range of temperature changes
Table 3. Values of Rec,0 and τw,c0 for different DEA concentrations (CAPB = 0.12 wt%; T = 25 °C).
DEA (wt%)Rec,0τw,c0 (Pa)Rec,Iτw,cI (Pa)
0.07240500.5774,60021.88
0.08840500.56--
0.10043800.65--
0.12088602.6767,73026.44
Table 4. Values of Rec,0 and τw,c0 for pipes of different diameters (CAPB/DEA = 0.09%/0.075%; T = 30 °C).
D8.1 (mm)11.1 (mm)16.4 (mm)24.99 (mm)
T (°C)Rec,0τw,c0 (Pa)Rec,0τw,c0 (Pa)Rec,0τw,c0 (Pa)Rec,0τw,c0 (Pa)
3047431.1278521.2997210.93155650.91
Publisher’s Note: MDPI stays neutral with regard to jurisdictional claims in published maps and institutional affiliations.

