
Detection of Kidney Complications Relevant Concentrations of Ammonia Gas Using Plasmonic Biosensors: A Review
 ,
,  ,
,  ,
,  , ,
, , 
Abstract
:1. Introduction
2. Principles of Plasmonic Biosensors
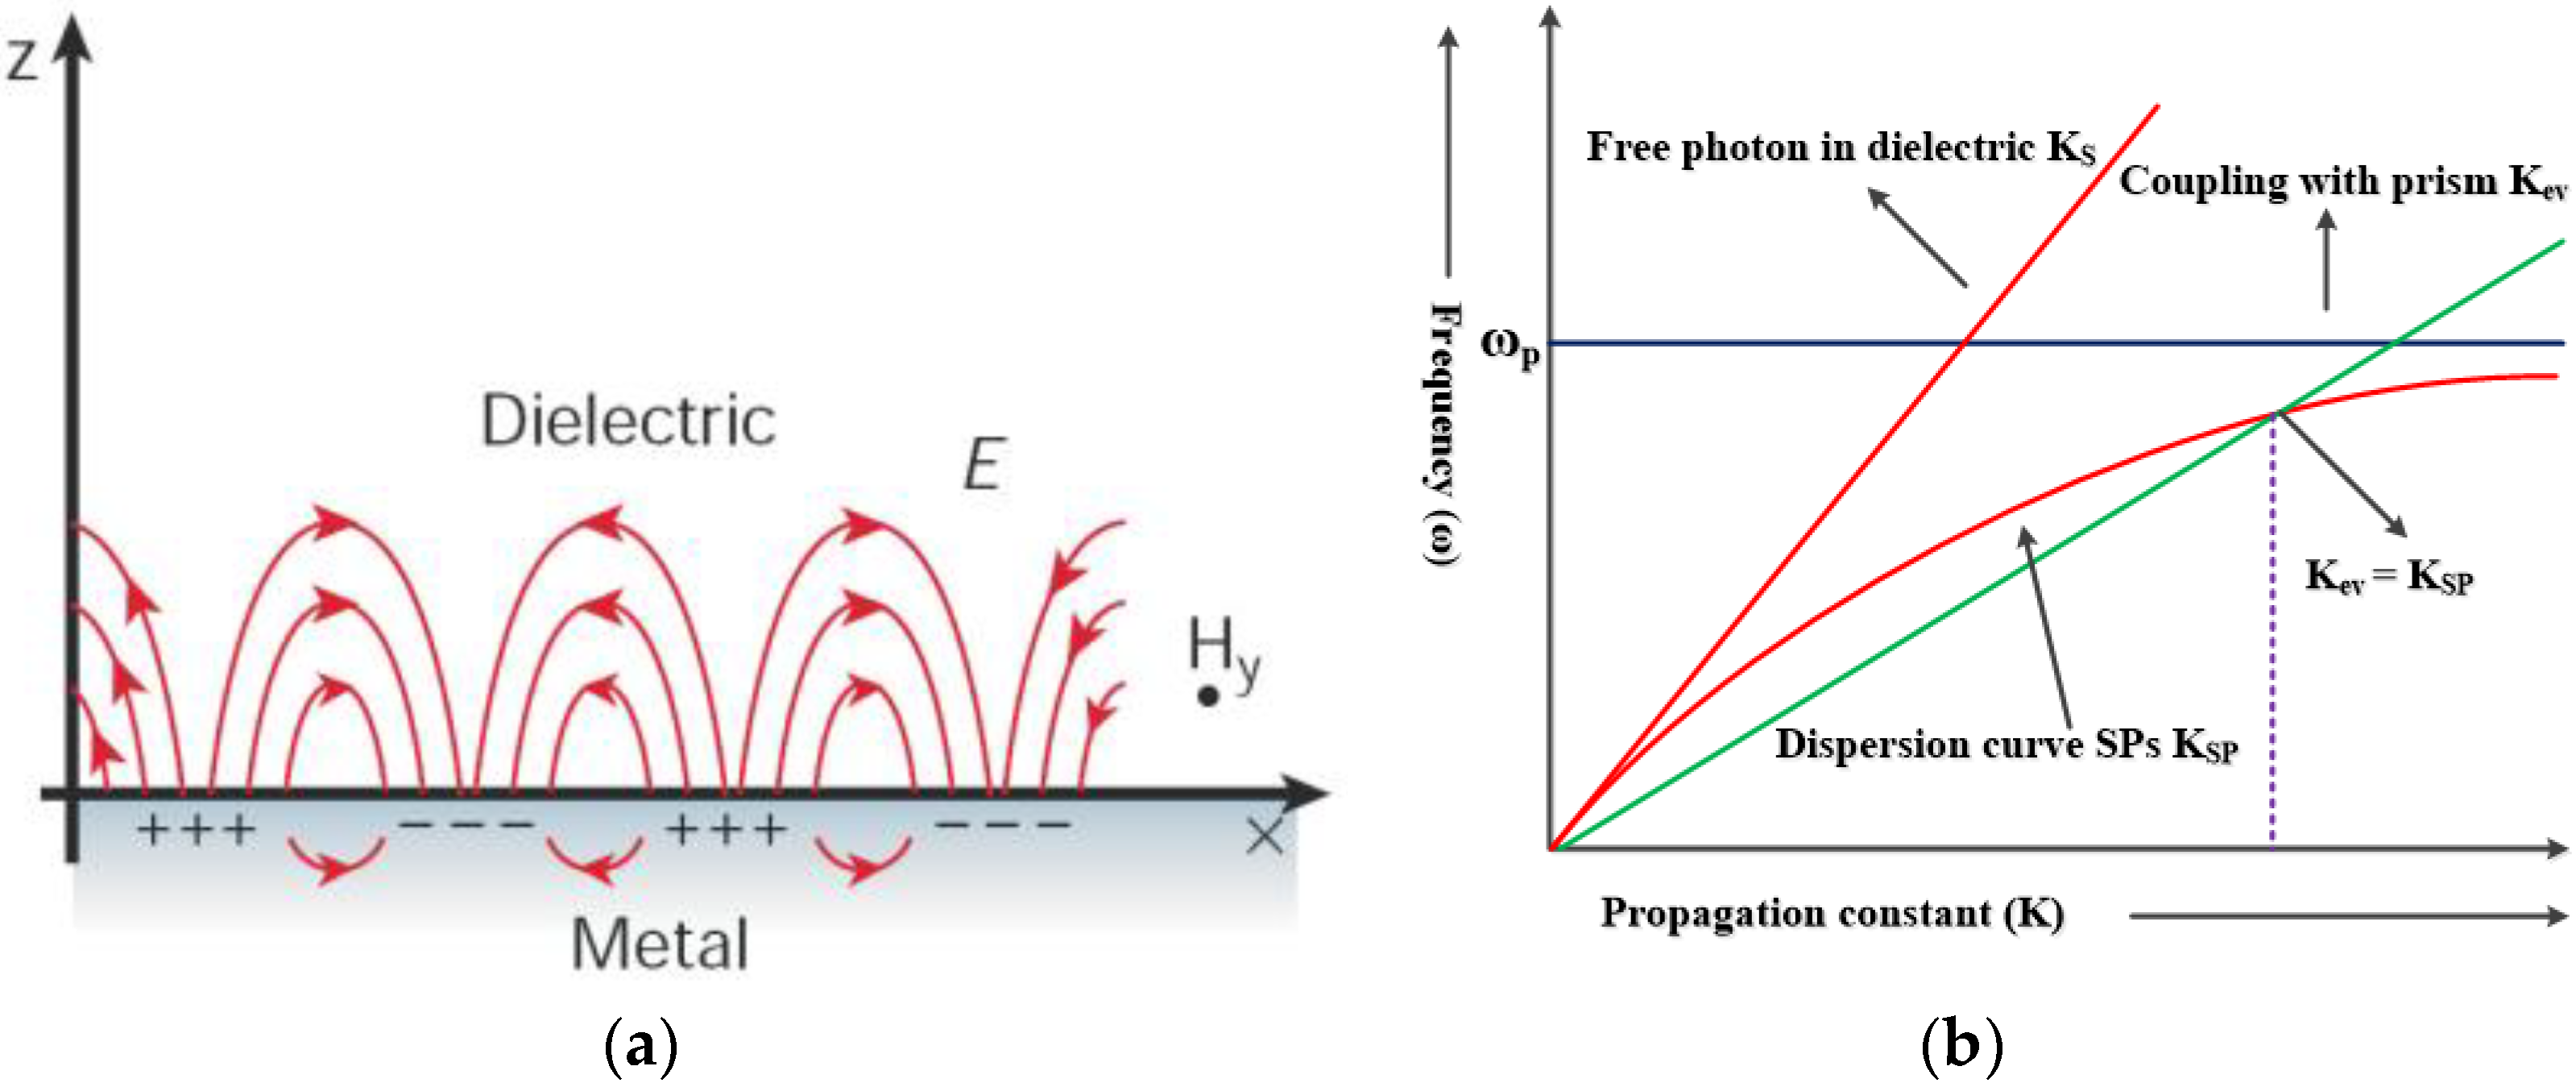
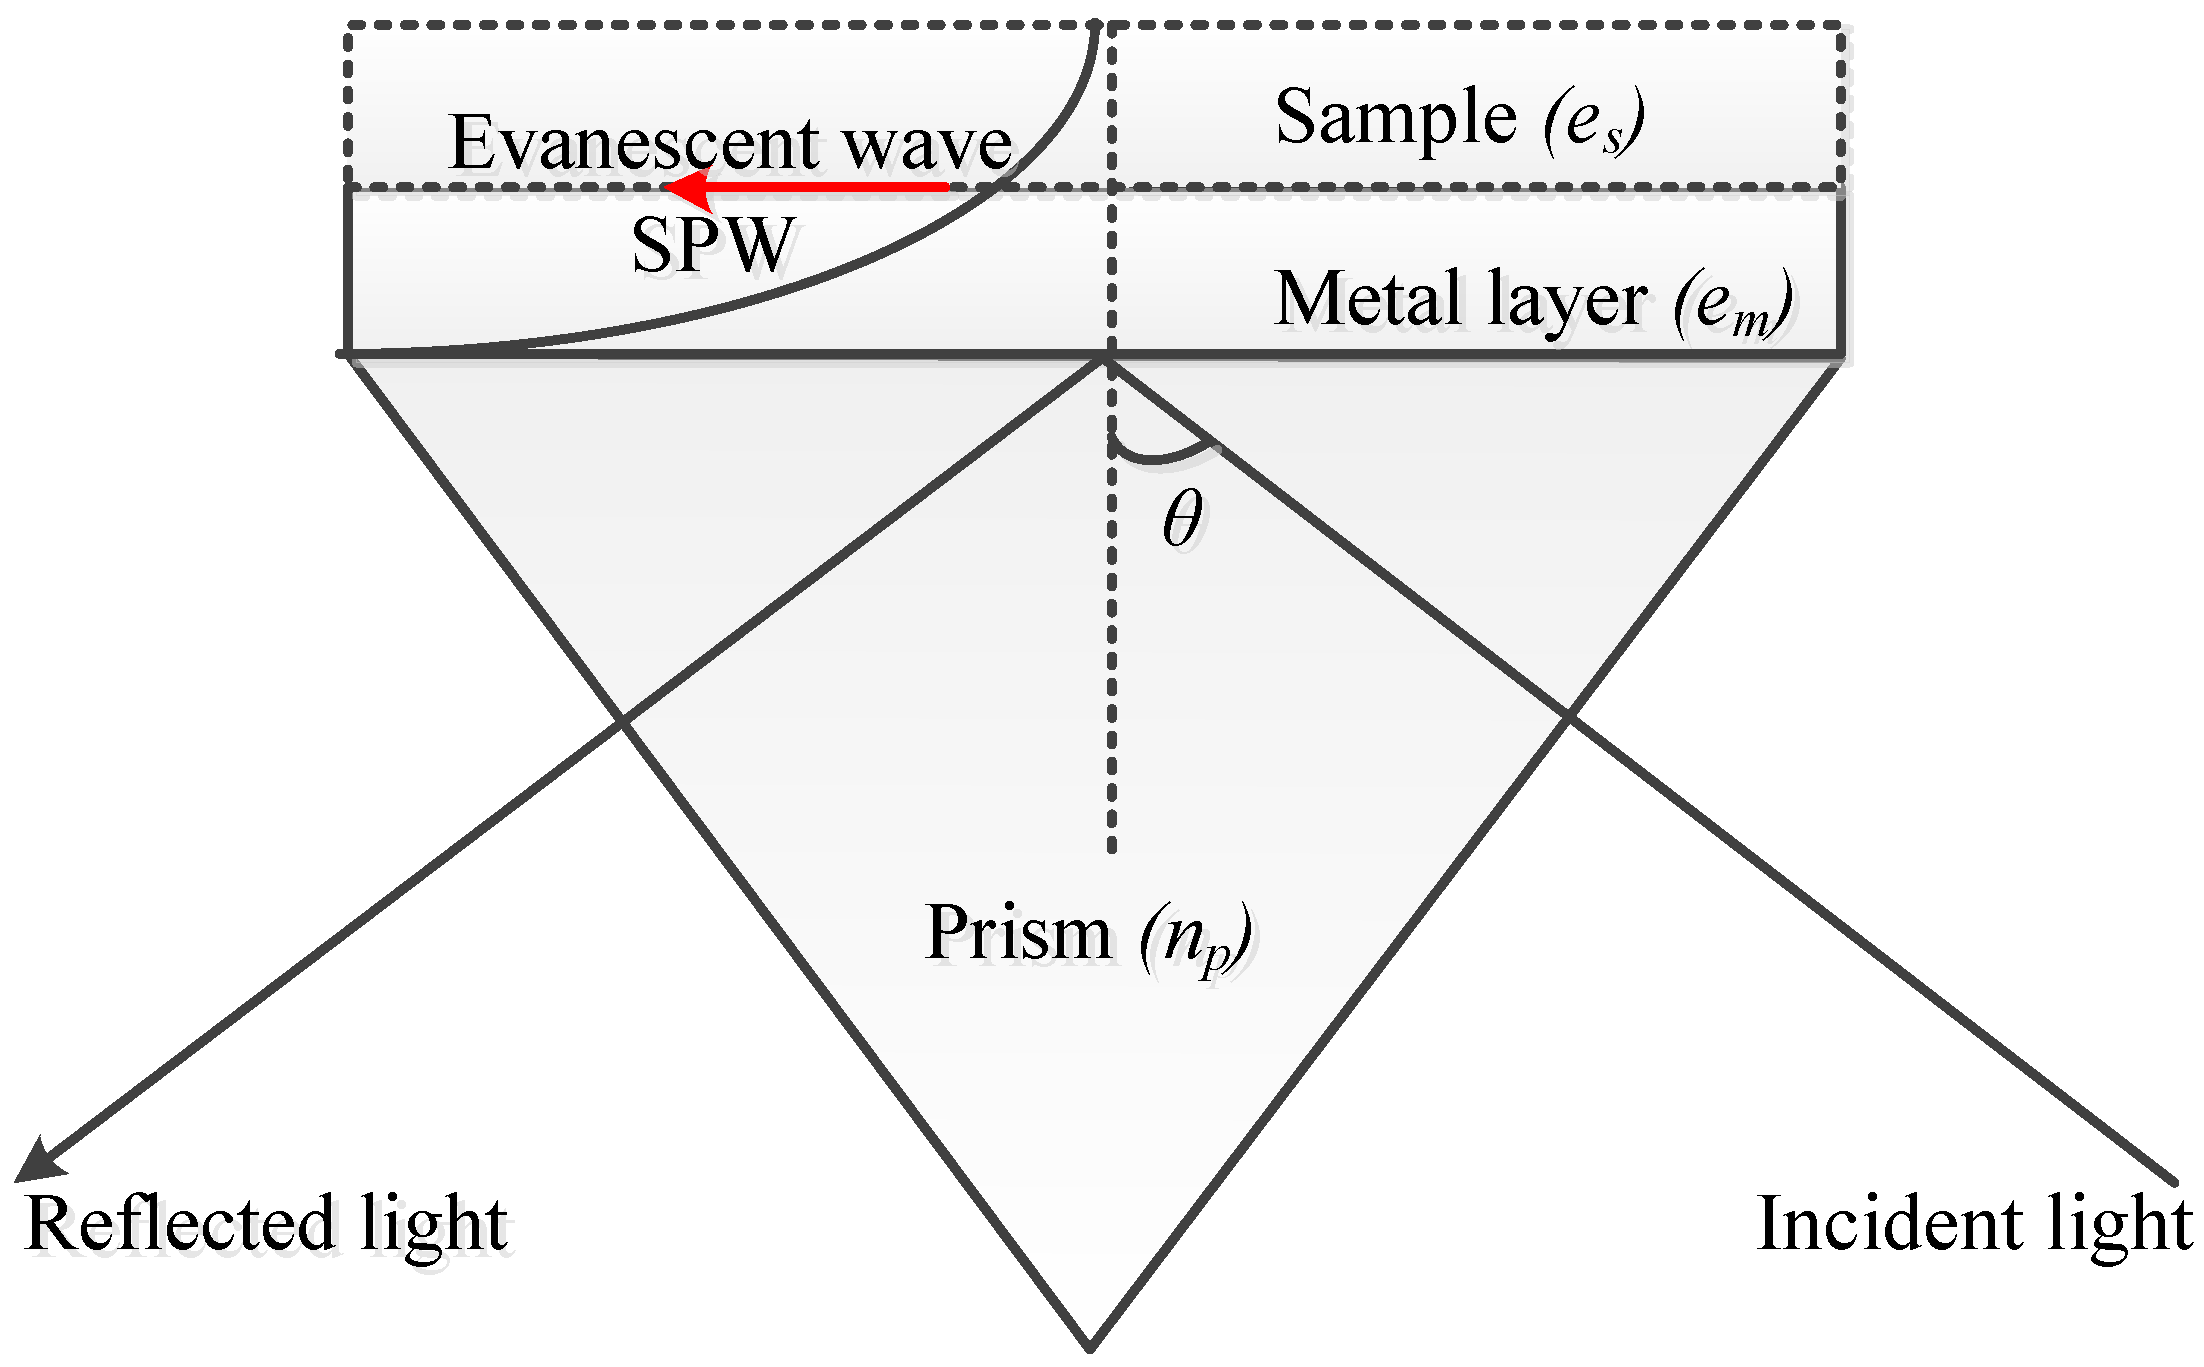
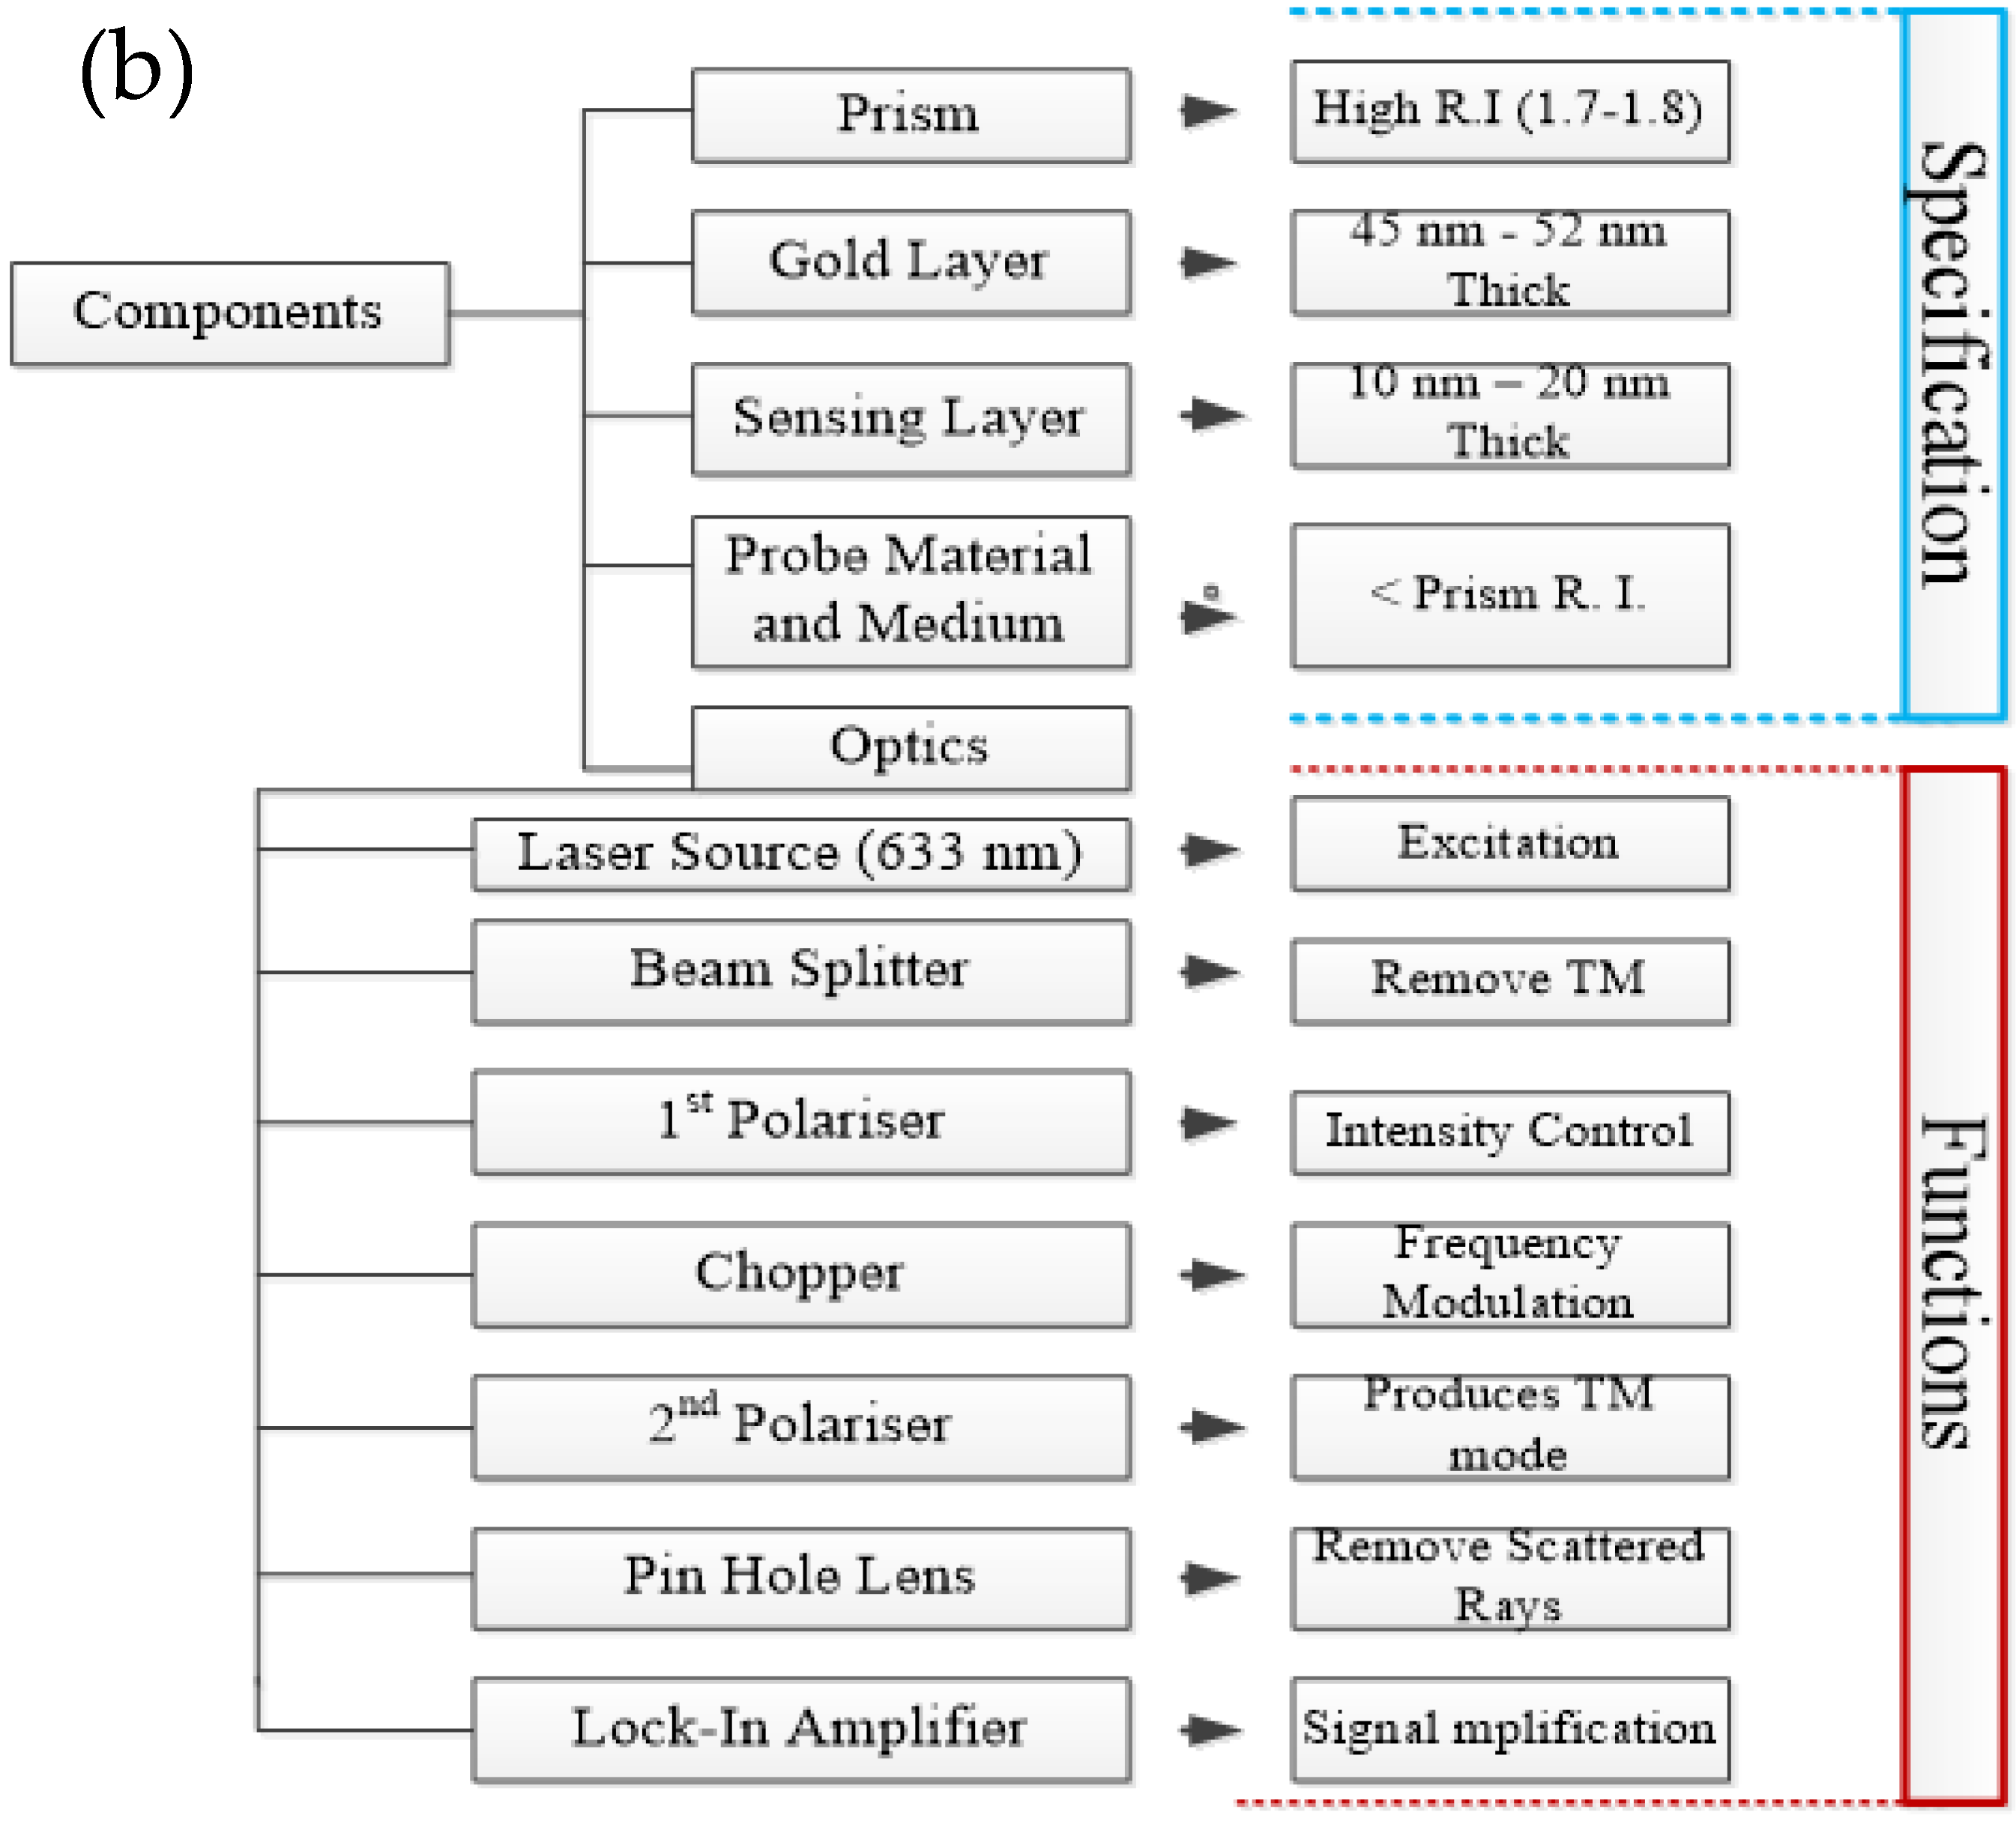
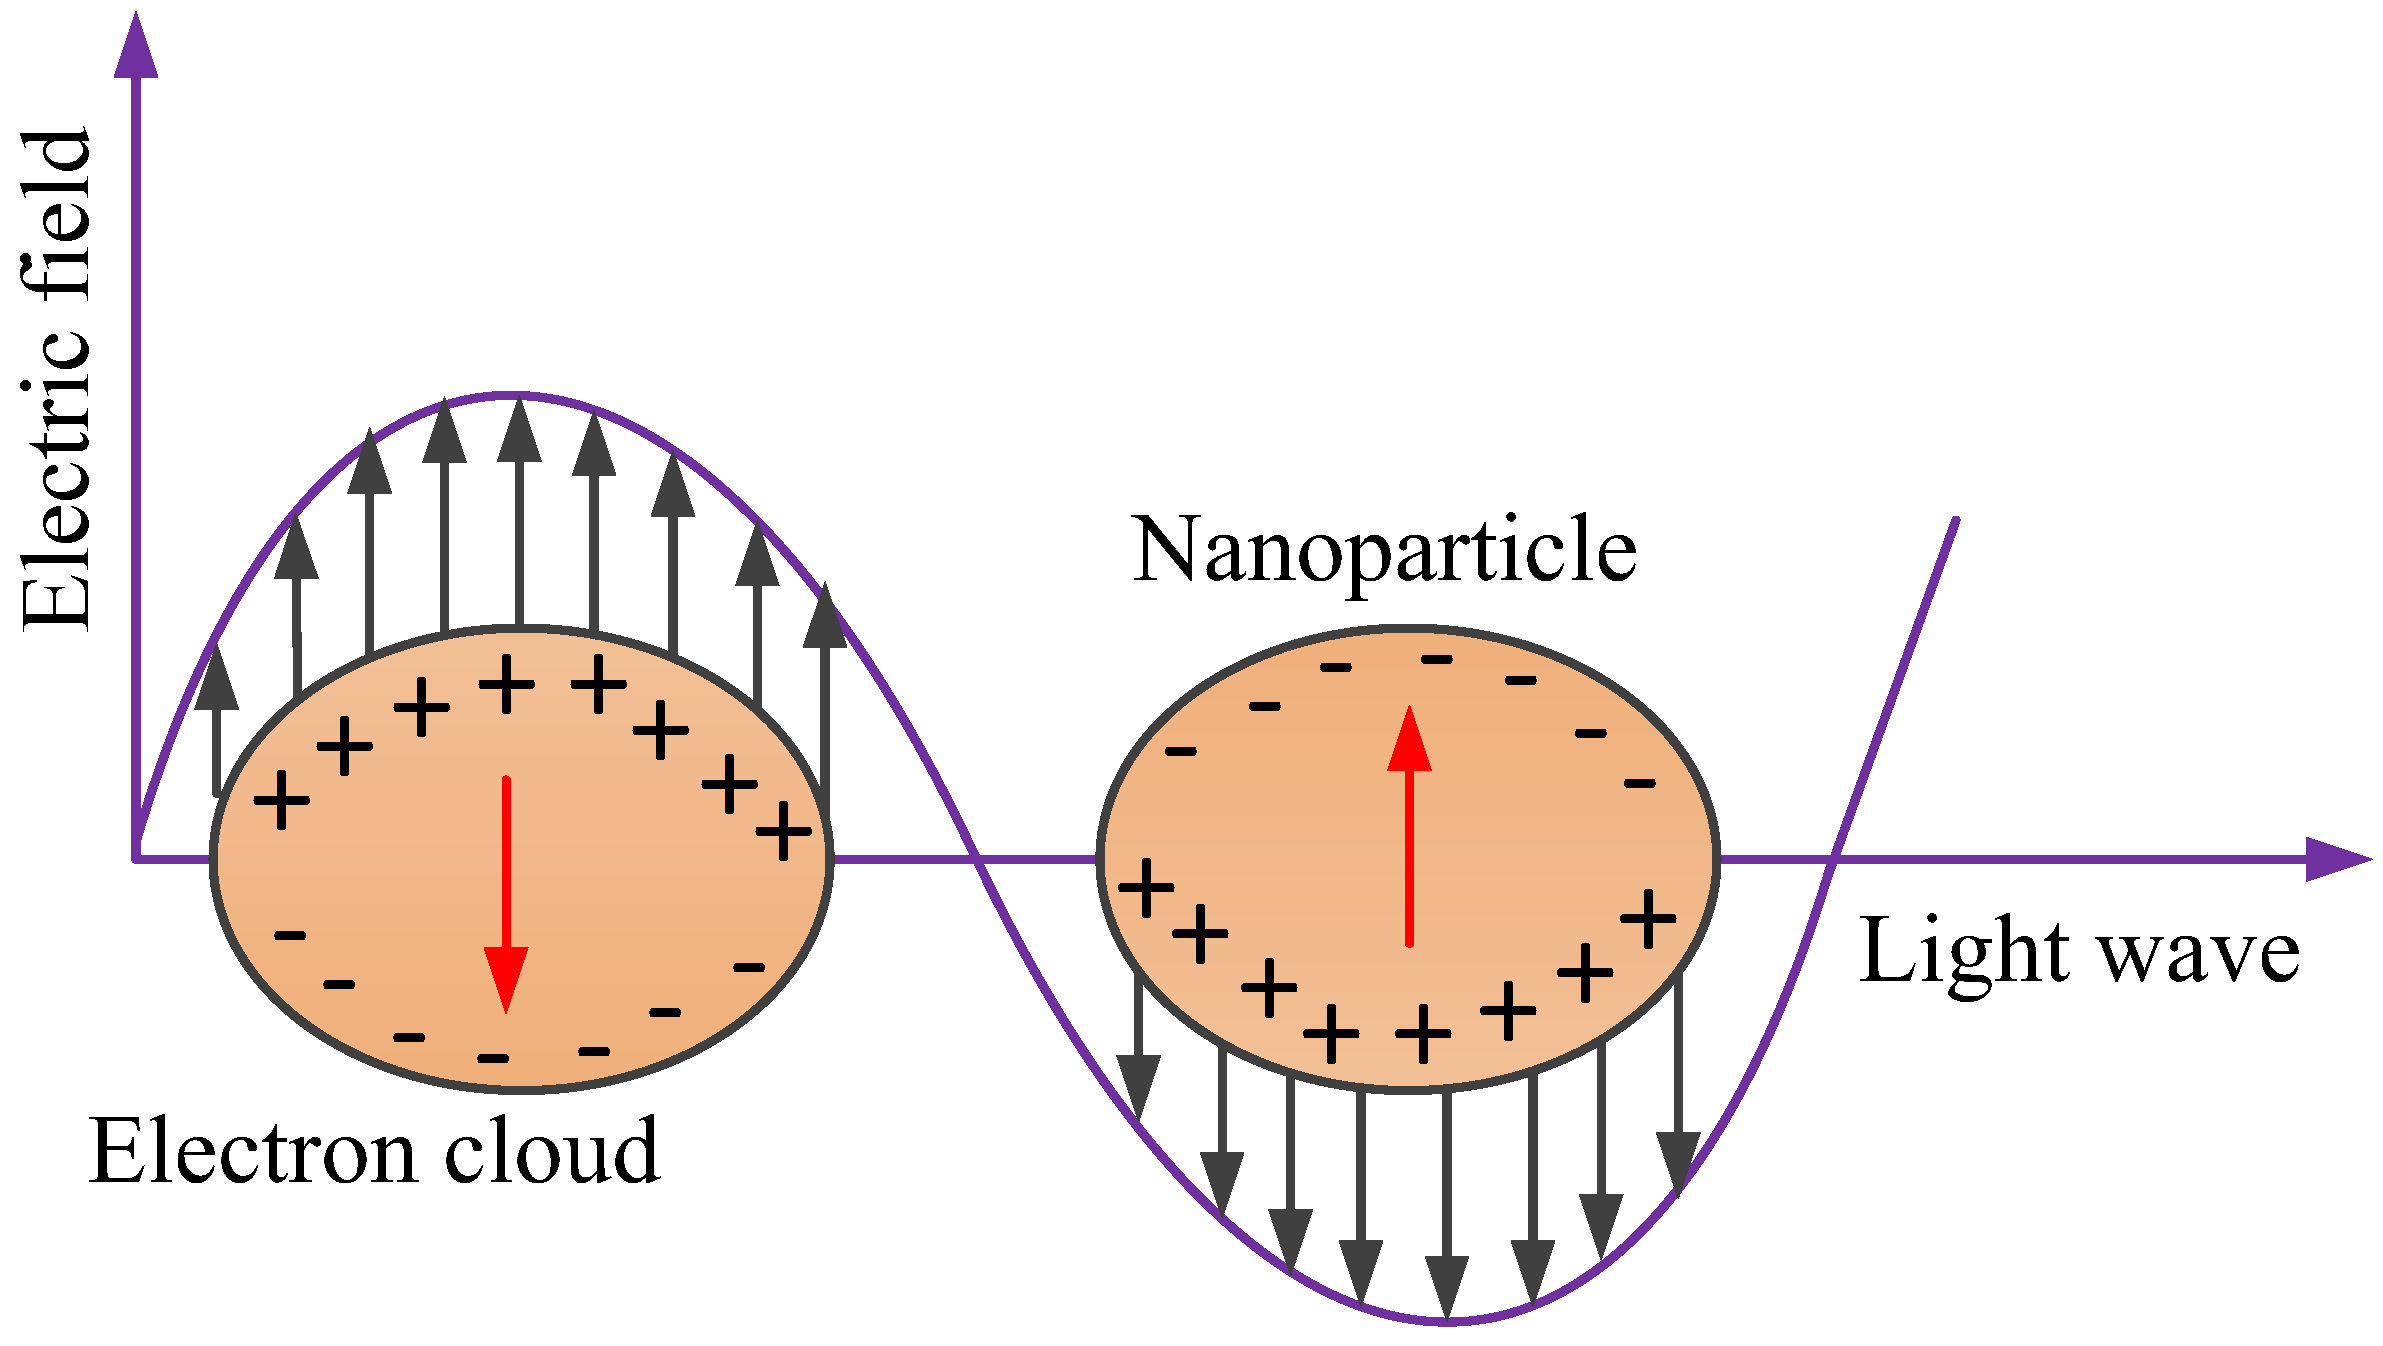
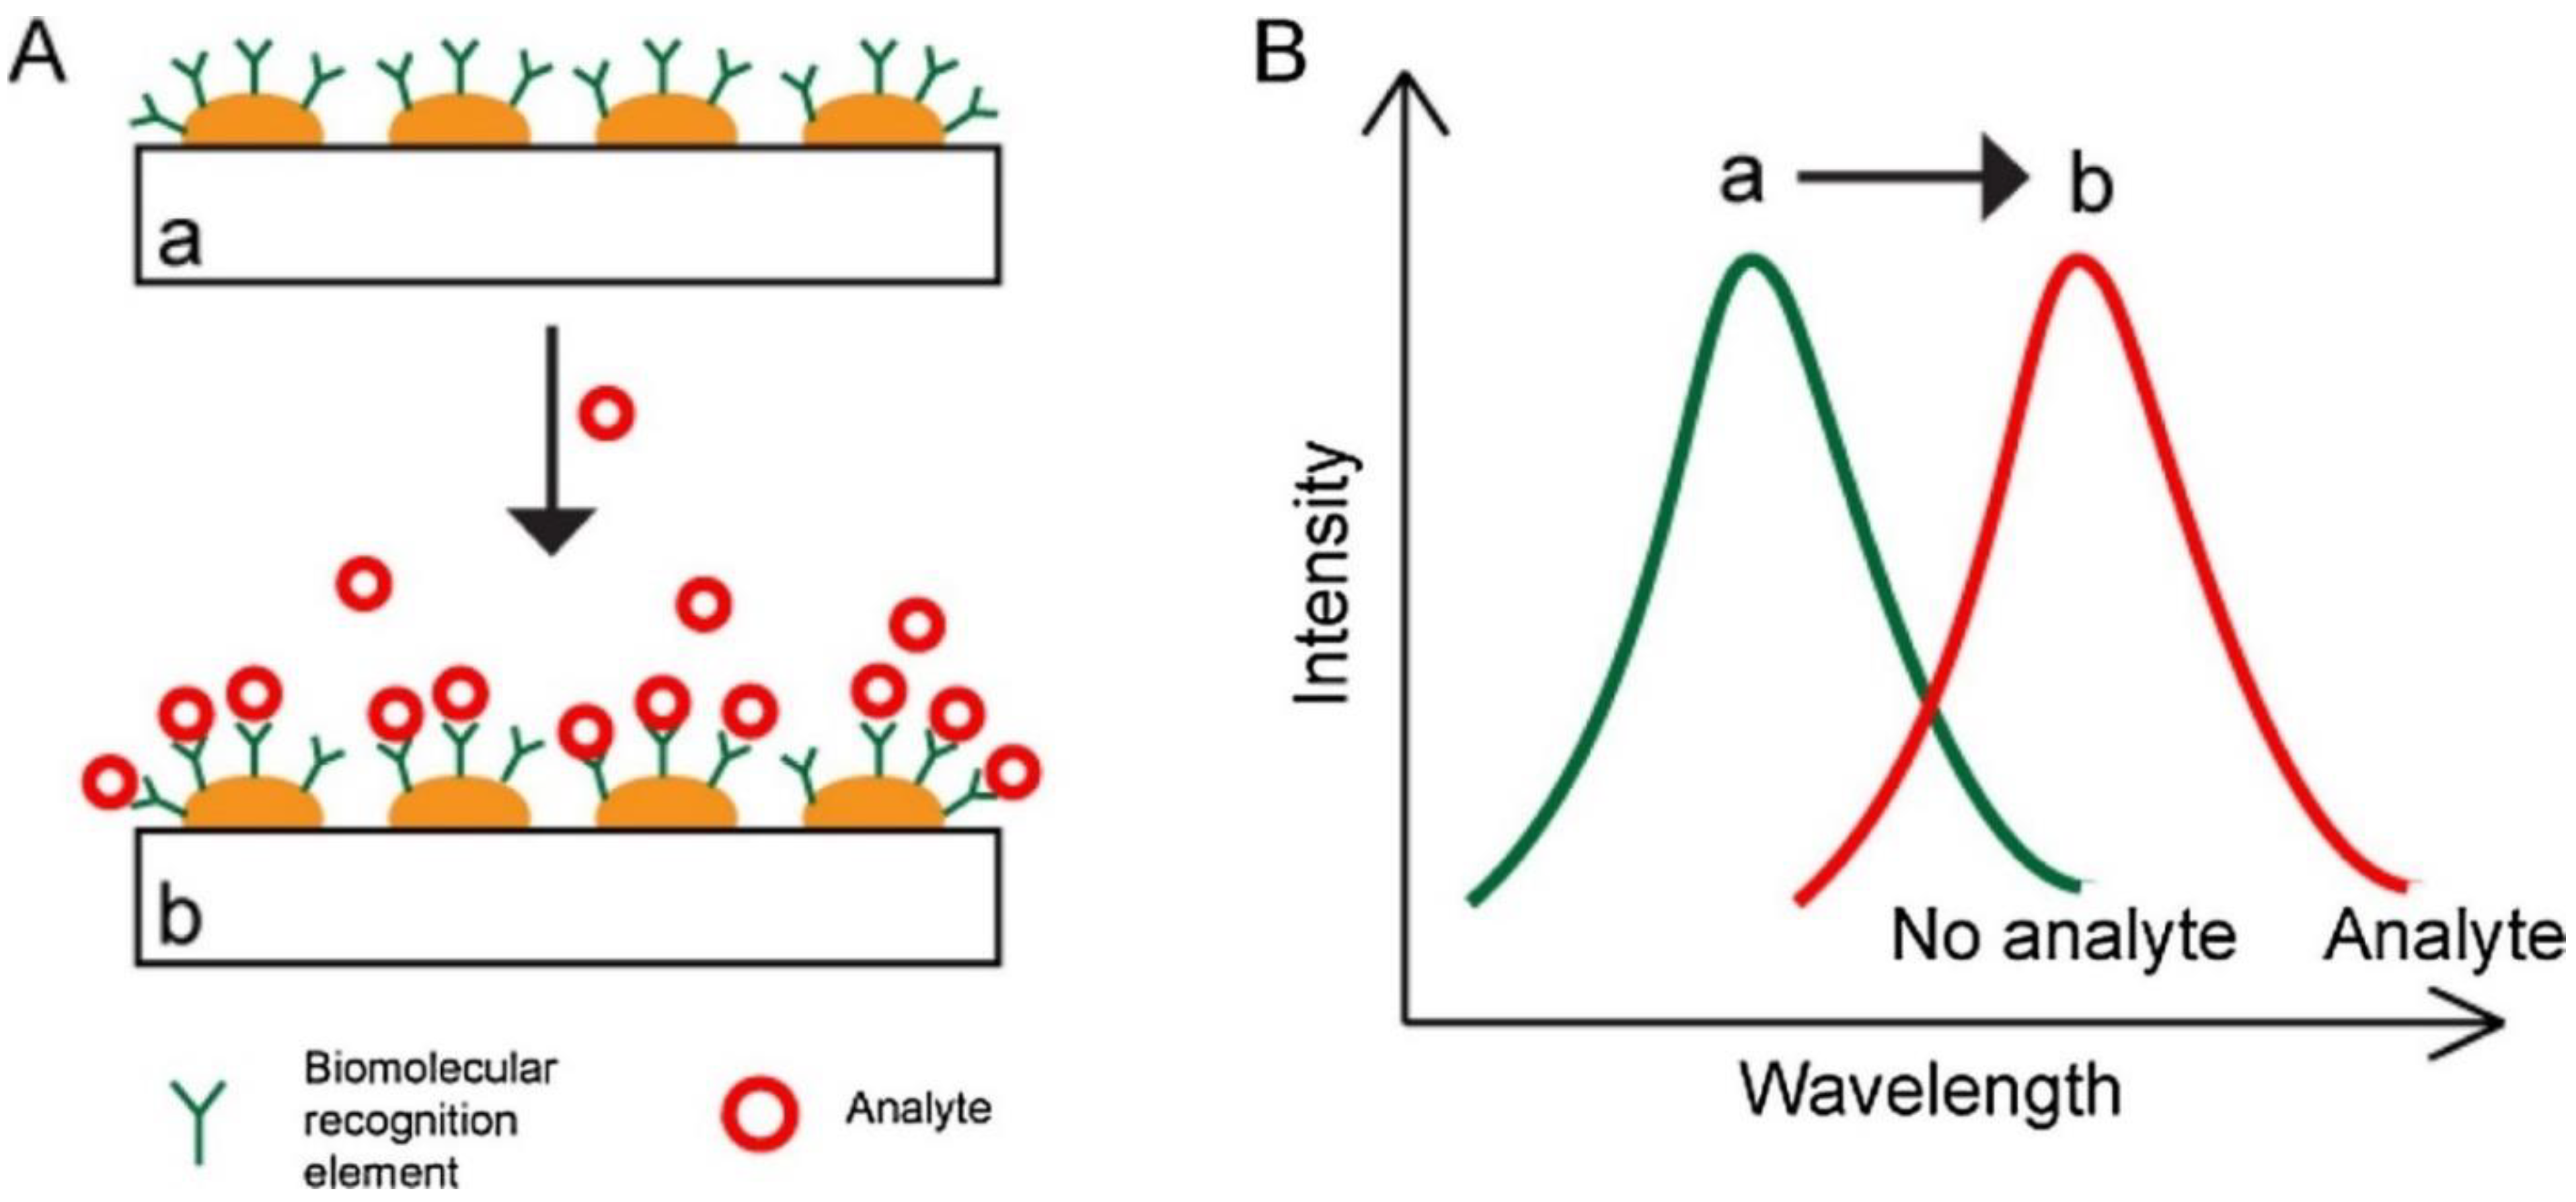
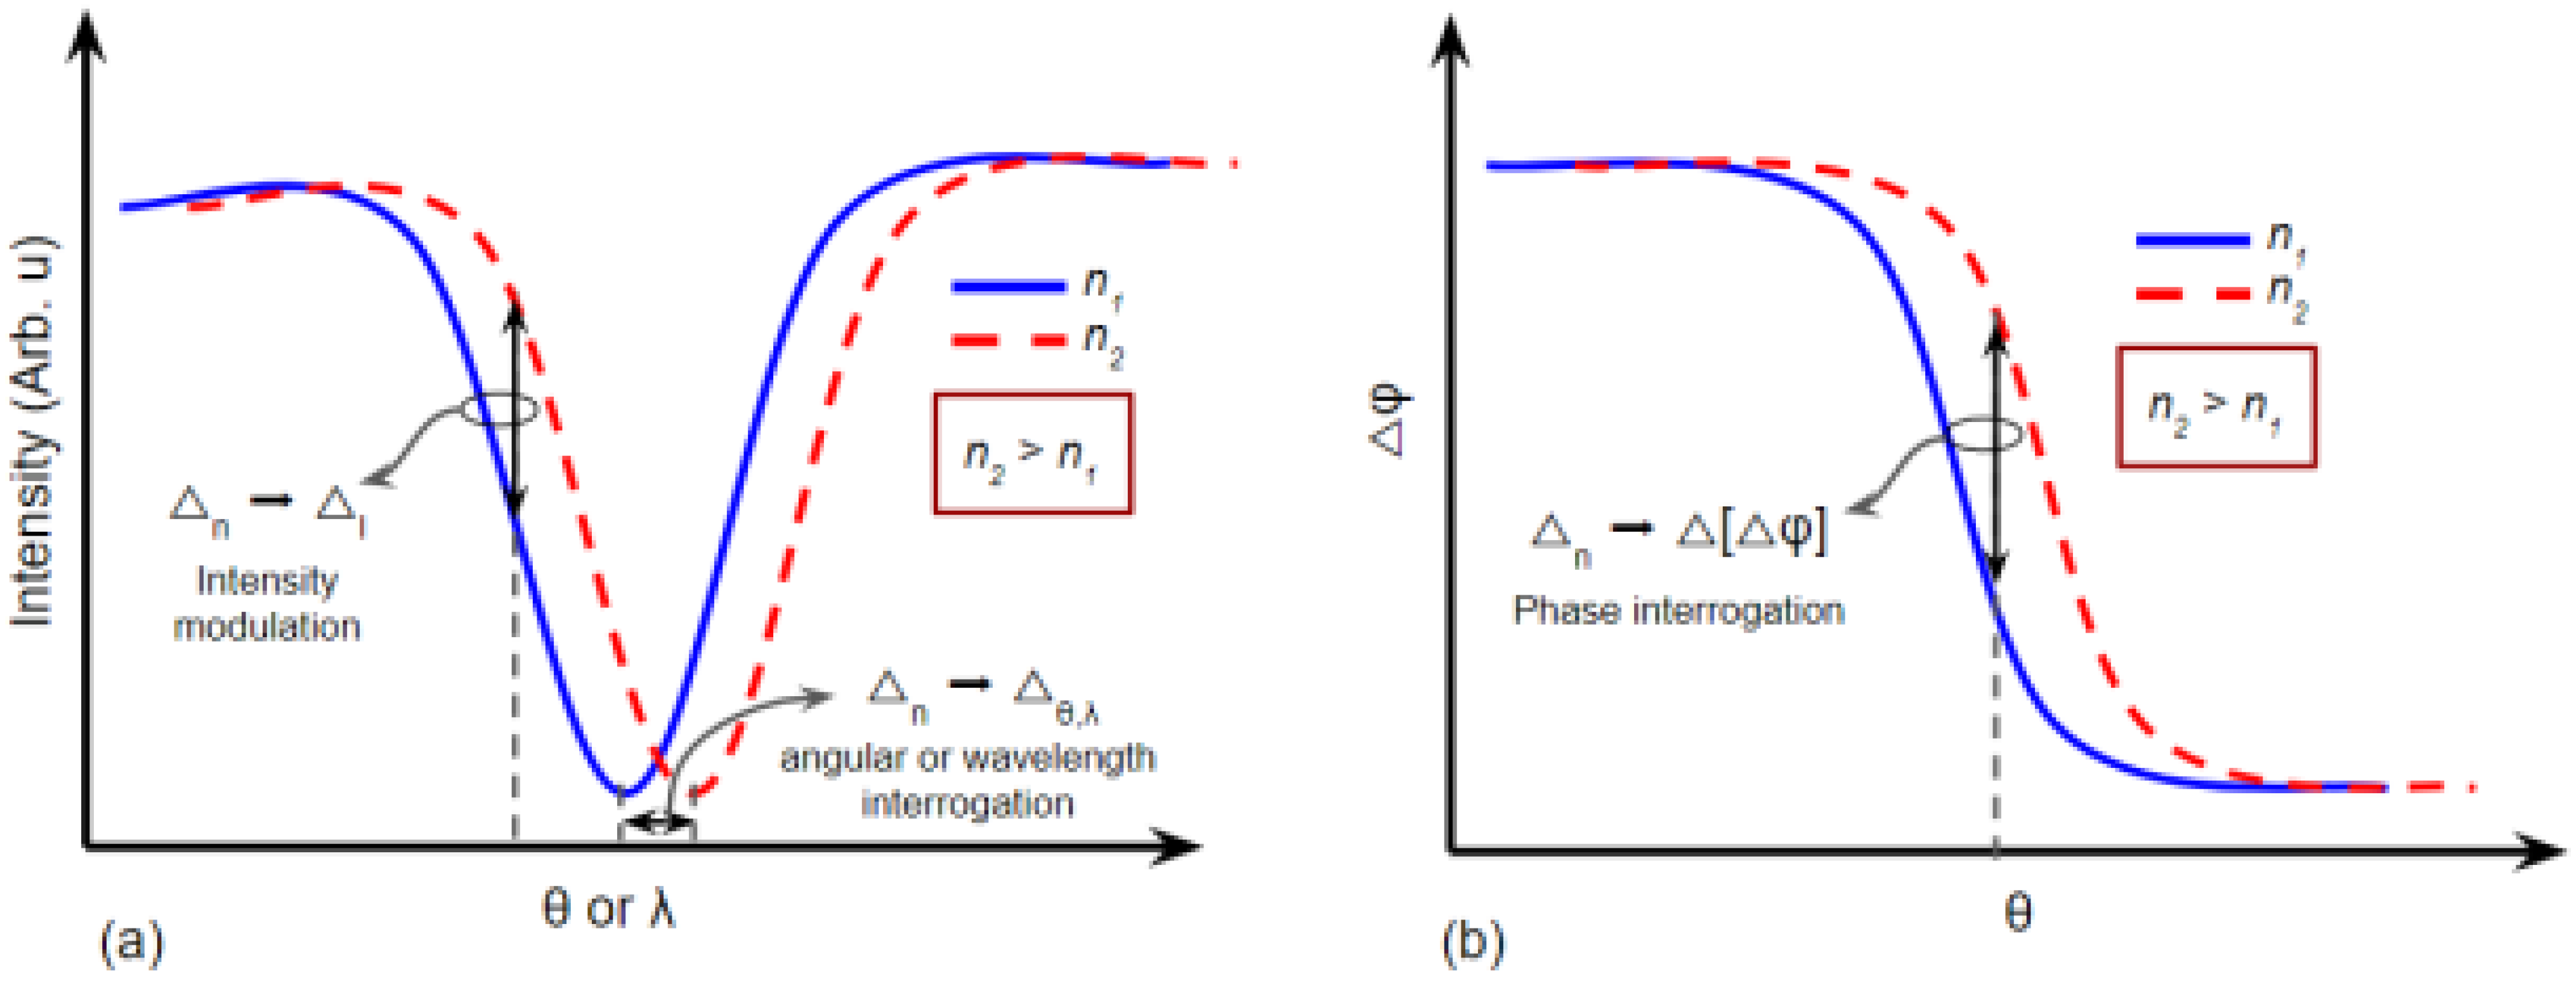
2.1. SPR Biosensors
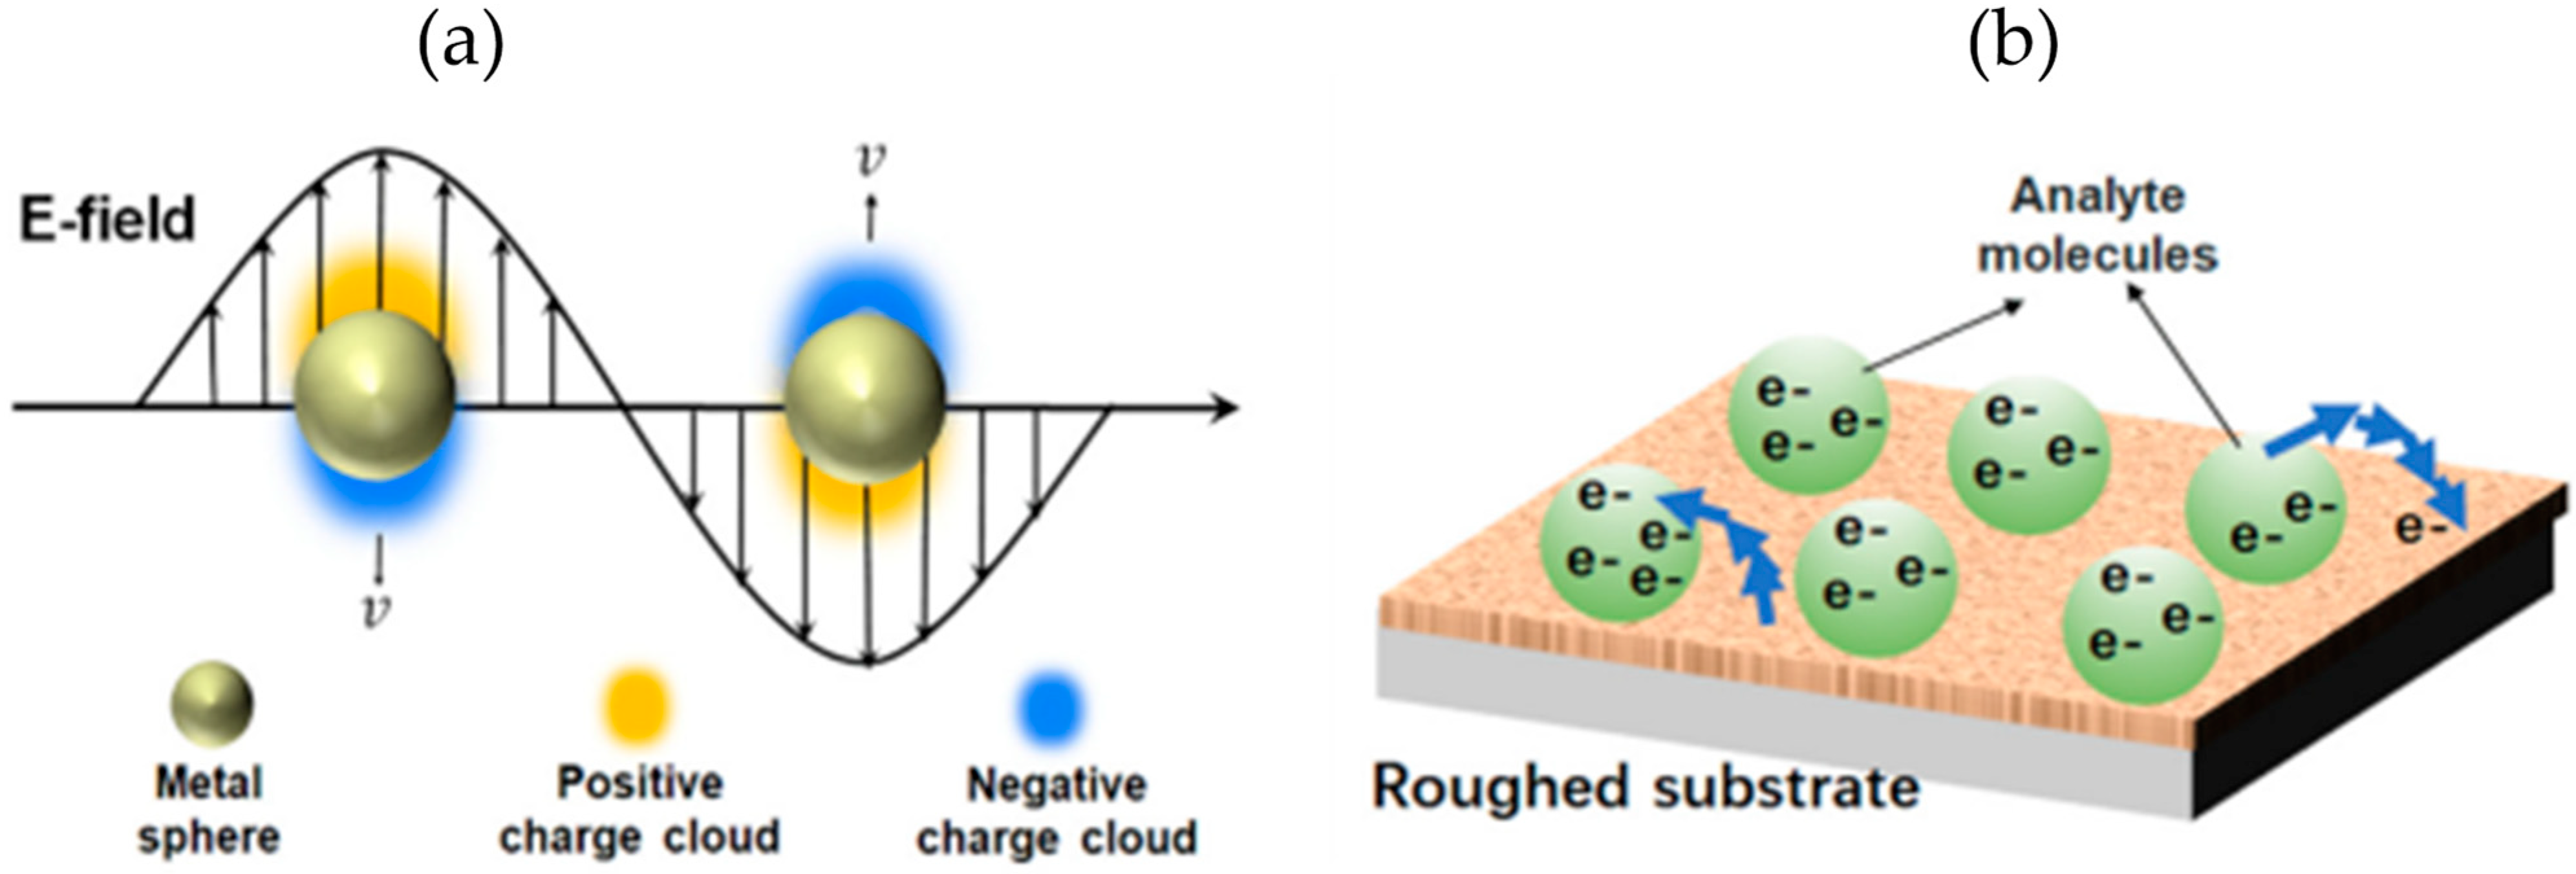
2.2. LSPR Biosensors
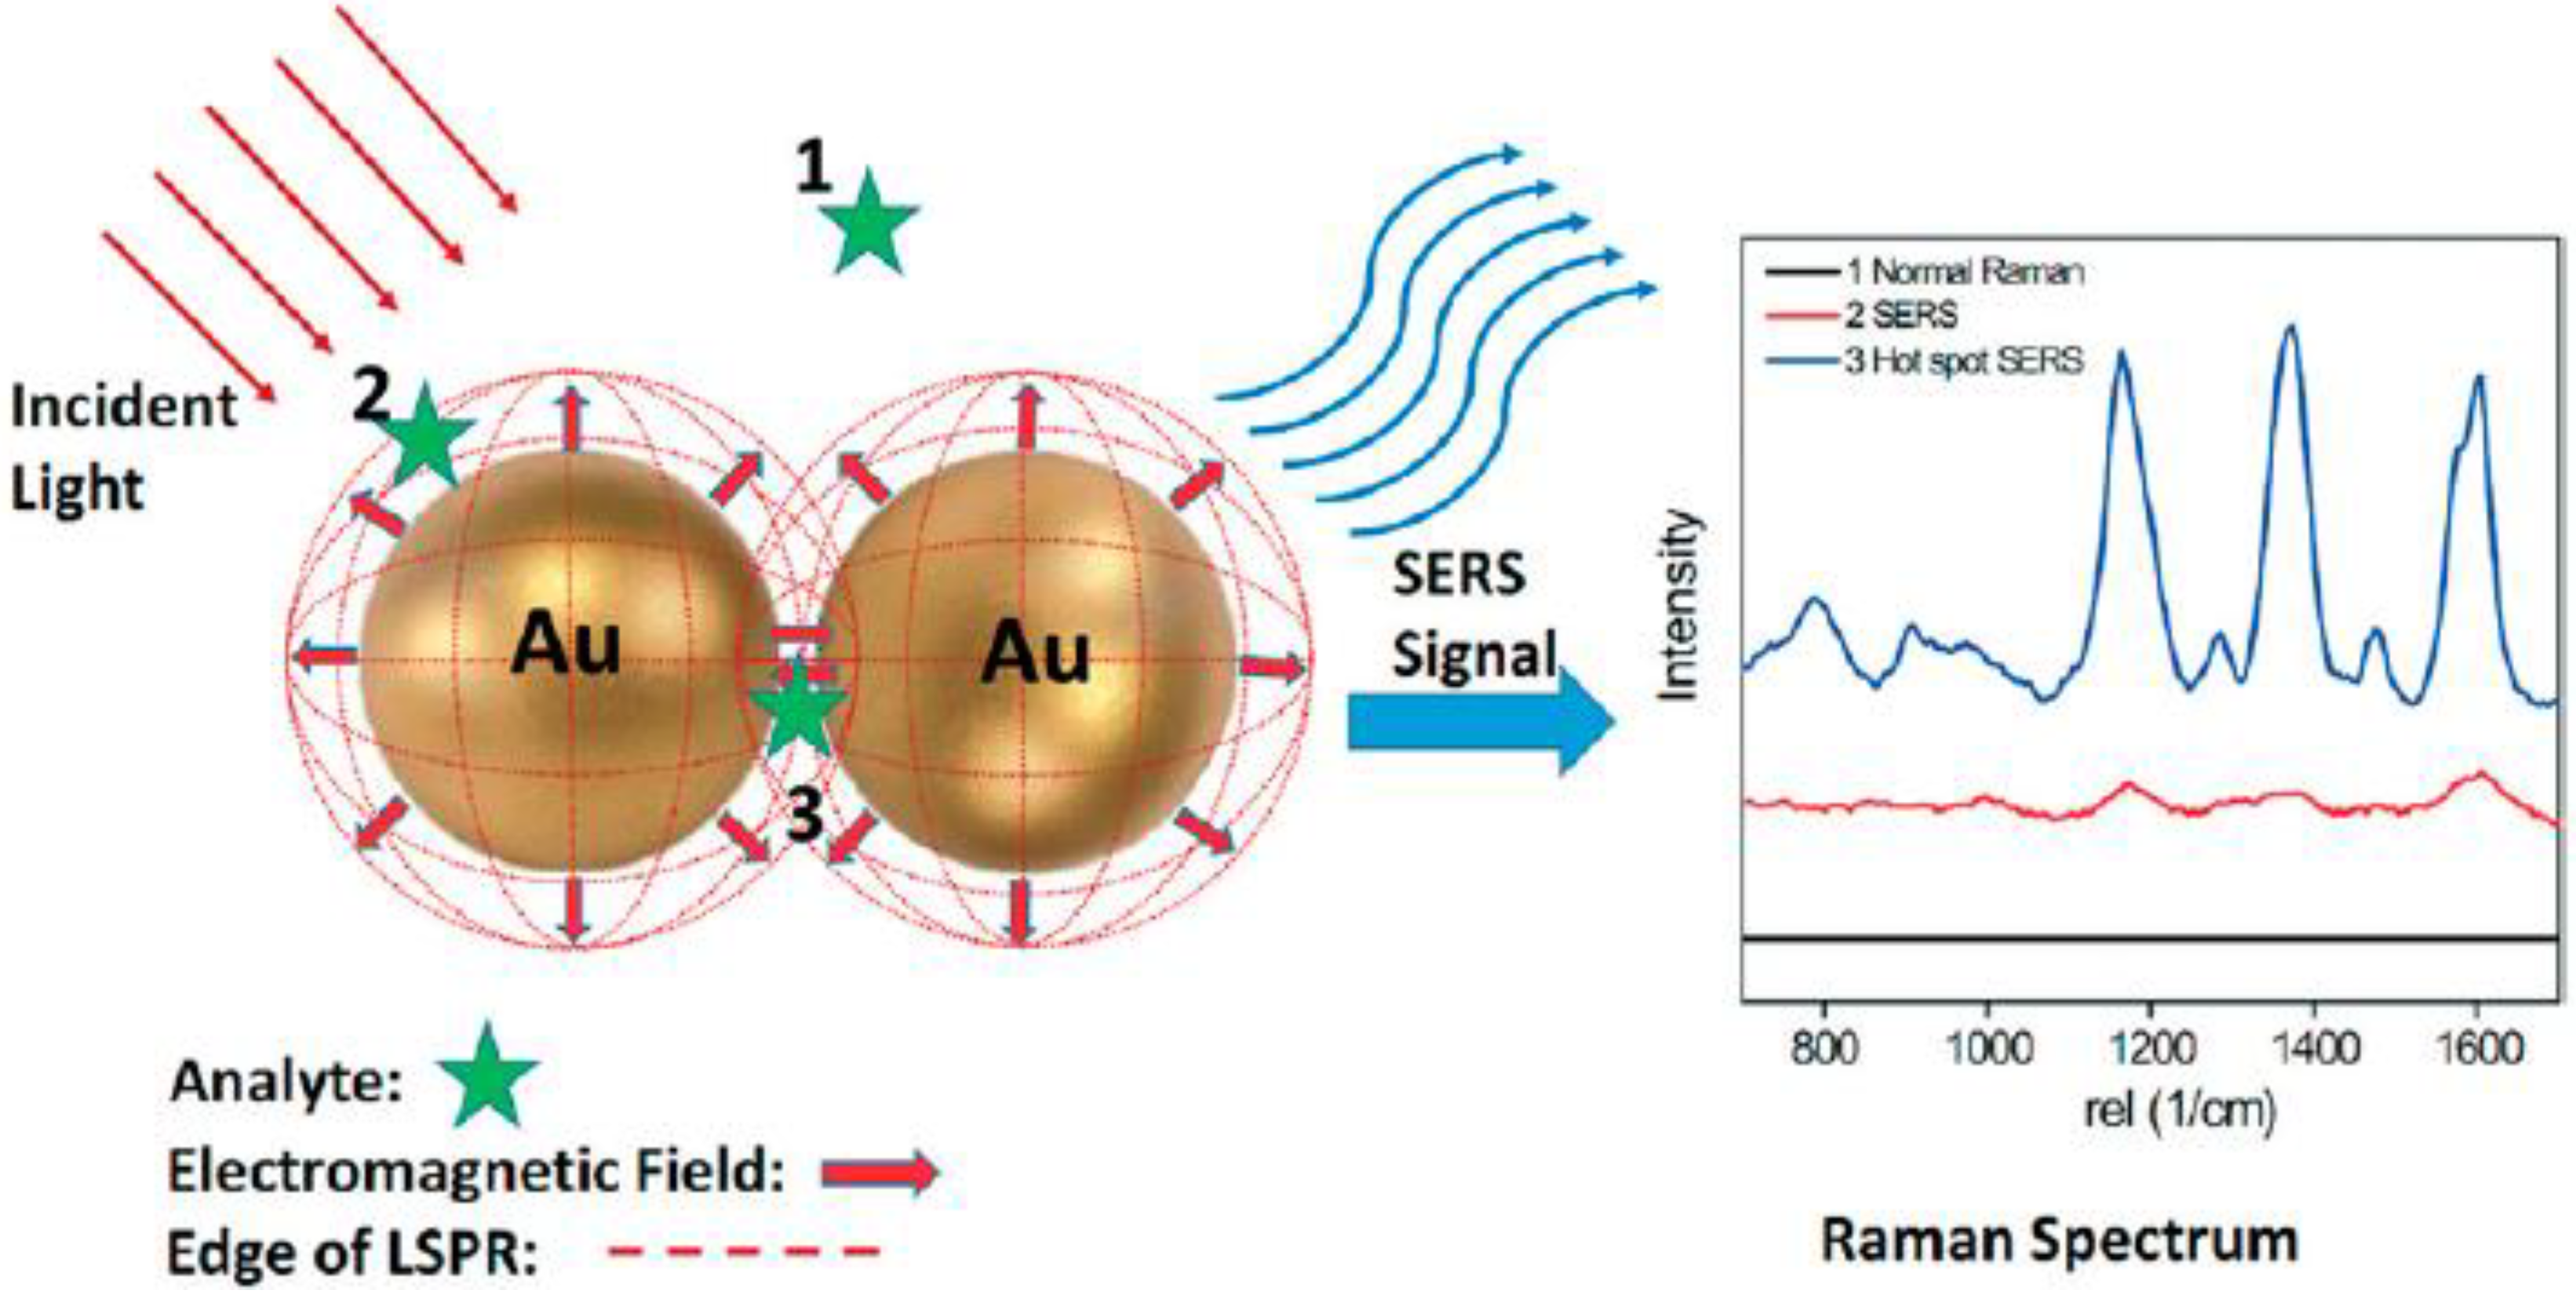
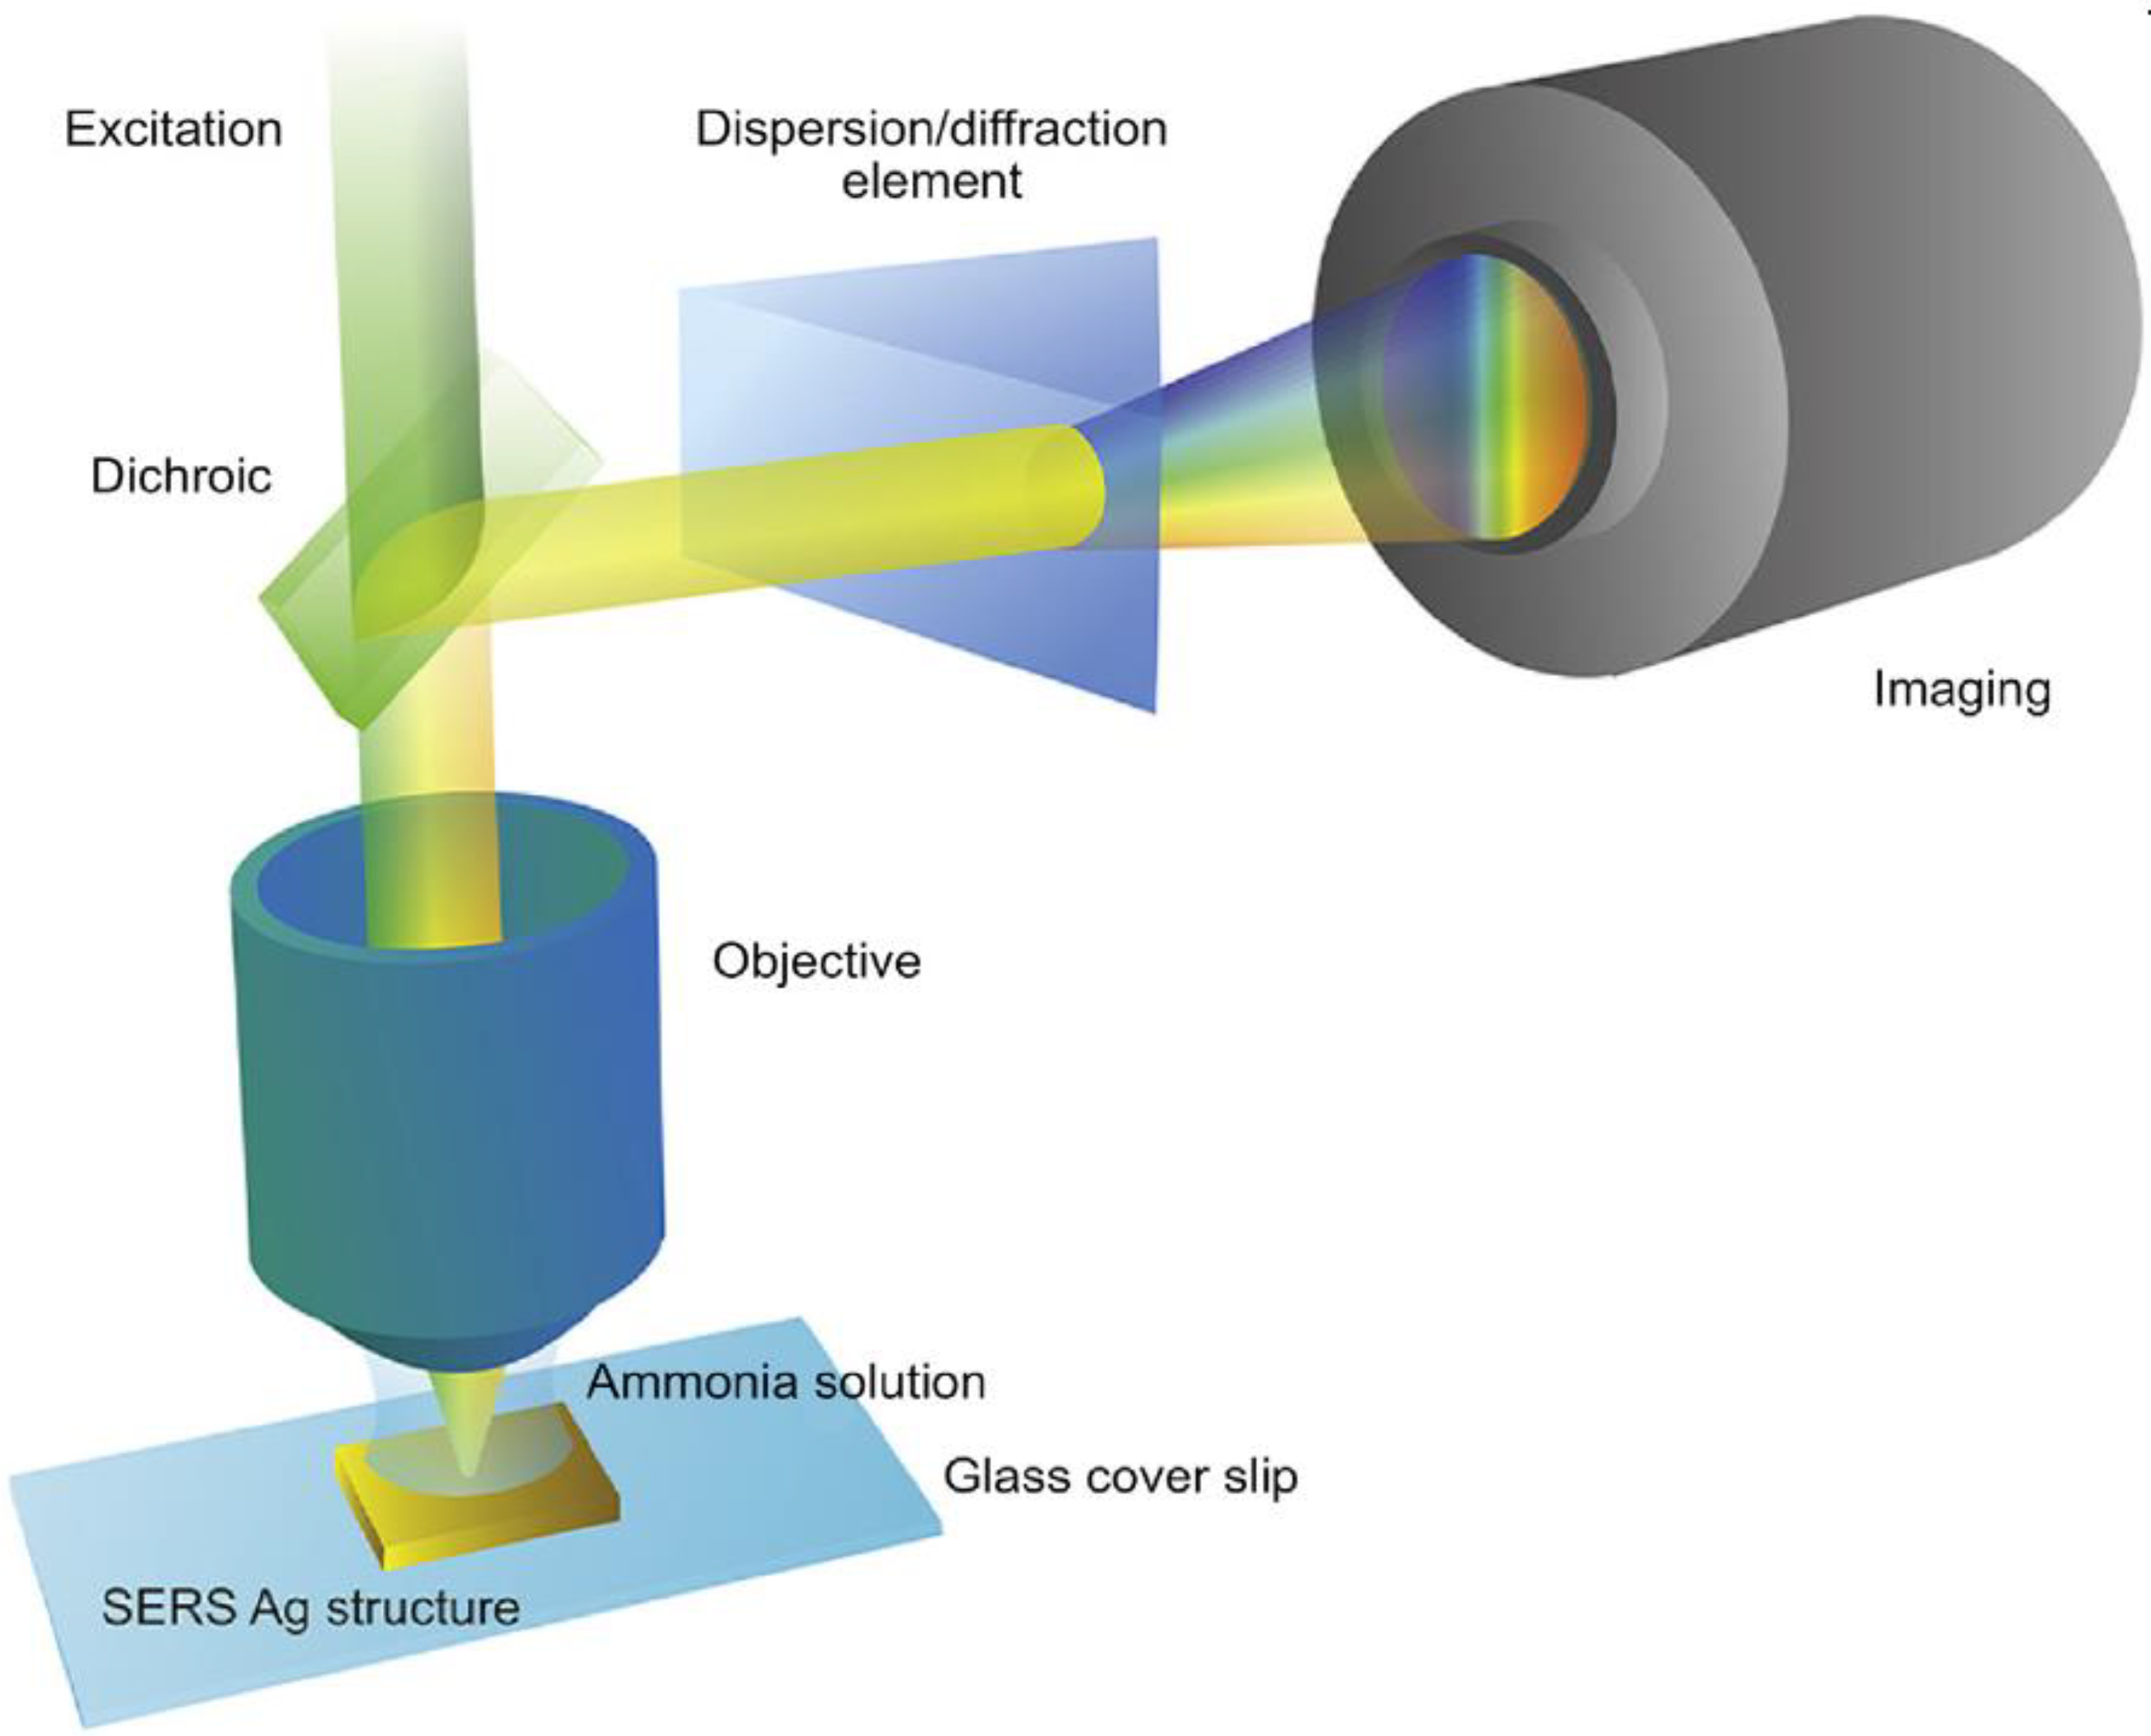
2.3. SERS Biosensors
3. Performance Characteristics Requirement for the Deployment of Plasmonic NH3 Sensors in Renal Disease or Kidney Failure
3.1. Sensitivity and Lowest Detection Limit
3.2. Detection Accuracy and Quality Factor
3.3. Selectivity
3.4. Reproducibility and Repeatability
3.5. Stability
3.6. Linearity
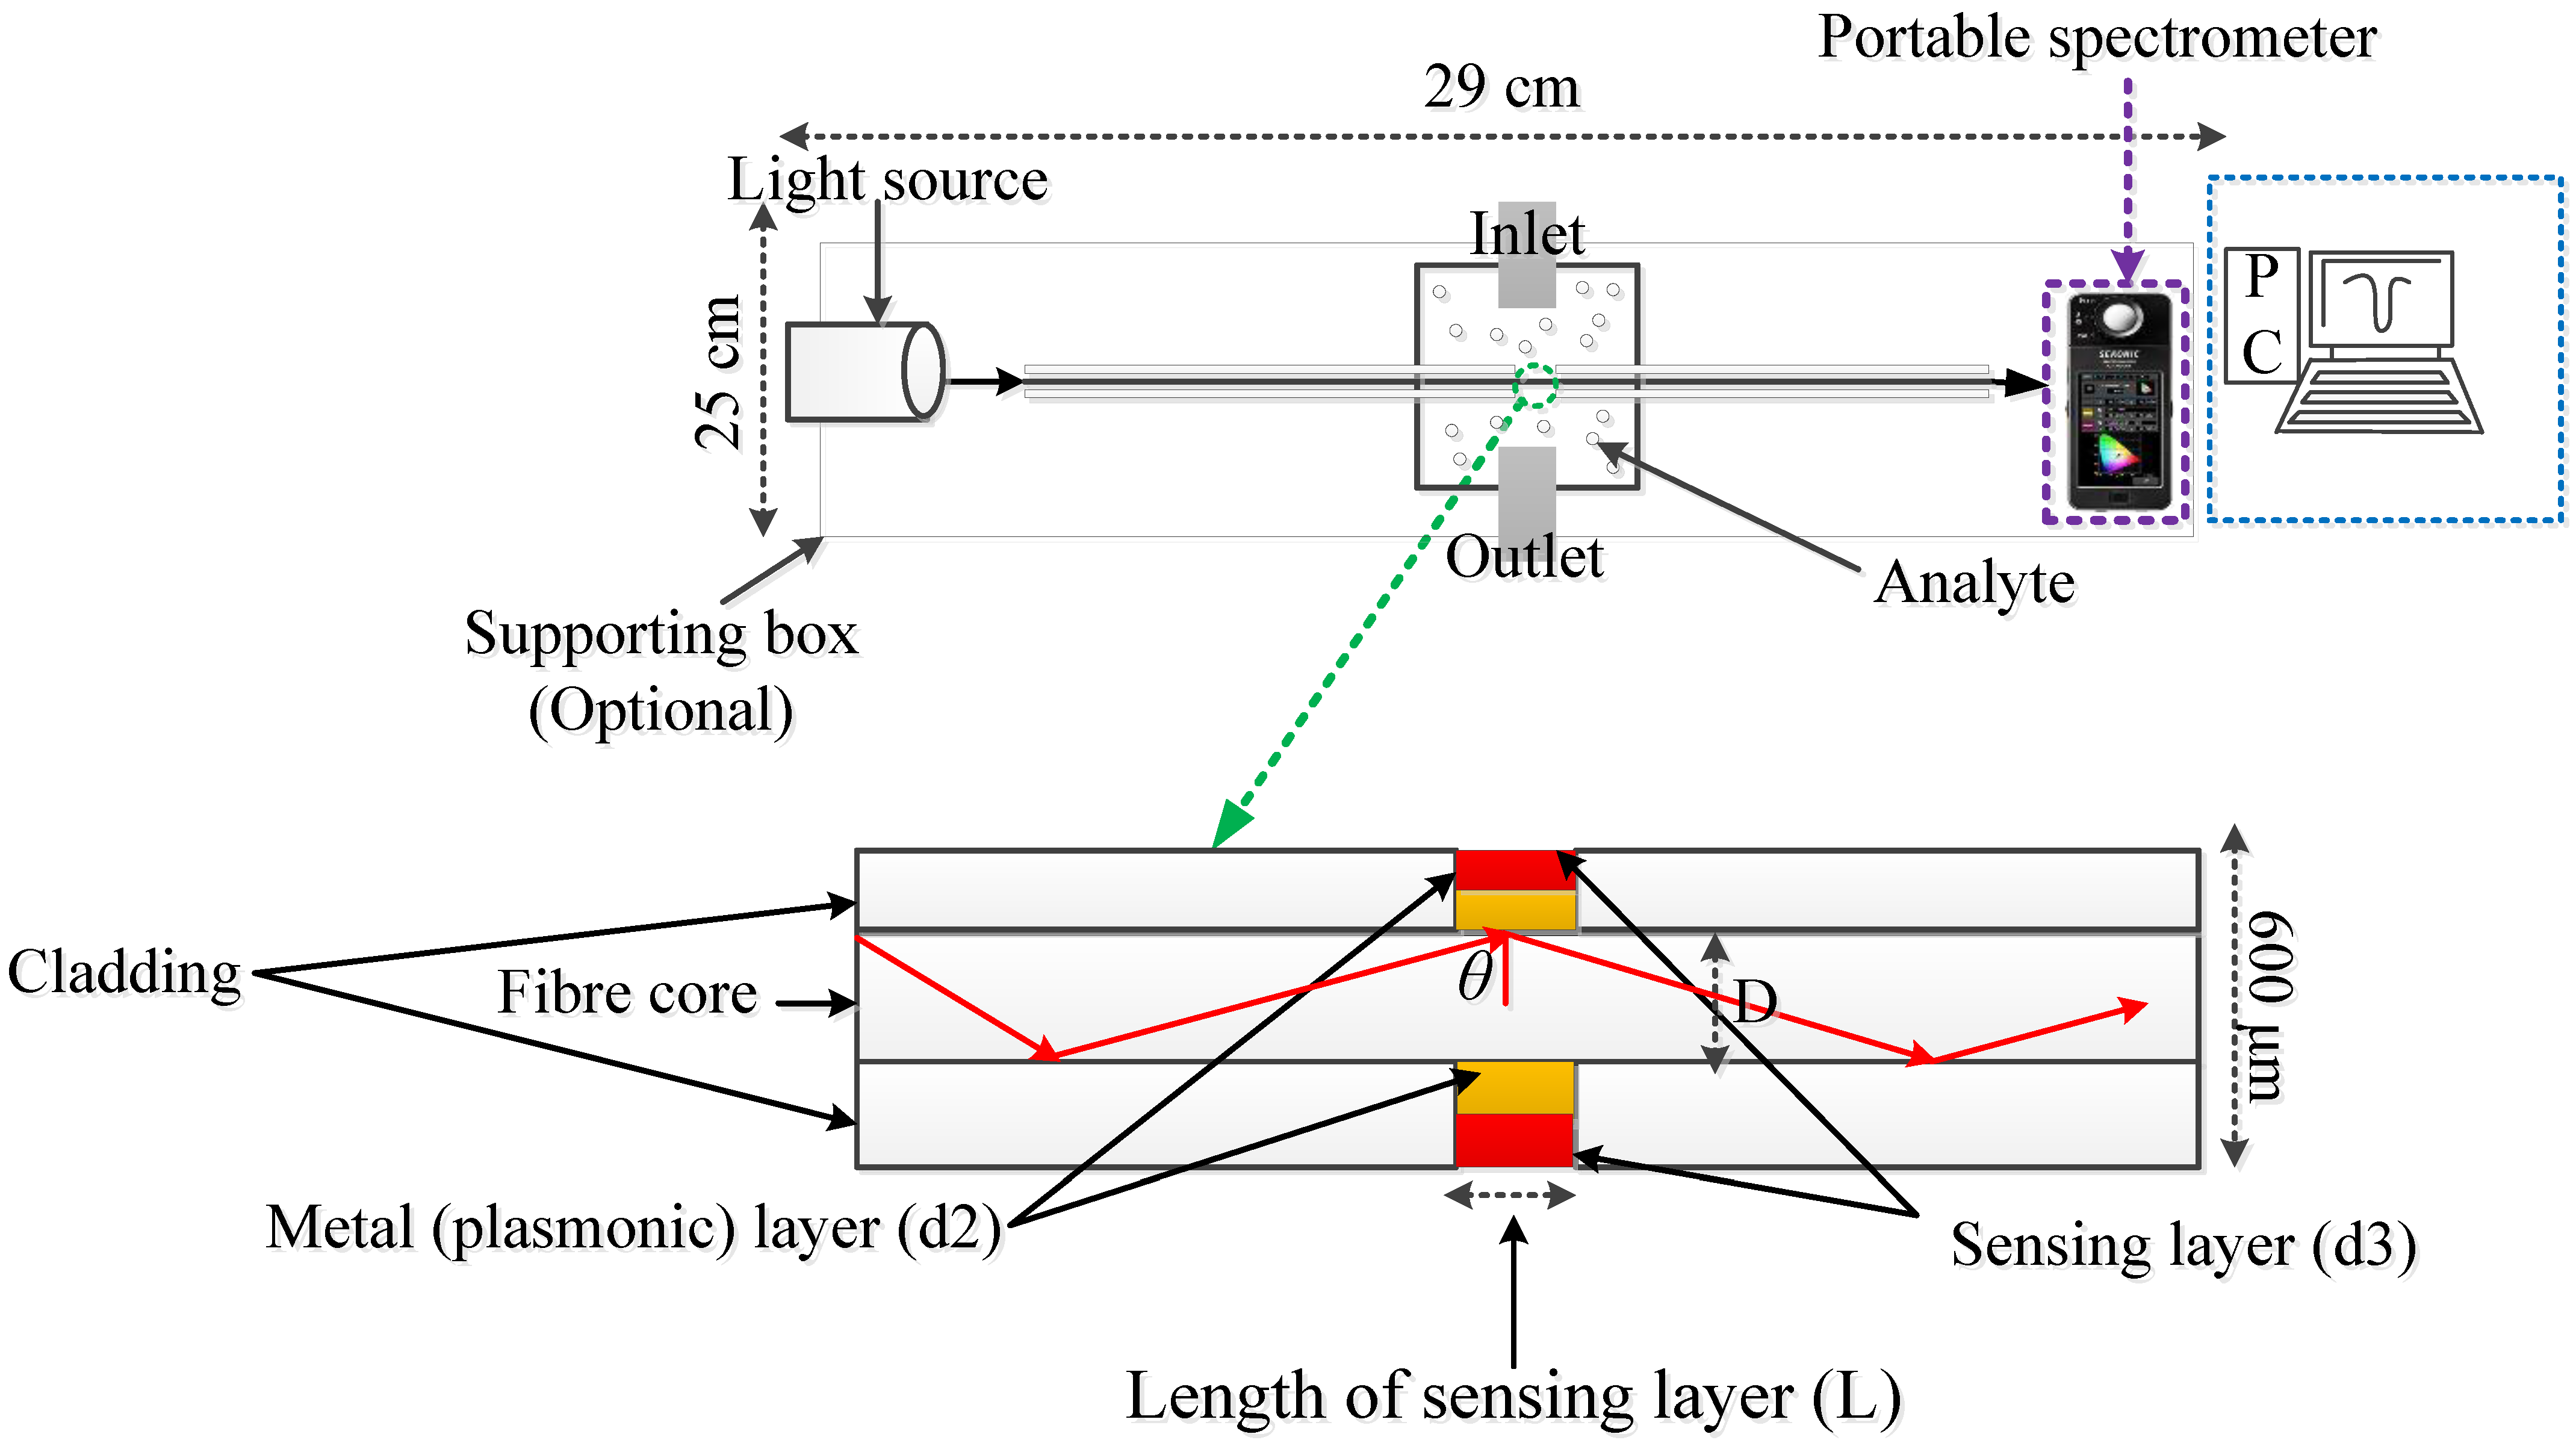
4. Plasmonic Biosensors for the Detection of Ammonia (NH3) Vapour
4.1. SPR Sensors for the Detection of Ammonia Gas Relevant to Kidney Disease
4.2. LSPR Sensors for the Detection of Ammonia Gas Relevant to Kidney Disease
4.3. SERS Sensors for the Detection of Ammonia Gas Relevant to Kidney Disease

| Material | Technique/Coupler | LOD (ppm) | Main limitations | References |
|---|---|---|---|---|
| Au/SnO2 films | SPR/Prism | 0.500 |
| [117] |
| Ag/Yttria films | SPR/Grating | 0.010 |
| [113] |
| Au/SnO2-PPY films | SPR/Prism | 1.000 |
| [115] |
| Polyethylene film | SPR/Fiber optics | 0.001 |
| [122] |
| Ag∕SnO2 films | SPR/Fiber optics | 0.154 |
| [111] |
| Indium tin oxide (ITO)/bromocresol purple (BCP) films | SPR/Fiber optics | 0.175 |
| [114] |
| Au/CSA Doped Polyaniline (PAni) films | SPR/Prism | 0.200 |
| [77] |
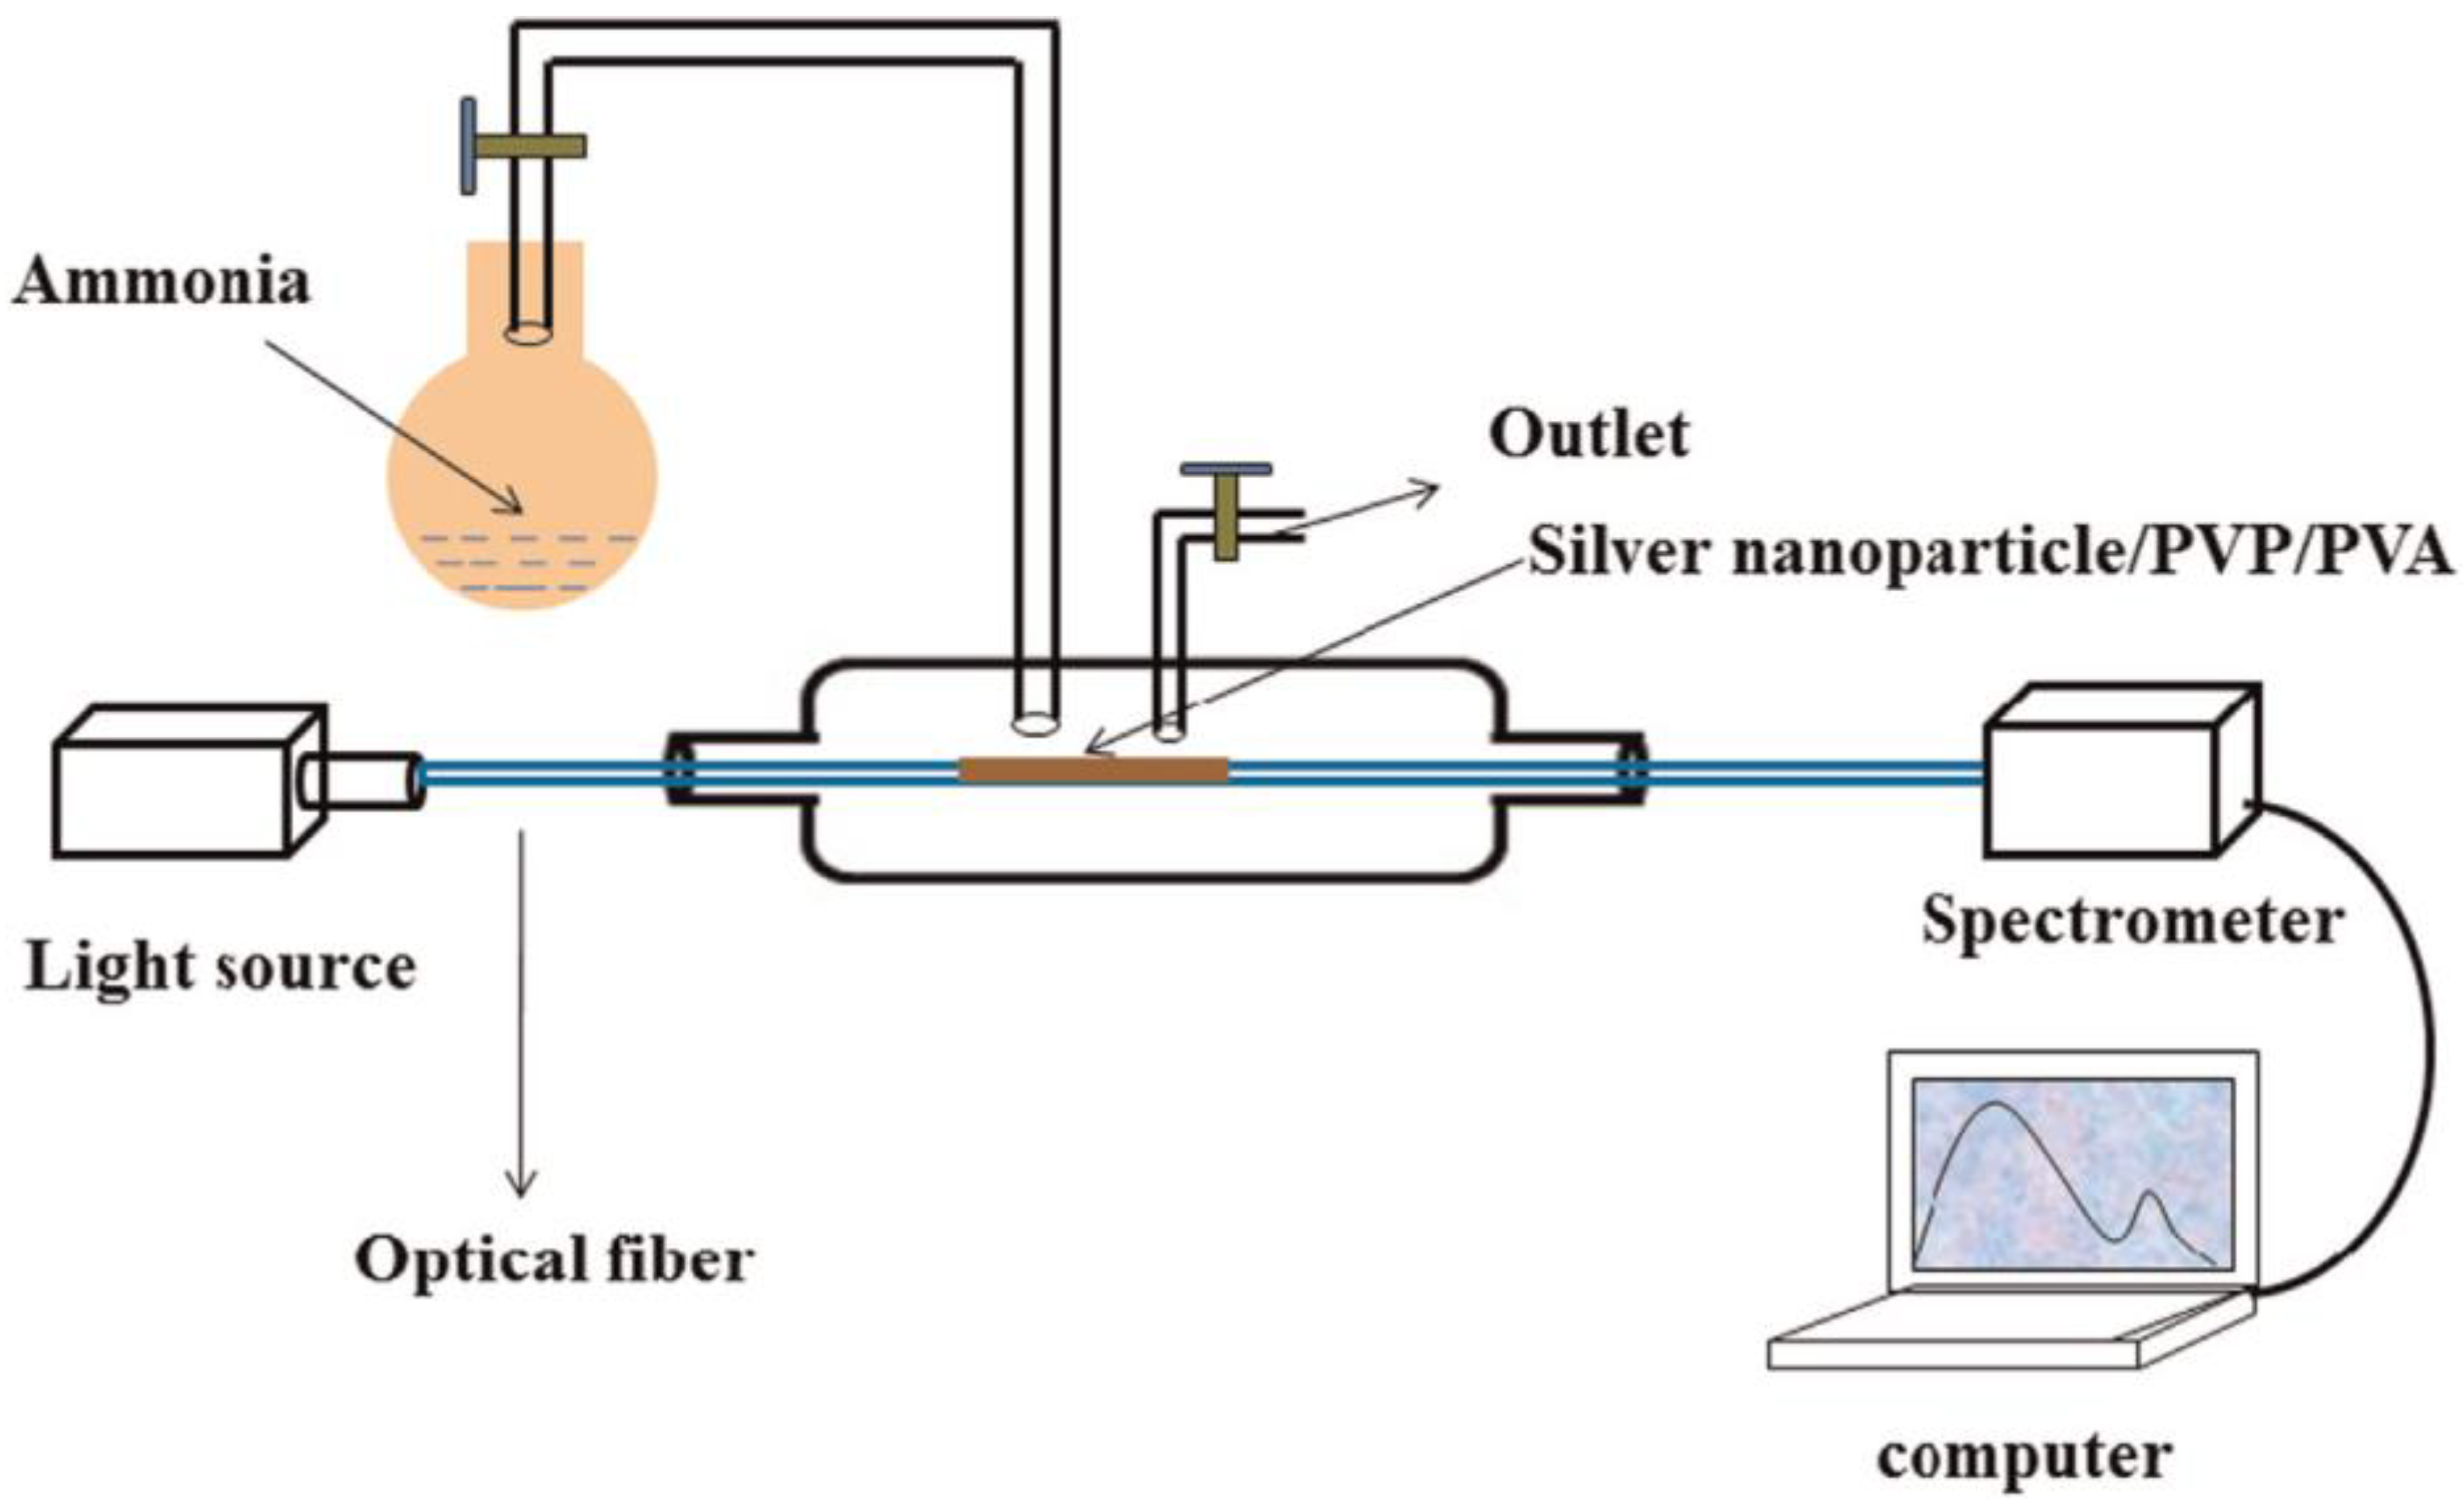
| Silver nanoparticles/PVP/PVA hybrid | LSPR/Fiber optics | <1.000 |
| [45] |
| Au/SnO2 films | SPR/Prism | 0.500 |
| [110] |
| Ag ink and Si/Ag | SERS | Sub 1 ppm |
| [142] |
5. Conclusions and Future Outlooks
Author Contributions
Funding
Institutional Review Board Statement
Informed Consent Statement
Data Availability Statement
Acknowledgments
Conflicts of Interest
References
- Luyckx, V.A.; Tonelli, M.; Stanifer, J.W. The global burden of kidney disease and the sustainable development goals. Bull. World Health Organ. 2018, 96, 414–422C. [Google Scholar] [CrossRef] [PubMed]
- Nasri, H. World Kidney Day 2014; Chronic Kidney Disease and Aging: A Global Health Alert. Iran. J. Public Health 2014, 43, 126–127. [Google Scholar] [PubMed]
- Tamadon, M.R.; Zahmatkesh, M. World kidney day 2015. J. Parathyr. Dis. 2015, 3, 34–36. [Google Scholar]
- Piccoli, G.B.; Alrukhaimi, M.; Liu, Z.-H.; Zakharova, E.; Levin, A. World Kidney Day Steering Committee Women and kidney disease: Reflections on World Kidney Day 2018. Clin. Kidney J. 2018, 11, 7–11. [Google Scholar] [CrossRef]
- Liyanage, T.; Ninomiya, T.; Jha, V.; Neal, B.; Patrice, H.M.; Okpechi, I.; Zhao, M.-H.; Lv, J.; Garg, A.X.; Knight, J.; et al. World-wide access to treatment for end-stage kidney disease: A systematic review. Lancet 2015, 385, 1975–1982. [Google Scholar] [CrossRef] [PubMed]
- de Groot, E.F.; de Meij, T.G.; Berkhout, D.J.; van der Schee, M.P.; de Boer, N.K. Flatography: Detection of gastrointestinal diseases by faecal gas analysis. World J. Gastrointest Pharm. Ther. 2015, 6, 111–113. [Google Scholar] [CrossRef] [PubMed]
- Risby, T.H.; Solga, S.F. Current status of clinical breath analysis. Appl. Phys. B 2006, 85, 421–426. [Google Scholar] [CrossRef]
- Black, D.A.K. Diagnosis in Renal Disease. Br. Med. J. 1970, 2, 315–318. [Google Scholar] [CrossRef] [PubMed]
- Sesso, R.; Belasco, A.G. Late diagnosis of chronic renal failure and mortality on maintenance dialysis. Nephrol. Dial. Transplant. 1996, 11, 2417–2420. [Google Scholar] [CrossRef]
- Hibbard, T.; Killard, A.J. Breath ammonia levels in a normal human population study as determined by photoacoustic laser spectroscopy. J. Breath Res. 2011, 5, 037101. [Google Scholar] [CrossRef]
- Tan, S.Y.; Hu, M. Medicine in Stamps Antoine-Laurent Lavoisier (1743–1794): Founder of modern chemistry. Singap. Med. J. 2004, 45, 303–304. [Google Scholar]
- Ettre, L.S. The Invention, Development and Triumph of the Flame Ionization Detector. LCGC N. Am. 2002, 20, 48–56. [Google Scholar]
- Wang, Z.; Wang, C. Is breath acetone a biomarker of diabetes? A historical review on breath acetone measurements. J. Breath Res. 2013, 7, 037109. [Google Scholar] [CrossRef] [Green Version]
- Minh, T.D.C.; Blake, D.R.; Galassetti, P.R. The Clinical Potential of Exhaled Breath Analysis For Diabetes Mellitus. Diabetes Res. Clin. Pract. 2012, 97, 195–205. [Google Scholar] [CrossRef] [PubMed]
- Thati, A.; Biswas, A.; Chowdhury, S.R.; Sau, T.K. Breath Acetone-Based Non-Invasive Detection of Blood Glucose Levels. Int. J. Smart Sens. Intell. Syst. 2015, 8, 1244–1260. [Google Scholar] [CrossRef]
- Wlodzimirow, K.; Abu-Hanna, A.; Schultz, M.; Maas, M.; Bos, L.; Sterk, P.; Knobel, H.; Soers, R.; Chamuleau, R.A. Exhaled breath analysis with electronic nose technology for detection of acute liver failure in rats. Biosens. Bioelectron. 2013, 53, 129–134. [Google Scholar] [CrossRef]
- Weiner, I.D.; Mitch, W.E.; Sands, J.M. Urea and Ammonia Metabolism and the Control of Renal Nitrogen Excretion. Clin. J. Am. Soc. Nephrol. 2014, 10, 1444–1458. [Google Scholar] [CrossRef]
- Narasimhan, L.R.; Goodman, W.; Patel, C.K.N. Correlation of breath ammonia with blood urea nitrogen and creatinine during hemodialysis. Proc. Natl. Acad. Sci. USA 2001, 98, 4617–4621. [Google Scholar] [CrossRef]
- Davies, S.; Spanel, P.; Smith, D. Quantitative analysis of ammonia on the breath of patients in end-stage renal failure. Kidney Int. 1997, 52, 223–228. [Google Scholar] [CrossRef]
- Di Natale, C.; Paolesse, R.; Martinelli, E.; Capuano, R. Solid-state gas sensors for breath analysis: A review. Anal. Chim. Acta 2014, 824, 1–17. [Google Scholar] [CrossRef]
- Hibbard, T.; Killard, A.J. Breath ammonia analysis: Clinical application and measurement. Crit. Rev. Anal. Chem. 2011, 41, 21–35. [Google Scholar] [CrossRef]
- Ruzsanyi, V.; Baumbach, J.I.; Sielemann, S.; Litterst, P.; Westhoff, M.; Freitag, L. Detection of human metabolites using multi-capillary columns coupled to ion mobility spectrometers. J. Chromatogr. A 2005, 1084, 145–151. [Google Scholar] [CrossRef] [PubMed]
- Liu, X.; Cheng, S.; Liu, H.; Hu, S.; Zhang, D.; Ning, H. A Survey on Gas Sensing Technology. Senors 2012, 12, 9635–9665. [Google Scholar] [CrossRef] [Green Version]
- Brackmann, C.; Hole, O.; Zhou, B.; Li, Z.S.; Aldén, M. Characterization of ammonia two-photon laser-induced fluorescence for gas-phase diagnostics. Appl. Phys. B 2014, 115, 25–33. [Google Scholar] [CrossRef]
- Karlsson, M. Characterization of Absorption Spectra of Molecular Constituents in the Mid-Infrared Region and their Role as Potential Markers for Breath Analysis. Bachelor’s Thesis, Umeå University, Umeå, Sweden, 2014. [Google Scholar]
- Liu, M.C.; Dai, C.L.; Chan, C.H.; Wu, C.C. Manufacture of a Polyaniline Nanofiber Ammonia Sensor Integrated with a Readout Circuit Using the CMOS-MEMS Technique. Sensors 2009, 9, 869–880. [Google Scholar] [CrossRef]
- Gardon, M.; Guilemany, J.M. A review on fabrication, sensing mechanisms and performance of metal oxide gas sensors. J. Mater. Sci. Mater. Electron. 2013, 24, 1410–1421. [Google Scholar] [CrossRef]
- Dinh, N.N. Conducting Polymers Incorporated with Related Graphene Compound Films for Use for Humidity and NH3 Gas Sensing. 2019. Available online: https://www.intechopen.com/chapters/63128 (accessed on 20 September 2022).
- Janata, J.; Josowicz, M. Conducting polymers in electronic chemical sensors. Nat. Mater. 2003, 2, 19–24. [Google Scholar] [CrossRef]
- Bai, H.; Shi, G. Gas sensors based on conducting polymers. Sensors 2007, 7, 267–307. [Google Scholar] [CrossRef]
- Patois, T.; Sanchez, J.-B.; Berger, F.; Fievet, P.; Segut, O.; Moutarlier, V.; Bouvet, M.; Lakard, B. Elaboration of ammonia gas sensors based on electrodeposited polypyrrole—Cobalt phthalocyanine hybrid films. Talanta 2013, 117, 45–54. [Google Scholar] [CrossRef]
- Cathcart, N.; Chen, J.I. Sensing biomarkers with plasmonics. Anal. Chem. 2020, 92, 7373–7381. [Google Scholar] [CrossRef]
- Qiao, X.; Su, B.; Liu, C.; Song, Q.; Luo, D.; Mo, G.; Wang, T. Selective Surface Enhanced Raman Scattering for Quantitative Detection of Lung Cancer Biomarkers in Superparticle@MOF Structure. Adv. Mater. 2017, 30, 1702275. [Google Scholar] [CrossRef] [PubMed]
- Zhang, Y.; Yang, D.; Weng, L.; Wang, L. Early lung cancer diagnosis by biosensors. Int. J. Mol. Sci. 2013, 14, 15479–15509. [Google Scholar] [CrossRef] [PubMed]
- Wang, Y.; Zhu, X.; Wu, M.; Xia, N.; Wang, J.; Zhou, F. Simultaneous and Label-Free Determination of Wild-Type and Mutant p53 at a Single Surface Plasmon Resonance Chip Preimmobilized with Consensus DNA and Monoclonal Antibody. Anal. Chem. 2009, 81, 8441–8446. [Google Scholar] [CrossRef] [PubMed]
- Kajikawa, K. Sensing Based on Localized Surface Plasmon Resonance in Metallic Nanoparticles. In Nanoparticle Technology Handbook; Elsevier: Amsterdam, The Netherlands, 2018; pp. 631–633. [Google Scholar]
- Shrivastav, A.M.; Cvelbar, U.; Abdulhalim, I. A comprehensive review on plasmonic-based biosensors used in viral diagnostics. Commun. Biol. 2021, 4, 70. [Google Scholar] [CrossRef] [PubMed]
- Langer, J.; de Aberasturi, D.J.; Aizpurua, J.; Alvarez-Puebla, R.; Auguié, B.; Baumberg, J.; Bazan, G.; Bell, S.; Boisen, A.; Brolo, A. Present and future of surface-enhanced Raman scattering. ACS Nano 2019, 14, 28–117. [Google Scholar] [CrossRef]
- Usman, F.; Dennis, J.O.; Aljameel, A.; Ali, M.; Aldaghri, O.; Ibnaouf, K.; Zango, Z.U.; Beygisangchin, M.; Alsadig, A.; Meriaudeau, F. Plasmonic Biosensors for the Detection of Lung Cancer Biomarkers: A Review. Chemosensors 2021, 9, 326. [Google Scholar] [CrossRef]
- Soler, M.; Lechuga, L.M. Principles, technologies, and applications of plasmonic biosensors. J. Appl. Phys. 2021, 129, 111102. [Google Scholar] [CrossRef]
- Santos, J.L.; Farahi, F. Handbook of Optical Sensors; CRC Press: Boca Raton, FL, USA, 2014. [Google Scholar]
- Available online: https://www.physik.huberlin.de/de/nano/lehre/Gastvorlesung%20Wien/plasmonics (accessed on 5 January 2023).
- Gupta, B.D.; Pathak, A.; Semwal, V. Carbon-Based Nanomaterials for Plasmonic Sensors: A Review. Sensors 2019, 19, 3536. [Google Scholar] [CrossRef]
- Yao, Y.; Yi, B.; Xiao, J.; Li, Z. Surface plasmon resonance biosensors and its application. In Proceedings of the 2007 1st International Conference on Bioinformatics and Biomedical Engineering 2007, Wuhan, China, 6–8 July 2007; pp. 1043–1046. [Google Scholar]
- Raj, D.R.; Prasanth, S.; Vineeshkumar, T.; Sudarsanakumar, C. Ammonia sensing properties of tapered plastic optical fiber coated with silver nanoparticles/PVP/PVA hybrid. Opt. Commun. 2015, 340, 86–92. [Google Scholar] [CrossRef]
- Gupta, B.D.; Verma, R.K. Surface plasmon resonance-based fiber optic sensors: Principle, probe designs, and some applications. Sensors 2009, 2009, 979761. [Google Scholar] [CrossRef]
- Kooyman, R.P. Physics of surface plasmon resonance. In Handbook of Surface Plasmon Resonance, 2nd ed.; Schasfoort, R.B.M., Ed.; Royal Society of Chemistry: Cambridge, UK, 2008; pp. 15–34. [Google Scholar]
- Masson, J.-F. Surface Plasmon Resonance Clinical Biosensors for Medical Diagnostics. ACS Sens. 2017, 2, 16–30. [Google Scholar] [CrossRef] [PubMed]
- Rahman, M.; Anower, M.; Rahman, M.; Hasan, M.; Hossain, M.; Haque, M. Modeling of a highly sensitive MoS2-Graphene hybrid based fiber optic SPR biosensor for sensing DNA hybridization. Optik 2017, 140, 989–997. [Google Scholar] [CrossRef]
- Kanso, M.; Cuenot, S.; Louarn, G. Sensitivity of Optical Fiber Sensor Based on Surface Plasmon Resonance: Modeling and Experiments. Plasmonics 2008, 3, 49–57. [Google Scholar] [CrossRef]
- Zhou, J.; Wang, Y.; Zhang, L.; Li, X. Plasmonic biosensing based on non-noble-metal materials. Chin. Chem. Lett. 2018, 29, 54–60. [Google Scholar] [CrossRef]
- Lopez, G.A.; Estevez, M.-C.; Soler, M.; Lechuga, L.M. Recent advances in nanoplasmonic biosensors: Applications and lab-on-a-chip integration. Nanophotonics 2016, 6, 123–136. [Google Scholar] [CrossRef]
- Naqvi, S.M.Z.A.; Zhang, Y.; Ahmed, S.; Abdulraheem, M.I.; Hu, J.; Tahir, M.N.; Raghavan, V. Applied surface enhanced Raman Spectroscopy in plant hormones detection, annexation of advanced technologies: A review. Talanta 2022, 236, 122823. [Google Scholar] [CrossRef]
- Gahlaut, S.K.; Pathak, A.; Gupta, B.D. Recent Advances in Silver Nanostructured Substrates for Plasmonic Sensors. Biosensors 2022, 12, 713. [Google Scholar] [CrossRef]
- Hamza, M.; Othman, M.; Swillam, M. Plasmonic Biosensors. Biology 2022, 11, 621. [Google Scholar] [CrossRef]
- Ferhan, A.R.; Jackman, J.A.; Park, J.H.; Cho, N.-J.; Kim, D.-H. Nanoplasmonic sensors for detecting circulating cancer biomarkers. Adv. Drug Deliv. Rev. 2018, 125, 48–77. [Google Scholar] [CrossRef]
- Yang, B.; Jin, S.; Guo, S.; Park, Y.; Chen, L.; Zhao, B.; Jung, Y.M. Recent Development of SERS Technology: Semiconductor-Based Study. ACS Omega 2019, 4, 20101–20108. [Google Scholar] [CrossRef]
- Yin, Y.; Li, C.; Yan, Y.; Xiong, W.; Ren, J.; Luo, W. MoS2-Based Substrates for Surface-Enhanced Raman Scattering: Fundamentals. Prog. Perspect. 2022, 12, 360. [Google Scholar]
- Guo, J.; Liu, Y.; Ju, H.; Lu, G. From lab to field: Surface-enhanced Raman scattering-based sensing strategies for on-site analysis. TrAC Trends Anal. Chem. 2021, 146, 116488. [Google Scholar] [CrossRef]
- Wei, H.; Abtahi, S.M.H.; Vikesland, P.J. Plasmonic colorimetric and SERS sensors for environmental analysis. Environ. Sci. Nano 2015, 2, 120–135. [Google Scholar] [CrossRef]
- Prabowo, B.A.; Purwidyantri, A.; Liu, K.-C. Surface Plasmon Resonance Optical Sensor: A Review on Light Source Technology. Biosensors 2018, 8, 80. [Google Scholar] [CrossRef] [Green Version]
- Singh, G.P.; Sardana, N. Smartphone-based Surface Plasmon Resonance Sensors: A Review. Plasmonics 2022, 17, 1869–1888. [Google Scholar] [CrossRef]
- Taghipour, A.; Heidarzadeh, H. Design and Analysis of Highly Sensitive LSPR-Based Metal–Insulator–Metal Nano-Discs as a Biosensor for Fast Detection of SARS-CoV-2. Photonics 2022, 9, 542. [Google Scholar] [CrossRef]
- Das, G.M.; Managò, S.; Mangini, M.; De Luca, A.C. Biosensing Using SERS Active Gold Nanostructures. Nanomaterials 2021, 11, 2679. [Google Scholar] [CrossRef]
- Olavarría-Fullerton, J.; Velez, R.A.; Wells, S.; Sepaniak, M.J.; Hernández-Rivera, S.P.; De Jesús, M.A. Design and Characterization of Hybrid Morphology Nanoarrays as Plasmonic Raman Probes for Antimicrobial Detection. Appl. Spectrosc. 2013, 67, 1315–1322. [Google Scholar] [CrossRef]
- Usman, F.; Dennis, J.O.; Seong, K.C.; Ahmed, A.Y.; Ferrell, T.L.; Fen, Y.W.; Sadrolhosseini, A.R.; Ayodele, O.B.; Meriaudeau, F.; Saidu, A. Enhanced Sensitivity of Surface Plasmon Resonance Biosensor Functionalized with Doped Polyaniline Composites for the Detection of Low-Concentration Acetone Vapour. J. Sens. 2019, 2019, 5786105. [Google Scholar] [CrossRef]
- Alharbi, R.; Irannejad, M.; Yavuz, M. A Short Review on the Role of the Metal-Graphene Hybrid Nanostructure in Promoting the Localized Surface Plasmon Resonance Sensor Performance. Sensors 2019, 19, 862. [Google Scholar] [CrossRef]
- Nurrohman, D.T.; Chiu, N.-F. Surface plasmon resonance biosensor performance analysis on 2D material based on graphene and transition metal dichalcogenides. ECS J. Solid State Sci. Technol. 2020, 9, 115023. [Google Scholar] [CrossRef]
- Daniyal, W.M.E.M.M.; Fen, Y.W.; Abdullah, J.; Sadrolhosseini, A.R.; Saleviter, S.; Omar, N.A.S. Exploration of surface plasmon resonance for sensing copper ion based on nanocrystalline cellulose-modified thin film. Opt. Express 2018, 26, 34880–34893. [Google Scholar] [CrossRef]
- Byun, K.-M. Development of Nanostructured Plasmonic Substrates for Enhanced Optical Biosensing. J. Opt. Soc. Korea 2010, 14, 65–76. [Google Scholar] [CrossRef]
- Unser, S.; Bruzas, I.; He, J.; Sagle, L. Localized Surface Plasmon Resonance Biosensing: Current Challenges and Approaches. Sensors 2015, 15, 15684–15716. [Google Scholar] [CrossRef] [PubMed]
- Špačková, B.; Lynn, J.N.S.; Slabý, J.; Šípová, H.; Homola, J. A Route to Superior Performance of a Nanoplasmonic Biosensor: Consideration of Both Photonic and Mass Transport Aspects. ACS Photonics 2018, 5, 1019–1025. [Google Scholar] [CrossRef]
- Areizaga-Martinez, H.I.; Kravchenko, I.; Lavrik, N.; Sepaniak, M.J.; Hernández-Rivera, S.P.; De Jesús, M.A. Performance Characteristics of Bio-Inspired Metal Nanostructures as Surface-Enhanced Raman Scattered (SERS) Substrates. Appl. Spectrosc. 2016, 70, 1432–1445. [Google Scholar] [CrossRef]
- Spackova, B.; Wrobel, P.; Bockova, M.; Homola, J. Optical Biosensors Based on Plasmonic Nanostructures: A Review. Proc. IEEE. 2016, 104, 2380–2408. [Google Scholar] [CrossRef]
- Sharma, S.K.; Kumar, P.; Barthwal, S.; Sharma, S.; Sharma, A. Highly Sensitive Surface-Enhanced Raman Scattering (SERS)- Based Multi Gas Sensor: Au Nanoparticles Decorated on Partially Embedded 2D Colloidal Crystals into Elastomer. Chemistryselect 2017, 2, 6961–6969. [Google Scholar] [CrossRef]
- Banerji, S.; Peng, W.; Kim, Y.-C.; Menegazzo, N.; Booksh, K.S. Evaluation of polymer coatings for ammonia vapor sensing with surface plasmon resonance spectroscopy. Sens. Actuators B Chem. 2010, 147, 255–262. [Google Scholar] [CrossRef]
- Menegazzo, N.; Herbert, B.; Banerji, S.; Booksh, K.S. Discourse on the utilization of polyaniline coatings for surface plasmon resonance sensing of ammonia vapor. Talanta 2011, 85, 1369–1375. [Google Scholar] [CrossRef] [PubMed]
- Mishra, S.K.; Tripathi, S.N.; Choudhary, V.; Gupta, B.D. SPR based fibre optic ammonia gas sensor utilizing nanocomposite film of PMMA/reduced graphene oxide prepared by in situ polymerization. Sens. Actuators B Chem. 2014, 199, 190–200. [Google Scholar] [CrossRef]
- Beffara, F.; Humbert, G.; Auguste, J.-L.; Perumal, J.; Dinish, U.S.; Olivo, M. Optimization and performance analysis of SERS-active suspended core photonic crystal fibers. Opt. Express 2020, 28, 23609. [Google Scholar] [CrossRef] [PubMed]
- Andrade, G.F.; Fan, M.; Brolo, A.G. Multilayer silver nanoparticles-modified optical fiber tip for high performance SERS remote sensing. Biosens. Bioelectron. 2010, 25, 2270–2275. [Google Scholar] [CrossRef]
- Wang, K.; Sun, D.-W.; Pu, H.; Wei, Q.; Huang, L. Stable, Flexible, and High-Performance SERS Chip Enabled by a Ternary Film-Packaged Plasmonic Nanoparticle Array. ACS Appl. Mater. Interfaces 2019, 11, 29177–29186. [Google Scholar] [CrossRef]
- Jia, P. Plasmonic Optical Sensors: Performance Analysis and Engineering Towards Biosensing; The University of Western Ontario: London, ON, Canada, 2014. [Google Scholar]
- Usman, F.; Dennis, J.; Mkawi, E.; Al-Hadeethi, Y.; Meriaudeau, F.; Ferrell, T.; Aldaghri, O.; Sulieman, A. Investigation of Acetone Vapour Sensing Properties of a Ternary Composite of Doped Polyaniline, Reduced Graphene Oxide and Chitosan Using Surface Plasmon Resonance Biosensor. Polymers 2020, 12, 2750. [Google Scholar] [CrossRef] [PubMed]
- Zhao, J.; Lin, J.; Wei, H.; Li, X.; Zhang, W.; Zhao, G.; Bu, J.; Chen, Y. Surface enhanced Raman scattering substrates based on titanium nitride nanorods. Opt. Mater. 2015, 47, 219–224. [Google Scholar] [CrossRef]
- Kim, N.-H.; Choi, M.; Kim, T.W.; Choi, W.; Park, S.Y.; Byun, K.M. Sensitivity and Stability Enhancement of Surface Plasmon Resonance Biosensors based on a Large-Area Ag/MoS2 Substrate. Sensors 2019, 19, 1894. [Google Scholar] [CrossRef] [PubMed]
- Zhang, F.; Martin, J.; Plain, J. Long-term stability of plasmonic resonances sustained by evaporated aluminum nanostructures. Opt. Mater. Express 2018, 9, 85–94. [Google Scholar] [CrossRef]
- Luan, J.; Xu, T.; Cashin, J.; Morrissey, J.J.; Kharasch, E.D.; Singamaneni, S. Environmental Stability of Plasmonic Biosensors Based on Natural versus Artificial Antibody. Anal. Chem. 2018, 90, 7880–7887. [Google Scholar] [CrossRef]
- Karunakaran, C.; Rajkumar, R.; Bhargava, K. Introduction to biosensors. In Biosensors and Bioelectronics; Elsevier: Amsterdam, The Netherlands, 2015; pp. 1–68. [Google Scholar]
- Fu, Y.; Xin, M.; Chong, J.; Li, R.; Huang, M. Plasmonic gold nanostars@ZIF-8 nanocomposite for the ultrasensitive detection of gaseous formaldehyde. J. Mater. Sci. 2020, 56, 4151–4160. [Google Scholar] [CrossRef]
- Janaki, V.; Oh, B.-T.; Vijayaraghavan, K.; Kim, J.-W.; Kim, S.A.; Ramasamy, A.; Kamala-Kannan, S. Application of bacterial extracellular polysaccharides/polyaniline composite for the treatment of Remazol effluent. Carbohydr. Polym. 2012, 88, 1002–1008. [Google Scholar] [CrossRef]
- Huang, W.; MacDiarmid, A. Optical properties of polyaniline. Polymer 1993, 34, 1833–1845. [Google Scholar] [CrossRef]
- Borah, R.; Banerjee, S.; Kumar, A. Surface functionalization effects on structural, conformational, and optical properties of polyaniline nanofibers. Synth. Met. 2014, 197, 225–232. [Google Scholar] [CrossRef]
- Fratoddi, I.; Venditti, I.; Cametti, C.; Russo, M.V. Chemiresistive polyaniline-based gas sensors: A mini review. Sens. Actuators B Chem. 2015, 220, 534–548. [Google Scholar] [CrossRef]
- Qiu, S.; Chen, C.; Zheng, W.; Li, W.; Zhao, H.; Wang, L. Long-term corrosion protection of mild steel by epoxy coating containing self-doped polyaniline nanofiber. Synth. Met. 2017, 229, 39–46. [Google Scholar] [CrossRef]
- Kohl, M.; Kalendová, A. Effect of polyaniline salts on the mechanical and corrosion properties of organic protective coatings. Prog. Org. Coat. 2015, 86, 96–107. [Google Scholar] [CrossRef]
- Kumar, L.; Rawal, I.; Kaur, A.; Annapoorni, S. Flexible room temperature ammonia sensor based on polyaniline. Sens. Actuators B Chem. 2017, 240, 408–416. [Google Scholar] [CrossRef]
- Zhang, K.; Luo, J.; Yu, N.; Gu, M.; Sun, X. Synthesis and excellent electromagnetic absorption properties of reduced graphene oxide/PANI/BaNd0.2Sm0.2Fe11.6O19 nanocomposites. J. Alloys Compd. 2018, 779, 270–279. [Google Scholar] [CrossRef]
- Usman, F.; Dennis, J.O.; Seong, K.C.; Ahmed, A.Y.; Meriaudeau, F.; Ayodele, O.B.; Tobi, A.R.; Rabih, A.A.S.; Yar, A. Synthesis and characterisation of a ternary composite of polyaniline, reduced graphene-oxide and chitosan with reduced optical band gap and stable aqueous dispersibility. Results Phys. 2019, 15, 102690. [Google Scholar] [CrossRef]
- Wang, Q.; Dong, X.; Pang, Z.; Du, Y.; Xia, X.; Wei, Q.; Huang, F. Ammonia Sensing Behaviors of TiO2-PANI/PA6 Composite Nanofibers. Sensors 2012, 12, 17046–17057. [Google Scholar] [CrossRef]
- Tai, H.; Jiang, Y.; Xie, G.; Yu, J.; Chen, X. Fabrication and gas sensitivity of polyaniline–titanium dioxide nanocomposite thin film. Sens. Actuators B Chem. 2007, 125, 644–650. [Google Scholar] [CrossRef]
- He, L.; Jia, Y.; Meng, F.; Li, M.; Liu, J. Gas sensors for ammonia detection based on polyaniline-coated multi-wall carbon nanotubes. Mater. Sci. Eng. B 2009, 163, 76–81. [Google Scholar] [CrossRef]
- Šetka, M.; Drbohlavová, J.; Hubálek, J. Nanostructured Polypyrrole-Based Ammonia and Volatile Organic Compound Sensors. Sensors 2017, 17, 562. [Google Scholar] [CrossRef]
- Zhang, D.; Wu, Z.; Zong, X.; Zhang, Y. Fabrication of polypyrrole/Zn2SnO4 nanofilm for ultra-highly sensitive ammonia sensing application. Sens. Actuators B Chem. 2018, 274, 575–586. [Google Scholar] [CrossRef]
- Wang, L.; Jiang, R. Investigation on the Ammonia Sensitivity Mechanism of Conducting Polymer Polypyrroles Using In-Situ FT-IR. Mater. Sci. Appl. 2019, 10, 497. [Google Scholar]
- Malkeshi, H.; Moghaddam, H.M. Ammonia gas-sensing based on polythiophene film prepared through electrophoretic deposition method. J. Polym. Res. 2016, 23, 108. [Google Scholar] [CrossRef]
- Korent, A.; Žagar Soderžnik, K.; Šturm, S.; Žužek Rožman, K.; Redon, N.; Wojkiewicz, J.L.; Duc, C. Facile Fabrication of an Ammonia-Gas Sensor Using Electrochemically Synthesised Polyaniline on Commercial Screen-Printed Three-Electrode Systems. Sensors 2020, 21, 169. [Google Scholar] [CrossRef]
- Shankar, P.; Rayappan, J.B.B. Gas sensing mechanism of metal oxides: The role of ambient atmosphere, type of semiconductor and gases-A review. Sci. Lett. J. 2015, 4, 126. [Google Scholar]
- Van Hieu, N.; Thuy, L.; Chien, N. Highly sensitive thin film NH3 gas sensor operating at room temperature based on SnO2/MWCNTs composite. Sens. Actuators B Chem. 2008, 129, 888–895. [Google Scholar] [CrossRef]
- Mishra, S.K.; Kumari, D.; Gupta, B.D. Surface plasmon resonance based fiber optic ammonia gas sensor using ITO and polyaniline. Sens. Actuators B Chem. 2012, 171–172, 976–983. [Google Scholar] [CrossRef]
- Paliwal, A.; Sharma, A.; Tomar, M.; Gupta, V. Surface plasmon resonance study on the optical sensing properties of tin oxide (SnO2) films to NH3 gas. J. Appl. Phys. 2016, 119, 164502. [Google Scholar] [CrossRef]
- Pathak, A.; Mishra, S.K.; Gupta, B.D. Fiber-optic ammonia sensor using Ag/SnO2 thin films: Optimization of thickness of SnO2 film using electric field distribution and reaction factor. Appl. Opt. 2015, 54, 8712–8721. [Google Scholar] [CrossRef] [PubMed]
- Lefferts, M.J.; Castell, M.R. Ammonia breath analysis. Sens. Diagn. 2022, 1, 955–967. [Google Scholar] [CrossRef]
- Challener, W.; Ollmann, R.; Kam, K. A surface plasmon resonance gas sensor in acompact disc’format. Sens. Actuators B Chem. 1999, 56, 254–258. [Google Scholar] [CrossRef]
- Mishra, S.K.; Bhardwaj, S.; Gupta, B.D. Surface Plasmon Resonance-Based Fiber Optic Sensor for the Detection of Low Concentrations of Ammonia Gas. IEEE Sens. J. 2014, 15, 1235–1239. [Google Scholar] [CrossRef]
- Gahlot, A.; Paliwal, A.; Kapoor, A. The Exploitation of SnO2/Polypyrrole Interface for the Sensing of Ammonia Vapors Using SPR Technique: A Theoretical and Experimental Analysis. 2022. Available online: https://assets.researchsquare.com/files/rs-1428599/v1/329cb39d-a2d4-4203-996a-c090080084e5.pdf?c=1647523774 (accessed on 23 September 2022).
- Shinbo, K.; Komai, R.; Honda, H.; Ohdaira, Y.; Baba, A.; Kato, K.; Kaneko, F. Ammonia Gas Detection under Various Humidity Conditions Using Waveguide Surface Plasmon Resonance Spectroscopy. Anal. Sci. 2017, 33, 443–447. [Google Scholar] [CrossRef] [Green Version]
- Paliwal, A.; Sharma, A.; Tomar, M.; Gupta, V. Dielectric Properties of SnO2 Thin Film Using SPR Technique for Gas Sensing Applications. Conf. Pap. Sci. 2014, 2014, 656120. [Google Scholar] [CrossRef]
- Bhatia, P.; Gupta, B.D. Surface plasmon resonance based fiber optic ammonia sensor utilizing bromocresol purple. Plasmonics 2013, 8, 779–784. [Google Scholar] [CrossRef]
- Mishra, S.K.; Tripathi, S.; Choudhary, V.; Gupta, B.D. Fiber optic ammonia gas sensor utilizing surface plasmon resonance of reduced graphene oxide. In Proceedings of the JSAP-OSA Joint Symposia 2013, Kyoto Japan, 16–20 September 2013. [Google Scholar] [CrossRef]
- Zhao, Y.; Zhang, S.; Wen, G.; Han, Z. Optical fiber gas sensor based on graphene nanometer functional materials. Instrum. Sci. Technol. 2018, 46, 12–27. [Google Scholar] [CrossRef]
- Komai, R.; Honda, H.; Baba, A.; Shinbo, K.; Kato, K.; Kaneko, F. Simultaneous detection of ammonia and water vapors using surface plasmon resonance waveguide sensor. In Proceedings of the 2014 International Symposium on Electrical Insulating Materials, Niigata City, Japan, 1–5 June 2014; pp. 284–286. [Google Scholar]
- Jin, Z.; Su, Y.; Duan, Y. Development of a polyaniline-based optical ammonia sensor. Sens. Actuators B Chem. 2001, 72, 75–79. [Google Scholar] [CrossRef]
- Mohtajeb, M.; Abdi, Y. Localized Surface Plasmon Resonance of Reduced Graphene Oxide/Ag Hybrid for Gas Sensing Application. IEEE Sens. J. 2018, 18, 9222–9229. [Google Scholar] [CrossRef]
- Pandey, S.; Goswami, G.K.; Nanda, K.K. Green synthesis of biopolymer–silver nanoparticle nanocomposite: An optical sensor for ammonia detection. Int. J. Biol. Macromol. 2012, 51, 583–589. [Google Scholar] [CrossRef] [PubMed]
- Pastoriza-Santos, I.; Kinnear, C.; Pérez-Juste, J.; Mulvaney, P.; Liz-Marzán, L. Plasmonic polymer nanocomposites. Nat. Rev. Mater. 2018, 3, 375–391. [Google Scholar] [CrossRef]
- Detsri, E.; Popanyasak, J. Fabrication of silver nanoparticles/polyaniline composite thin films using layer-by-layer self-assembly technique for ammonia sensing. Colloids Surf. A: Physicochem. Eng. Asp. 2015, 467, 57–65. [Google Scholar] [CrossRef]
- Jarmoshti, J.A.; Nikfarjam, A.; Hajghassem, H.; Banihashemian, S.M. Visible light enhancement of ammonia detection using silver nanoparticles decorated on reduced graphene oxide. Mater. Res. Express 2019, 6, 066306. [Google Scholar] [CrossRef]
- Qiu, Z.; Xue, Y.; Li, J.; Zhang, Y.; Liang, X.; Wen, C.; Gong, H.; Zeng, J. Highly sensitive colorimetric detection of NH3 based on Au@ Ag@ AgCl core-shell nanoparticles. Chin. Chem. Lett. 2021, 32, 2807–2811. [Google Scholar] [CrossRef]
- Amirjani, A.; Fatmehsari, D.H. Colorimetric detection of ammonia using smartphones based on localized surface plasmon resonance of silver nanoparticles. Talanta 2018, 176, 242–246. [Google Scholar] [CrossRef]
- Pande, S.A. Green Synthesis of Biopolymer-Silver Nanocomposites for Gas Sensing. Adv. Sci. Technol. 2016, 99, 54–60. [Google Scholar] [CrossRef]
- Nengsih, S.; Umar, A.; Salleh, M.; Yahaya, M. Detection of volatile organic compound gas using localized surface plasmon resonance of gold nanoparticles. Sains Malays. 2011, 40, 231–235. [Google Scholar]
- Tomer, A.K.; Rahi, T.; Neelam, D.K.; Dadheech, P.K. Cyanobacterial extract-mediated synthesis of silver nanoparticles and their application in ammonia sensing. Int. Microbiol. 2018, 22, 49–58. [Google Scholar] [CrossRef]
- Mishra, S.K.; Prasood, U.S.; Gupta, B.D. Fiber Optic LSPR Gas Sensor utilizing ZnO nanoparticles for ammonia sensing. In Proceedings of the International Conference on Fibre Optics and Photonics, Kharagpur, India, 13–16 December 2014. [Google Scholar]
- Dubas, S.T.; Pimpan, V. Green synthesis of silver nanoparticles for ammonia sensing. Talanta 2008, 76, 29–33. [Google Scholar] [CrossRef]
- Prabhash, P.; Haritha, V.; Nair, S.S.; Pilankatta, R. Localized surface plasmon resonance based highly sensitive room temperature pH sensor for detection and quantification of ammonia. Sens. Actuators B Chem. 2017, 240, 580–585. [Google Scholar] [CrossRef]
- Tabassum, S.; Kumar, R.; Dong, L. Plasmonic Crystal-Based Gas Sensor Toward an Optical Nose Design. IEEE Sens. J. 2017, 17, 6210–6223. [Google Scholar] [CrossRef]
- Yadav, J.; Rani, A.; Singh, V.; Murari, B.M. Prospects and limitations of non-invasive blood glucose monitoring using near-infrared spectroscopy. Biomed. Signal Process. Control. 2015, 18, 214–227. [Google Scholar] [CrossRef]
- Yu, Z.; Jiang, N.; Kazarian, S.; Tasoglu, S.; Yetisen, A. Optical sensors for continuous glucose monitoring. Prog. Biomed. Eng. 2021, 3, 022004. [Google Scholar] [CrossRef]
- Jang, S.; Xu, C. Review of Emerging Approaches in Non-Or Minimally Invasive Glucose Monitoring and Their Application to Physiological Human Body Fluids. 2018. Available online: https://academicworks.cuny.edu/ny_pubs/423/ (accessed on 22 September 2022).
- Wang, Y.; Zhao, C.; Wang, J.; Luo, X.; Xie, L.; Zhan, S.; Kim, J.; Wang, X.; Liu, X.; Ying, Y. Wearable plasmonic-metasurface sensor for noninvasive and universal molecular fingerprint detection on biointerfaces. Sci. Adv. 2021, 7, eabe4553. [Google Scholar] [CrossRef]
- Xu, K.; Zhou, R.; Takei, K.; Hong, M. Toward flexible surface-enhanced Raman scattering (SERS) sensors for point-of-care diagnostics. Adv. Sci. 2019, 6, 1900925. [Google Scholar] [CrossRef]
- Liu, Y.; Asset, T.; Chen, Y.; Murphy, E.; Potma, E.O.; Matanovic, I.; Fishman, D.A.; Atanassov, P. Facile All-Optical Method for In Situ Detection of Low Amounts of Ammonia. Iscience 2020, 23, 101757. [Google Scholar] [CrossRef]
- Wei, F.; Zhong, Y.; Luo, H.; Wu, Y.; Fu, J.; He, Q.; Cheng, J.; Na, J.; Yamauchi, Y.; Liu, S. Soft template-mediated coupling construction of sandwiched mesoporous PPy/Ag nanoplates for rapid and selective NH3 sensing. J. Mater. Chem. A 2021, 9, 8308–8316. [Google Scholar] [CrossRef]
- Kasztelan, M.; Słoniewska, A.; Gorzkowski, M.; Lewera, A.; Pałys, B.; Zoladek, S. Ammonia modified graphene oxide—Gold nanoparticles composite as a substrate for surface enhanced Raman spectroscopy. Appl. Surf. Sci. 2021, 554, 149060. [Google Scholar] [CrossRef]
- Kumar, P.; Soni, M.; Arora, T.; Sharma, S. 2D Colloidal Crystals Based SERS Sensors for NH3 Detection. In Proceedings of the 2015 IEEE International Symposium on Nanoelectronic and Information Systems, Indore, India, 21–23 December 2015; pp. 277–280. [Google Scholar]
- Kwon, S.; Kim, C.; Kim, K.; Jung, H.; Kang, H. Effect of Ag NPs-decorated carbon nanowalls with integrated Ni-Cr alloy microheater for sensing ammonia and nitrogen dioxide gas. J. Alloys Compd. 2023, 932, 167551. [Google Scholar] [CrossRef]
- Vijayarangamuthu, K.; Rath, S. Nanoparticle size, oxidation state, and sensing response of tin oxide nanopowders using Raman spectroscopy. J. Alloys Compd. 2014, 610, 706–712. [Google Scholar] [CrossRef]


Disclaimer/Publisher’s Note: The statements, opinions and data contained in all publications are solely those of the individual author(s) and contributor(s) and not of MDPI and/or the editor(s). MDPI and/or the editor(s) disclaim responsibility for any injury to people or property resulting from any ideas, methods, instructions or products referred to in the content. |
© 2023 by the authors. Licensee MDPI, Basel, Switzerland. This article is an open access article distributed under the terms and conditions of the Creative Commons Attribution (CC BY) license (https://creativecommons.org/licenses/by/4.0/).
Share and Cite
Usman, F.; Ghazali, K.H.; Muda, R.; Dennis, J.O.; Ibnaouf, K.H.; Aldaghri, O.A.; Alsadig, A.; Johari, N.H.; Jose, R. Detection of Kidney Complications Relevant Concentrations of Ammonia Gas Using Plasmonic Biosensors: A Review. Chemosensors 2023, 11, 119. https://doi.org/10.3390/chemosensors11020119
Usman F, Ghazali KH, Muda R, Dennis JO, Ibnaouf KH, Aldaghri OA, Alsadig A, Johari NH, Jose R. Detection of Kidney Complications Relevant Concentrations of Ammonia Gas Using Plasmonic Biosensors: A Review. Chemosensors. 2023; 11(2):119. https://doi.org/10.3390/chemosensors11020119
Chicago/Turabian StyleUsman, Fahad, Kamarul Hawari Ghazali, Razali Muda, John Ojur Dennis, Khalid Hassan Ibnaouf, Osamah A. Aldaghri, Ahmed Alsadig, Nasrul Hadi Johari, and Rajan Jose. 2023. "Detection of Kidney Complications Relevant Concentrations of Ammonia Gas Using Plasmonic Biosensors: A Review" Chemosensors 11, no. 2: 119. https://doi.org/10.3390/chemosensors11020119