Article

Proximate and Underlying Deforestation Causes in a Tropical Basin through Specialized Consultation and Spatial Logistic Regression Modeling

by
Wenseslao Plata-Rocha
1,
Sergio Alberto Monjardin-Armenta
1,*,
Carlos Eduardo Pacheco-Angulo
2,
Jesus Gabriel Rangel-Peraza
3,
Cuauhtemoc Franco-Ochoa
1 and
Zuriel Dathan Mora-Felix
3
1
Facultad de Ciencias de la Tierra y el Espacio, Universidad Autonoma de Sinaloa, Culiacan 80013, Mexico
2
Facultad de Ciencias Forestales y Ambientales, Universidad de los Andes, Merida 5110, Venezuela
3
Division de Estudios de Posgrado e Investigacion, Tecnologico Nacional de Mexico—Instituto Tecnologico de Culiacan, Culiacan 80220, Mexico
*
Author to whom correspondence should be addressed.
Land 2021, 10(2), 186; https://doi.org/10.3390/land10020186
Submission received: 23 December 2020 / Revised: 22 January 2021 / Accepted: 8 February 2021 / Published: 11 February 2021

Abstract

:
The present study focuses on identifying and describing the possible proximate and underlying causes of deforestation and its factors using the combination of two techniques: (1) specialized consultation and (2) spatial logistic regression modeling. These techniques were implemented to characterize the deforestation process qualitatively and quantitatively, and then to graphically represent the deforestation process from a temporal and spatial point of view. The study area is the North Pacific Basin, Mexico, from 2002 to 2014. The map difference technique was used to obtain deforestation using the land-use and vegetation maps. A survey was carried out to identify the possible proximate and underlying causes of deforestation, with the aid of 44 specialized government officials, researchers, and people who live in the surrounding deforested areas. The results indicated total deforestation of 3938.77 km2 in the study area. The most important proximate deforestation causes were agricultural expansion (53.42%), infrastructure extension (20.21%), and wood extraction (16.17%), and the most important underlying causes were demographic factors (34.85%), economics factors (29.26%), and policy and institutional factors (22.59%). Based on the spatial logistic regression model, the factors with the highest statistical significance were forestry productivity, the slope, the altitude, the distance from population centers with fewer than 2500 inhabitants, the distance from farming areas, and the distance from natural protected areas.

1. Introduction

According to the Forest Resources Assessment (FRA), the worldwide annual rate of deforestation has decreased from a rate of 16 million ha/year from 1990 to 2000 to 10 million ha/year in 2015–2020 [1]. Deforestation and forest degradation rates are alarming, since they are responsible for approximately 20% of the carbon dioxide (CO2) that is globally emitted to the atmosphere [2,3]. For this reason, international organizations created the program for the Reduction of Emissions from Deforestation and Forest Degradation (REDD+), which addresses climate change through the mitigation of deforestation and degradation of forest areas, with the additional goal of preserving carbon stocks and their sustainability [4].
The participation of developing countries is requested. Therefore, a strategy or an action plan at a national level is needed to meet with REDD+ goals. These strategies must ensure the full and active participation of relevant stakeholders, such as aboriginal groups and local communities, and must tackle the most important causes of deforestation and forest degradation [5].
Causative pattern studies have been performed to describe the causes of deforestation and forest degradation, explaining how the loss of forest cover has occurred [6,7]. These studies have contributed to the reduction of uncertainty about the spatial and temporal occurrence of future forest deforestation and degradation processes. In addition, the ecological impact on the land caused by deforestation has been also reported [8,9], which is mainly related to climate variations, water quality degradation, soil erosion, and biodiversity loss [10,11,12].
Several methodologies have been used to understand the causes of deforestation. The causative pattern studies of deforestation have been focused on analyzing the proximate and underlying causes and their interlinkages [13,14]. Some case studies at a local or regional level have examined the causes of deforestation empirically, through an extensive bibliographical review [15,16,17,18,19]. Other studies have carried out surveys to describe proximate and underlying causes of deforestation [20,21,22,23,24,25]. These causes are related to the expansion of agricultural lands, forest exploitation, mining, expansion of human settlements, population growth, and socio-economic activities. In addition, recent studies have taken into account local perceptions and reported other causes of deforestation, such as the use of firewood for tobacco curing, brick production, and domestic use, as well as the development of subsistence agriculture, which represents an economic income in marginalized regions [26,27,28,29]. The use of mathematical modeling, such as regression models [30,31,32], neural artificial networks [33,34], agent-based models [35], cellular automats [36,37,38,39], multilevel statistical models [40,41], and remote sensing techniques [42,43], has been also reported to describe the causes of deforestation.
In Mexico, linear regression models have been widely used to model deforestation and land-use changes [44,45,46,47,48,49,50]. These studies have recognized that the most important cause is the conversion of forest land to agricultural use. However, recent studies using generalized additive models [51] indicates that land tenure is a critical factor in driving the decision to deforest. By using geographically weighted regression [52], the slope of the land was identified as the most important deforestation factor for all types of forest in the state of Mexico, since this factor facilitates or hinders the expansion of agriculture and urban expansion. The weights of evidence technique [53] has been used to identify an increase in induced grasslands, which in turn represents the main cause of forest loss. Specialized consultation has suggested that agricultural expansion and infrastructure extension are the main causes of forest loss [54].
The present study focuses on identifying and describing the possible causes of deforestation in the North Pacific Basin in Mexico from 2002 to 2014. The main contribution of the present study consists of the integration of techniques and methodologies that better describe the proximate and underlying causes of deforestation. First, a survey was carried out with the aid of specialized government officials, researchers, and people who live in the surrounding deforested areas to identify the possible causes of deforestation and their related factors. Such surveys represented the basis for the determination of the variables used for the development of the spatial logistic regression (SLR) model. Finally, the behavior of deforestation in the North Pacific basin was modeled from a spatial and temporal point of view.

2. Materials and Methods
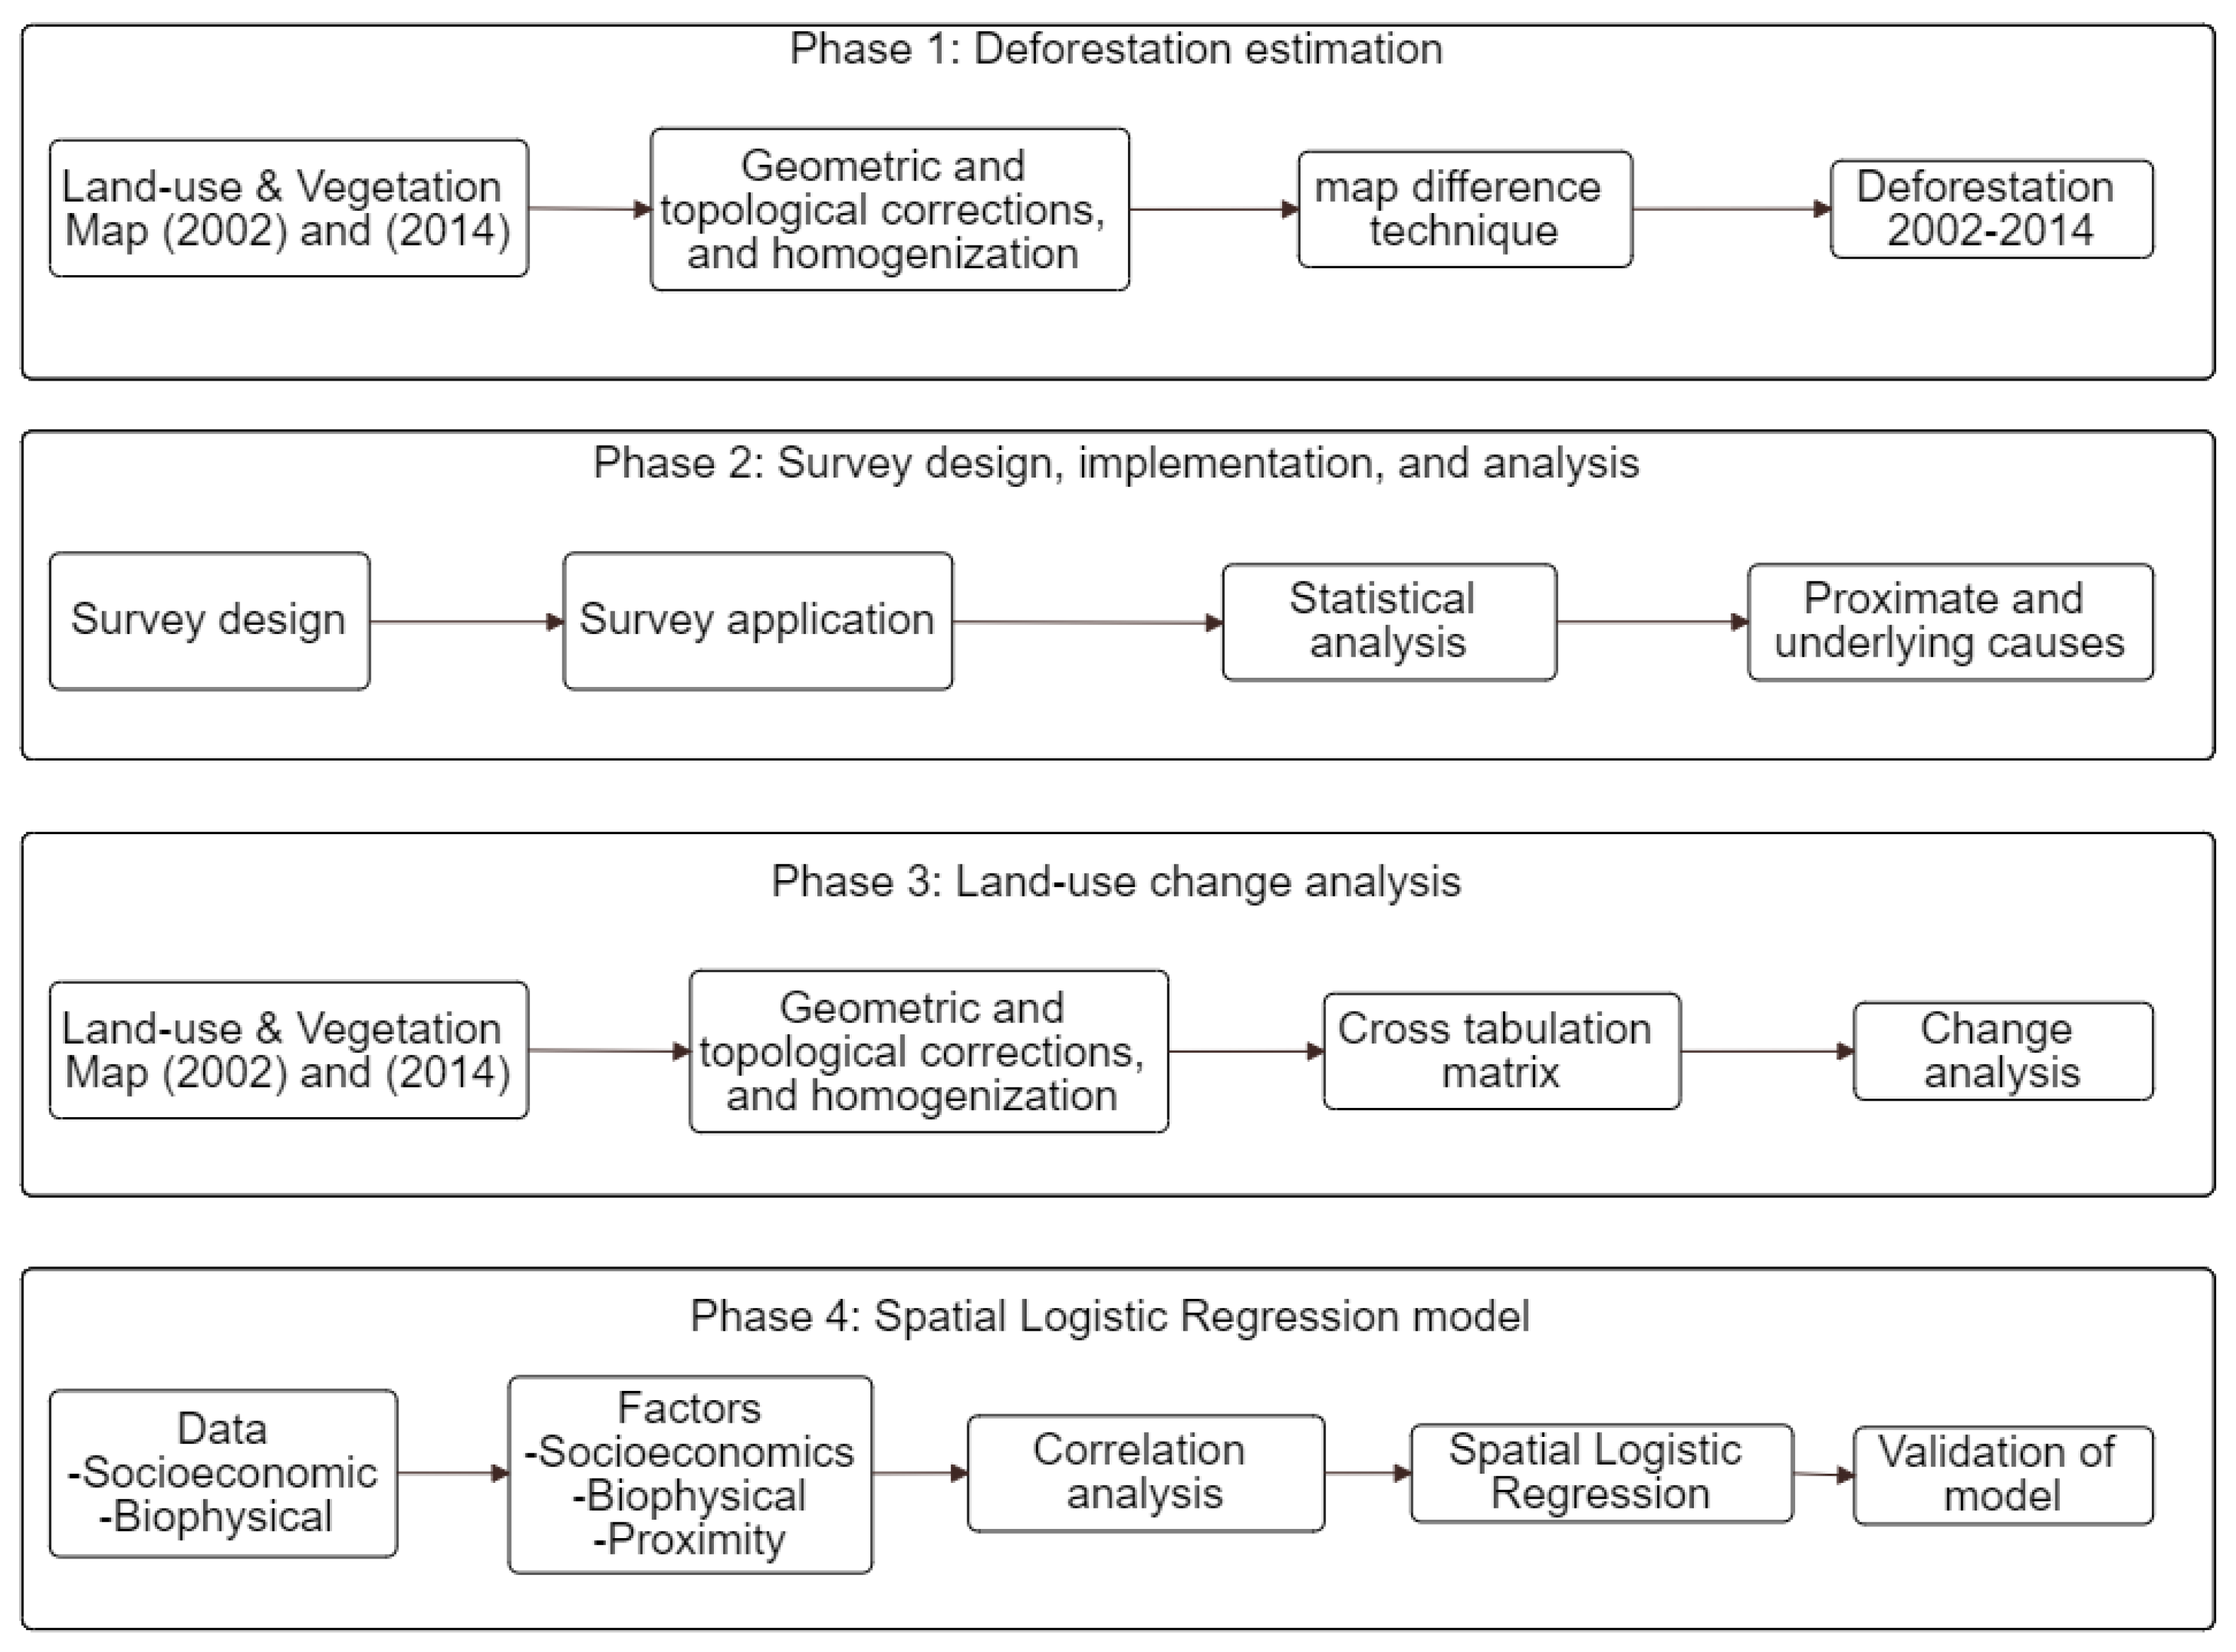
2.1. Methodology

The proposed methodology was developed under the following scheme: first, the deforestation was estimated in the study area. Then, officials and local people were consulted to identify the possible proximate and underlying causes of deforestation. An analysis of land-use change was carried out to compare the perceptions obtained from surveys with the land-use changes observed in the study area. Finally, the deforestation factors were determined based on the bibliographic review and the results obtained from the identification of the proximate and underlying causes of deforestation through the survey. This set of factors was used for the development of the spatial logistics regression model. This model was then validated using the total operating characteristic index. Finally, an analysis of the linkages between the factors and the proximate and underlying causes of deforestation was carried out (Figure 1).

2.1.1. Deforestation Estimation

The land-use and vegetation (LUV) map provided by the National Institute of Statistics and Geography (INEGI) from 2002 to 2014 were used to estimate deforestation, considering only two land categories: forest (primary and secondary coniferous, oak, mountain mesophilic, deciduous, evergreen, sub-deciduous forest, and cultivated forest) and non-forest (all other categories). The forest cover loss analysis was carried out by using the map difference technique. The deforestation was obtained in hectares, and the annual average deforestation rate was estimated according to the equation proposed by [55] Equation (1).
Annual   average   deforestation   rate   = ( ( B 1 B 2 ) 100 ) B 1 N
where: B 1   and B 2 are the forest covers on different dates, and N is the number of years evaluated.

2.1.2. Survey Design, Implementation, and Analysis

The purpose of the survey was to identify the possible proximate and underlying causes of deforestation from 2002 to 2014. In this study, the survey design, implementation, and analysis were based on the conceptual framework proposed by Geist and Lambin [13]. As proximate causes, five main factors were identified: agricultural expansion (permanent cultivation, shifting cultivation, cattle ranching, and new agricultural areas), wood extraction (commercial wood extraction, fuelwood extraction, and farm improvement), infrastructure extension (transport infrastructure, settlement expansion, and public services), mining operations (metal mining and non-metal mining), and social trigger events (population displacements, social disorder, and drug trafficking). The underlying causes were classified in five factors: demographic (migration and population growth), economic (market growth and commercialization, economic structure, and urbanization and industrialization), technological (land factors, agro-technological changes, and labor factors), policy and institutional (formal policies, policy climate, and property rights), and cultural (attitude, values and beliefs, individual and household behavior).
The survey was applied to 44 specialized officials in different government departments (economic, ecological, environmental, and forest protection government departments). These officials are affiliated with different agencies, such as the Secretariat of Environment and Natural Resources (SEMARNAT), the National Forestry Commission (CONAFOR), the National Water Commission (CONAGUA), the National Commission of Protected Areas (CONANP), the Federal Attorney for Environmental Protection (PROFEPA), and the Ministry of Communication and Transportation (SCT). Researchers affiliated with the Autonomous University of Sinaloa and 10 people who live in the surrounding areas with higher deforestation were also consulted to reinforce and enrich the opinion of the officials. The opinions obtained through the surveys were summarized by using the frequencies of the occurrence of causes. The frequencies were expressed as a percentage to carry out an individual analysis of each cause and to determine their importance with regard to deforestation processes.

2.1.3. Land-Use Change Analysis

An analysis of land-use changes was carried out using the methodology developed by Pontius et al. [56]. The LUV maps provided by INEGI at a scale of 1:250,000 were homogenized in 10 categories (aquaculture, agriculture, human settlements, forest, water bodies, mangrove, scrubs, other lands, pasturelands, and hydrophilic vegetation), and topologically and geometrically corrected. The cross-tabulation matrix was applied to obtain the gains and losses for each land-use category. This methodology also recognized the land-use exchanges experienced between categories in the period 2002 and 2014. In particular, the most important transitions were identified, which verified the results (causal elements) obtained from the specialized consultation on the causes of deforestation. From this matrix, the gains Equation (2) and losses Equation (3) were determined.
G i j = P + j P j j
L i j = P j + P i i
where G i j is the gain column, representing the proportion of the landscape that experienced an increase between 2002 and 2014; P + j denotes the sum of the proportion of the landscape in category j in 2014; and P j j denotes the proportion of the landscape that shows persistence of category j. In addition, L i j represent the loss that each category had between 2002 and 2014, P j + denotes the sum of the proportion of the landscape in category i in 2002, and P i i denotes the proportion of the landscape that shows persistence of category i.

2.1.4. Determining the Factors of Deforestation

An extensive literature review, the survey results, and the land-use change analysis were the basis for determining the factors of deforestation in the North Pacific Basin. In this sense, the proximate and underlying causes of deforestation were related to a group of geographic variables that could explain these causes in a map [52,57]. Due to the number of variables that can be a cause of deforestation in the study basin, they were divided into three groups: (a) socioeconomic (population growth, population density, and marginalization index), (b) biophysical (altitude, slope, forest productivity, mean annual precipitation, soil moisture, and temperature), and (c) proximity-related (distance from natural protected areas, distance from agricultural areas, distance from pasture areas, distance from roads, distance from hydrography, distance from localities with less than 2500 inhabitants, distance from mines, and distance from human settlements) [9,33,52,53].
Different algorithms were used to obtain factors from the variables: the inverse distance weighted was used to model the socioeconomic factors [58] and the Euclidean distance algorithm was used to obtain all the proximity factors [53]. The slope of the terrain was obtained from the digital elevation model [59].
Once the factors were obtained, a Pearson correlation analysis was carried out to examine the correlation between the variables. A high correlation between paired factors is recognized when the Pearson coefficient (r) is greater than 0.75. This exploratory data analysis was used to identify the factors that must be excluded to avoid the model overestimation [60].

2.1.5. Spatial Logistic Regression (SLR) Model

The SLR model was adjusted using the IDRISI TerrSet software [61], based on the factors that were previously defined [62]. Deforestation was established as the dependent binary variable during the period of study. The dependent variable represents the presence or absence of an event, where 1 = deforested areas and 0 = non-deforested areas in each observation or pixel (Equation (4)):
log i t Y = 1 Y = 0 = P 1 P =   β 0 + β 1 x 1 + β 2 x 2 + + β k x k
where β i represents the parameter for each variable estimated by the model, and x i is the factor included in the model ( i = 1 ,   2 ,   ,   k ); finally, P is the probability that a non-deforested pixel will become deforested.
According to [63], a comparison between the coefficients obtained in the model must be carried out. In this sense, standardized coefficients were determined using Equation (5):
B S T D = β D S π 2 3
where B S T D is the standardized coefficient of each variable in the model, D S is the standard deviation of each variable, and π is approximately equal to 3.141592654.

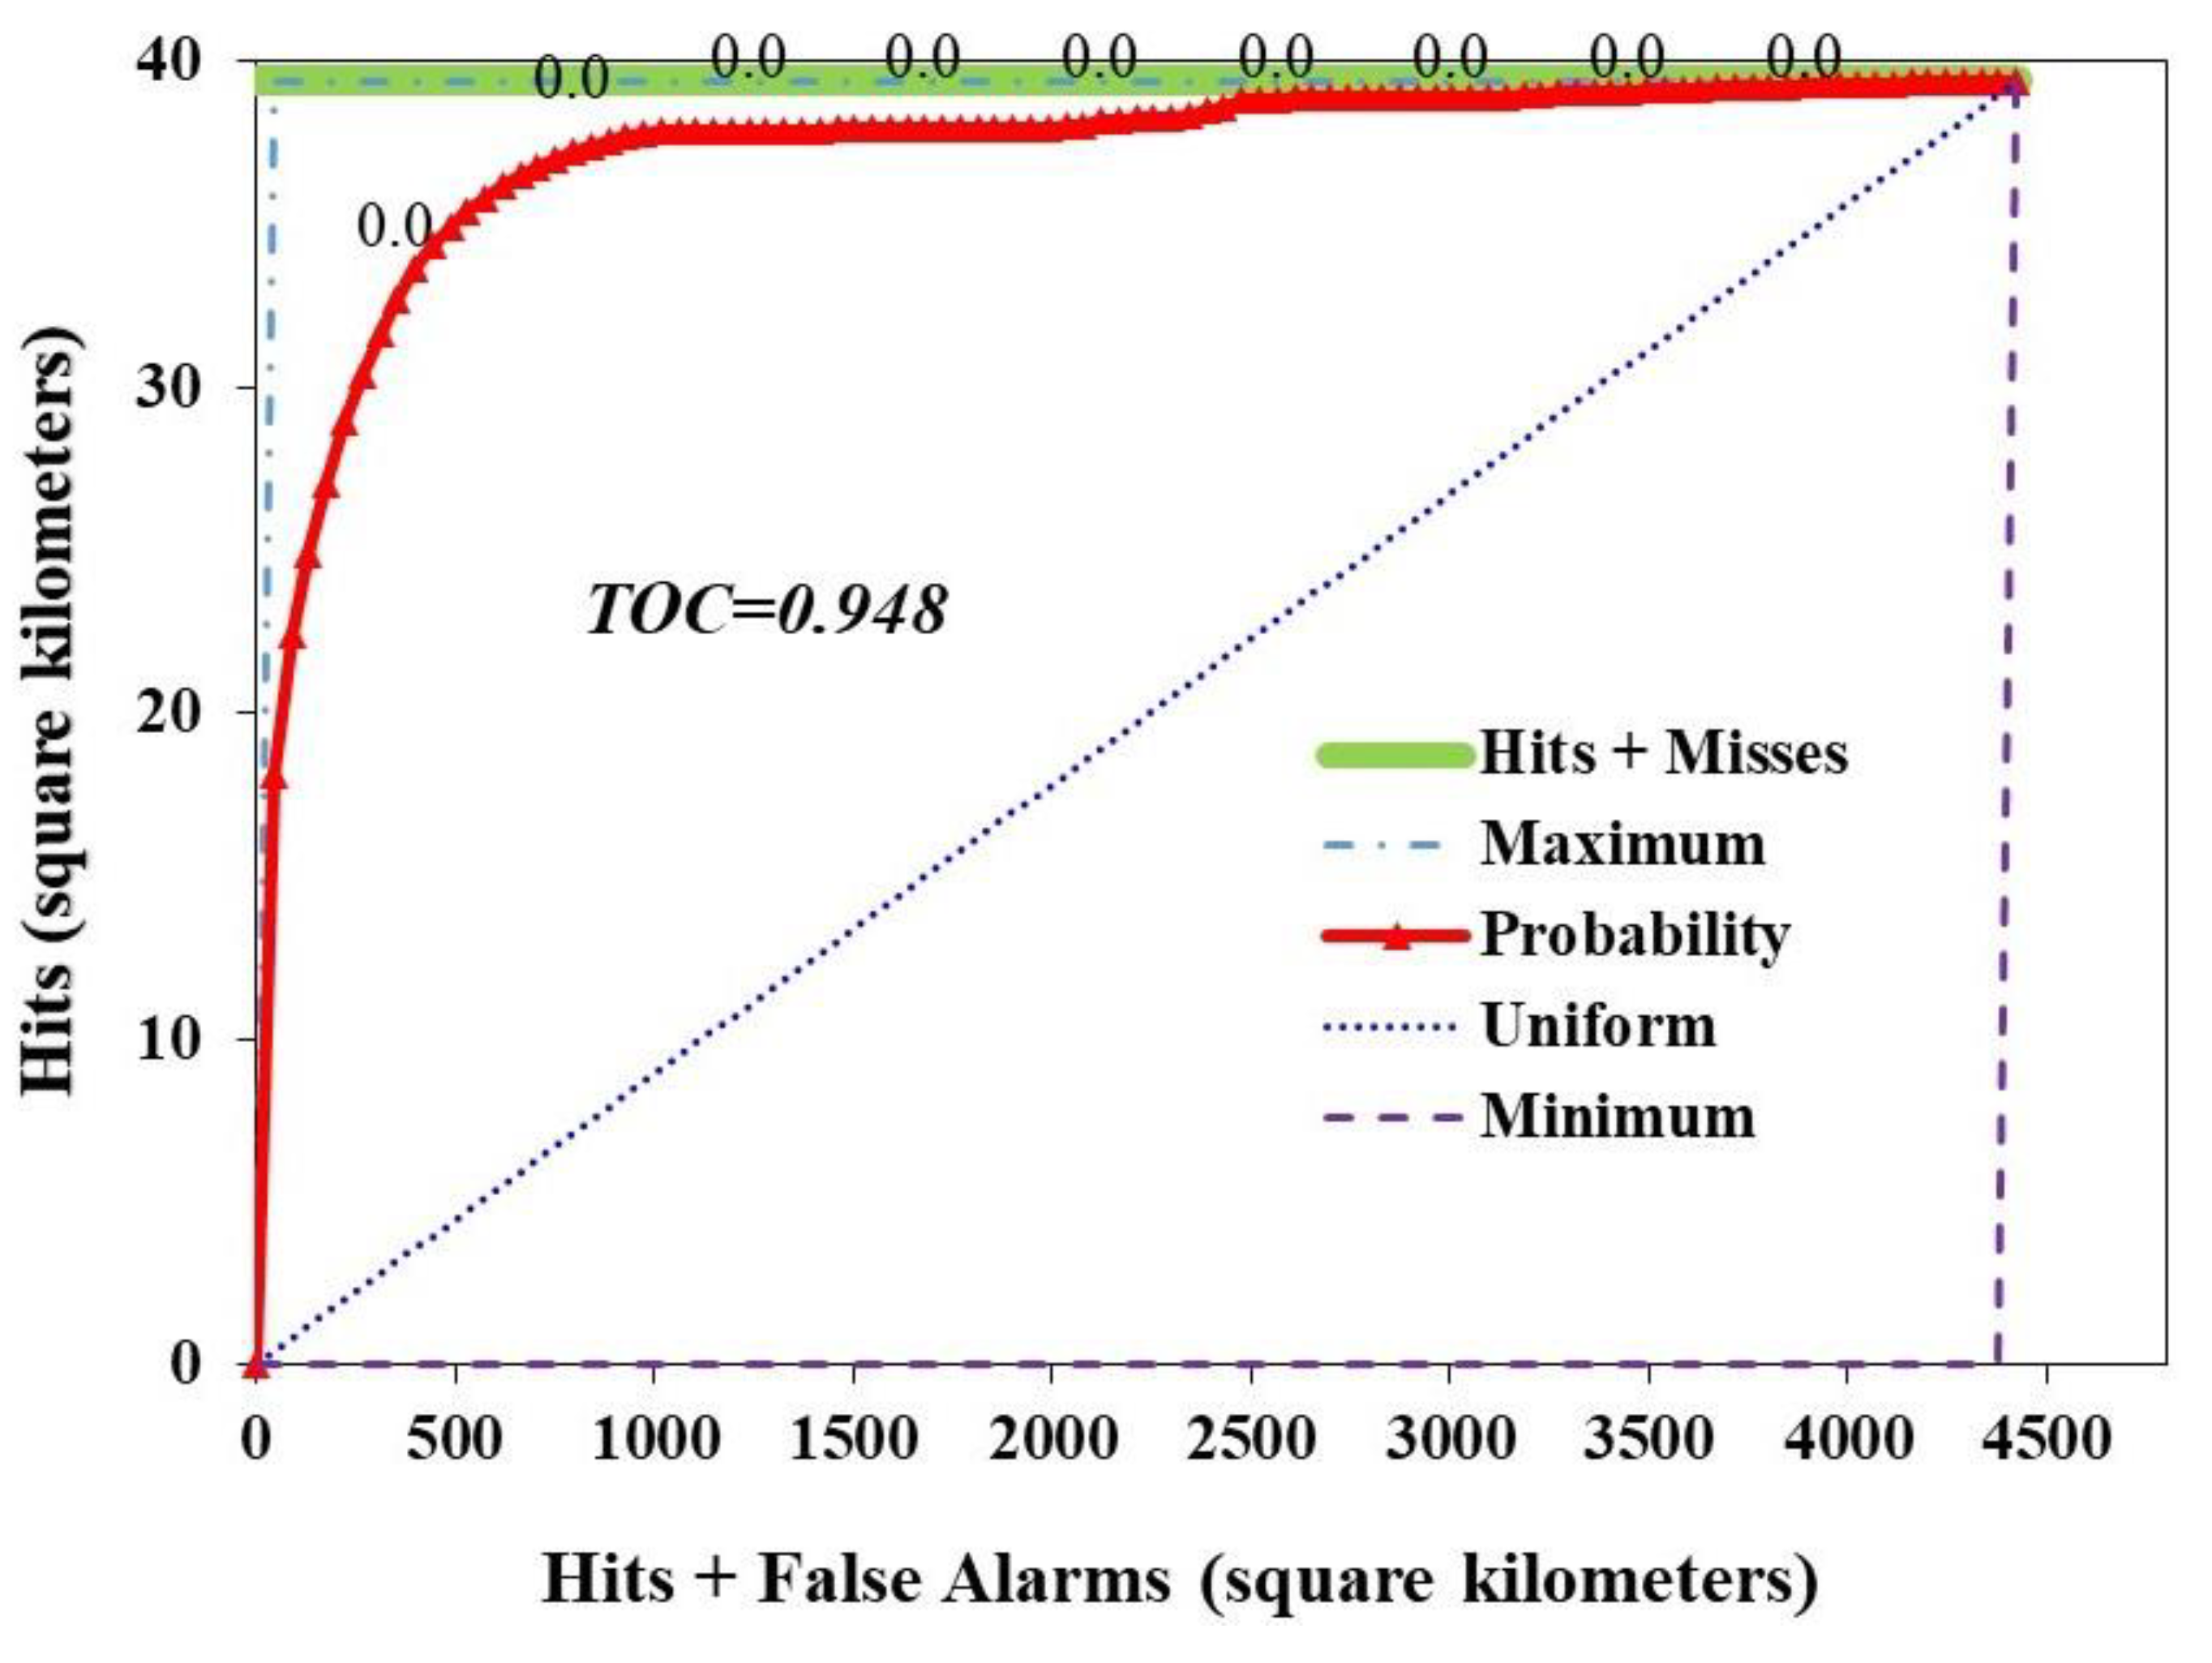
2.1.6. Evaluation of the SLR Model
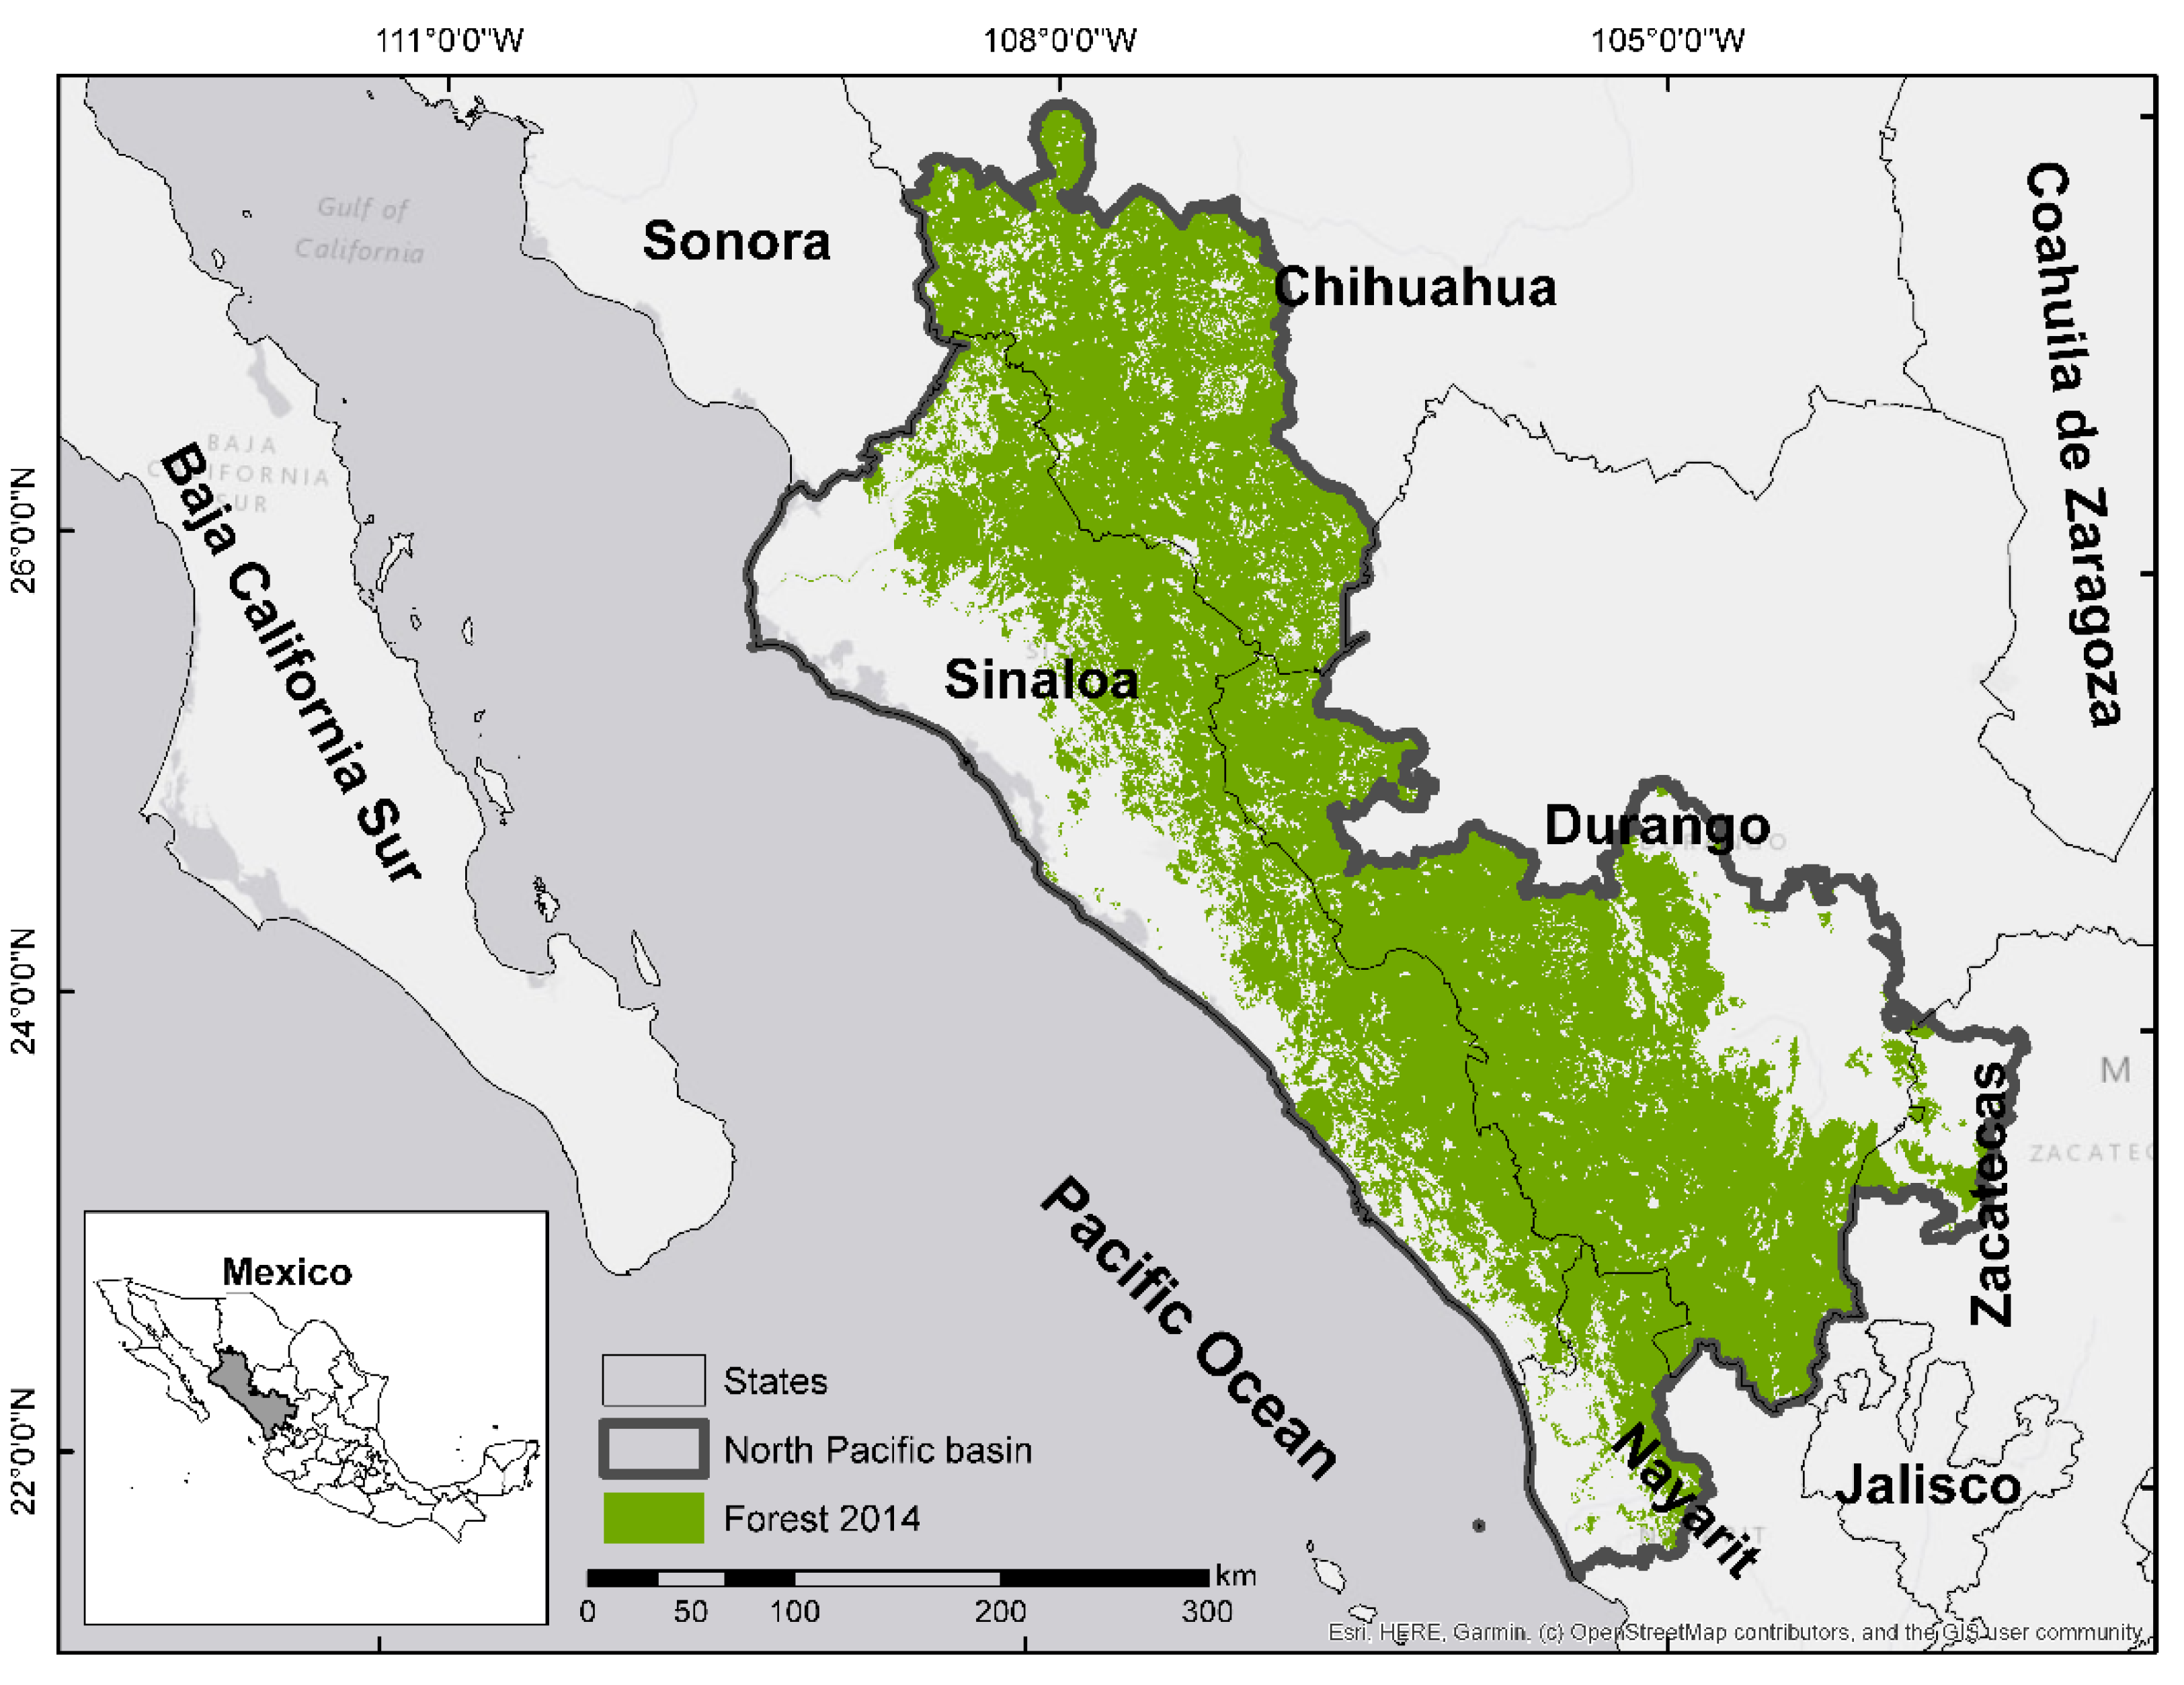
Total operating characteristic (TOC) was used to indicate the degree of adjustment of the spatial model [64]. The TOC diagram shows the model capacity to determine the land susceptibility to deforestation in different spatial locations. The model sensitivity is represented by the true positive percentage, while the model specificity is measured by the false positive percentage. Both sensitivity and specificity parameters were calculated to better understand the factors of deforestation with a greater certainty [65,66].
The results obtained in the SLR model of deforestation were contrasted with the qualitative and quantitative results acquired from the specialized consultation. The causative elements of deforestation complemented the mathematical modeling. The interlinkages between the proximate and underlying causes and the synergies between the techniques used in the present study were analyzed and discussed to better understand the process of forest cover loss.

2.2. Study Area

The North Pacific Basin is comprised of the total territory of Sinaloa state and part of the Chihuahua (11.75%), Durango (42.54%), Zacatecas (6.04%), and Nayarit (32.53%) state territories. The study basin has a surface area of 152,013 km2, which is equivalent to 8.0% of the Mexican territory (Figure 2). The population of the basin is around 4,466,000 inhabitants [67]. The land-use changes due to the socioeconomic activities carried out in the basin have caused adverse effects on ecosystems, such as degradation, a decrease of aquifer levels, the alteration of the water cycle, and biodiversity loss [68].

2.3. Data

Vector, raster, and alphanumeric information were collected from different government institutions (Table 1). A thematic, topological, geometric analysis, and a series of spatial operations were applied to homogenize the information. Such homogenization was made with a pixel size of 100 m.

3. Results and Discussions

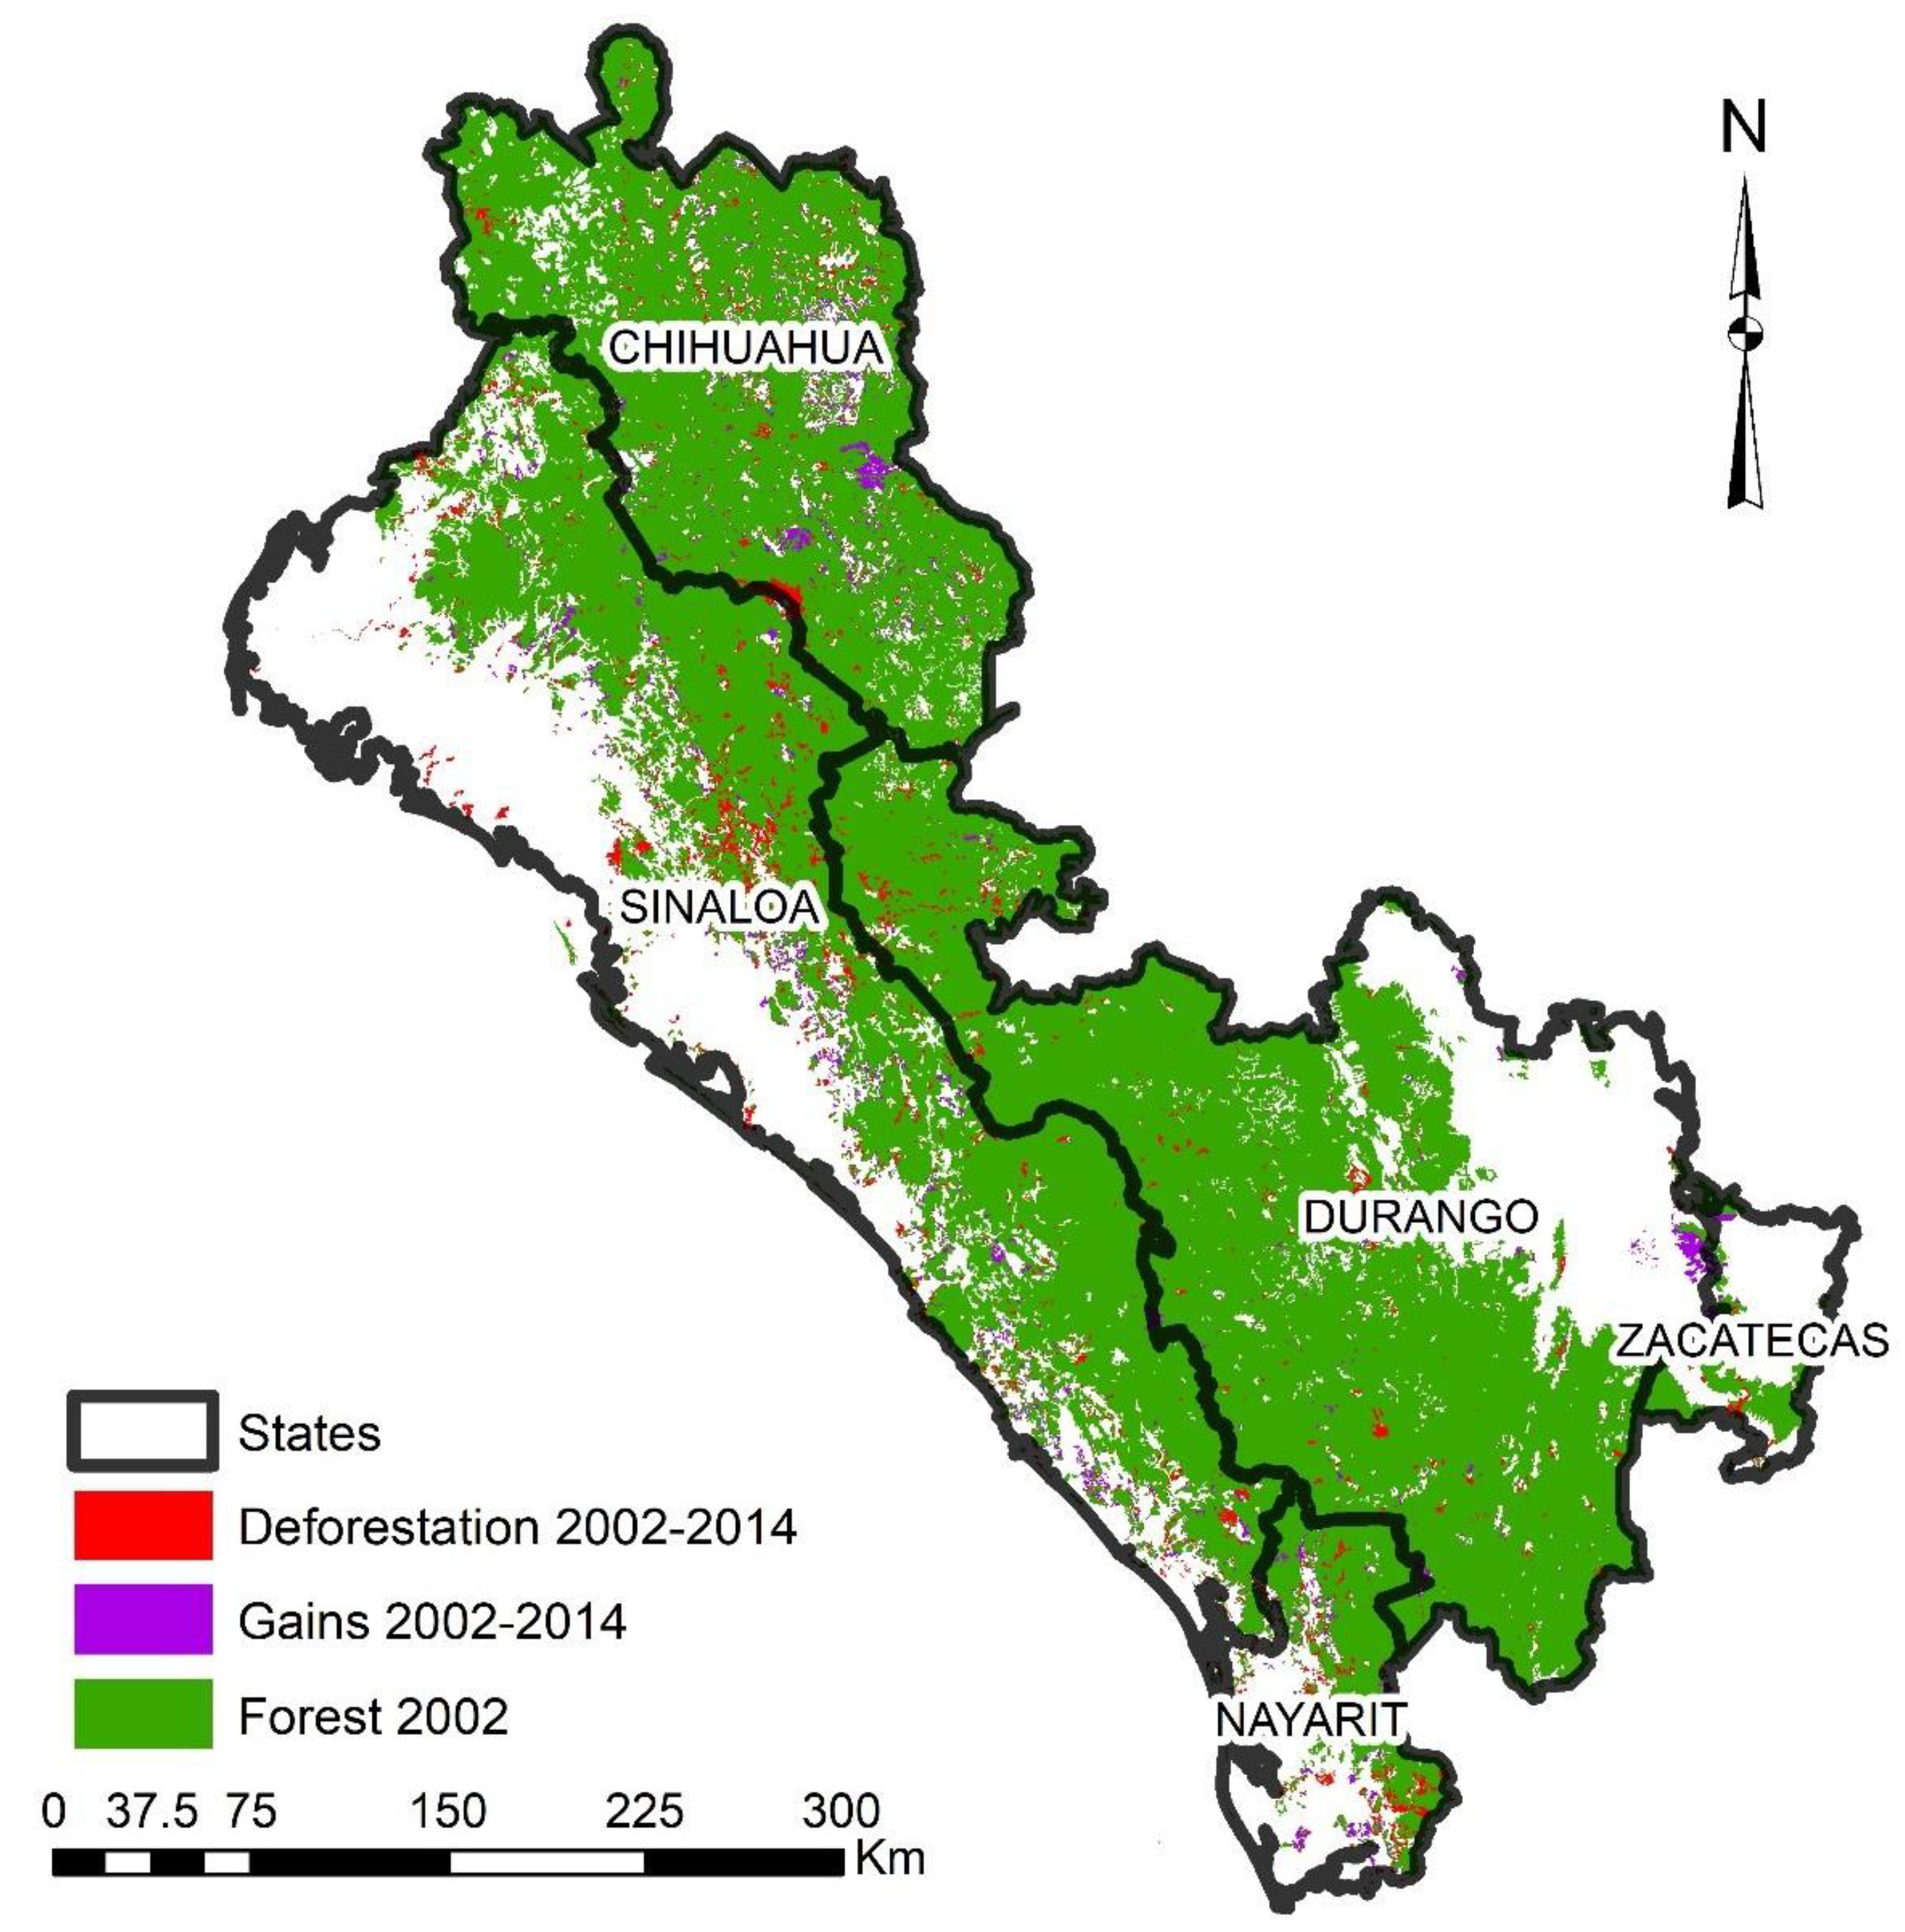
3.1. Deforestation Estimation

From 2002 to 2014, a forest cover loss of 3938.77 km2 was detected in the North Pacific Basin. This forest area represented 3.95% of the total forest in 2002. In contrast, the forest cover gain was about 2507.39 km2, which was characterized principally by natural recovery (Table 2). The forest recovery area represented 1.64% of the North Pacific Basin area. The balance between forest cover loss and gain was negative; therefore, the net loss of forest coverage was 1431.38 km2 (Figure 3).
The annual average deforestation rate in the North Pacific Basin was 0.11%. This deforestation rate was higher than the one presented by the Global Forest Watch (GFW) program, which suggested 0.07% for the period of 2002–2014 in the study area [69]. The difference between both deforestation rates was because the GFW program does not consider deforestation in primary and secondary deciduous, evergreen, and sub-deciduous forests. The annual average deforestation rate from 2000 to 2010, as indicated by the Food and Agriculture Organization (FAO), was 0.40% for Mexico as a whole country [70], which is higher than the deforestation rate obtained in this work.

3.2. Survey Analysis

The frequency analysis of the occurrence of proximate causes identified that the main forest loss processes were agricultural expansion (53.42%), followed by the infrastructure extension (20.21%) and wood extraction (16.17%) (Table 3). These results coincide with those mentioned by Geist and Lambin [13] and Monjardín-Armenta et al. [54], who also recognized that agricultural expansion and infrastructure extension are the main proximate causes of deforestation of tropical forests. The most important proximate sub-causes of deforestation were permanent cultivation (19.00%), shifting cultivation (15.18%), cattle ranching (13.15%), commercial wood extraction (11.23%), and transport infrastructure (8.36%). These five proximate sub-causes explain a total of 73.8% of the occurrence of proximate causes of deforestation in the North Pacific Basin.
The frequency analysis of the occurrence of underlying causes identified that the demographic (34.85%), economic (29.26%), and policy and institutional factors (22.59%) were the main underlying forces of deforestation (Table 3). These results coincide with those mentioned by Pacheco et al. [24]. In particular, the population growth (27.52%), market growth and commercialization (13.91%), policy climate (11.89%), and economic structure (10.23%) were identified as the most important underlying sub-causes of deforestation in the North Pacific Basin (Table 3).
The opinion of the people living within the affected areas corroborated the opinion of the specialized officials. Also, the people living in the study area provided specific information about the possible causes of deforestation, such as the cultivation of cannabis and poppy and the establishment of synthetic drug laboratories. These causes are very specific to the study area, and they can be considered as deforestation causes in areas located closed to the mountainous areas of the basin.

3.3. Land-Use Change Analysis

The dynamics of land-uses were estimated through the cross-tabulation matrix (Table 4). The main diagonal of the matrix indicates the land surfaces that remained stable in both periods, which are also called persistence. The land-use change analysis shows that the categories with the highest gains were agriculture (3926.95 km2), forest (2507.65 km2), and pasturelands (1759.71 km2), but also these same categories showed the greatest losses, with cover changes of 2272.28 km2, 3938.7 km2, and 2082.93 km2, respectively. The most significant forest loss was towards agriculture, with 2492.56 km2, which represented 63.28% of the total loss. Hence, the greatest forest gain was mainly presented in the agricultural and pastureland coverages.
Human settlements are one of the categories that showed the most coverage increase, with an increase of 33.36% concerning its initial surface area. This category also presented the least amount of loss (19.6 km2). Other categories that observed gains were aquaculture, with 39.20%; human settlements, with 30.75%; mangroves, with 6.97%; and agriculture; with 5.6%, while the categories that showed significant losses were hydrophilic vegetation, with 23.04%; water bodies, with 7.96%; scrub, with 5.55%; pastureland, with 2.87%; and forests, with 1.44%.
The results of the cross-tabulation matrix indicated that great coverage of forest was changed to agriculture. These results corroborated that agricultural expansion is one of the main causes of the deforestation processes in the North Pacific Basin. Likewise, since the human settlements category is directly linked to the extension of infrastructure, the land-use change analysis confirms that the human settlement extent is also one of the main causes of the deforestation process in the study area.

3.4. Adjustment and Evaluation of Spatial Logistic Regression (SLR) Model

The SLR model was adjusted to the biophysical, socioeconomic, and proximity variables that were used for the spatial and temporal analysis of the deforestation process. According to the exploratory data analysis (correlation matrix), the temperature was removed from the model to avoid overestimating the regression model, and to minimize the multi-collinearity among the factors of deforestation [60].
The degree of adjustment of the model was calculated using the TOC statistical method (Figure 4). The value obtained for the area under the curve (AUC) of TOC was 0.948. Based on the AUC value obtained, the spatial model demonstrated a reliable and effective discrimination index between the classifications of the true and the false positives. According to [48], an AUC value of 0.7 is acceptable, while a value greater than 0.8 is excellent, and more than 0.9 is exceptional.
The variables included in the SLR model had different units. For this reason, standardized coefficients ( B S T D ) of each factor were obtained to interpret the impact factor of each factor in the model. The significant factors are shown in Table 5. The model results indicate that the most suitable areas to be deforested are those located around the already deforested ones. These areas are characterized by low forest production, with gentle slopes and low altitudes, suitable for perennial or shifting cultivations. Likewise, the model results showed a high probability of losing forest cover around human settlements because of the demand areas for new urban developments and their respective urban services infrastructure.
Figure 5a shows that a large part of the forest cover located in the northwest area of the basin has a probability of being deforested. This area comprises the municipalities of El Fuerte, Sinaloa de Leyva, Guachochi, Chinipas, Batopilas, and Urique. Similarly, Figure 5a(2) reveals another suitable area for deforestation located in the north-central part of the basin. This area comprises the municipalities of Culiacan, Badiraguato, Mocorito, Tamazula, Topia, and Canelas. Furthermore, the spatial model suggests that El Rosario, Escuinapa, Rosamorada, Ruiz, Suchil, and Mezquital municipalities are the most prone areas for losing forest cover in the southeast of the basin.
According to the results of the SLR model, the most significant factors were forest production, slope, altitude, distance from localities with fewer than 2500 habitants, distance from agriculture, and distance from natural protected areas. These factors showed a different impact on the spatial model (Table 5). In particular, most of the proximity factors showed a negative impact. A negative impact indicates that the smaller the distance between the forest cover and roads, agriculture, pastures, mines, hydrography, and human settlements, the higher the probability of deforestation. An exception was observed for the distance from protected natural areas factor, where a positive impact occurs: the smaller the distance, the lower the probability of forest cover loss.
The standardized coefficient ( B S T D ) obtained for the socioeconomic factors shows that the population growth, marginalization index, and population density had a non-significant impact on forest cover loss in the basin. The socioeconomic factors showed a weak statistical relationship, since they do not present a single independent effect on deforestation processes, as reported in other studies [53,71].
Regarding the biophysical factors, most of them showed a negative significant impact. Therefore, the most suitable areas for deforestation were identified at lower-altitude terrains. According to spatial model results, gentle slope areas or low forest production areas were also the most suitable areas for deforestation. Based on the model results, biophysical and proximity factors play essential roles in the forest cover and land-use changes, as has also been suggested by Lambin et al. [72].
The specialized consultation about causative deforestation elements is consistent with other studies conducted in different parts of the world [13,20,21,22,54,73]. The consultation technique identified the main causes of deforestation in the North Pacific Basin. In the present study, the agricultural extension, urban creation, and rural and industrial infrastructure were driven mainly by demographic factors, such as population growth and the economic development of the region.
The opinion of people who live in the deforested areas provided a reference about the specific causes of deforestation in some places. They revealed essential data about the harmful practices of authorities, such as corruption, underlying unsustainable logging practices, improper rights regimes for the possession and land use, the lack of culture and education, and the limited economic development. The opinions also evidenced that some areas that were previously used for forestry now are used for agriculture practice. In mountain areas, the deforested areas are used for the cultivation of marijuana and poppy, and to establish laboratories for the development of synthetic drugs, which have caused migrations and a series of social trigger events.
Table 6 shows the factors that were related to some proximate or underlying causes or sub-causes of deforestation. The socioeconomic factors were directly related to the demographic pressure, particularly to population growth, since the higher the population is, the greater the demand for wood, as is the demand for territorial extensions for agricultural, urban, and industrial purposes. Similarly, the marginalization index reflects different concerns, such as the economic situation, education level, and housing situation of the population. Therefore, a higher value of the marginalization index is related to greater deforested areas for domestic use.
The biophysical factors were associated with topographical characteristics, such as altitude and slope, and climatic features, such as soil moisture and precipitation. Thus, the biophysical factors restricted the land-use change, in particular the underlying deforestation causes related to demographic pressures, such as the expansion of agricultural borders, road infrastructure, and urban and rural settlement expansion.
The proximity factors related to forest cover loss were the distance from localities with fewer than 2500 habitants, distance from the agricultural expansion border, and distance to natural protected areas. The SLR model results confirm that the probability of forest cover loss increases when the distance between the forest and the areas modified by man decreases.
One disadvantage of the SLR model was the difficulty of spatially representing the interlinkage between proximate or underlying causes or sub-causes of deforestation with some factors of deforestation. For this reason, the SLR model was complemented with the qualitative and quantitative information provided by the surveys. In the present study, the social trigger events, such as social disorder, drug traffic, policy climate, and other cultural and technological factors, were not spatially represented, but they were considered in the forest cover loss process.

4. Conclusions

The present study combines the use of two different techniques for identifying and describing the proximate and underlying deforestation causes in the North Pacific Basin: SLR spatial modeling and specialized consultation. The combined use of both techniques provided some advantages over the variety of existing causative deforestation studies, such as characterizing and representing the temporal and spatial behavior of the deforestation process. The deforestation model identified the forest areas that were most suitable for deforestation. Such information could be used to determine and alert priority forest management areas.
Most of the deforestation studies only report numerical or spatial behavior. However, these studies fail to characterize the qualitative causes of the deforestation process. In this sense, the present study can be used to describe the spatial behavior of deforestation processes, but also as an alternative methodology that can be extrapolated to assess the factors of deforestation in other tropical regions. Understanding land-use changes is critical for reducing uncertainty about the spatial and temporal occurrence of future deforestation. This study contributes to adequate forest planning, which could mitigate greenhouse gas emissions. Besides, the present study could be the basis for the generation of forest restoration and management programs and the conservation of natural resources.
Finally, the present study contributed to the development of mitigation strategies for deforestation and forest degradation, due to the root proximate and underlying deforestation causes were identified at a local level. By using the proposed methodology, decision-makers could define the governmental priorities, which in turn could allow tracking and reducing the specific activities that produce changes in the forest cover over time.

Author Contributions

Conceptualization, W.P.-R., S.A.M.-A. and C.E.P.-A.; methodology, W.P.-R. and S.A.M.-A.; software, W.P.-R., J.G.R.-P. and Z.D.M.-F.; validation, C.F.-O. and S.A.M.-A., formal analysis, W.P.-R., S.A.M.-A., C.E.P.-A. and J.G.R.-P.; investigation, W.P.-R. and S.A.M.-A.; writing—original draft preparation, W.P.-R, S.A.M.-A., C.F.-O. and J.G.R.-P. All authors have read and agreed to the published version of the manuscript.

Funding

This research received no external funding.

Institutional Review Board Statement

Not applicable.

Informed Consent Statement

Not applicable.

Data Availability Statement

Not applicable.

Acknowledgments

Thanks to the Faculty of Earth and Space Sciences and the Autonomous University of Sinaloa.

Conflicts of Interest

The authors declare no conflict of interest.

References

  1. FAO. Global Forest Resources Assessment 2020 Key Findings 2020. Available online: http://www.fao.org/3/CA8753EN/CA8753EN.pdf (accessed on 23 June 2020).
  2. Cadman, T.; Maraseni, T.; Ma, H.O.; Lopez-Casero, F. Five years of REDD+ governance: The use of market mechanisms as a response to anthropogenic climate change. For. Policy Econ. 2017, 79, 8–16. [Google Scholar] [CrossRef]
  3. Houghton, R. Carbon emissions and the drivers of deforestation and forest degradation in the tropics. Curr. Opin. Environ. Sustain. 2012, 4, 597–603. [Google Scholar] [CrossRef]
  4. Nathan, I.; Pasgaard, M. Is REDD+ effective, efficient, and equitable? Learning from a REDD+ project in Northern Cambodia. Geoforum 2017, 83, 26–38. [Google Scholar] [CrossRef]
  5. FAO. Empowered Lives. Resilient Nations. The UN-REDD Programme is the United Nations Collaborative Initiative on Reducing Emissions from Deforestation and Forest Degradation (REDD+) in Developing Countries. 2013. Available online: http://www.fao.org/3/a-bc395e.pdf (accessed on 23 September 2020).
  6. Van Khuc, Q.; Tran, B.Q.; Meyfroidt, P.; Paschke, M.W. Drivers of deforestation and forest degradation in Vietnam: An exploratory analysis at the national level. For. Policy Econ. 2018, 90, 128–141. [Google Scholar] [CrossRef]
  7. Samndong, R.A.; Bush, G.; Vatn, A.; Chapman, M. Institutional analysis of causes of deforestation in REDD+ pilot sites in the Equateur province: Implication for REDD+ in the Democratic Republic of Congo. Land Use Policy 2018, 76, 664–674. [Google Scholar] [CrossRef]
  8. Aquino, A.; Guay, B. Implementing REDD+ in the Democratic Republic of Congo: An analysis of the emerging national REDD+ governance structure. For. Policy Econ. 2013, 36, 71–79. [Google Scholar] [CrossRef]
  9. Bax, V.; Francesconi, W.; Quintero, M. Spatial modeling of deforestation processes in the Central Peruvian Amazon. J. Nat. Conserv. 2016, 29, 79–88. [Google Scholar] [CrossRef]
  10. Moonen, P.C.; Verbist, B.; Schaepherders, J.; Meyi, M.B.; Van Rompaey, A.; Muys, B. Actor-based identification of deforestation drivers paves the road to effective REDD+ in DR Congo. Land Use Policy 2016, 58, 123–132. [Google Scholar] [CrossRef]
  11. Salvini, G.; Herold, M.; De Sy, V.; Kissinger, G.; Brockhaus, M.; Skutsch, M. How countries link REDD+ interventions to drivers in their readiness plans: Implications for monitoring systems. Environ. Res. Lett. 2014, 9, 074004. [Google Scholar] [CrossRef] [Green Version]
  12. Wang, X.; Zhang, Y.; Yan, E.; Huang, G.; Cao, C.; Ni, X. Deforestation area estimation in China based on Landsat data. In Proceedings of the 2014 IEEE Geoscience and Remote Sensing Symposium, Quebec City, QC, Canada, 13–18 July 2014; IEEE: Piscataway, NJ, USA, 2014; pp. 4254–4256. [Google Scholar]
  13. Geist, H.J.; Lambin, E.F. What Drives Tropical Deforestation? A Meta-Analysis of Proximate and Underlying Causes of Deforestation Based on Subnational Case Study Evidence; Louvain-la-Neuve (Belgium). 2001. Available online: http://www.pik-potsdam.de/~luedeke/lucc4.pdf (accessed on 27 August 2019).
  14. Geist, H.J.; Lambin, E.F. Proximate Causes and Underlying Driving Forces of Tropical DeforestationTropical forests are disappearing as the result of many pressures, both local and regional, acting in various combinations in different geographical locations. Bioscience 2002, 52, 143–150. [Google Scholar] [CrossRef]
  15. Hosonuma, N.; Herold, M.; De Sy, V.; De Fries, R.S.; Brockhaus, M.; Verchot, L.; Angelsen, A.; Romijn, E. An assessment of deforestation and forest degradation drivers in developing countries. Environ. Res. Lett. 2012, 7, 044009. [Google Scholar] [CrossRef]
  16. Lambin, E.F.; Geist, H.J.; Lepers, E. Dynamics Ofland-use Andland-Coverchange in TropicalL Regions. Annu. Rev. Environ. Resour. 2003, 28, 205–241. [Google Scholar] [CrossRef] [Green Version]
  17. Lambin, E.F.; Meyfroidt, P. Land use transitions: Socio-ecological feedback versus socio-economic change. Land Use Policy 2010, 27, 108–118. [Google Scholar] [CrossRef]
  18. Rudel, T.K.; De Fries, R.; Asner, G.P.; Laurance, W.F. Changing Drivers of Deforestation and New Opportunities for Conservation. Conserv. Biol. 2009, 23, 1396–1405. [Google Scholar] [CrossRef]
  19. Weatherley-Singh, J.; Gupta, A. Drivers of deforestation and REDD+ benefit-sharing: A meta-analysis of the (missing) link. Environ. Sci. Policy 2015, 54, 97–105. [Google Scholar] [CrossRef]
  20. Defourny, P.; Delhage, C.; Kibambe Lubamba, J.-P. Analyse Quantitative des Causes de la Deforestation et de la Degradation des Forets en Republique Democratique du Congo—UN-REDD Programme Collaborative Online Workspace. 2011. Available online: https://www.unredd.net/documents/un-redd-partner-countries-181/africa-335/democratic-republic-of-the-congo-189/studies-publications-and-other-resources-500/15896-analyse-quantitative-des-causes-de-la-deforestation-et-de-la-degradation-des-forets-en-republique-democratique-du-congo-rapport-final.html?path=un-redd-partner-countries-181/africa-335/democratic-republic-of-the-congo-189/studies-publications-and-other-resources-500 (accessed on 25 August 2020).
  21. Mecnt Etude sur les Moteurs de la Deforestation: Etape de Validation. 2012. Available online: https://wwfeu.awsassets.panda.org/downloads/_a6_etude_qualitative_moteurs_deforestation_degradation.pdf (accessed on 10 August 2020).
  22. MECNT. Etude Qualitative sur les Causes de la Déforestation et de la Dégradation des Forêts en République Démocratique du Congo. 2012. Available online: https://www.unredd.net/documents/un-redd-partner-countries-181/africa-335/democratic-republic-of-the-congo-189/15160-etude-qualitative-sur-les-causes-de-la-deforestation-et-de-la-degradation-des-forets-en-republique-democratique-du-congo.html?path=un-redd-partner-countries-181/africa-335/democratic-republic-of-the-congo-189 (accessed on 12 August 2020).
  23. Armenta, S.A.M.; Angulo, C.E.P.; Rocha, W.P.; Barraza, G.C.; Andrade, R.R.; Gonzalez, J.C.B. Determination and Analysis of Hot Spot Areas of Deforestation Using Remote Sensing and Geographic Information System Techniques. Case Study: State Sinaloa, México. Open J. For. 2016, 6, 295–304. [Google Scholar] [CrossRef] [Green Version]
  24. Angulo, C.E.P.; Aguado, M.I.; Mollicone, D. Identification and characterization of deforestation hot spots in Venezuela using MODIS satellite images. Acta Amaz. 2014, 44, 185–196. [Google Scholar] [CrossRef] [Green Version]
  25. Madalcho, A.B.; Mena, M.M.; Badeso, B.B. Causes and Impacts of Deforestation and Forest Degradation at Duguna Fango Woreda. Int. J. Nat. Resour. Ecol. Manag. 2020, 5, 14. [Google Scholar] [CrossRef]
  26. Twongyirwe, R.; Bithell, M.; Richards, K.S.; Rees, W. Do livelihood typologies influence local perceptions of forest cover change? Evidence from a tropical forested and non-forested rural landscape in western Uganda. J. Rural Stud. 2017, 50, 12–29. [Google Scholar] [CrossRef] [Green Version]
  27. Twongyirwe, R.; Bithell, M.; Richards, K.S. Revisiting the drivers of deforestation in the tropics: Insights from local and key informant perceptions in western Uganda. J. Rural Stud. 2018, 63, 105–119. [Google Scholar] [CrossRef] [Green Version]
  28. Ngwira, S.; Watanabe, T. An Analysis of the Causes of Deforestation in Malawi: A Case of Mwazisi. Land 2019, 8, 48. [Google Scholar] [CrossRef] [Green Version]
  29. Zeb, A.; Hamann, A.; Armstrong, G.W.; Acuna-Castellanos, D. Identifying local actors of deforestation and forest degradation in the Kalasha valleys of Pakistan. For. Policy Econ. 2019, 104, 56–64. [Google Scholar] [CrossRef]
  30. Etter, A.; McAlpine, C.; Pullar, D.; Possingham, H. Modelling the conversion of Colombian lowland ecosystems since 1940: Drivers, patterns and rates. J. Environ. Manag. 2006, 79, 74–87. [Google Scholar] [CrossRef]
  31. Serneels, S.; Lambin, E.F. Proximate causes of land-use change in Narok District, Kenya: A spatial statistical model. Agric. Ecosyst. Environ. 2001, 85, 65–81. [Google Scholar] [CrossRef] [Green Version]
  32. Wyman, M.S.; Stein, T.V. Modeling social and land-use/land-cover change data to assess drivers of smallholder deforestation in Belize. Appl. Geogr. 2010, 30, 329–342. [Google Scholar] [CrossRef]
  33. Mas, J. Modelling deforestation using GIS and artificial neural networks. Environ. Model. Softw. 2004, 19, 461–471. [Google Scholar] [CrossRef]
  34. Mayfield, H.; Smith, C.; Gallagher, M.; Hockings, M. Use of freely available datasets and machine learning methods in predicting deforestation. Environ. Model. Softw. 2017, 87, 17–28. [Google Scholar] [CrossRef] [Green Version]
  35. Manson, S.M.; Evans, T. Agent-based modeling of deforestation in southern Yucatan, Mexico, and reforestation in the Midwest United States. Proc. Natl. Acad. Sci. USA 2007, 104, 20678–20683. [Google Scholar] [CrossRef] [PubMed] [Green Version]
  36. Basse, R.M.; Omrani, H.; Charif, O.; Gerber, P.; Bódis, K. Land use changes modelling using advanced methods: Cellular automata and artificial neural networks. The spatial and explicit representation of land cover dynamics at the cross-border region scale. Appl. Geogr. 2014, 53, 160–171. [Google Scholar] [CrossRef]
  37. Behera, M.D.; Borate, S.N.; Panda, S.N.; Behera, P.R.; Roy, P.S. Modelling and analyzing the watershed dynamics using Cellular Automata (CA)–Markov model – A geo-information based approach. J. Earth Syst. Sci. 2012, 121, 1011–1024. [Google Scholar] [CrossRef] [Green Version]
  38. Berberoğlu, S.; Akın, A.; Clarke, K.C. Cellular automata modeling approaches to forecast urban growth for adana, Turkey: A comparative approach. Landsc. Urban Plan. 2016, 153, 11–27. [Google Scholar] [CrossRef]
  39. Jantz, C.A.; Goetz, S.J.; Donato, D.; Claggett, P. Designing and implementing a regional urban modeling system using the SLEUTH cellular urban model. Comput. Environ. Urban Syst. 2010, 34, 1–16. [Google Scholar] [CrossRef]
  40. López-Carr, D.; Davis, J.; Jankowska, M.M.; Grant, L.; López-Carr, A.C.; Clark, M. Space versus place in complex human–natural systems: Spatial and multi-level models of tropical land use and cover change (LUCC) in Guatemala. Ecol. Model. 2012, 229, 64–75. [Google Scholar] [CrossRef] [Green Version]
  41. Overmars, K.P.; Verburg, P.H. Multilevel modelling of land use from field to village level in the Philippines. Agric. Syst. 2006, 89, 435–456. [Google Scholar] [CrossRef]
  42. Austin, K.G.; Schwantes, A.M.; Gu, Y.; Kasibhatla, P.S. What causes deforestation in Indonesia? Environ. Res. Lett. 2018, 14, 024007. [Google Scholar] [CrossRef]
  43. Hidayat, T.A. Spatial Analysis of Causes of Deforestation in Indonesia. 2019. Available online: https://edepot.wur.nl/504239 (accessed on 20 December 2020).
  44. Alix-Garcia, J. A spatial analysis of common property deforestation. J. Environ. Econ. Manag. 2007, 53, 141–157. [Google Scholar] [CrossRef]
  45. Ellis, E.A.; Baerenklau, K.A.; Marcos-Martínez, R.; Chávez, E. Land use/land cover change dynamics and drivers in a low-grade marginal coffee growing region of Veracruz, Mexico. Agrofor. Syst. 2010, 80, 61–84. [Google Scholar] [CrossRef] [Green Version]
  46. Ellis, E.A.; Montero, J.A.R.; Gómez, I.U.H.; Porter-Bolland, L.; Ellis, P.W. Private property and Mennonites are major drivers of forest cover loss in central Yucatan Peninsula, Mexico. Land Use Policy 2017, 69, 474–484. [Google Scholar] [CrossRef]
  47. López-Barrera, F.; Manson, R.H.; Landgrave, R. Identifying deforestation attractors and patterns of fragmentation for seasonally dry tropical forest in central Veracruz, Mexico. Land Use Policy 2014, 41, 274–283. [Google Scholar] [CrossRef]
  48. Miranda-Aragón, L.; Treviño-Garza, E.J.; Jiménez-Pérez, J.; Aguirre-Calderón, O.A.; González-Tagle, M.A.; Pompa-García, M.; Aguirre-Salado, C.A.; Treviño-Garza, E. Modeling susceptibility to deforestation of remaining ecosystems in North Central Mexico with logistic regression. J. For. Res. 2012, 23, 345–354. [Google Scholar] [CrossRef]
  49. Morales-Barquero, L.; Borrego, A.; Skutsch, M.; Kleinn, C.; Healey, J.R. Identification and quantification of drivers of forest degradation in tropical dry forests: A case study in Western Mexico. Land Use Policy 2015, 49, 296–309. [Google Scholar] [CrossRef] [Green Version]
  50. Chowdhury, R.R. Landscape change in the Calakmul Biosphere Reserve, Mexico: Modeling the driving forces of smallholder deforestation in land parcels. Appl. Geogr. 2006, 26, 129–152. [Google Scholar] [CrossRef]
  51. Vaca, R.A.; Golicher, D.J.; Rodiles-Hernández, R.; Castillo-Santiago, M.Á.; Bejarano, M.; Navarrete-Gutiérrez, D.A. Drivers of deforestation in the basin of the Usumacinta River: Inference on process from pattern analysis using generalised additive models. PLoS ONE 2019, 14, e0222908. [Google Scholar] [CrossRef] [PubMed]
  52. Jaimes, N.B.P.; Sendra, J.B.; Delgado, M.G.; Plata, R.F. Exploring the driving forces behind deforestation in the state of Mexico (Mexico) using geographically weighted regression. Appl. Geogr. 2010, 30, 576–591. [Google Scholar] [CrossRef]
  53. Caussel, J.F.M.; Osorio, L.P.; Guerra, F.; Maass, M. Análisis y modelación de los procesos de deforestación: Un caso de estudio en la cuenca del río Coyuquilla, Guerrero, México. Investig. Geogr. 2015, 60–74. [Google Scholar] [CrossRef] [Green Version]
  54. Monjardín-Armenta, S.A.; Angulo, C.E.P.; Plata-Rocha, W.; Corrales-Barraza, G. La deforestación y sus factores causales en el estado de Sinaloa, México. Madera Bosques 2017, 23, 7. [Google Scholar] [CrossRef] [Green Version]
  55. Sader, S.A.; Joyce, A.T. Deforestation Rates and Trends in Costa Rica, 1940 to 1983. Biotropica 1988, 20, 11. [Google Scholar] [CrossRef]
  56. Pontius, R.G.; Shusas, E.; McEachern, M. Detecting important categorical land changes while accounting for persistence. Agric. Ecosyst. Environ. 2004, 101, 251–268. [Google Scholar] [CrossRef]
  57. Shehzad, K.; Qamer, F.M.; Murthy, M.S.R.; Abbas, S.; Bhatta, L.D. Deforestation trends and spatial modelling of its drivers in the dry temperate forests of northern Pakistan—A case study of Chitral. J. Mt. Sci. 2014, 11, 1192–1207. [Google Scholar] [CrossRef]
  58. Farfán, M.; Mas, J.F.; Osorio, L. Interpolating Socioeconomic Data for the Analysis of Deforestation: A Comparison of Methods. J. Geogr. Inf. Syst. 2012, 4, 358–365. [Google Scholar] [CrossRef] [Green Version]
  59. Manson, S.M.; Burrough, P.A.; McDonnell, R.A. Principles of Geographical Information Systems: Spatial Information Systems and Geostatistics. Econ. Geogr. 1999, 75, 422. [Google Scholar] [CrossRef]
  60. Goodchild, M.F. Spatial Autocorrelation; Hutchins, C.S., Ed.; Geo Books: Norwich, UK, 1986; ISBN 0-86094-223-6. [Google Scholar]
  61. Clark-Labs. IDRISI GIS Analysis in TerrSet. Available online: https://clarklabs.org/terrset/idrisi-gis/ (accessed on 31 January 2019).
  62. Quezada, C.R.; Rocha, W.P. Área Metropolitana de Concepción: Factores Espaciales Explicativos de su Crecimiento Urbano reciente (2001–2009) por Medio de un Modelo de Regresión Logística Espacial. Available online: http://faces.unah.edu.hn/decanato/images/stories/PDF/Revista_Congreso_V2/area_metropolitana_concepcion.pdf (accessed on 16 August 2019).
  63. Menard, S.W. Applied Logistic Regression Analysis; Sage Publications: Thousand Oaks, CA, USA, 2002; ISBN 9780761922087. [Google Scholar]
  64. Jr, R.G.P.; Si, K. The total operating characteristic to measure diagnostic ability for multiple thresholds. Int. J. Geogr. Inf. Sci. 2014, 28, 570–583. [Google Scholar] [CrossRef]
  65. Pontius, R.; Santacruz, A.; Tayyebi, A.; Parmentier, B.; Si, K. How to Run the TOC Package in R. 2015. Available online: https://www.youtube.com/watch?v=1JRwVOi0FSE (accessed on 19 December 2019).
  66. Pontius, R.; Santacruz, A.; Tayyebi, A.; Parmentier, B.; Si, K. Package ‘TOC’. 2015. Available online: https://cran.r-project.org/web/packages/TOC/TOC.pdf (accessed on 19 December 2019).
  67. INEGI. Encuesta Intercensal 2015. Available online: http://www.beta.inegi.org.mx/proyectos/enchogares/especiales/intercensal/ (accessed on 27 August 2019).
  68. Conagua, C.N. Del A. Programa Hídrico Regional Visión 2030. Región Hidrológico-Administrativa III Pacífico Norte. Available online: www.semarnat.gob.mxwww.conagua.gob.mxwww.conagua.gob.mx/conagua07/temas/programashídricosregionales2030.pdf (accessed on 27 August 2019).
  69. Hansen, M.C.; Potapov, P.V.; Moore, R.; Hancher, M.; Turubanova, S.A.; Tyukavina, A.; Thau, D.; Stehman, S.V.; Goetz, S.J.; Loveland, T.R.; et al. High-resolution global maps of 21st-century forest cover change. Science 2013, 342, 850–853. [Google Scholar] [CrossRef] [PubMed] [Green Version]
  70. FAO. Global Forest Resources Assessment 2015 Desk Reference; Food and Agriculture Organization of the United Nations: Rome, Italy, 2015; Available online: http://www.fao.org/3/a-i4808e.pdf (accessed on 28 July 2019).
  71. Vergés, F.A.R.; Velázquez, A.; Bocco, G.; Espejel, I. Multi-scale land cover dynamics of semiarid scrubland in Baja California, Mexico. Reg. Environ. Chang. 2013, 14, 1315–1328. [Google Scholar] [CrossRef]
  72. Lambin, E.F.; Turner, B.L.; Geist, H.J.; Agbola, S.B.; Angelsen, A.; Bruce, J.W.; Coomes, O.T.; Dirzo, R.; Fischer, G.; Folke, C.; et al. The causes of land-use and land-cover change: Moving beyond the myths. Glob. Environ. Chang. 2001, 11, 261–269. [Google Scholar] [CrossRef]
  73. Mahonghol, D. Analyse Qualitative des Causes et Agents de la Déforestation et de la Dégradation des Terres Forestières Dans une RDC Post-Conflit—UN-REDD Programme Collaborative Online Workspace. 2012. Available online: https://unredd.net/documents/un-redd-partner-countries-181/africa-335/democratic-republic-of-the-congo (accessed on 5 November 2019).
Figure 1. Methodological scheme.
Land 10 00186 g001
Figure 2. Location of the North Pacific Basin.
Land 10 00186 g002
Figure 3. Cartography of forest gain and loss from 2002 to 2014.
Land 10 00186 g003
Figure 4. Total operating characteristic (TOC) of the spatial logistics regression model.
Land 10 00186 g004
Figure 5. Deforestation probability map obtained from the spatial logistics regression model (a). (a(1)–a(3)) show the municipalities with the highest probability of deforestation.
Land 10 00186 g005
Table 1. Vector, raster, and alphanumeric data used in the present study.
Data (year)Scale/Resolution and FormatSource
Land-use and vegetation
(LUV) map (2002 and 2014)
1:250,000 VectorialINEGI (National Institute of Statistics and Geography) (http://www.inegi.org.mx/geo/contenidos/recnat/usosuelo/Default.aspx, accessed on 10 July 2020)
Road network (2000)1:50,000 VectorialINEGI (http://www.inegi.org.mx/geo/contenidos/topografia/vectoriales_carreteras.aspx, accessed on 13 July 2020)
Hydrography (2000)1:50,000 VectorialINEGI (http://www.inegi.org.mx/geo/contenidos/recnat/hidrologia/default.aspx, accessed on 16 September 2020)
Mines (2000)1;1,000,000 VectorialINEGI (http://www.beta.inegi.org.mx/app/biblioteca/ficha.html?upc=702825267612, accessed on 5 October 2020)
Mean annual precipitation (2000)1:1,000,000 VectorialINEGI (http://www.beta.inegi.org.mx/app/biblioteca/ficha.html?upc=702825267544, accessed on 8 October 2020)
Temperature (2000)1:1,000,000 VectorialINEGI (http://www.beta.inegi.org.mx/app/biblioteca/ficha.html?upc=702825267551, accessed on 15 October 2020)
Ground humidity1:1,000,000 VectorialINEGI (http://www.beta.inegi.org.mx/app/biblioteca/ficha.html?upc=702825267537, accessed on 5 November 2020)
Natural protected areas
(2010)
1:250,000 VectorialCONANP (National Commission of Protected Areas)
(http://sig.conanp.gob.mx/website/pagsig/info_shape.htm, accessed on 11 June 2020)
Population density (2000, 2015)Locality
numerical
INEGI (http://www3.inegi.org.mx/sistemas/SCITEL/default?ev=3, accessed on 18 May 2020)
Marginalization index (2000)Locality numericalCONAPO (National Population Council) (http://www.conapo.gob.mx/es/CONAPO/Indice_de_marginacion_a_nivel_localidad_2000, accessed on 22 May 2020)
Forest productivity (2012)1:250,000 VectorialCONAFOR (National Forestry Commission) (http://www.cnf.gob.mx:8090/snif/portal/zonificacion, accessed on 25 June 2020)
Digital elevation model
(DEM) (2008)
90 m RasterCSI (Consortium for Spatial Information ) (http://srtm.csi.cgiar.org/SELECTION/inputCoord.asp, accessed on 25 October 2020)
Table 2. Forest cover and changes from 2002 to 2014 in the North Pacific Basin.
Forest 2002 Forest 2014Losses (2002–2014)Gains (2002–2014)Net Change (2002–2014)
km2%km2%km2%km2%km2%
99,612.70100.0098,181.3298.563938.773.952507.392.52−1431.381.44
Table 3. Proximate and underlying causes of deforestation in the North Pacific Basin.
Cause%Sub-CauseTotal %
Proximate deforestation causesAgriculture expansion53.42Permanent cultivation19.00
Shifting cultivation15.18
Cattle ranching13.15
New agricultural areas6.10
Wood extraction16.17Commercial wood extraction11.23
Fuelwood extraction3.47
Farm improvement1.46
Infrastructure extension20.21Transport infrastructure8.36
Settlement expansion6.77
Public services5.08
Mining operation8.76Metal mining6.88
Non-metal mining1.88
Social trigger events1.44Population displacements0.08
Social disorder0.42
Drug trafficking0.94
Underlying deforestation causesDemographic factors34.85Migration7.33
Population growth27.52
Economic factors29.26Market growth and commercialization13.91
Economic structure10.23
Urbanization and industrialization5.12
Technological factors7.58Land factors3.99
Agro-technological changes0.73
Labor factors2.86
Policy and institutional factors22.59Formal policies4.73
Policy climate11.89
Property rights5.97
Cultural factors5.72Attitude, values, and beliefs3.82
Individual and household behavior1.90
Table 4. Cross-tabulation matrix between 2002 and 2014 in the North Pacific Basin. Category legends: background = 0; aquaculture = 1; agriculture = 2; human settlements = 3; forest = 4; water bodies = 5; mangrove = 6; scrubs = 7; other lands = 8; pasturelands = 9; hydrophilic vegetation = 10.
Category (km2)012345678910Category 2014Gains 2002–2014
01994.660.309.090.112.7452.9819.672.737.228.196.422104.11109.45
10.54394.4115.06013.0723.8413.322.2722.9817.6136.46639.55245.14
22.2210.8427,25916.892492.5612.0422.34179.6824.62916.36249.431,185.923926.95
30.870.45184.6730.4121.410.251.476.930.8730.173.23980.66250.25
40.310.611518.621.5695,673.75.296.6110.985.16941.4317.0898,181.322507.65
50.340.2227.570.1625.45992.925.911.063.6318.428.021103.68110.78
614.183.8945.880.0828.7819.71684.188.8614.9369.3730.831920.68236.5
71.370.0431.870.026.512.664.263137.33.9855.961.623245.59108.29
84.690.4311.210.0165.1917.957.0911.82437.9422.286.79585.4147.46
90.050.26363.340.661258.8159.782.3374.120.279171.430.0910,931.141759.71
104.0347.9965.040.1124.1811.758.340.8615.103.15752.42932.97180.55
Cate-gory 20022023.26459.4429,531.3750.0199612.41199.141795.523436.61536.711,254.41212.36151,811.02
Losses 2002–201428.6065.032272.2819.603938.7206.24111.34299.3198.762082.93459.94
Table 5. Results of the spatial logistic regression model.
Variables β MeanSDBSTD
Intercept1.31256
SocioeconomicPopulation growth−0.00005140.81146.11−0.00
Population density0.0002278.32202.530.01
Marginalization index−0.0038322.217.32−0.01
BiophysicalAltitude−0.000931450.91864.81−0.24
Slope−0.0351631.4022.67−0.24
Soil moisture0.080196.982.440.06
Forest productivity−1.178931.891.00−0.36
Mean annual precipitation−0.00058894.49298.45−0.05
ProximityDistance from natural protected areas0.0000151,823.8435,400.320.10
Distance from agricultural areas−0.000075509.014789.50−0.10
Distance from pasturelands−0.000017582.717825.38−0.01
Distance from roads0.000017312.816112.970.02
Distance from hydrography−0.000032509.821884.01−0.02
Distance from mines−0.0000211,282.348036.79−0.06
Distance from localities with fewer than 2500 habitants−0.000214760.763162.10−0.20
Distance from human settlements0.0000031,988.6322,306.07−0.03
Table 6. The linkage between deforestation causes and factors.
Cause%Sub-Cause%Factors
Proximate deforestation causesAgriculture expansion53.42Permanent cultivation35.56Distance from agricultural areas, distance from hydrography, distance from pasture areas, forest productivity, precipitation, distance from roads, altitude, slope, and soil moisture
Shifting cultivation28.41
Cattle ranching24.62
New agricultural areas11.41
Wood extraction16.84Commercial wood extraction69.48Distance from localities with fewer than 2500 inhabitants, forest productivity
Fuelwood extraction21.49
Farm improvement9.03
Infrastructure extension18.8Transport infrastructure41.36Distance from human settlements, distance from roads, population growth, altitude, slope
Settlement expansion33.48
Public services25.16
Mining operation10.12Metal mining78.54Distance from mines
Non-metal mining21.46
Social trigger events4.84Population displacements5.68No information is available
Social disorder28.83
Drug trafficking65.49
Underlying deforestation causesDemographic factors34.85Migration21.04Population density
Population growth78.96
Economic Factors27.88Market growth and commercialization47.54Marginalization index, distance from roads, distance from human settlements, and forest productivity
Economic structure34.95
Urbanization and industrialization17.51
Technological factors10.8Land factors52.63Distance from human settlements, distance from roads
Agro-technological changes9.63
Labor factor37.74
Policy and institutional factors19.4Formal policies20.96Distance from natural protected areas
Policy climate52.62
Property rights26.42
Cultural factors12.52Attitude, values, and beliefs66.87Marginalization index
Individual and household behavior33.13
Publisher’s Note: MDPI stays neutral with regard to jurisdictional claims in published maps and institutional affiliations.

