1. Introduction
The Design for Disassembly technique was born by derivation from the better-known Design for Assembly technique (in the early 90s) and is part of the broader Design for Environment (DfE)/Green Design (GD) concept, which is a design concept aimed at optimizing control over products, processes, and services, respecting the problems related to the life cycle of the raw materials that make up its components. The main purpose is to arrive at nondestructive disassembly to safeguard the future reuse of the parts [
1,
2,
3]. The reasons why DfD has acquired a more incisive and strategic role in industrial design are to be found firstly in the speed with which technology becomes obsolete, which has forced companies to increase the frequency of the turnover of their products while maintaining a high quality level and a price that is adapted to customer expectations [
4]. Secondly, European directives or legislative acts have established common objectives for the countries involved, defining an ecological path for responsible exploitation of resources in order to reduce the waste of products or parts of them at the end of their life (EOL, end of life).
However, since manual disassembly involves the use of many tools and a considerable expenditure of energy by the operator, while automated disassembly requires a substantial initial financial investment and does not guarantee the easy attainment of various components, disassembly has been seen in the past as a disadvantageous EOL activity. Moreover, the designers themselves did not pay much attention to making the products easier to disassemble in order to safeguard as many components and materials as possible to be reused. Therefore, there has been an increase in exposure to damage and, consequently, an increase in the time necessary to complete the disassembly operation and, above all, an increase in the wastage of products at their EOL [
5].
Optimal disassembly is concerned with recovering materials and components that are reusable in other products or recyclable in a responsible way, removing toxic components or materials, and making the most important parts of the product more accessible to service operations such as preventive maintenance (the maintenance of a component before a real fault occurs in order to reduce the possibility of it happening) or corrective maintenance (replacing/repairing a faulty component that compromises the general functioning of the product).
Two main types of disassembly are presented: complete disassembly, when all components are disassembled, and selective disassembly, when the product is disassembled only until a target component is reached, which is the objective of the operation. Furthermore, nondestructive disassembly can occur when the removal of components from the product does not lead to the breakage of the product itself; destructive disassembly, on the other hand, happens at the end of the operation, when the components are no longer usable because they are broken. Therefore, optimal disassembly in compliance with Green Design should be selective since complete disassembly is more expensive; above all, disassembly should be nondestructive.
According to the evaluations carried out in the literature regarding the profit of disassembly and recovery interventions (
Figure 1) [
6,
7], the costs incurred for disassembly/repair become prohibitive as the disassembly depth increases. The gain, on the other hand, initially grows at the same step as disassembly depth and then settles down when disassembly depth becomes too deep. Therefore, the net profit curve presents a maximum point after which a decreasing trend occurs as the depth of the disassembly operation increases.
The definition of an optimal strategy for DfD has the intent of increasing the value of profit at its maximum point, trying to move the latter as much as possible towards a greater depth of operation.
It is also true, however, that this reasoning is clearly visible only with mechanical assemblies with a high number of components; with simple products, the costs and profits are both low.
The realization of a disassembly sequence that is in line with the advantages offered by the DfD technique is defined by disassembly sequence planning (DSP). This method considers constraints and directions of disassembly, movements of components, and collision conditions in order to generate and optimize the disassembly sequences (disassembly sequencing), analyzing the optimal level of disassembly (optimal disassembly level analysis). During the search for an effective and efficient disassembly sequence, the choice of materials and fasteners (connecting and/or fastening elements), the design of the components, and the structure of the product play important roles. Further shrewdness can concern the minimization and standardization of fasteners, the avoidance of permanent fixings, and the use of components of the same type, which should not be made of hazardous material. Therefore, the most relevant materials and components (usually, fasteners are not considered critical due to their ease of removal from assembly) should be removed first, and then, operations should be accelerated by using electric or pneumatic tools and paying attention to the fatigue and efforts of any person, which can have negative effects on both health and performance.
Before proceeding, the road map followed during the work carried out is presented in
Figure 2.
After a brief presentation in the second section on the industrial use of a hydraulic external gear pump and its 3D modeling using Creo Parametric software, we will proceed in the third section with the application of the four methods of the DfD technique in order to find the optimal disassembly sequence that satisfies a given objective function. In this case, we look for the shortest sequence in terms of the time needed. Then, we present how a well-sought disassembly sequence can bring an economic advantage to the companies interested in this kind of operation. Finally, the last section shows how the implementation of augmented reality in the industrial environment can facilitate countless technical and manual operations, such as the maintenance process of a specific component of the product in question, becoming a tool capable of step-by-step instructions to the operators involved in the fastest and safest way possible.
2. Case Study: The Hydraulic External Gear Pump
2.1. Industrial Use
The hydraulic external gear pump is part of the volumetric pumps that exploit the volume variation caused by the meshing of the teeth of two gear wheels to cause suction and thrust in fluids. Generally, they are used with viscous fluids or any fluid that does not have an abrasive solid content. They are, in fact, widely used to pump lubricating oil in vehicle engines and the oil in the hydraulic circuit of earth-moving machines. The environment of use of this type of pump is purely industrial, e.g., mobile hydraulics, chemical (mixing, mixing, and dosing of additives and polymers), cosmetic (treatment of substances for cosmetics), and naval (bilge pumps), and for the liquid processing of food. The two rotors, called the driving gear and the idle gear, are inserted into a body that surrounds them on both sides. When the gears rotate, they separate on the suction side of the pump, creating a vacuum and a suction that is filled with the fluid. This fluid is carried by the gears on the discharge side of the pump, where the meshing of the gears pushes the fluid out of the spaces of the teeth. In addition, the reduced mechanical tolerances (in fact, we speak of the order of 5 μm), together with the rotation speed, effectively prevent the fluid from flowing back through the meshing area. The rigid design of the body and gears allows the application of high pressures and gives the ability to pump highly viscous fluids. High volumetric yields can be obtained even at high operating pressures and low sound levels of processing. Moreover, they are characterized by high durability, thanks to the load-balancing system on the guide bushings. Finally, according to the rotation directions allowed by the gears, these pumps can also be used in the opposite way, that is, as hydraulic motors.
2.2. D CAD Modeling
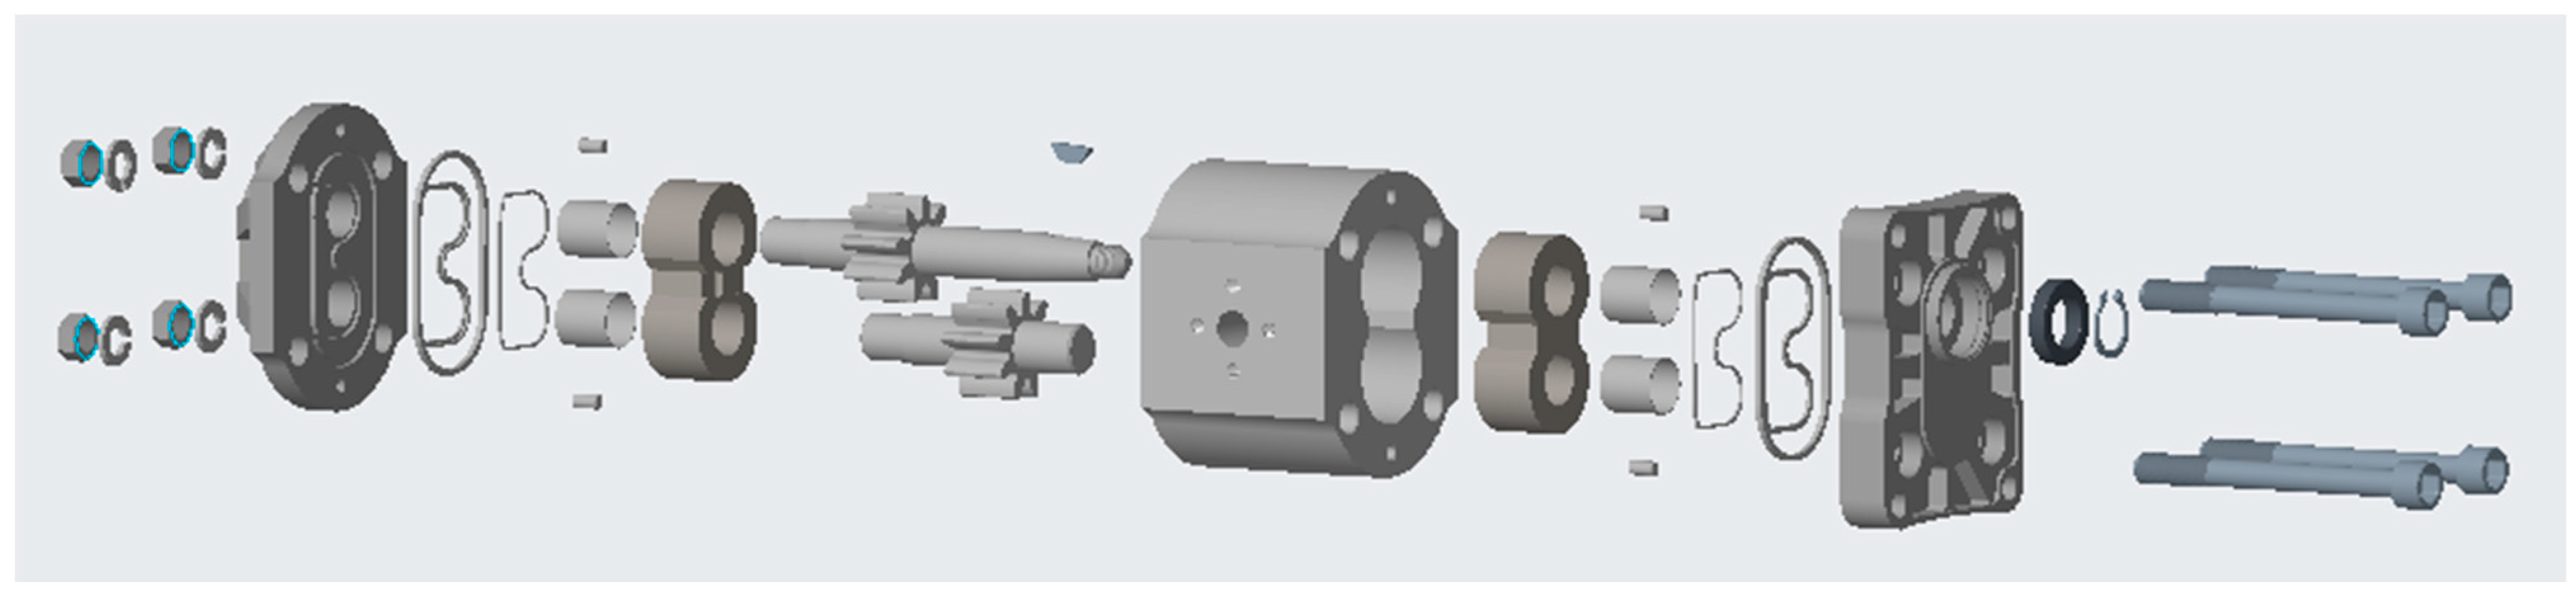
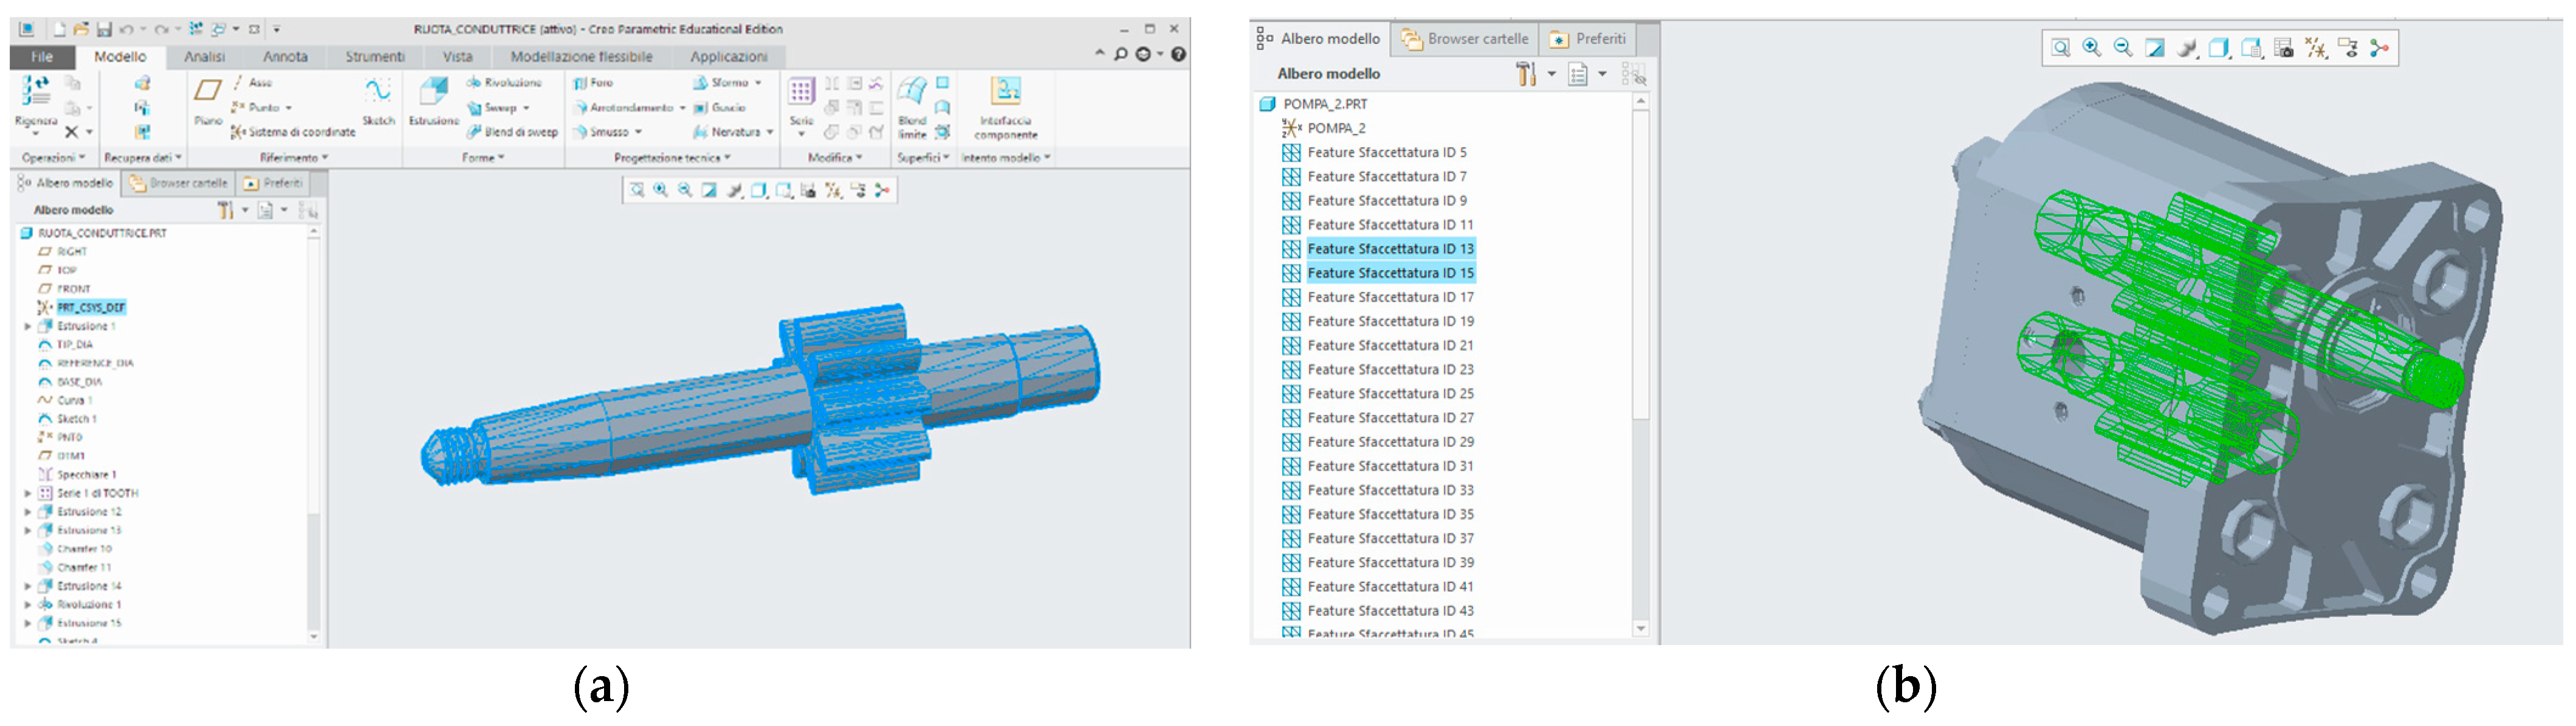
The mechanical assembly is modeled for all its components and fasteners through 3D modeling software CAD (computer-aided design) Creo Parametric (Parametric Technology Corporation (PTC)). It was casually chosen among the others available due to the absence of specific requests to satisfy. The external gear pump that was chosen as an example is produced by Casappa-oleodinamica Cavalli di Collecchio-Parma. The Creo software is not immediately intuitive like others of its kind (Inventor, Solid Edge, or Solidworks, for example), but, in the mechanical field, it is much appreciated because it offers basic modeling functions combined with some innovative features at the level of additive manufacturing, model-based definition, and intelligent and connected design.
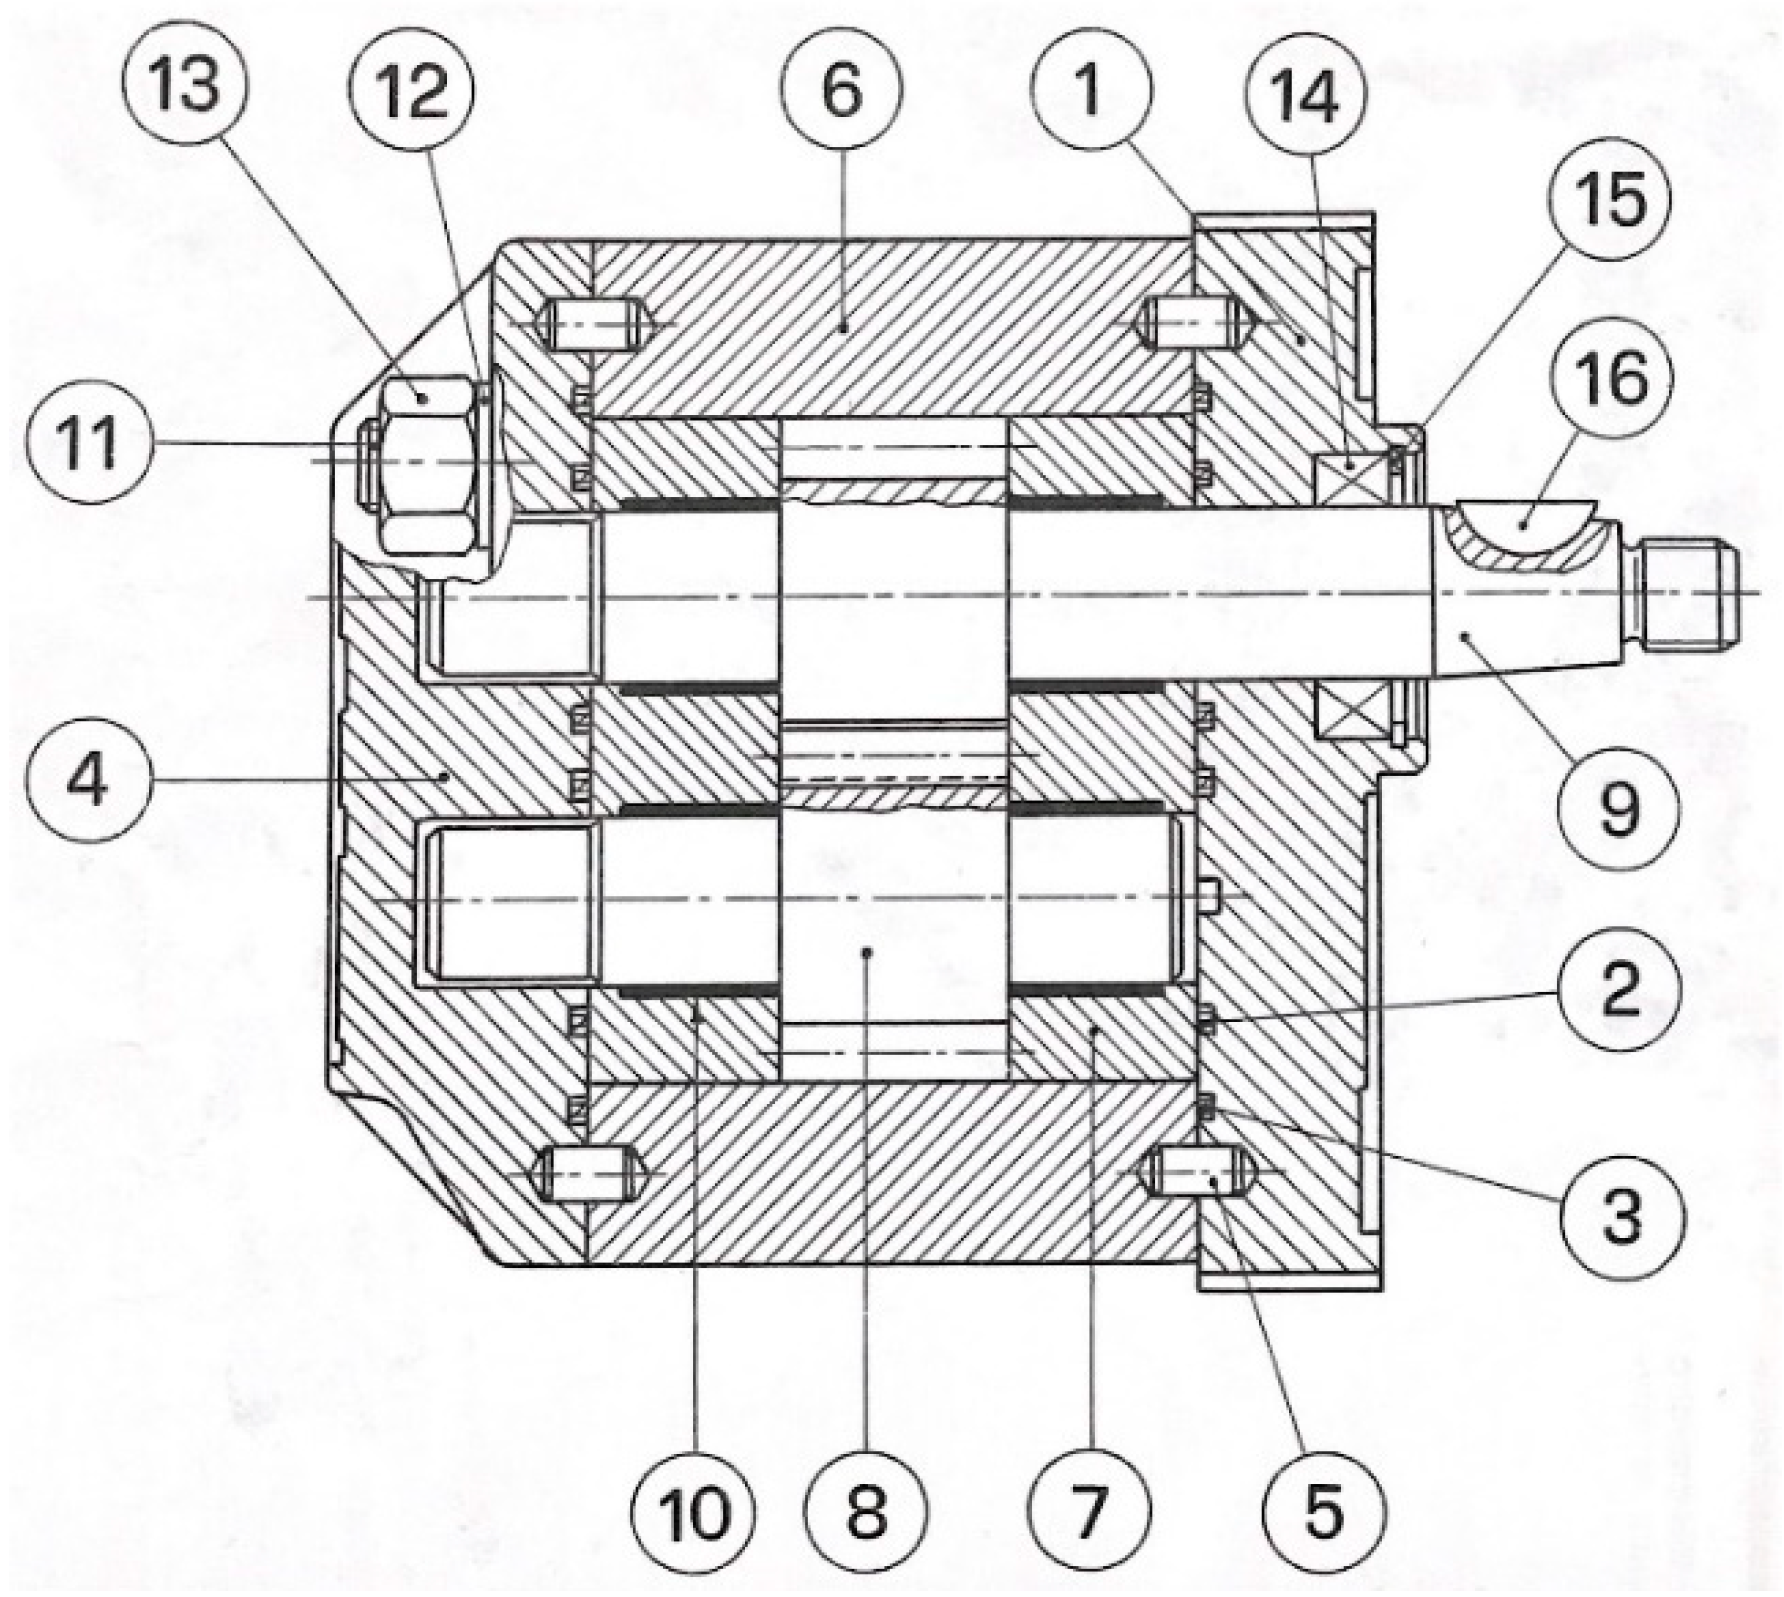
Starting from a 2D drawing (
Figure 3), the BOM (bill of materials) was obtained (
Table 1) and the various components were made [
8] (
Figure 4,
Figure 5,
Figure 6 and
Figure 7). Finally, they were assembled to obtain the mechanical assembly in 3D. The basic procedure for creating an object on Creo is to draw the desired shape, to be perfected later with special tools such as
rounding and
chamfer and extruded to obtain the object; extrusion can create or remove material. The wheels were made instead with the functions of Revolution and Helical Sweep: you draw the profile of the tooth and then rotate it, following a propeller path along the section designated as a path at the beginning of the operation.
3. Methods for Analyzing the Disassembly Process
3.1. First Method
The first method was introduced by Jianjun Yi, Bin Yu, Lei Du, and Diqing Hu in a publication entitled “Research on the selectable disassembly strategy of mechanical parts based on the generalized CAD model” to find all possible disassembly sequences based on the concept of “disassembly waves” [
9].
Target component Cx, subject to preventive or corrective maintenance, is considered the point of origin of a wave. Once defined, we proceed with the search for the sequences ending with the choice of the one that best satisfies a specific objective function, such as performing the least number of steps to reach the target component or recording the shortest time spent in the removal operation. Generic component Ci is defined as 1-dependent when it can be removed with the extraction of only one other component with which it is in contact. It is considered d-dependent when, being in contact with more components, more than one component must be extracted to free it. The wave, starting from Cx, which corresponds to the initial instant τ0, propagates at time instant τ1 in all directions, hitting all the components adjacent to the original one. Subsequently, at instant τ2, another wave propagates, which, this time, hits all the components adjacent to the previous ones. We proceed with an iterative step until all parts of the product are included; it is indicated as the instant of transmission of the last wave τn.
The graphic choice for this method falls on the removal influence graph (RG), where the different components are represented by nodes and arcs; the oriented arrows define the connection relationships between the different parts. The disassembly wave is identified by a curve that unites all the components that are hit by the wave at the same instant, τi. In order to find possible disassembly sequences, components belonging to the last wave, the outermost ones, are the first ones to be removed; then, we proceed inwards to target component Cx, which actually corresponds to the instant τ0.
Application of the First Method
The conductor, which is essential for the operation of hydraulic pumps, has been chosen as the target component. The front flange (no. 1 in the BOM) and the oil seal (no. 14 in the BOM) are considered a single piece since the removal of one inevitably involves the removal of the other. In fact, to remove the oil seal, you have to lever the side inside the flange; otherwise, there is the risk of damaging it, making it unusable. The two bushings and the shim (no. 10 and no. 7, respectively, in the BOM) are considered a single component (10.7sx and 10.7dx) as they are generally preassembled before being assembled with the other parts. The body (no. 6 in the BOM), a central element that is not necessary for the removal of the target component, is left out and considered fixed.
In
Figure 8, it is possible to observe how the disassembly wave expands in the different instants τ
i-th. The possible disassembly sequences obtained are the following:
→ 13, 16, 12, 11, 15, 1-14, 2dx, 3dx, 10-7dx, 9: unscrew the nuts with the washers and screws to then remove the snap ring and the tongue, which would hinder the removal of the front flange; proceed with the removal of the latter in order to extract the OR seals and the assembly of the shim-bushings on the right part of the body.
→ 13, 16, 12, 11, 4, 3sx, 2sx, 10-7sx, 15, 1-14, 9: after having carried out the same initial steps of the previously proposed sequence, the OR gaskets and the shim-bush pair can be extracted from the left part of the body; however, it is not yet possible to extract the conductor since the part of the shaft that houses the key would collide with the oil seal and the circlip placed in the front flange; therefore, these additional elements must also be removed before reaching the target component.
The tongue (no. 16 in the BOM) must be removed whether the drive gear is extracted in the +x or −x direction because, even in −x, it is not in contact with the components involved, such as the rear cover and the left shim; being extracted in that direction would tear the oil seal in the front flange. Therefore, it must be extracted first, together with the nuts.
The fasteners that are present in more than one piece, i.e., the nuts, washers, screws, and pins, are identified by a single number, which means the necessary removal of all the specimens. If, for example, the number of screws appears in the disassembly sequence (no. 11 in the BOM), all four screws present must be removed. The pins and seals, being placed on both the left and right sides of the body, are also differentiated in direction (therefore, 5sx, 5dx, 2sx, 3sx, 2dx, 3dx).
The optimal sequence is the first one, as it involves removing one component less than the second one. In any case, it should be noted that the most convenient and effective sequence does not involve a complete disassembly of the hydraulic pump from the body that houses the “pack”, as the assembly is defined in company jargon, namely, left shim/bushings—drive gear—idle gear—right shim/bushings, and it is possible to access it in both directions, i.e., +x and −x.
3.2. Second Method
The second method is presented by Fei Tao, Luning Bi, Ying Zuo, and AYC Nee in their essay “Partial-Parallel Disassembly Sequence Planning for Complex Products” [
10]. Through it, partial and/or parallel sequences can be obtained using a DPM (disassembly precedence matrix) N×N (square). The latter is the result of the union of four other submatrices that express the limitations caused mutually between fastener and components—CCM, CFM, FCM, FFM—where, in each acronym, M stands for matrix, F for fastener, and C for component. Each element of the DPM has a sequence of six digits, each representing a Cartesian removal direction (+x, −x, +y, −y, +z, −z), where the single crifa is equal to 1 when the fastener or component can be removed in that direction, 0 otherwise. For example, in the CFM (matrix of the relations between d-dependent components and fasteners), there is a 1 every time the
j-th fastener blocks the
i-th component, while, in the opposite case, there is a 0 (full absence of constraints in the considered direction).
As a first step, the parts of the assembly must, therefore, be divided into components and fasteners. We proceed with the filling of the submatrixes, and once the DPM is obtained, a random sequence of fastener removal is decided. We start by removing the first fastener of the list that has a row of only 0, and we delete the corresponding row and column from the matrix, obtaining a reduced N−1×N−1. We continue with the process, evaluating from time to time the removal of some component, which means checking if there is one until the target component is extracted.
In order to apply the algorithm, two simple rules must be followed:
- (1)
When a fastener can be disassembled: The i-th fastener Fi can be removed when FCM (i, :) = = 0, so there must be no components blocking Fi along the disassembly direction, and FFM (i, :) = = 0, which indicates that there must be no fasteners that have priority over Fi.
- (2)
When a component can be disassembled: The j-th component Cj can be removed when CFM (j, :) = = 0 and CCM (j, :) = = 0; the first condition indicates that there are no fasteners that obstruct Cj along the disassembly direction and the second one indicates that Cj does not conflict with any other component in the product.
By modifying the initial removal sequence of the fasteners and trying all the combinations, it is possible to obtain all the possible sequences, thus obtaining solutions that also optimally satisfy a determined objective function. As the complexity of the product in question increases, the difficulty in finding these sequences increases as well. However, using a computer, this problem can be solved in less time with automated calculations.
Application of the Second Method
After identifying and dividing components and fasteners (components identified with the code C and a number that follows in ascending order, the same order as appears in the BOM, and fasteners identified with the code F and a number that follows the same logic for the component), we can proceed with the building the DPM, as shown in
Table 2 (in the following page). As with the previous method, the oil seal is considered assembled to the front flange, the shims are assembled to their respective bushings, and, for this method, the O-rings (no. 2 and no. 3 in the BOM) are also counted as a single part since they are actually wedged between of them. The target component remains the drive gear (C4 in the component table).
Therefore, for example, analyzing the relationship between C1 = 1-14 (front flange assembled with the oil seal) and F7 = 16 (tongue), we write down in the cell the number 10,000 because C1 cannot be removed in the +x direction due to the presence of F7. F7 must be removed first, then C1.
The final disassembly sequence is F7, F5, F4, F3, C2, F6, C1, F1SX, F2DX, F2SX, F1DX, C5SX, C5DX, C4, which in BOM codes are 16, 13, 12, 11, 4, 15, 1-14, 2-3SX, 5DX, 5SX, 2-3DX, 10-7SX, 10-7DX,9.
3.3. Third Method
The third method was introduced by researchers Lu Zhong, Ekene Gabriel Okafor, Wu Haiqiao, and Sun Youchao in their essay “Disassembly sequence planning for maintenance based on the metaheuristic method” [
11]. It is mainly based on Dijkstra’s algorithm, which provides for an oriented graph in which each node hosts a functional component and each arc represents the connection between two nodes or the possible fasteners that connect two or more components together unless they are connected directly.
Each arc has a different weight pij depending on the established objective function (time/cost, type of equipment needed, etc.), which represents the cost of traveling to the specific section of the graph that joins the i-th and j-th nodes. Starting from a random initial point, we proceed by choosing, from time to time, the branch that has the least weight and, therefore, has the least impact on the total weight and cost incurred to reach the target component.
The first step is the drafting of an interference matrix D = dij [N × 6], where N are the constituent parts between the components and the fastener and 6 is the possible Cartesian directions. The fasteners are not considered in the disassembly operation as they are considered of lesser importance and easy to extract compared to other components. Nevertheless, the matrix can count them, like the other parts, and, in the same research presented by the authors, fasteners play a more important role when they are difficult to disassemble or when they require specific tools for their extraction.
Therefore, the cell of matrix D, the generic element Dij, contains the number of components that physically hinder the extraction of component i placed in the i-th row in disassembly direction j. Therefore, a component is completely removable only if 0 is present in its respective matrix line; the symbol ∞ identifies a direction in which the component cannot or should not be removed.
However, to understand the situation of the product as a whole, it is also necessary to analyze the incidence matrix B = (bij), [N × M], where N are the components and M the fastener and where the term of generic cell bij is equal to 1 if corresponding component i and fastener j are connected, 0 otherwise.
Application of the Third Method
The same assumptions made for the other applications are valid; however, for completeness of the current method, we also consider the body as a competing component: C6 (no. 6 in the BOM).
After having collected the necessary information, built the interference matrix in
Table 3 and the precedence matrix in
Table 4 (the coding remains the same as for the second method since components and fasteners are identified separately here as well), we draw the oriented graph (
Figure 9). The shortest path is sought in order to reach the drive gear, defined as the target component, as before.
At this point, weights must be attributed to the arches in order to designate the critical path, that is, the shortest and most efficient path in terms of time or costs, depending on the objective function that has been chosen. For example, each arc could be associated with weight in terms of TMU (time measurement unit, described in
Section 3.6) of the operation to remove the component at the beginning of the connection with another one.
To reach the target component, the possible sequences obtained from the graph above are the following:
- -
Seq.1: F3, F4, F5, F6, F7, C1, F1DX, C5DX, C4;
- -
Seq.2: F3, F4, F5, F6, F7, C1, F1DX, F2DX, C6, C5DX, C4;
- -
Seq.3: F7, F3, F4, F5, C2, F1SX, C5SX, C4;
- -
Seq.4: F7, F3, F4, F5, C2, F1SX, F2SX, C6, C5SX, C4.
As is easy to guess, the optimal sequence is number 3: F7, F3, F4, F5, C2, F1SX, C5SX, C4, and, according to the codes of the BOM: 16, 13, 12, 11, 4, 2-3 SX, 10-7 SX, 9.
3.4. Fourth Method
The fourth and last method was proposed by Peter Mitrouchev, C.G. Wang, L.X. Lu, and G.Q Li in the work entitled “Selective disassembly sequence generation based on lowest level disassembly graph method” [
12].
Two graphs are used, the DGCG (disassembly geometry contacting graph) and the DOG (disassembly order graph), where, in the first graph, the components participating in general operation are divided into different levels depending on the order of removal, identifying the components with circles and the fasteners with rectangles. To build the DGCG, however, it is necessary to make an accurate study of the CAD model designed to verify that there are no collisions between the projections of parts: “geometric feasibility” and “collision detection”. The first refers to two components that can be assembled/disassembled without causing collisions with each other in order to find the direction and the disassembly path. Instead, to analyze the collisions that occur during disassembly, the “project calculation” proposed by Jimènez is used, which consists of projecting the volume of the target component in a chosen direction (2D); if no collisions are found, then it is defined as direction-correct because the basic principle is that if a collision occurs at the 2D level, then it certainly occurs at the volume level as well. When a part can be removed without requiring the extraction of other parts, it is placed in the first level called 1-st-disassembly-level. Otherwise, it is placed in other lower levels after specifying, for each higher level, the reason for its inability to be removed using the abbreviations: Cni,j refers to a level n where component i cannot be disassembled due to a collision with component j; NSni refers to when component i cannot be removed at level n due to the absence of a SDR (set of directions for removal); the second graph is a graphic representation of the path that has been chosen to reach the target component. Therefore, the sequence is built starting from the first level and then descending, releasing the components placed below each time.
Application of the Fourth Method
To use this method, it was decided that we must consider several assemblies of components: S1 = {13, 12}, S2 = {4, 2-3SX}, S3 = {1-14, 2-3DX}, S4 = {10, 7SX}, S5 = {10, 7DX}, and the 5SX and 5DX pins as if they were welded to the hydraulic pump body since they do not participate in disassembly and, in fact, do not hinder other components in their removal. The target component remains the drive gear. The first level of the DGCG (
Figure 10) is composed entirely of fasteners, as is more generally the case because they are usually free to be removed immediately from the product.
Two possible disassembly sequences are obtained, visible in the following DOGs (
Figure 11a,b):
→ Seq. 1: S1, 11, S2, S4, 9;
→ Seq. 2: S1, 15, 16, 11, S3, S5, 9.
The optimal sequence is the first one. By breaking down the subassemblies defined at the start, we obtain, in BOM codes: 16, 13, 12, 11, 4, 2-3SX, 10-7SX, 9.
3.5. Personal Sequence
The sequence proposed by the authors foresees extracting the drive gear from the rear part of the hydraulic pump, avoiding the removal of the OR gaskets from the rear cover as they are not necessary in removing the objective component. Therefore the sequence appears to be the following in BOM codes: 16, 13, 12, 11, 4, 10-7SX, 9.
3.6. Disassembly Time Estimation
We now want to carry out a temporal analysis of the sequences found previously. To do so, we use the study of two essays: “Disassembly analysis through time estimation and other metrics” by Ehud Kroll and Brad S. Carver and “Evaluation of disassembility to enable design for disassembly in mass production” by Anoop Desai and Anil Mital [
6,
7].
Both methods provide for an indirect estimate of the times, filling in a table, the disassembly evaluation chart (DEC), with scores based on different drivers, such as the type of component under examination, any presence of lubricants, necessary equipment and its handling (if the component has an easier grip, this facilitates its extraction in terms of strength and time of use), effort to be applied to disassembly, position and accessibility of the component with respect to the assembly (an easily accessible component or fastener involves a fast and efficient operation), structural aspect of the parts (such as symmetry, size, weight, center of gravity), and option EOL (such as reusing, recycling, or remanufacturing).
In the first method, each driver is associated with different scores according to the light, moderate, or large degrees of judgment defined in specific reference tables. The final time is calculated in TMU converted into seconds (1 TMU = 0.036 sec(s)) by adding up the total scores of each row (therefore, of each component/fastener) under examination.
The second method, on the other hand, always requires the compilation of the estimate table. However, unlike the previous method, it requires a subjective judgment of the user, who, for each item present, must give a score on a scale from 1 (easy) to 10 (difficult). Time, in this case, is calculated in seconds using a specific formula.
However, since the perception of the individual operator is subjective by definition, it is clear that this approach risks losing precision with respect to the other method, although we always talk about estimates in both cases.
The results obtained on the different sequences, considering that those ones found with the third and fourth methods are the same, are the following:
Seq. 1
→ Method 1, disassembly time estimated (DTE) = 2431 TMUs = 87.52 s = 1.49 min;
→ Method 2, DTE = 1690 TMUs = 60.84 s = 1.01 min;
Seq. 2
Seq. 3–4
Personal Sequence
As can be seen, the sequence that turns out to be the best, in terms of time needed for the operation, is the last one.
The use of both methods of evaluation and time estimation was proposed to have a complete understanding of the theoretical topics covered and to note that the difference between the two is not exaggerated, considering that the data are not precise and, above all, are subject to the variability of perception of the operator who compiles the tables [
13,
14,
15,
16,
17,
18].
3.7. Economic Analysis
To quantify the advantage of the application of the DfD technique in terms of economic savings, information obtained from data reported by the Italian Ministry of Labor and Social Policies, updated in June 2019, for operators working in the private metalworking industry is used. Considering a 4th-level worker with a permanent contract, we know the following: average annual cost = €35,036.90; average hourly cost = €21.90; theoretical annual hours = 40 h * 52.2 weeks/year = 2088 h/year; average annual hours worked = 1600 h/year.
At this point, also knowing the duration of a disassembly sequence, it is possible to calculate the number of pieces processed in a year and derive the unit cost for the company. In order to have a single basis for comparison, we calculate the number of pieces processed in a year and the relative annual cost of the worst sequence, that is, the one that is least productive in terms of time of operation; in our case, it is the second sequence. Finally, we compare the cost related to the production of an equal number of products, obtained using the other available sequences, in order to quantify the possible savings for the company. Therefore, in
Table 5 and
Table 6, calculations have been made on the second sequence found and taken as a second term of comparison for the reason defined above.
The best sequence, as guessed previously, appears to be the personal one, since, taking into account all the driver aspects listed above, it is the least time-consuming one for the maintenance operator and, therefore, is the sequence that brings major savings to the company [
15,
16].
This analysis aims to calculate the economic advantage based on disassembly sequence time duration, although, in the literature, other methods can be found, such as the method which estimates the return on investment in DfD and the consequent environmental impact [
19] or the method that, instead, uses Simapro Eco-indicator 99 in order to establish the environmental impact and pays attention to different factors such as number of parts, number of tool changes, and number of reorientations to define more precisely a disassembly sequence [
20].
4. Study of Augmented Reality and Possible Applications
4.1. Key Features of the AR
First of all, we need to distinguish augmented reality (AR) from virtual reality (VR), which involves the creation of a new environment of new characters, leading to a complete simulation of a new reality involving a greater level of immersion, where what is virtual replaces what is real. Augmented reality, on the other hand, can be defined, in general, as an integration of various digital information (animations or new content) in real-time with the environment, in which the user is located by means of a specific device (smartphone, PC, smart glasses) defined as a wearable device. AR augments the real world so that the user still maintains a sense of presence in his world.
The basic principle of this technology is the overlay, which happens, for example, when an object is placed in front of a camera, which scans it. Through computerized vision technology, the object is recognized by the system, activating a new level of communication that overlaps and integrates with reality, bringing more information and hooking the desired virtual object to trackable points detected by the camera in the real object [
21].
Going more into the merits of the topic, AR involves computer vision technologies, such as SLAM (simultaneous localization and mapping), and those for depth tracking (depth tracking) through the support of hardware and software components such as camera and sensors, performance CPUs, GPUs, and holographic projection.
Augmented reality sees its application in different areas [
22], such as the medical industry, where it can assist surgeons during operations or facilitate the visualization of the patient’s vital parameters, or the educational industry, facilitating learning thanks to greater interaction with three-dimensional objects. Hence, AR is useful in both the scientific field and the humanistic one. The marketing sector has made good use of this technology to attract more customer attention, improving the prepurchase experience by allowing you to see the product, which is not yet bought, to evaluate various factors such as the space footprint. We can find a wide use of AR in the military field, where it allows soldiers to recognize and contain possible dangers or targets with reduced reaction times, or in the air force, where it is used by pilots to view flight data such as altitude, speed, range, or distance to a specific target without taking their eyes off the guide. AR has made its debut in entertainment, but the real focus is on infotainment, which combines the quantity and quality of information to be used in a specific context with the use of an interactive surface associated with a camera and a dedicated management system. In fact, it fits into the path of the Internet of Things (IoT), helping smart cities to interact with all their citizens through interactive objects. Even in the industrial field [
23], AR benefits by obtaining innumerable advantages with relatively modest efforts; it concerns not only cost reduction (for example, avoiding, as much as possible, the construction of physical prototypes, design or maintenance) but also decisive changes regarding safety conditions for workers, who, for instance, with the increasing use of cobots, must work by interacting with robots designed to provide a workforce that follows a specific work-cycle schedule. Here, even if we concentrate on AR technology, an important contribution to empirical evidence and feedback on the field concerning how VR/MR (mixed reality) can be advantageous for the industry as well has been presented by researchers S. Borsci, G. Lawson, and S. Broome. These researchers analyzed the current situation of car service maintenance in companies and established how well-designed and well-assessed VR/MR tools can change and improve the quality of operator training and service [
15].
The type of augmented reality used in this case study is marker-based; that is, it is implemented with an algorithm that recognizes special images defined as markers. The latter are images composed of characters, QR codes, or geometric shapes, which, if printed and framed with the camera within an AR application, display an image, a 3D model, or a digital animation mapped for that marker. Then, there are other types of AR, e.g., marker-less AR, projection-based AR, superimposition AR, and outlining AR. The first AR mentioned, for example, differs from that one used in the case study because it does not provide printed references but uses a position via the GPS module to associate the object with a specific range of action when the user enters this dedicated area and accesses the content digital made internally. Projection-based AR requires specific devices that are capable of projecting a synthetic light beam that is formed by the synthesis of four colors (blue, green, orange, purple), ordered in succession and following one another in a cyclical way, thus differentiating themselves from natural lights and artificial ones that are formed by the fusion of all the colors of the spectrum. This synthetic light is projected onto the surfaces, creating holograms of interaction with the user. In superimposition AR, there is the replacement of part or all of the real image/structure with an augmented image. Finally, AR outlining identifies the lines and boundaries that the human eye cannot recognize and uses object recognition to learn how the user’s environment is made.
4.2. Case Study of the Hydraulic External Gear Pump with Unity and Vuforia
Two main tools were used for the implementation of DfD in AR: Unity software [
24] and the Vuforia libraries [
25]. Unity is a GDE game development engine that allows us to create and export games to multiple platforms, e.g., desktop (Mac, Windows, Linux) and Web, and different marketplaces and devices (Windows, iOS, Android, Blackberry, Wii U, PlayStation, and XBOX). The software consists of a graphic engine, a physical one, and a live game preview for real-time visualization of the changes made to the game during the programming phase. Unity allows the creation of 3D video games and interactive content, such as three-dimensional animations in real-time. Being an integrated development environment (IDE), programmers are facilitated in programming the source code. The Unity programming language is called UnityScript and can be developed using two different languages: C# or Javascript. Vuforia, on the other hand, is an SDK (software development kit) for applications in AR; it is, in fact, the most used platform in the world, able to offer fast and accurate image tracking. It represents a transversal solution to combine digital content with physical objects and environments. The tracker is the main part of Vuforia; in fact, it analyzes every single frame captured by the camera to check whether or not it contains known image fragments (trackable) to associate with specific behaviors.
Once Unity 2020 is installed on a PC and the use of Vuforia libraries has been activated by inserting the license that can be downloaded for free from the proprietary site, the AR camera is activated and the Image Target database is imported, which can also be downloaded from the Vuforia site. The chosen image (
Figure 12) is also rated by the site on a scale of 1 to 5 stars based on how trackable it can be for the camera. The image chosen as the image target was downloaded from the Freepik website and evaluated by the Vuforia website as 5 stars out of 5 (
Figure 13). To give stability to the digital object, the image must be defined as much as possible and have many contrasts between the colors to facilitate its recognition by its points/trackers.
At this point, it is possible to import the entire mechanical assembly, designed in Creo and exported in obj (object) format readable by Unity, into the Hierarchy panel or every single component, taking care to keep as a reference for each its own axis of reference in order to be able to assemble everything again in Unity. With the case study presented, we decided to export the whole product in obj format directly from Creo Parametric and import it into Unity (
Figure 14a,b).
The object, thus inserted in the project (
Figure 15), must be made a child of the image target in order to be seen in augmented reality when the camera recognizes the image target as a marker. In fact, using the play button in game mode, it is possible to enjoy an AR replication on the PC monitor, useful for checking the changes that are made from time to time in the design.
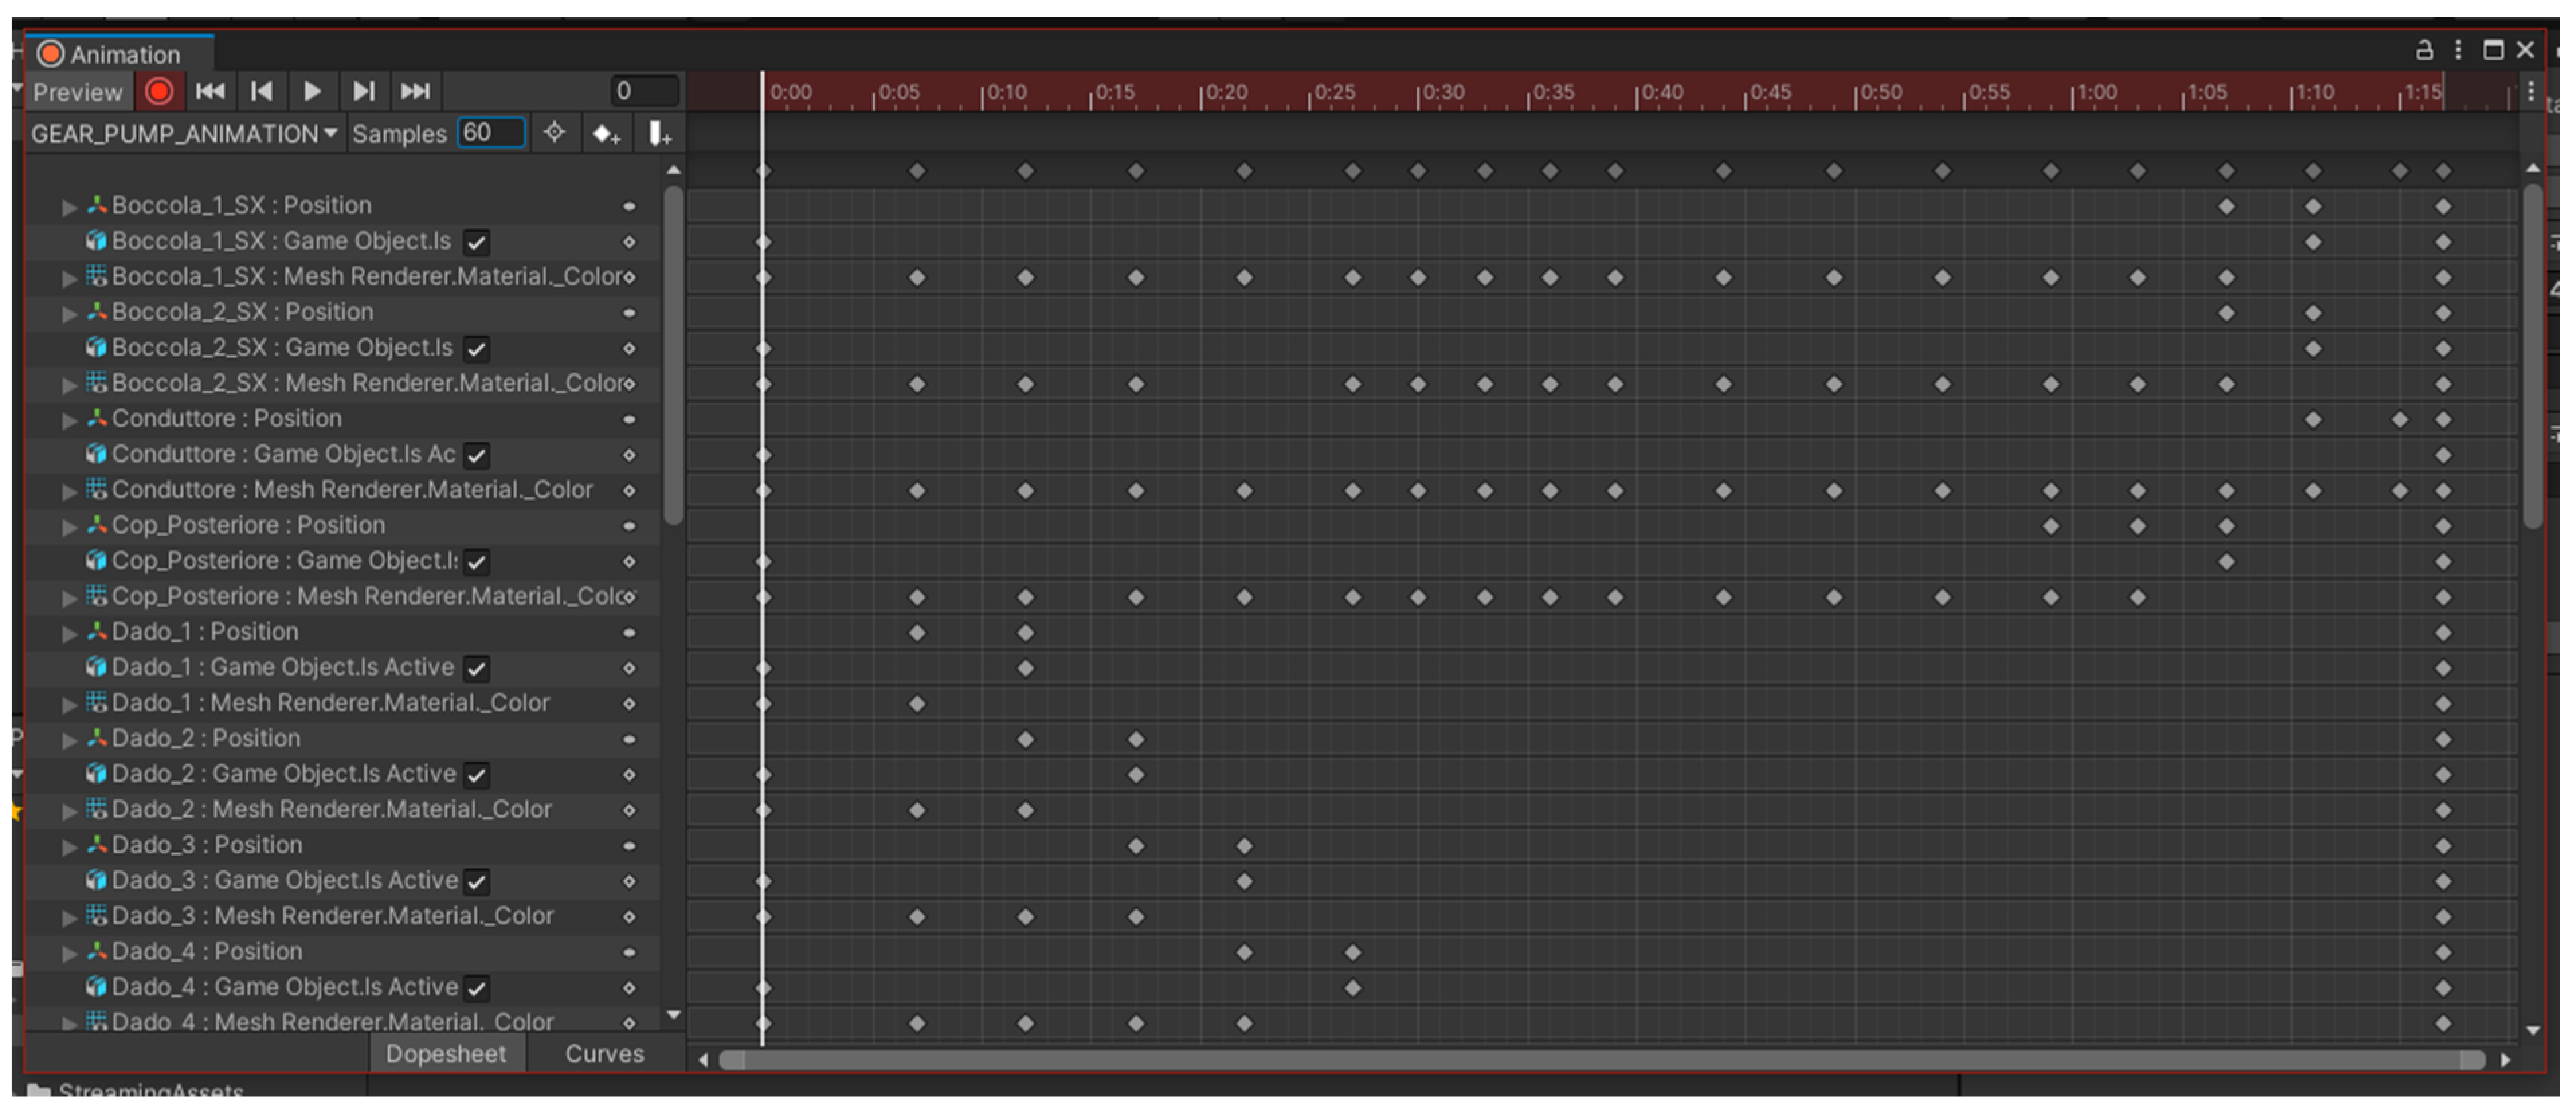
Everything that has been done so far allows us to view a static assembly, make it dynamic, and see the disassembly sequence in AR. An animation of the game object (i.e., the hydraulic pump) is created (
Figure 16), which consists of the creation of a succession of movements defined by frames on a timeline. For each component, a keyframe (frame) is set in its initial position and another one in its final position to define its movement. This is possible because Unity is able to automatically obtain the intermediate frames, defined as tweens. Through the disassembly times calculated with the method of Kroll and Carver, it is possible to create the animation of the 3 different sequences (remembering that the third and fourth ones are the same and, therefore, coincide) and facilitate the understanding of the movements performed and the components involved each time. The latter have been colored red by setting the color in RGB equal to R = 225, G = 000, B = 000 in the specifications of the Mesh Render Material Color function for each.
Unity allows us to supervise the animation design in two ways: with the dopesheet, which shows the different keyframes added in the timeline continuum, or with the sheet called curves, which allows us to see the development of the movement and render it, with the use of specific settings, more fluid. In reality, the latter function is more required for game applications, where the fps movements (frame per second) are much greater and complex than those necessary for the purpose. The object thus inserted in the project (
Figure 15) must be made a child of the image target in order to be seen in augmented reality when the camera recognizes the image target as a marker. In fact, using the play button in game mode, it is possible to enjoy an AR replication on the PC monitor, which is useful for checking the changes that are made from time to time in the design. The fps of the animation created was set to 4 to allow a clear view of the movements of the components involved in the disassembly [
15,
16,
17].
For greater interaction with the AR environment, one virtual button [
26] and one UI button were programmed through two corresponding scripts in C# on Visual Studio 2019 (
Figure 17 and
Figure 18). The first one starts the sequence set in the animation when an object, in this case, the user’s hand, is interposed between it and the camera, making the whole disassembly display more flexible at the desired moment. The second button is used to pause or resume the animation when the user touches it on the screen of his device in order to give the operator the opportunity to stop at a precise moment for any eventuality of understanding the disassembly.
Everything that has been designed so far has finally been transformed into an application for Android devices (in this case, a mobile phone was used) in the apk format of the Android application package (obviously, Unity allows programming for all other platformsas well, as mentioned before), which allows us to use the camera of the device to observe the hydraulic pump that is self-disassembled in augmented reality (
Figure 19). So how this implementation of AR work in concrete terms? The user opens the Unity application that has been installed on his mobile phone (reminding us that we have programmed an application for each sequence found using the four methods previously described and applied; therefore, the last sequence is in effect the best one because it is the fastest one; we have recorded the different animations and compared them visually) and points the video camera to the image target on the table. After that, the camera recognizes the image target and hooks the desired virtual object, the gear pump, to the points detected in space. Interposing his hand between the camera and the virtual button, the user starts the programmed animation and, at any time, he can also tap the UI virtual button to pause and then resume the animation in AR in order to better understand the position of a specific component or how one of them has to be removed. The animation stops when the component target, in our case, the drive gear (component no. 9 in the BOM), is reached, and all the sequences restart when the user taps the virtual button again.
5. Conclusions
Following the work done in this study, we had the opportunity to get to the heart of the Design For Disassembly technique, and, by applying it to a real case study, we were able to see the advantages it brings to the better design and management of resources with respect to the reduction of time and costs of the main manual activities, always respecting the assumption of making the end of life of a component profitable by pursuing recycling or reuse. The results obtained are not to be considered the best ever because they relate to only four specific methods and not to all those presented by researchers that are active in this field. However, it is certainly also possible, from the proposed comparison, to analyze the advantages and disadvantages that each of them brings. This confirms the assumption that each method must be adopted or not adopted according to the structure and characteristics of the product to be disassembled.
The second part of the study, on the other hand, focused on the implementation of augmented reality to a designed model and shows how, even at a pragmatic level, it is possible to achieve high degrees of communication through digital and nonreal contents, offering greater interaction to the user in all perceptive senses and facilitating manual operations like preventive maintenance by providing visual training and monitoring through a handheld device. This is within everyone’s reach, without the imperative of relying on written documents, which can sometimes be difficult to follow, especially for new workers who need to be trained. Augmented reality, with its versatility of application to the most diverse fields, allows us, for example, to instruct operators step-by-step and, thus, represents a learning tool. It allows remote assistance for guidance and support, improving customer care and customer satisfaction, and also allows us to improve the prepurchase experience through the evaluation of space dimensions. This technology has found greater relevance in recent years, so much so that it plays an important role in the 4.0 industry for greater human–machine interaction. In reality, its true potential has not yet been fully exploited; therefore, in the near future, continuous technological growth is expected, with a consequent adaptation of structures, devices, and our own usage habits as end-users in this world that changes and becomes “augmented”. There has not been possible to verify these results in the work field in order to bring empirical evidence, but the positive theoretical outcome of this case study gives us hope to complete this work in a positive practical way in the near future.


