Article

Downhole Lithological Profile Reconstruction Based on Chemical Composition of Core Samples and Drill Cuttings Measured with Portable X-ray Fluorescence Spectrometer

1
Well Logging Department, Oil and Gas Institute–National Research Institute, 30-503 Kraków, Poland
2
PGNiG—Polish Oil and Gas Company, Zielona Góra Branch, 65-034 Zielona Góra, Poland
*
Author to whom correspondence should be addressed.
Minerals 2020, 10(12), 1101; https://doi.org/10.3390/min10121101
Submission received: 29 October 2020 / Revised: 4 December 2020 / Accepted: 5 December 2020 / Published: 8 December 2020
(This article belongs to the Special Issue Clays, Clay Minerals and Geology)

Abstract

:
The reconstruction of a lithological profile based on geophysical logs of chemical composition provided by geochemical gamma-gamma well logging probes has been increasingly used for geophysical interpretation. A chemical profile, analogous to the measurements mentioned above, can be determined based on measurements made with a portable X-ray fluorescence spectrometer (pXRF). This paper presents a methodology for determining the mineral composition of drilled, clastic, as well as clay-rich rocks on the basis of both inexpensive and timesaving pXRF measurements as well as models combining the results of chemical composition analysis with results of mineral composition analysis (XRD). The results of chemical composition analysis obtained with a portable XRF spectrometer were calibrated based on a detailed analysis produced with ICP-OES and ICP-MS methods. A significant advantage of the proposed method is the possibility to apply it with regard to drill cuttings as well as archival cores. However, considerable discrepancies in the results obtained were identified while comparing the results of chemical composition analysed directly on the core and milled material. The analysed material comprised Carboniferous rocks derived from three boreholes located in Poland: Kobylin-1 as well as Biesiekierz-1 and -2. It was possible to directly compare the lithological profile obtained based on measurements taken on drill cuttings with the results of the lithological interpretation of a geochemical probe log.

1. Introduction

For years, geophysical logging has been a main tool used for hydrocarbon exploration by oil and gas companies. Expanding the set of geophysical logging owing to more and more up-to-date and precise analysing probes as well as an increasingly wide set of chemical components measured in the studied rock formations, provides new opportunities to analyse the lithological variability of the rocks drilled [1,2]. The interpretation of geophysical logs is based on an assumed lithological profile. The more this profile responds to the real lithology of rocks drilled in a borehole, the more precise the interpretation of the remaining deposit parameters will be.
The importance of the knowledge of mineralogy of a drilled geological formation led to the situation whereby the reconstruction of a lithological profile along with an interpretation of geophysical logs has become increasingly often conducted based on geophysical measurements of chemical composition. It is usually taken with geochemical probes of a LithoScaner (Schlumberger) or GEM (Halliburton) type. The reconstruction of a lithological profile based on such measurements allows to continuously analyse the variability of mineral composition in a borehole as well as to use this information while interpreting the remaining geophysical logs [3,4]. Logging of this type was introduced in the 1980s [5,6,7,8] and because of its usefulness it gained widespread popularity despite its high costs. The interpretation of geochemical logs is based on an assumed mineralogy of drilled rocks.
Chemical composition analysis with the use of a portable X-ray fluorescence (pXRF) spectrometer is another alternative method, allowing for the identification of the mineralogy of a drilled geological formation based on examining core samples or drill cuttings. The possibilities of applying a pXRF in oil prospecting have been recently described by Yarbrough et al. [9] but mainly in terms of chemostratigraphic analysis. Although a portable XRF spectrometer is widely applied in a number of areas nowadays, mainly for field geochemical analyses for mining and environmental studies [10], there have still been relatively few examples describing its use in the oil industry [11,12,13] and it is rather utilized as a tool for the first rough evaluation of mineral composition directly on the rig while drilling. Below, the authors will attempt to demonstrate that the above mentioned measurements, after calibration, can also become a useful tool allowing to identify a very precise mineral composition of drilled rocks and enabling a quick and reliable reconstruction of their lithological profile, even in the case of rock formations containing clay minerals.
During first attempts at using a portable XRF spectrometer while searching for shale gas in Poland, the authors noticed that it enabled them, as in the case of GEM measurements (Figure 1), to obtain a good quality chemical profile in a borehole with a long coring interval. The authors also stated that, owing to calibration of the above mentioned measurements and by juxtaposing them with mineral composition analysis results obtained with the XRD method, it is possible to develop a precise mineralogical model of a geological formation as well as its lithological profile, similar to the ones achieved with geochemical probes.
The presented paper demonstrates a new methodological approach allowing for the precise reconstruction of a lithological profile based both on inexpensive and timesaving pXRF measurements on core samples and drill cuttings, as well as on models constructed with the use of mineral composition analysis results achieved with the XRD method. The main advantage of the new approach is the possibility of applying it in boreholes without the necessity of coring them. Moreover, it also enables the use of archival cores. In their work, the authors had a very practical aim in mind, namely, to reduce the costs of lithological analysis and to develop a methodology allowing to work on drill cuttings due to the fact that oil companies with growing frequency reduce the range of coring, especially in successive exploitation boreholes drilled on preliminarily documented oil and gas deposits.
The main limitations of geochemical logs are their high costs and the lack of such a data for archival boreholes. The idea is not to completely replace geochemical logging with pXRF measurement, but we would like to show that both kinds of data could be used together. In many cases, it could help to lower costs or supplement the new data with their archival counterparts. For example, there are a lot of archival cores in Poland, which is connected the extensive exploration conducted in the second half of the 20th century. In this paper, we will try to prove that, using pXRF and our methodology, a set of data compatible to geochemical logs could be obtained.

2. Materials and Methods

2.1. Mineral Versus Chemical Rock Composition

It should be taken into account that only contents of particular elements are measured in a borehole. Subsequently, it is necessary to assume a particular mineralogical model and only on this basis, the mineral composition of a drilled geological formation is calculated. The process is not unequivocal. Only detailed knowledge of mineral composition leads to identification of relationships allowing to combine chemical and mineral compositions and then to development of a mineralogical model, owing to which a precise lithological interpretation of geochemical logging will be possible.
Table 1 presents chemical formulas of rock-forming minerals most frequently encountered in research material derived from main sedimentary basins, in which hydrocarbon deposits occur in Poland. However, it should be emphasised that, for the majority of minerals, their real chemical compositions may vary considerably from the theoretically defined ones due to possible mutual substitutions of particular cations in the crystal structure of minerals, of which clay minerals are an extreme example. It can also be remarked that, in the case of sedimentary rocks, one can deal not only with differences in a rock skeleton composition (directly related to various detrital material source areas) but also with successive cementation generations with varying mineral and chemical compositions (which result from changes in pore water chemistry).
In the next column of Table 1, mineral theoretical formulas are presented in their oxide forms. As can easily be noticed, not all compounds can be presented in their oxide forms, e.g., sulphides, chlorides, or fluorides (marked red in the table) do not contain oxygen in their composition. However, if there is no information on a sulphur and chlorine content, it has been assumed to present a rock chemical composition in an oxide form. Another issue worth noting is the valence state of iron. In a natural state, the majority of elements in a greater number constituting the composition of rock-forming minerals adopt one particular valence. It is not the same in the case of iron—both divalent and trivalent iron forms are equally popular in nature and, additionally, both forms could be present in some phases simultaneously (e.g., in chlorites).
To sum up, trying to identify rock mineral composition based on chemical composition, one needs to develop a mineralogical model of the analysed rock formation, taking into account its specific mineralogical features. We also have to identify chemical compositions of all the minerals occurring in tested samples. Because of various sedimentary and diagenetic histories or diversified rock skeleton compositions, it is not possible to develop a precise and simultaneously universal model for all studied rocks derived from different sedimentary basins. Applied approximations automatically reduce the quality of lithological interpretation.
Limitations of methods for mineral and chemical composition analysis are still another issue to be faced. No analytical method allows for the simultaneous measurement, with the same accuracy, of the contents of all elements occurring in tested rock samples. Additionally, various chemical analysis methods have different limits of detection for different elements, often dependent on the type of matrix, i.e., on what the total composition of an analysed sample is.
The X-ray fluorescent method (XRF) makes it possible to analyse the contents of elements ranging from Na up to U. Thus, we do not obtain information on the content of, e.g., carbon C or water. Moreover, for many portable devices (as it is in our case), the first measured element is Mg and even for Mg the measurement error is very big, as can be noticed on correlation plots presented in the following Section. This is connected with the principles of the XRF method. The energy of fluorescent X-rays corresponds directly to the atomic number of the element. For light elements, the fluorescence is so weak that even air disturbs it.
Measurements of the Na content have to be conducted in a helium atmosphere. Also, to achieve more precise results for Mg, the same methodology should be applied. The newest models of pXRF provide the opportunity for the direct analysis of light elements with a helium purging installation. The possibility of measuring the Na content enables more accurate estimation of the plagioclase content. Because we did not have the information regarding the Na content, the quantity of plagioclase was estimated indirectly, which is described in Section 3.5 and Section 3.6. In the case of mineral composition analysis, it should be noticed that each analytical program for determining mineral composition in quantitative terms contains a particular set of mineral standards, only approximately corresponding to minerals occurring in the studied material. Whether these are natural standards, as in the case of programs, such as RockJock [14], Quanta [15], and FULL-PAT [16], or theoretically calculated synthetic ones, as in the case of programs using the Rietveld method [17], such as BGMN [18], SIROQUANT [19], or TOPAS, proposed by the Bruker company, the selection of standards corresponding to phases occurring in analysed samples is not 100% accurate.
Different authors declare different levels of error for XRD [14,15,16,18,19]. In reality, the error level is difficult to estimate precisely at once for all rock samples. It depends not only on how well the standards are fitted, but also upon the complexity of the sample mineral composition, the whole sample absorption, or differences in the orientation ability or hardness of minerals present in the sample. To solve that problem, the procedure of constant controlling XRD results by correlation with chemistry (XRF) was introduced. Section 2.2 will present a methodological approach applied by the authors of the paper taking into account for the above-mentioned issues.

2.2. Methodology

2.2.1. General Description of the Methodological Approach

The basic assumption of the proposed methodology is the application of timesaving and inexpensive portable XRF spectrometer measurements in everyday practice of lithological reconstruction. The portable XRF spectrometer makes it possible to take measurements on a drilling core directly on a well-side or in a core store as well as on a material milled in a laboratory.
The proposed methodological approach is based on the observation that the results of chemical composition measurements taken with a pXRF well correlate with the results of research made in a renowned stationary lab. Owing to this, it is possible to calibrate these results on the basis of a detailed chemical composition analysis conducted for a set of representative samples. Because this is a non-destructive method, the same sample can be subsequently used for a mineral composition analysis with the XRD method, simultaneously controlling obtained results with regard to the chemical composition and receiving mathematical models combining both the mineral and chemical composition.
Models are built only on core samples, and at least 20–30 samples are used for that purpose. Samples don’t need to come from the analysed borehole, but they should come from the same geological formation, from the surrounding area. They should be carefully selected to represent whole range of mineral diversity of the drilled rocks.

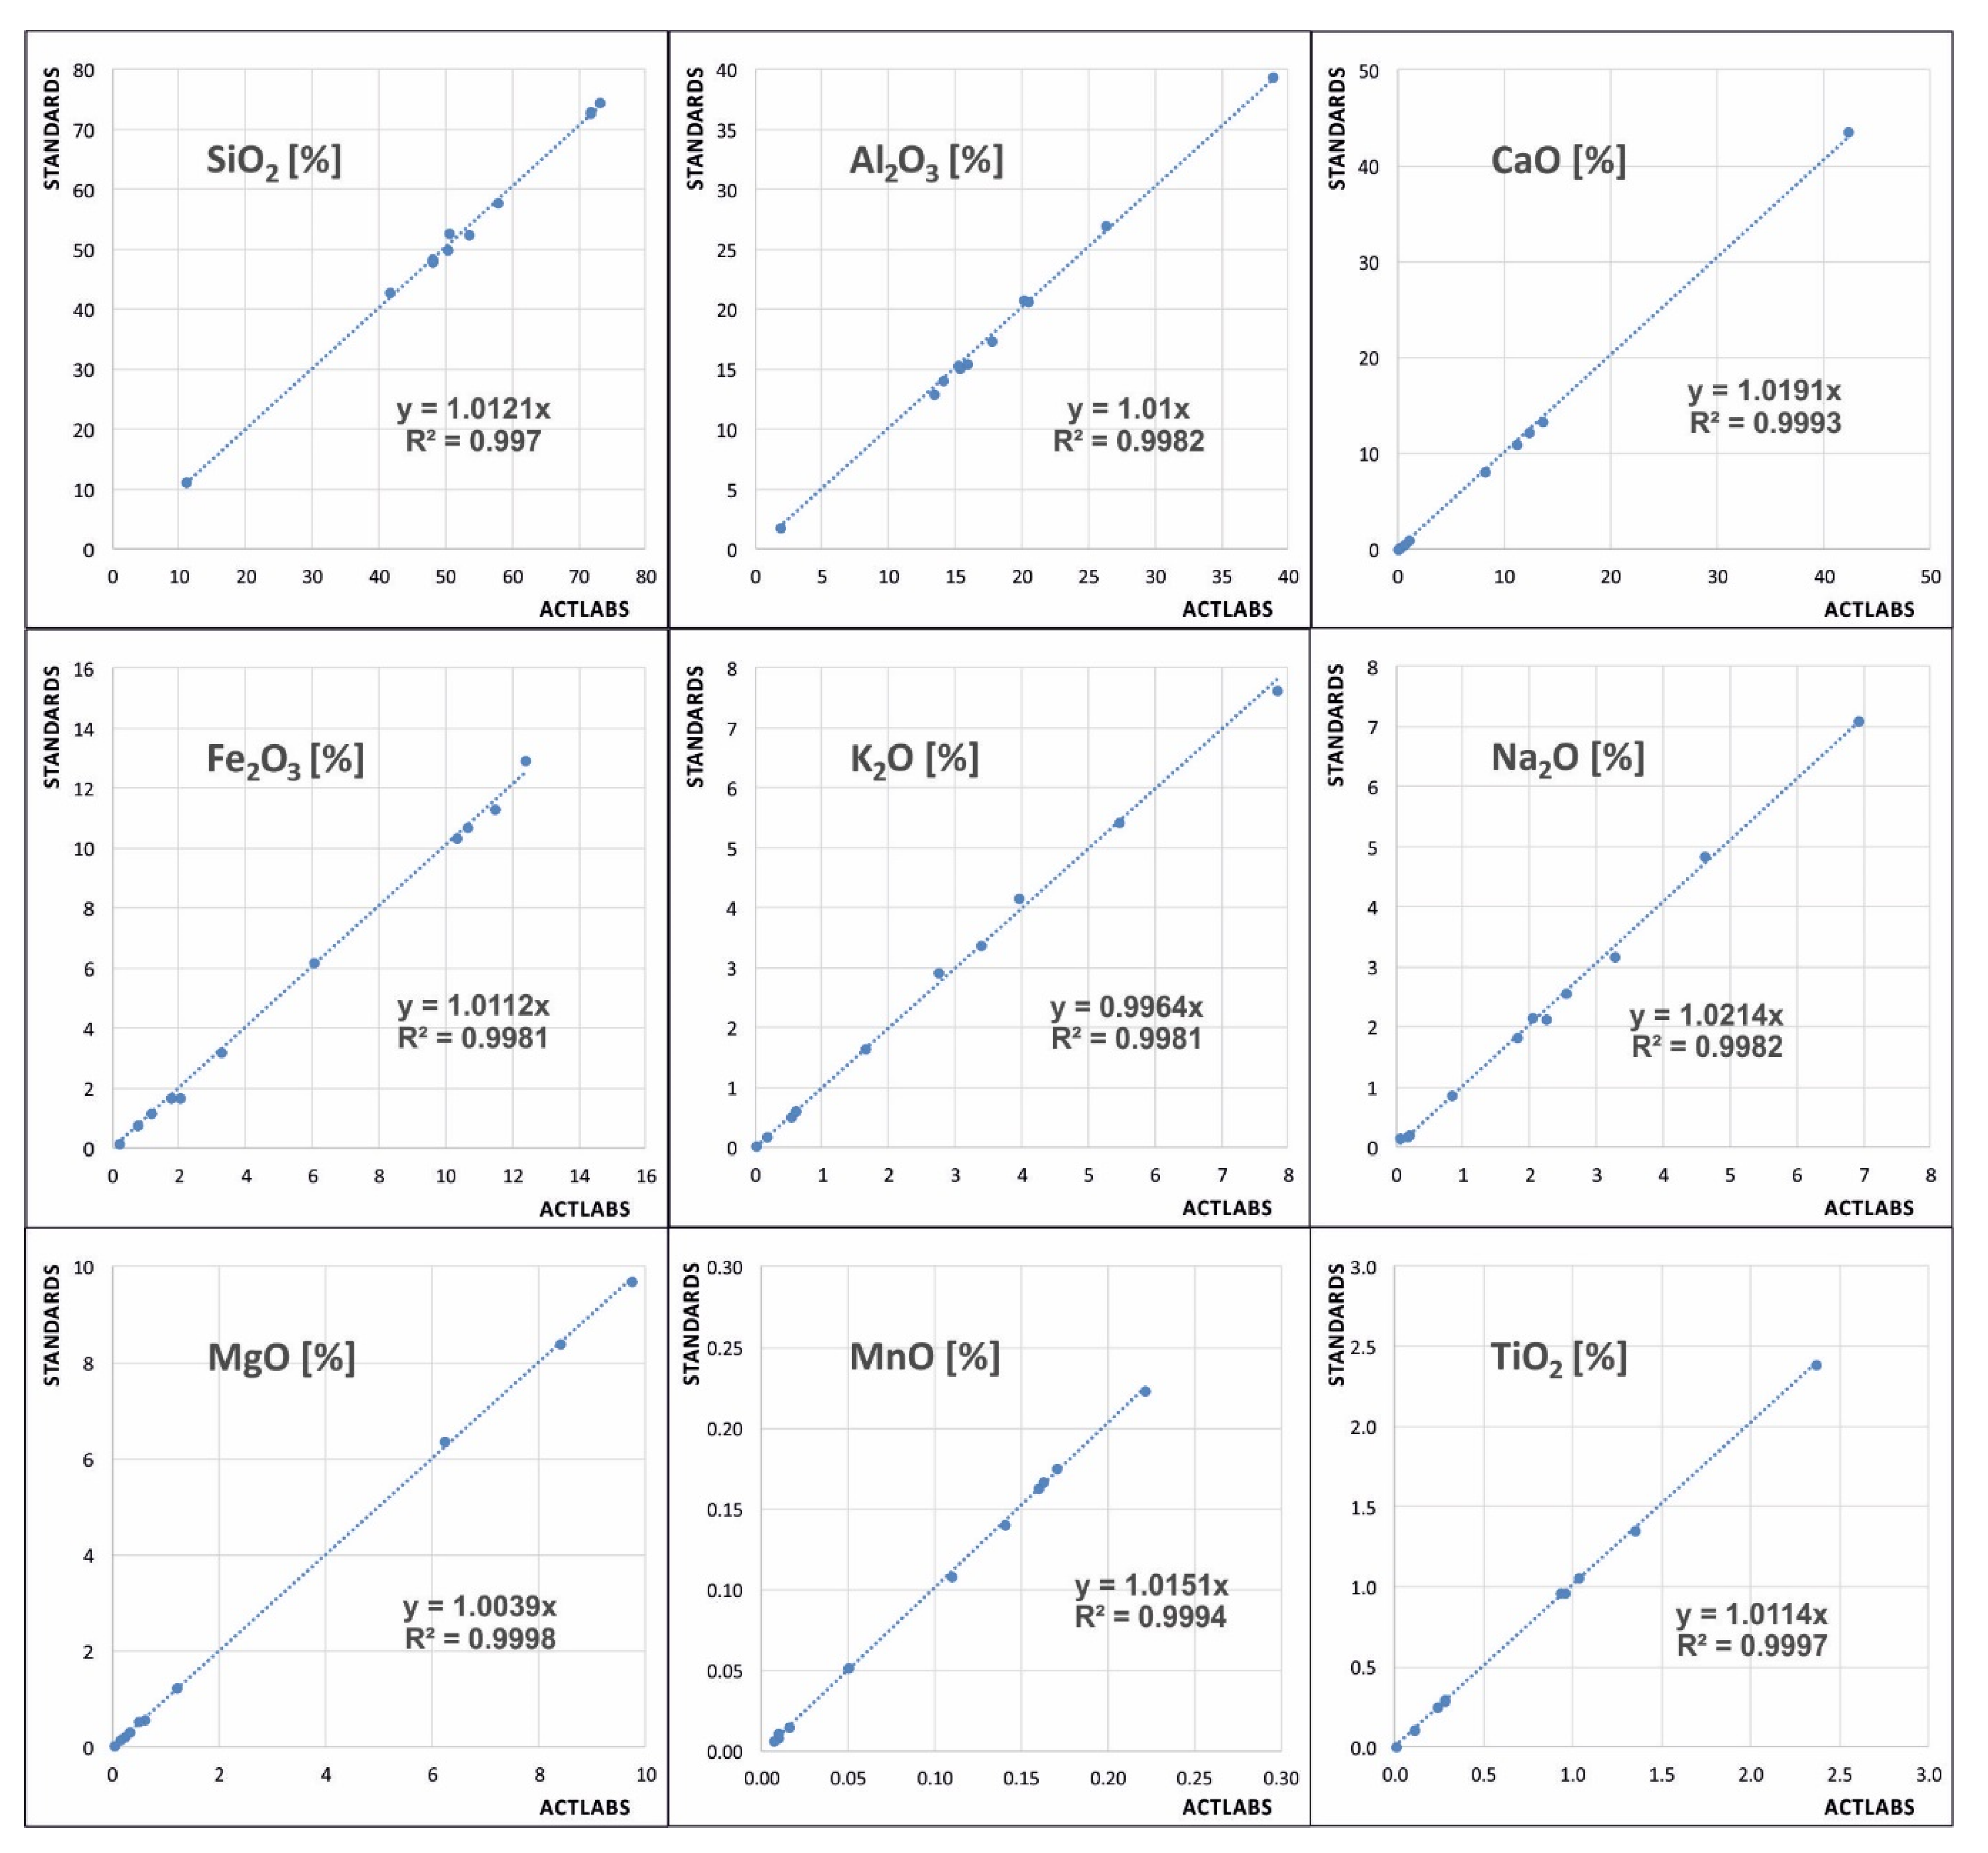
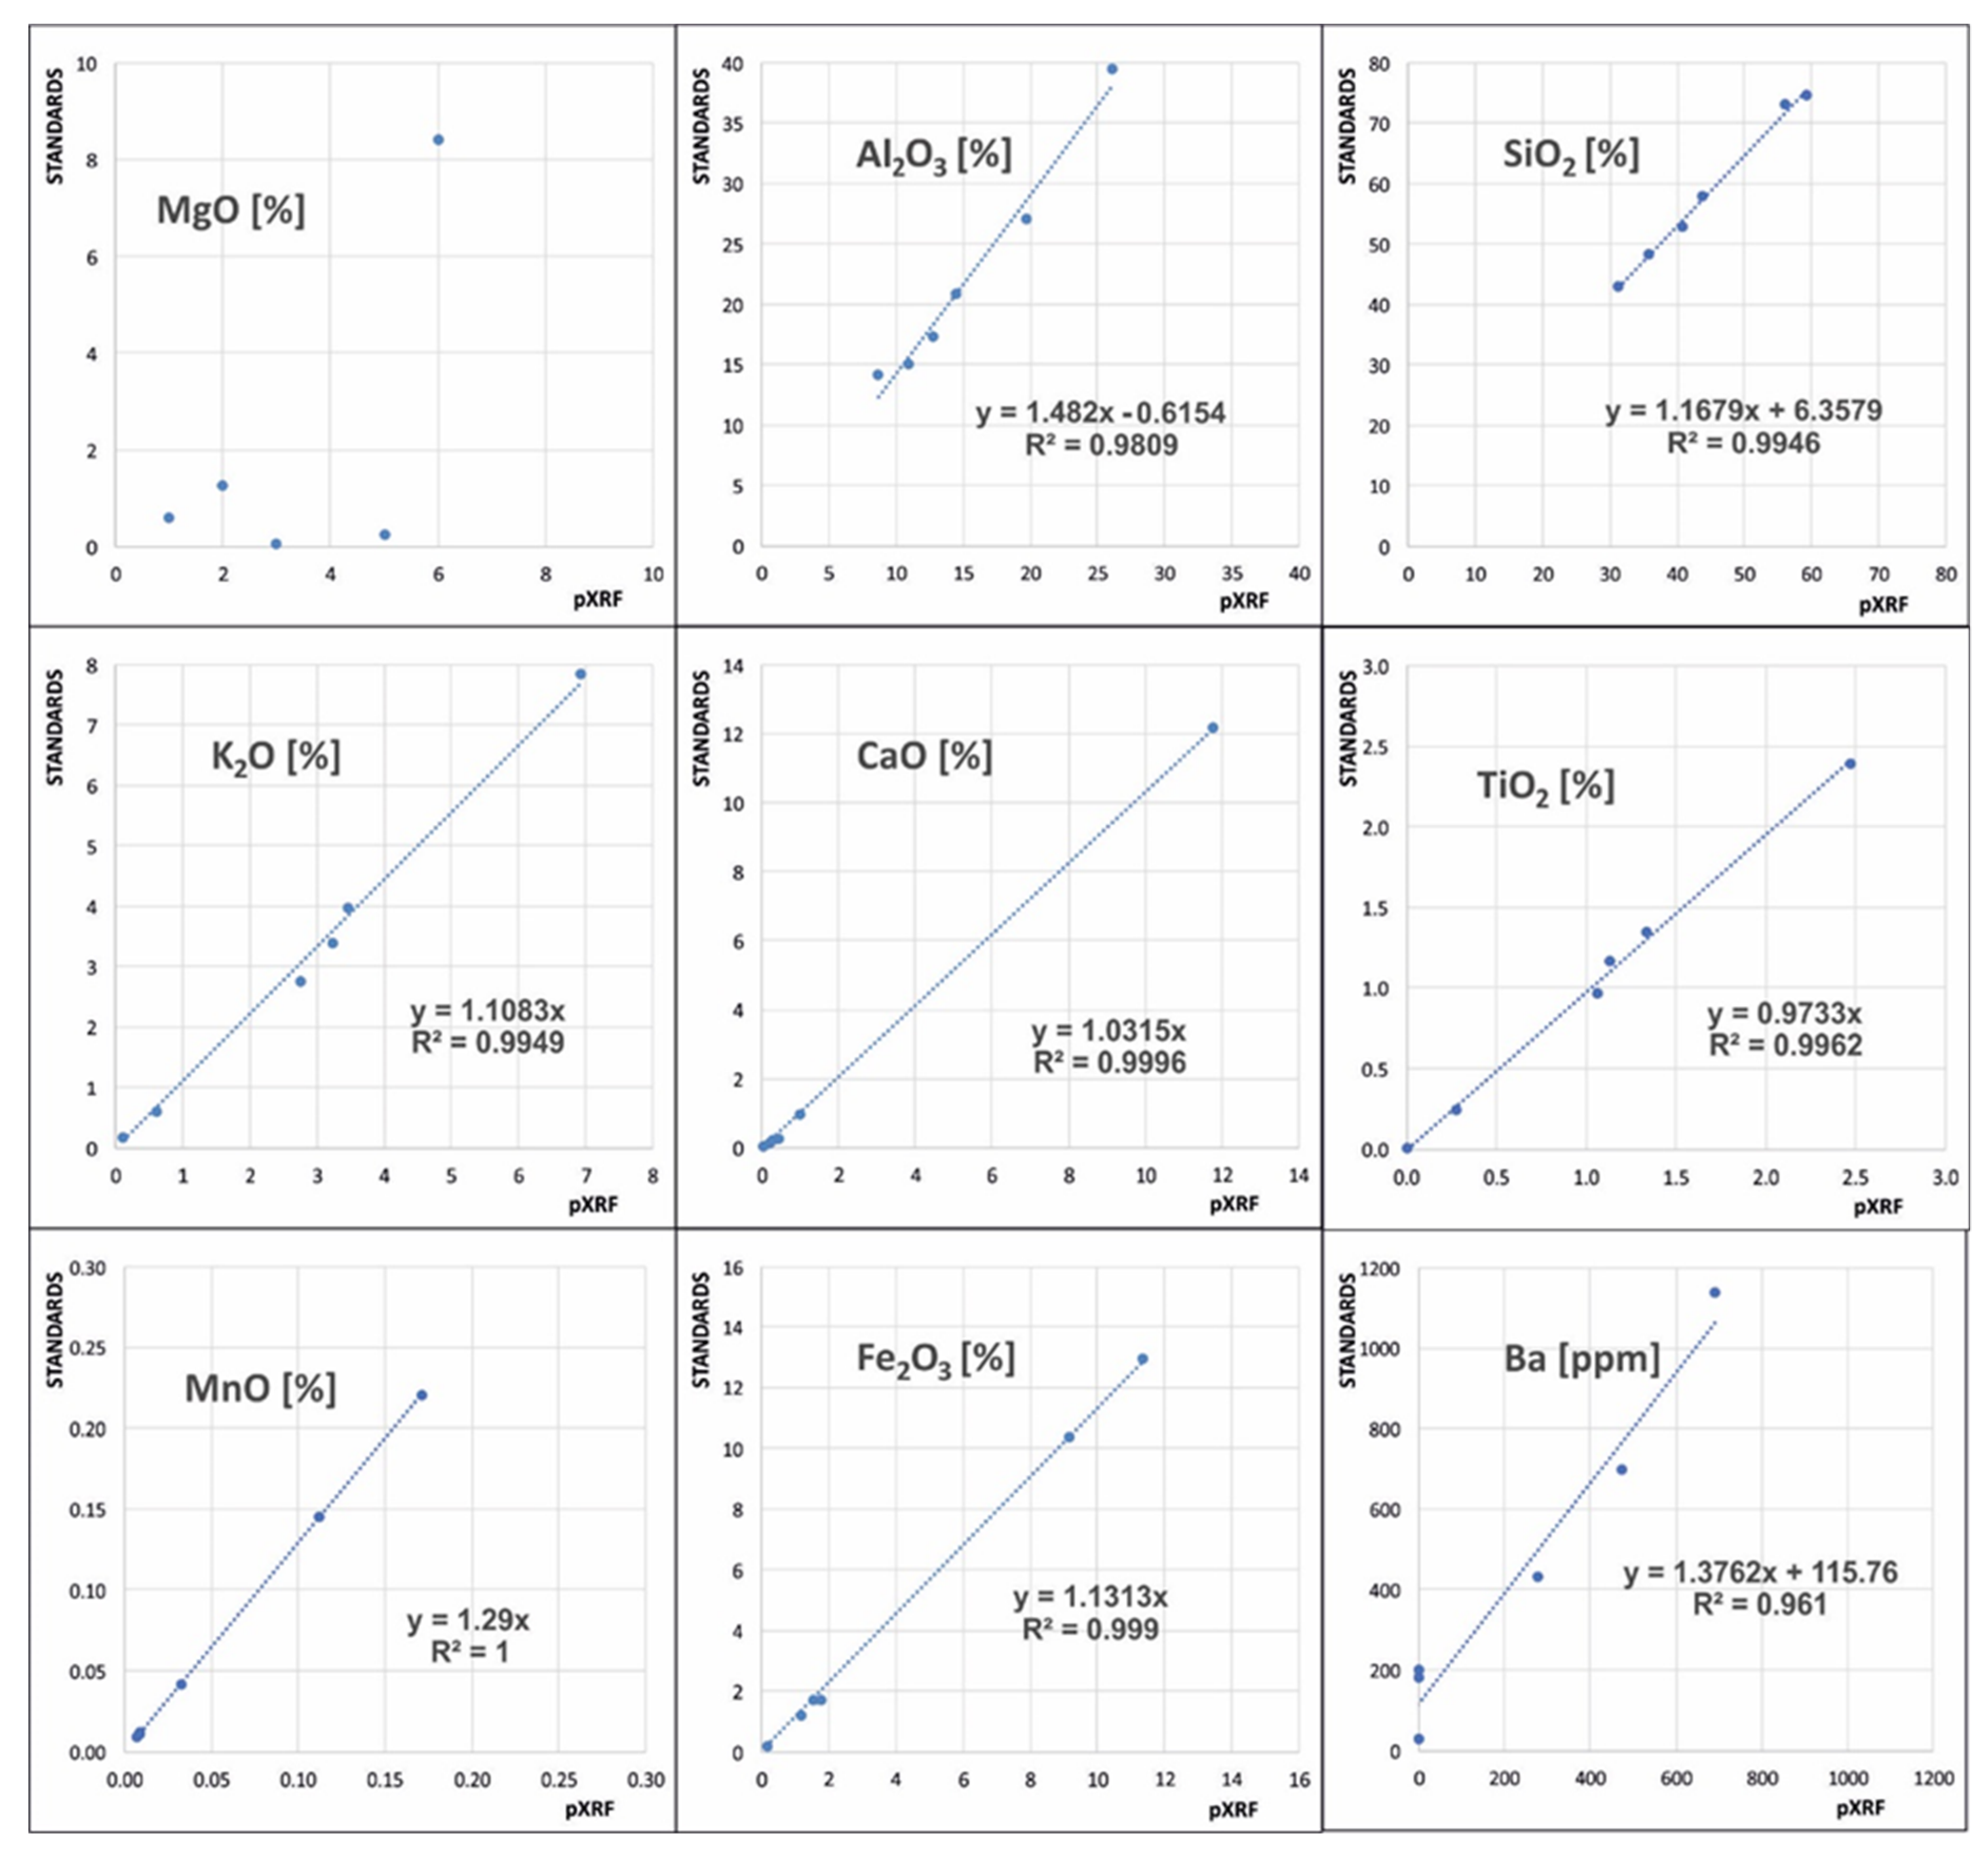
2.2.2. Chemical Composition Analysis

The majority of chemical composition analyses were conducted with a portable S1 TITAN spectrometer (Bruker, Billerica, MA, USA). S1 TITAN, using an energy dispersive X-ray fluorescence spectroscopy method (EDXRF), is equipped with a Rh anode (with maximum parameters: 50 kV, 100 µA, 4 W) and a 10 mm2 X-Flash® Silicon Drift Detector (SDD) (with typical resolution of 147 eV for the Mn K-alfa line). A chemical composition analysis is carried out based on the fundamental parameters method, allowing to take measurements without the necessity of applying standards. The spectrometer allows for the analysis of contents of elements ranging from Mg to U. Measurements can be made both on rock samples as well as on milled material, directly in the field or in a laboratory.
During the analysis, a standard Geochem calibration was applied. However, the counting time was maximally extended. Owing to this procedure, light elements were measured with great accuracy. With the maximum counting time of 300 s that can be used in S1 TITAN, heavy elements were measured for 60 s and light elements for 240 s. The obtained results were controlled by comparing them with the results of measurements conducted with a stationary spectrometer in the SGS laboratory in Canada [20].
A detailed chemical composition analysis allowing for rare earth elements was produced in the Activation Laboratories Ltd.’s (Actlabs) in Canada (Ancaster, ON, Canada) on samples melted with lithium metaborate and tetraborate. The tests were conducted with the FUS-OES and FUS-MS methods. A high quality of measurements in the selected laboratory was confirmed on the basis of measurements taken for a set of six NIST standards. Encrypted standard samples were also dispatched for analysis to the ACTLABS laboratory. An exemplary correlation graph was presented in Figure 2. Ideally, a linear relationship with the equation y = 0.9964x and the correlation coefficient R2 0.998 points to the accuracy of results received from the ACTLABS laboratory. The graph also shows the results of calibration measurements carried out on a standard basis by the contractor in parallel to the analysis of samples provided by the customer.
The NIST standards was used also to estimate the quality of pXRF measurements and to verify the error given by instrument. The following figure (Figure 3) illustrates the results of NIST standard analysis carried out with a portable XRF spectrometer in our laboratory. In this case, a linear relationship is also observed with the correlation coefficient R2 close to 1. A good correlation of the results is clearly visible, except for Mg (Figure 3). Magnesium is a light element and a measurement error in that case is greater than for other elements, as mentioned above. The presented correlation plots also show the real error of pXRF measurements. The error given by the instrument itself displays only the measurements reproducibility. To achieve really accurate, standardized results, the data should be calibrated in regard to standard laboratory measurements.

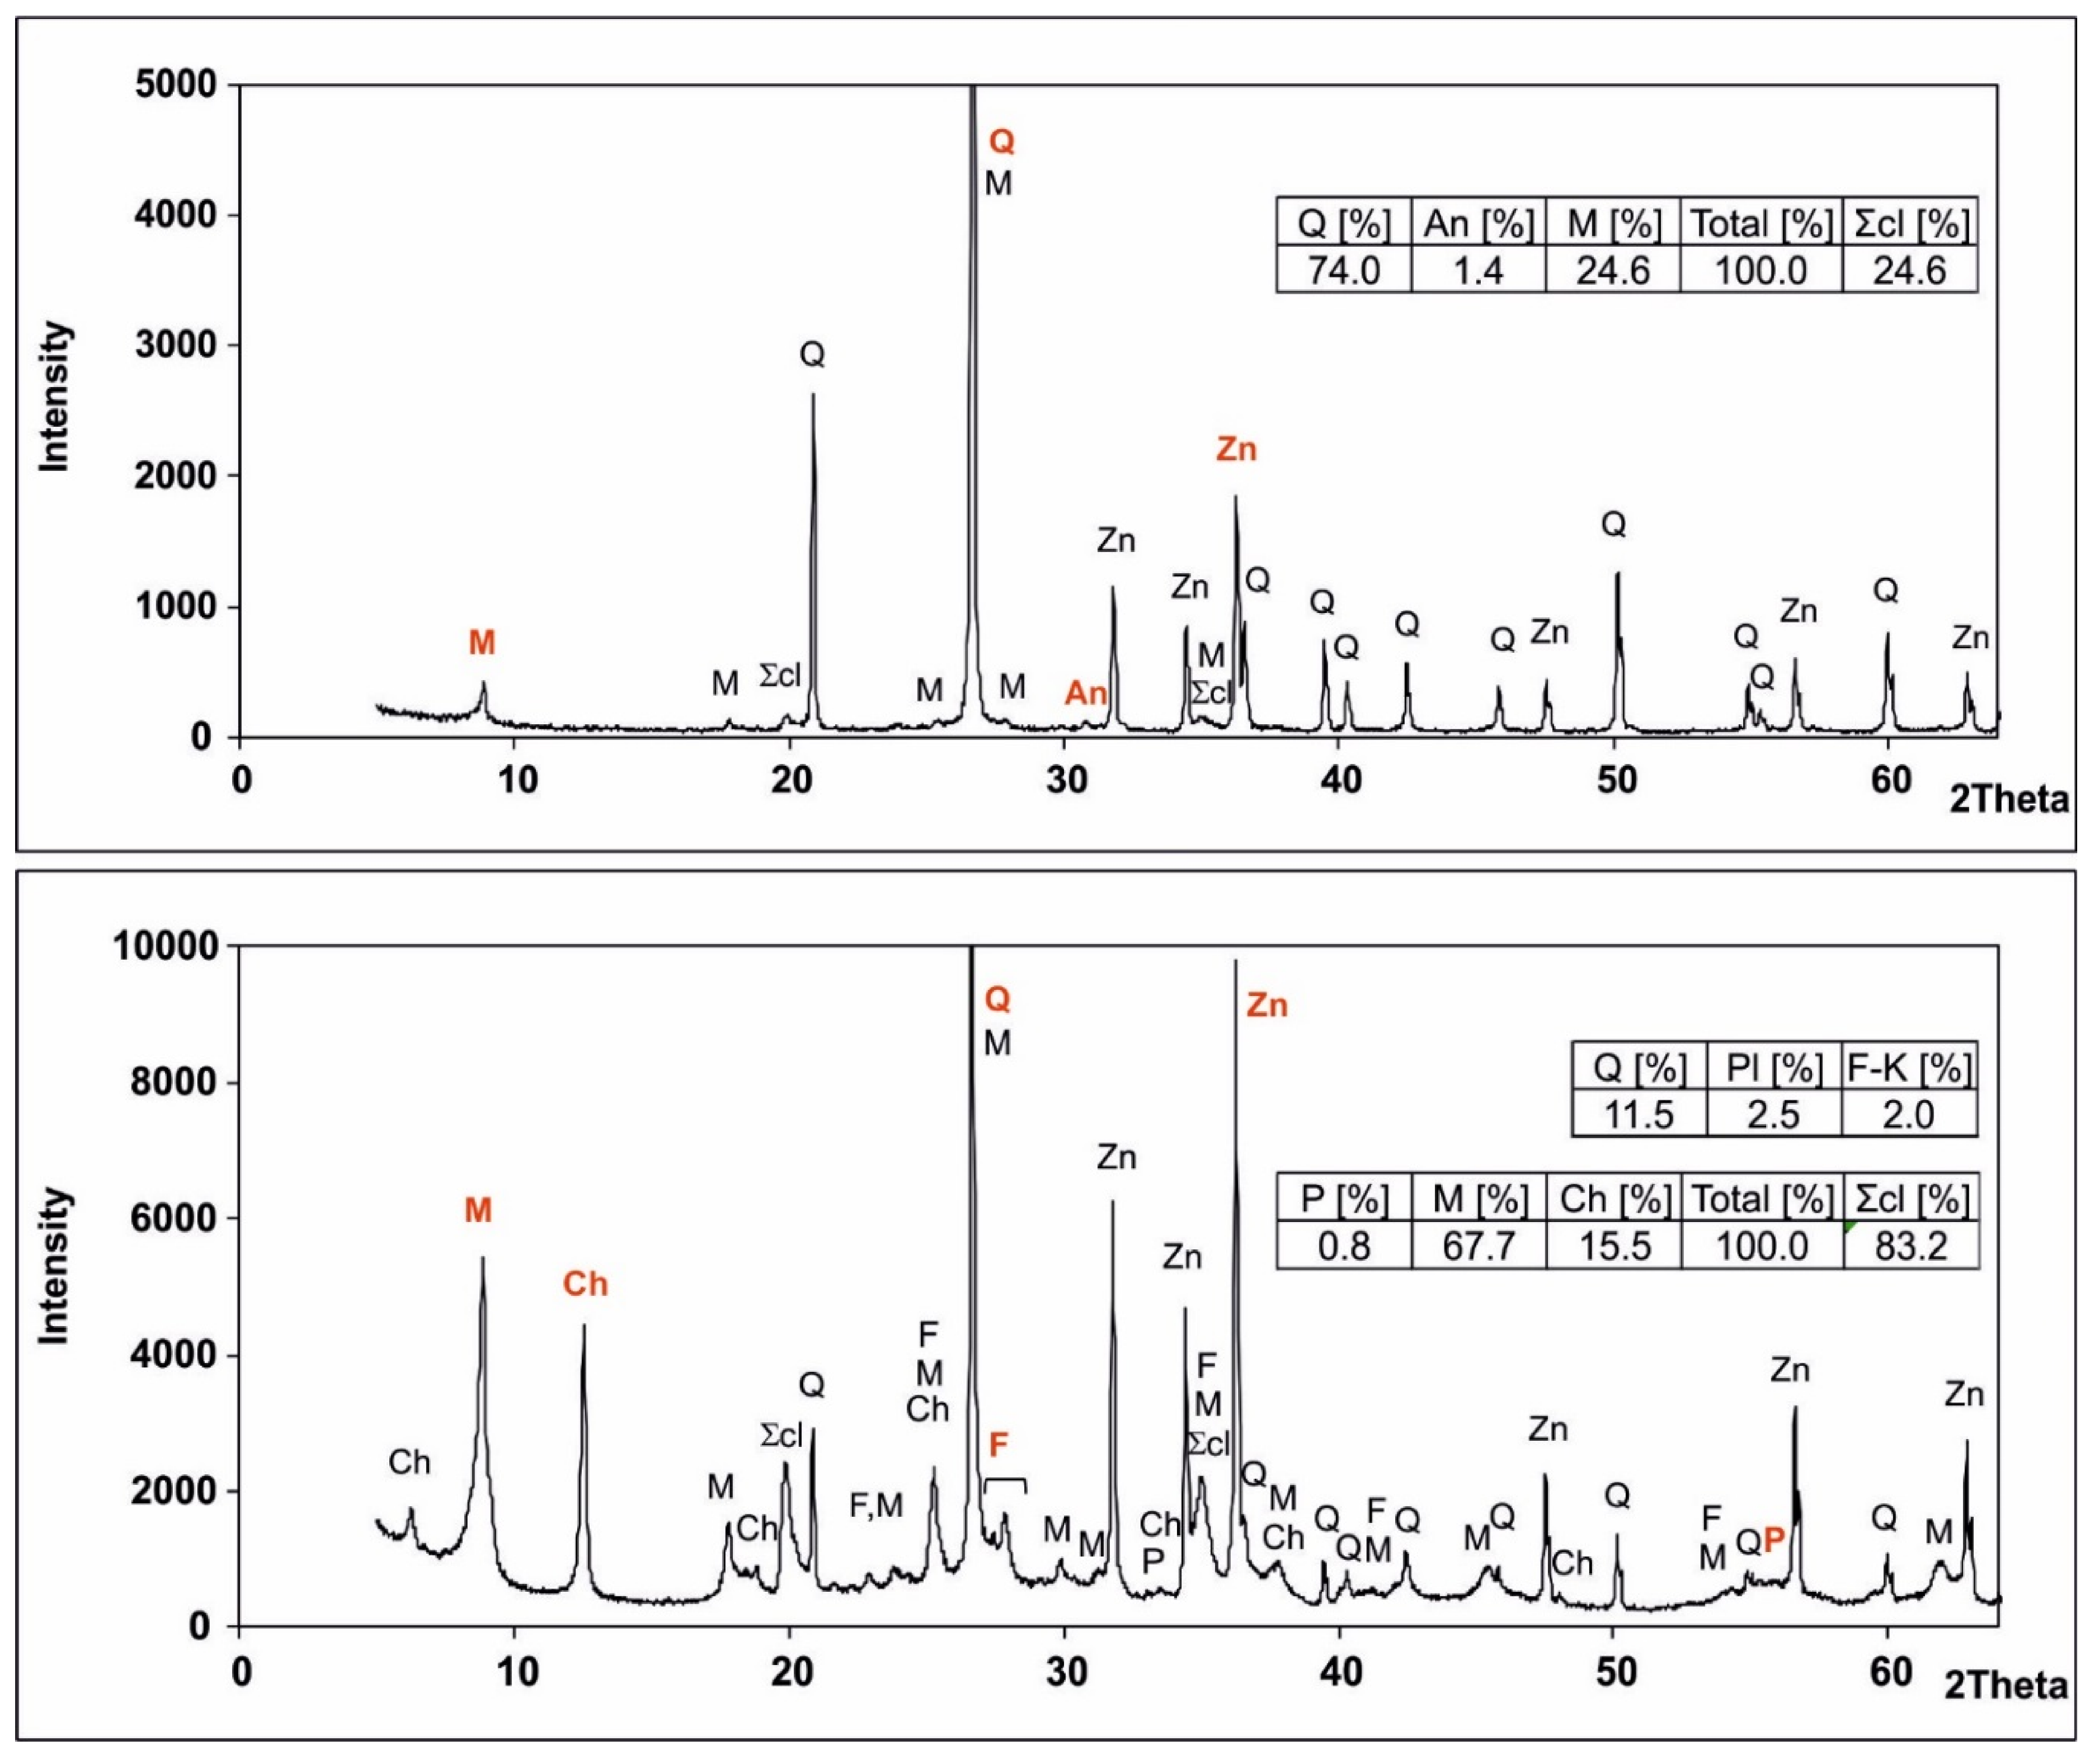
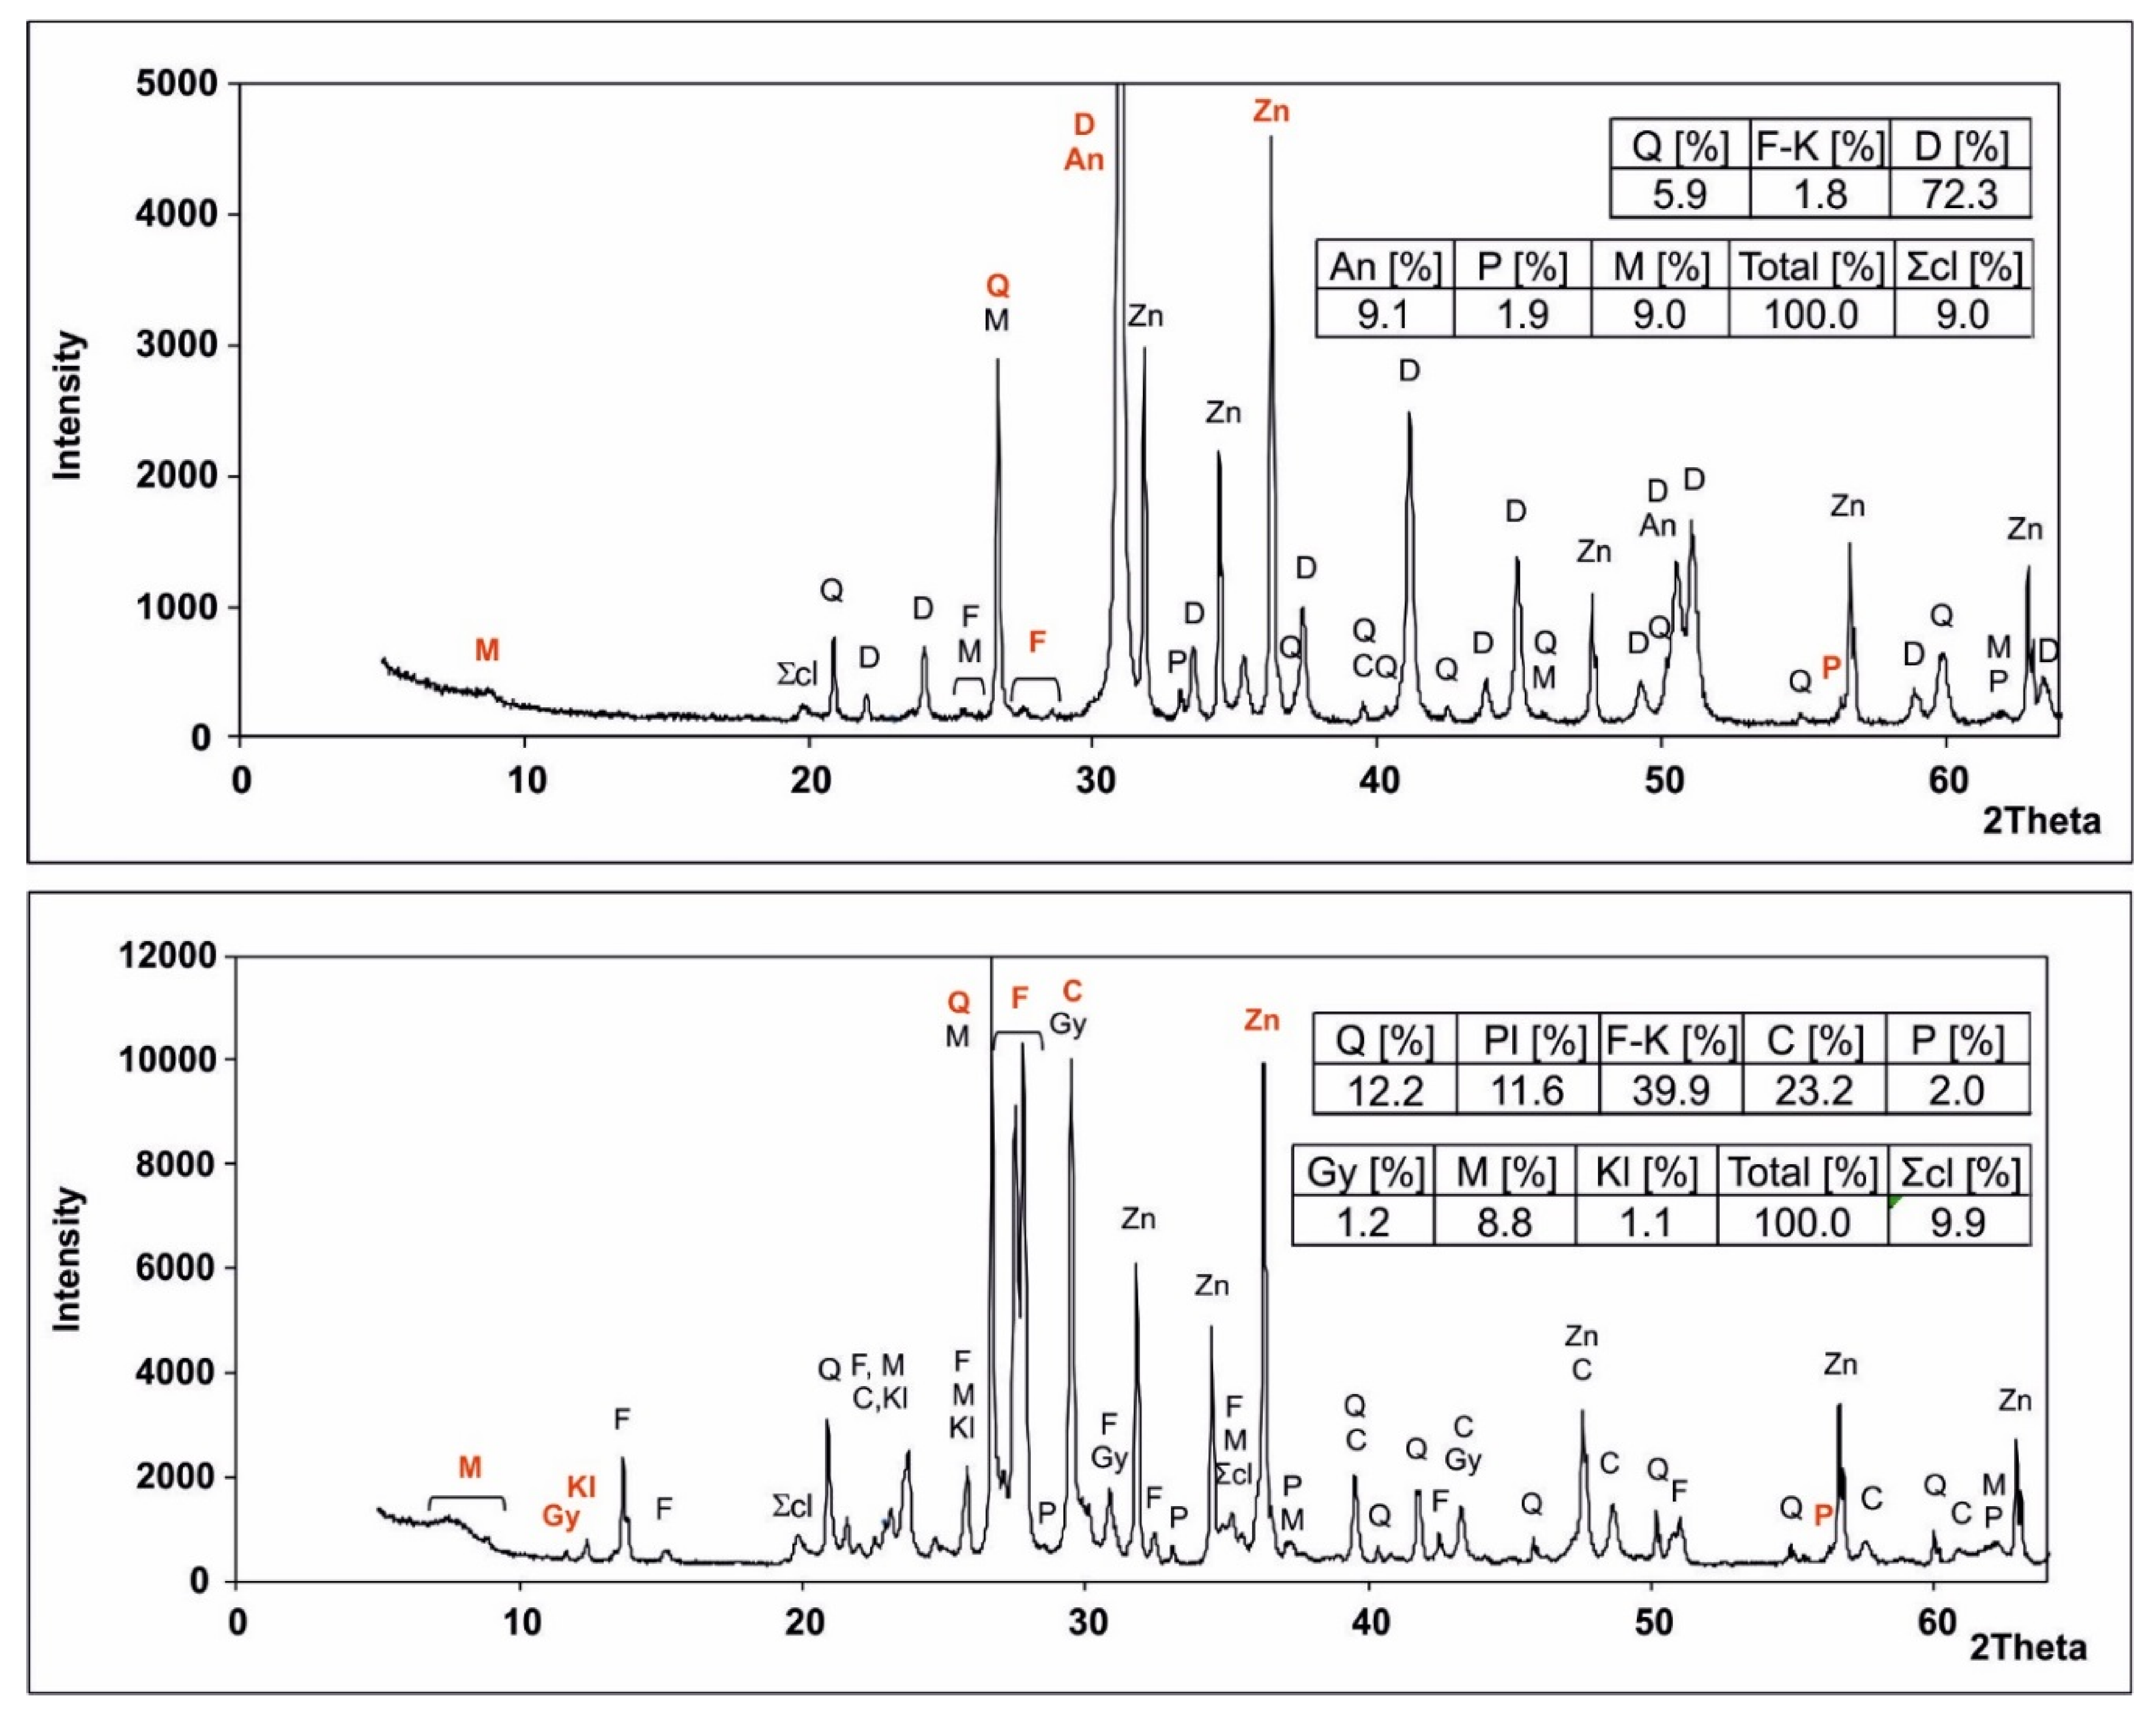
2.2.3. XRD Methodology

X-ray measurements were taken on a Panalytical X’Pert Pro equipped with a modern X’Celerator detector. The following set up was applied: 40 kV voltage, 34 mA anode current, 0.02°2θ step-width and the angular range from 5° to 65°2θ. Random preparations loaded from the side were prepared in line with the procedure specially recommended for rocks containing a large number of clay minerals [15]. The samples were initially ground to granulation below 20 µm with a Pultverisset 7 mill. Next, in order to refine the granulation to <5 µm and homogenize with an internal standard, the samples were milled again in wet conditions (with methanol) for 5 min in a McCrone micronizing mill. Zinc oxide in the amount of 10% was applied as the internal standard. Measurements were conducted on random preparations loaded from the side, which ensures obtaining real proportions of mineral components occurring in the samples as well as a repeatable density of preparation.
A mineral quantitative composition was calculated by the Rietveld method with the use of the SIROQUANT computer program (version 3) [17,19,21], with documented usefulness for composition analysis of rocks, also including clay minerals [22]. The Rietveld method [17] is applicable in an increasing number of programs for mineral composition analysis using X-ray diffraction. It provides the opportunity for computer modelling with regard to the crystallographic structure of particular minerals occurring in the studied material, and their subsequent use as standards while analysing a qualitative composition. While modelling the atomic structure of particular minerals, it is possible to take into account their real chemical composition, crystallite sizes, the presence of structural defects, or the degree of preparation randomness.
The results of mineral composition analysis with the XRD method are on a standard basis controlled based on a correlation with tested samples chemical composition measured with a poretable XRF spectrometer. The pXRF chemical composition analysis is produced for all samples on the same research material initially ground in a Pulverisette 7 premium line (FRITSCH GmbH, Weimar, Germany) planetary micro mill before preparation for XRD measurements. Owing to the applied procedure, a number of people can interpret X-ray measurements at the same time as well as control the consistency of achieved results by observing mutual correlations.

2.2.4. Description of Lithological Profile Calculation Procedure

The reconstruction of a lithological profile based on the results of pXRF measurements taken in profiles of the studied boreholes was conducted in the ProGeo v.6.5 program, which enables, among others, the creation and processing of complicated interpretation algorithms, adjusted to standard geophysical logging as well as to point laboratory data. Computational algorithms defining relationships between a chemical and a mineral composition were created on the basis of empirical relationships between a chemical composition (pXRF data) and a mineral composition (XRD data). The above-mentioned models are presented in detail in a further part of the paper (Section 4.1 and Section 4.2).
The contents of each calculated mineral component were limited by assumed minimum and maximum values and weighted with an appropriate coefficient. Next, the calculated contents of mineral components were balanced in such a way so that the sum of mineral components altogether with porosity constituted 100%. Porosity values occurring in calculations were adopted from the borehole log report. The final stage was to calculate mineral composition resulting logs (single and cumulative) and to illustrate results graphically along with XRD laboratory data. Weighting coefficients for particular components applied during the interpretation were selected by iteration in order to achieve the best compatibility of calculation results with XRD data.

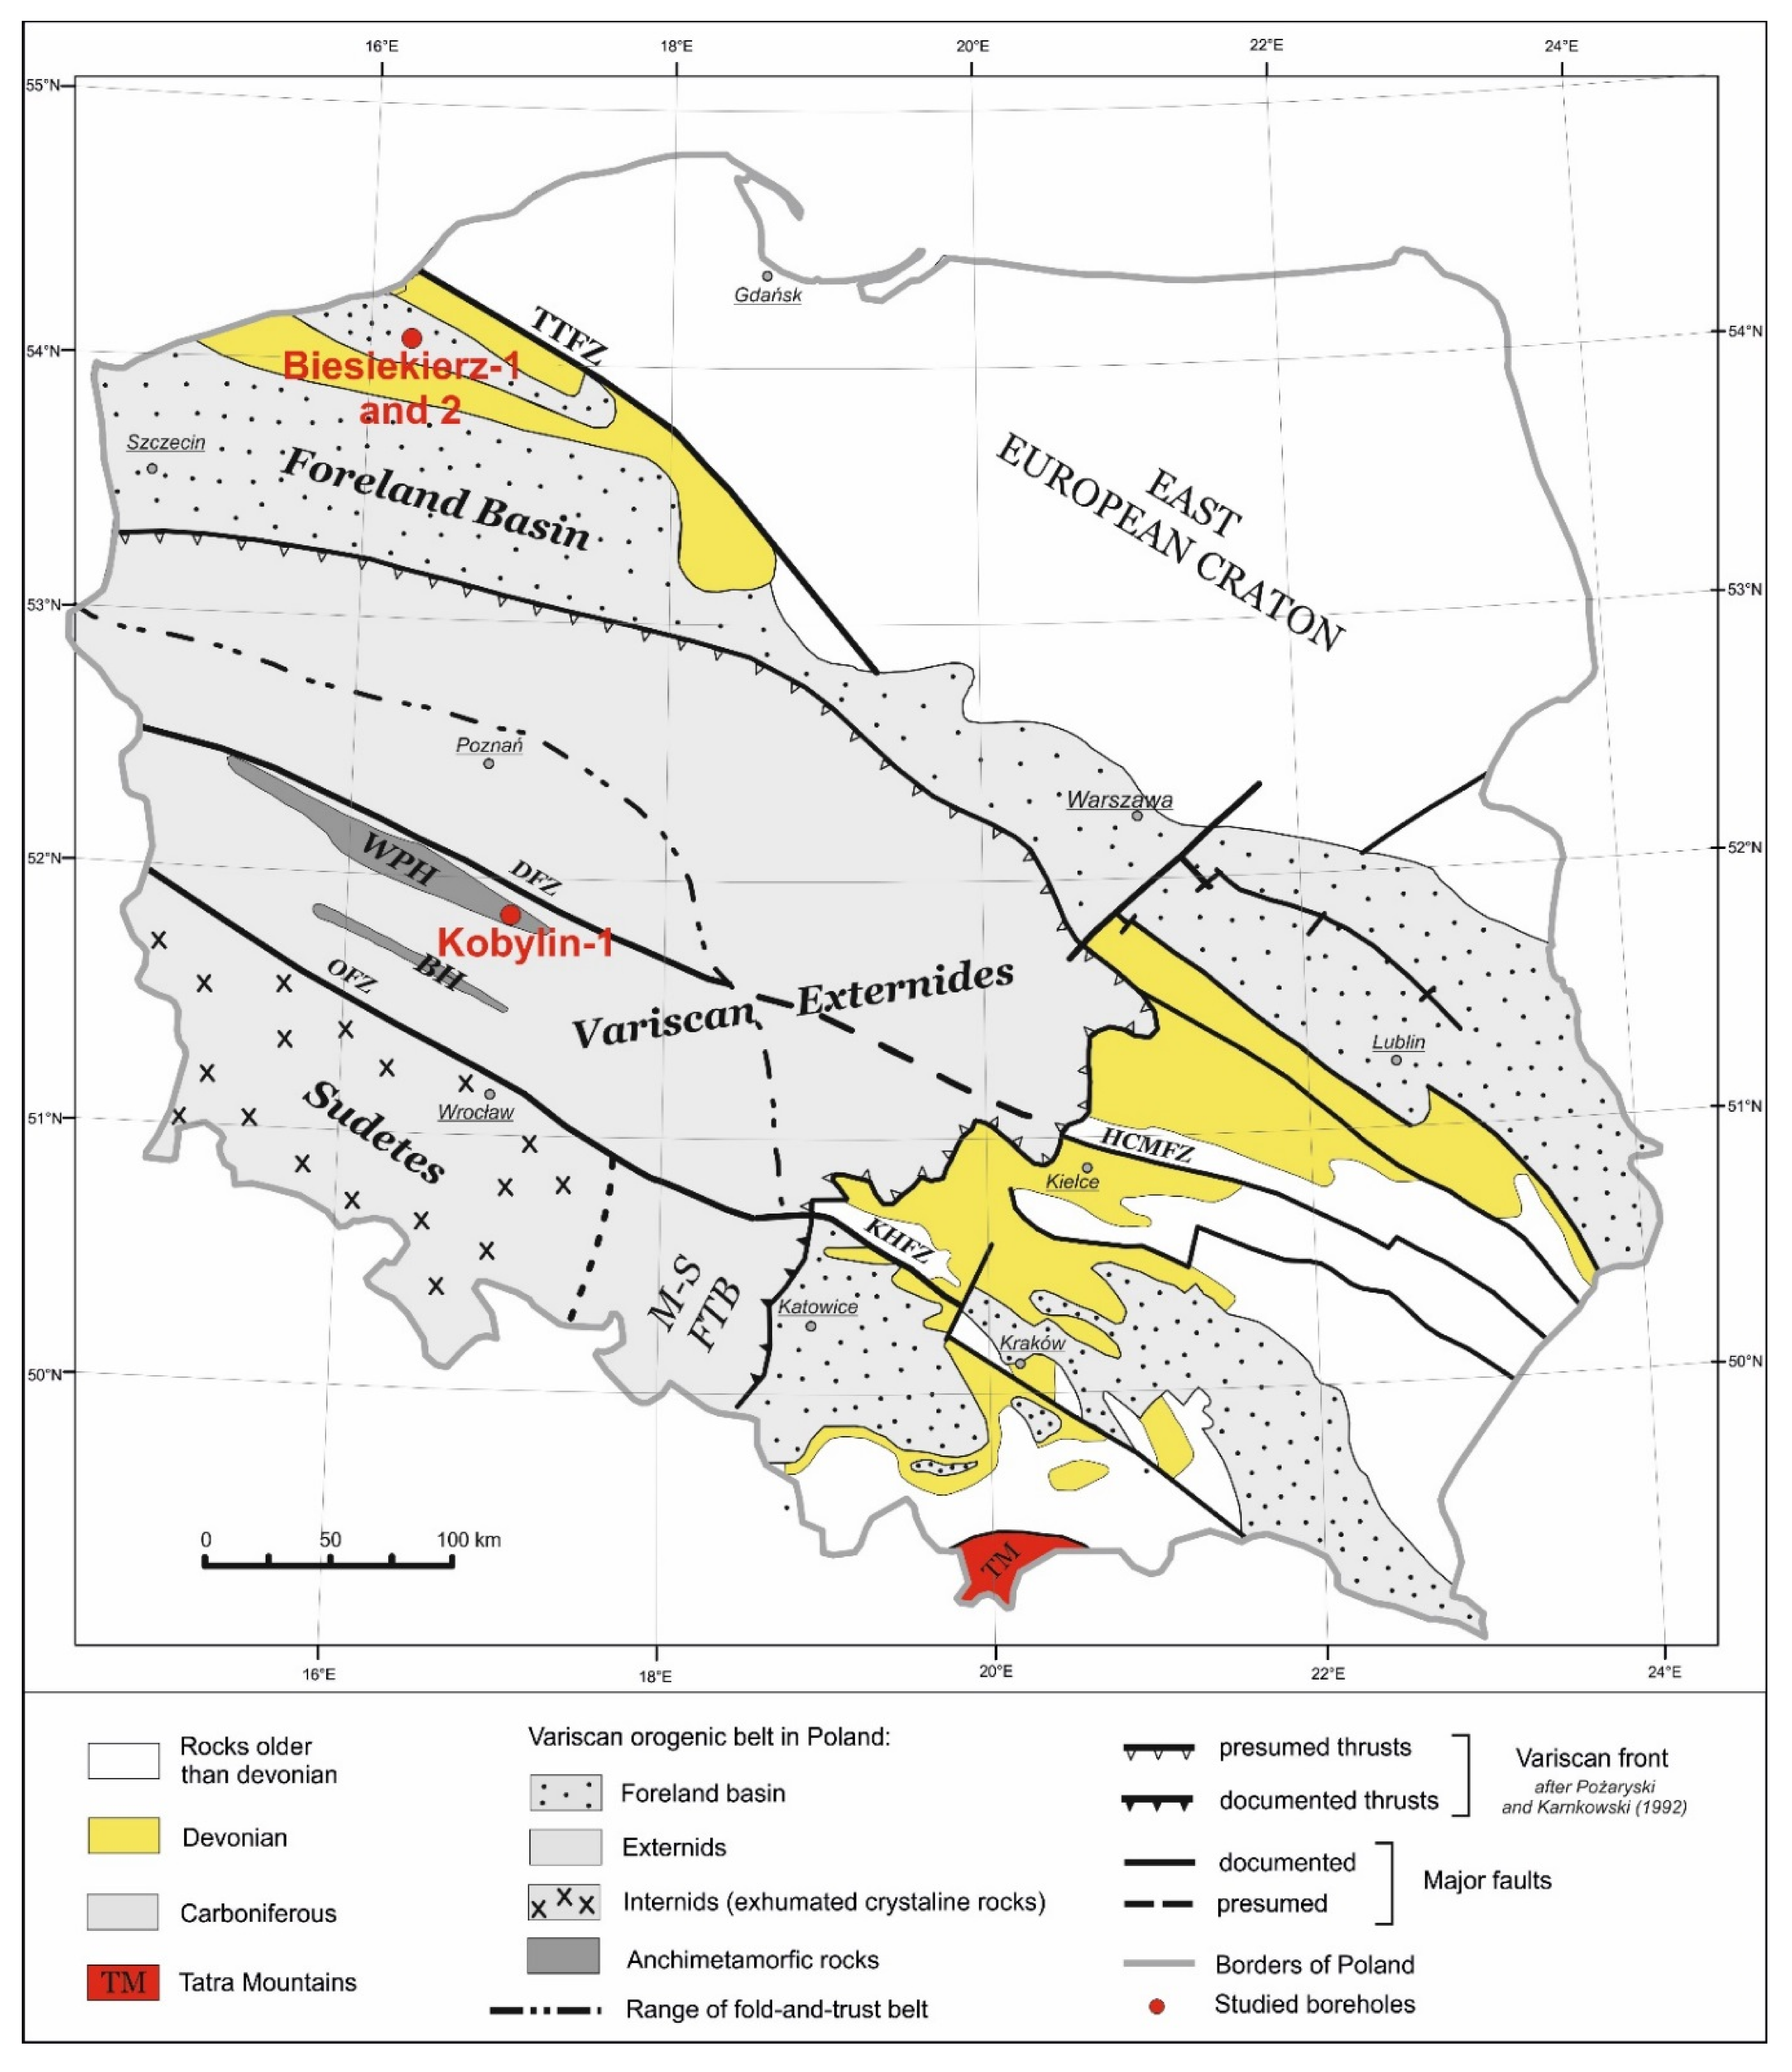
2.3. Research Material

In order to analyse the possibilities of applying the developed methodology, research studies were made for three boreholes located in two different places in Poland, positioned within the Variscan Front and in its foreland. The Kobylin-1 borehole is situated within the Fore-Sudetic Monocline, and Biesiekierz-1 and -2 in the region of Western Pomerania (Figure 4).
In all the boreholes, Carboniferous rocks were a research object, but they differed significantly among each other in terms of lithological features. In the Kobylin-1 borehole, a drilled rock sequence contained mainly quartzite and claystone with a high degree of diagenesis. However, in the Biesiekierz-1 and -2 boreholes, there was a predominance of strongly arkosic sandstones with a large number of carbonate as well as claystone layers with a considerably lower degree of thermal transformations.
Carboniferous rocks of the Fore-Sudetic Monocline and Western Pomerania are treated as source rocks for conventional hydrocarbon deposits occurring in this region. They are part of a Carboniferous-Permian petroleum system extending across entire Europe. Recently, these rocks have also been a research object regarding unconventional gas deposits of a “tight gas” type.
In total, over 1000 measurements were made with a portable XRF spectrometer and for 40 samples a detailed chemical composition analysis was conducted taking into account the composition of Rare Earth Elements REE (in the ACTLABS laboratory in Canada). While constructing mineral models, 75 rock mineral composition (XRD) analyses were used and verified in terms of their usefulness for the development of universal models that might be applicable when calculating lithological profiles.
The Kobylin- 1 borehole was selected due to the possibility of taking measurements both on drill cuttings and on the core, which created a unique opportunity to compare results obtained with both of the methods. The Kobylin-1 borehole passed through 940 m of Carboniferous rocks. Cores were taken in eight sections. For the whole interval, about 230 cuttings were analysed with pXRF and an additional 111 points were measured on cores. A detailed mineralogical analysis of Carboniferous rocks drilled in the Kobylin-1 borehole was carried out within routine borehole measurements and covered over 50 samples evenly distributed across the entire profile. Another advantage of this borehole is the fact that the Haliburton company (Houston, Texas, USA) carried out a GEM logging downhole, commissioned by PGNiG SA, which enabled the comparison of two different ways to calculate a lithological profile.
The stratigraphic age of rocks occurring in this borehole was not determined with paleontological methods for lack of diagnostic taxa, possible to be marked, which is also related to a high degree of thermal transformations of Carboniferous rocks (>200 °C). However, zircon dating conducted for the Kobylin-1 borehole [24] allowed to establish that most probably these were Lower Carboniferous rocks, analogously to results obtained for the Paproć-29 borehole.
The Biesiekierz-1 and -2 boreholes were selected because of hydrocarbon deposit exploration works being carried out in this area at that time as well as problems encountered when correlating geophysical logging results between these boreholes. The Biesiekierz-2 borehole was under continuous coring from the top of the Carboniferous down to the bottom depth (the drilling was stopped in Devonian layers) on the distance of about 450 m. The Biesiekierz-1 borehole was cored in selected intervals. All measurements for both boreholes were carried out directly on cores in a core store: 406 for Biesiekierz-2 and 90 for Biesiekierz-1.
Despite the fact that the boreholes are located very close to each other (the distance between them is ca. 600 m), a visible change in the depth of the Carboniferous top was observed (over 150 m). In the case of the Biesiekierz-1 borehole, one might also be puzzled by the lack of correlation between a shale content determined based on XRD tests and from gamma ray (GR) logs. The pXRF measurements taken simultaneously for these boreholes allowed to make a lithological reconstruction and a borehole correlation. In both boreholes, drilled Carboniferous rocks have a very diversified mineral composition. Presumably, these are rocks of the Lower Carboniferous Period (the Tournai?), although paleontological documentation is not certain in this case.

3. Results

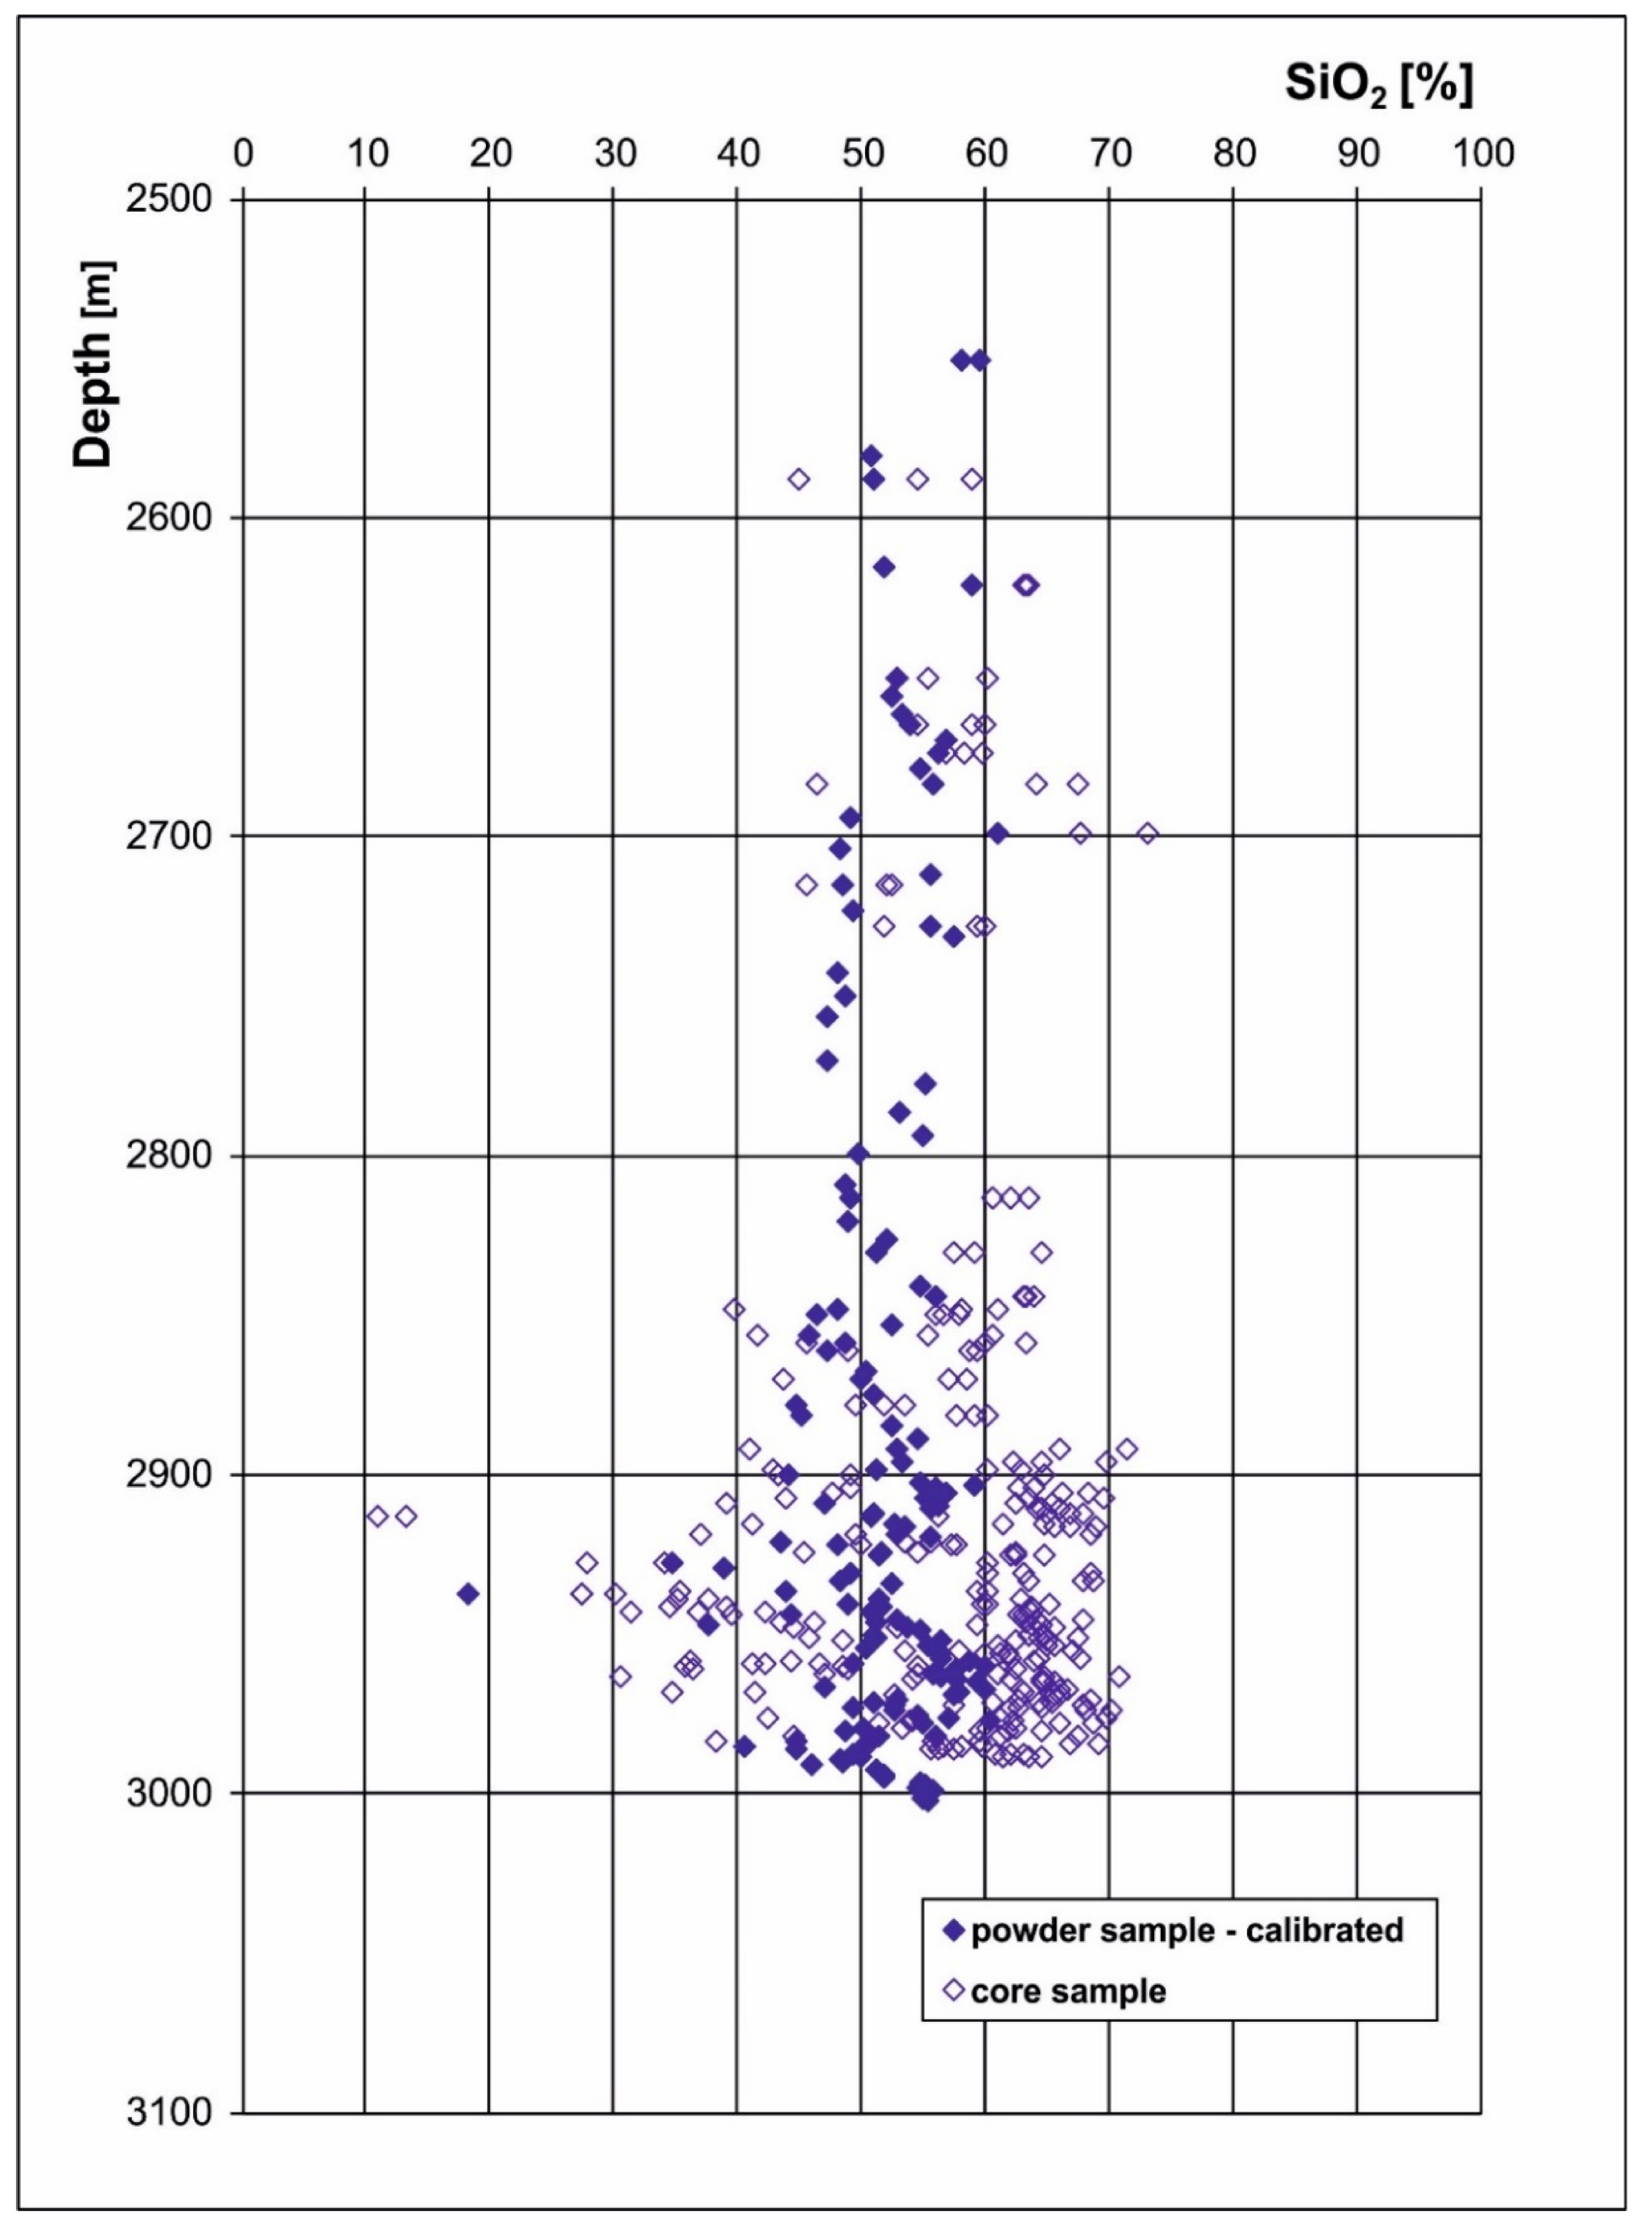
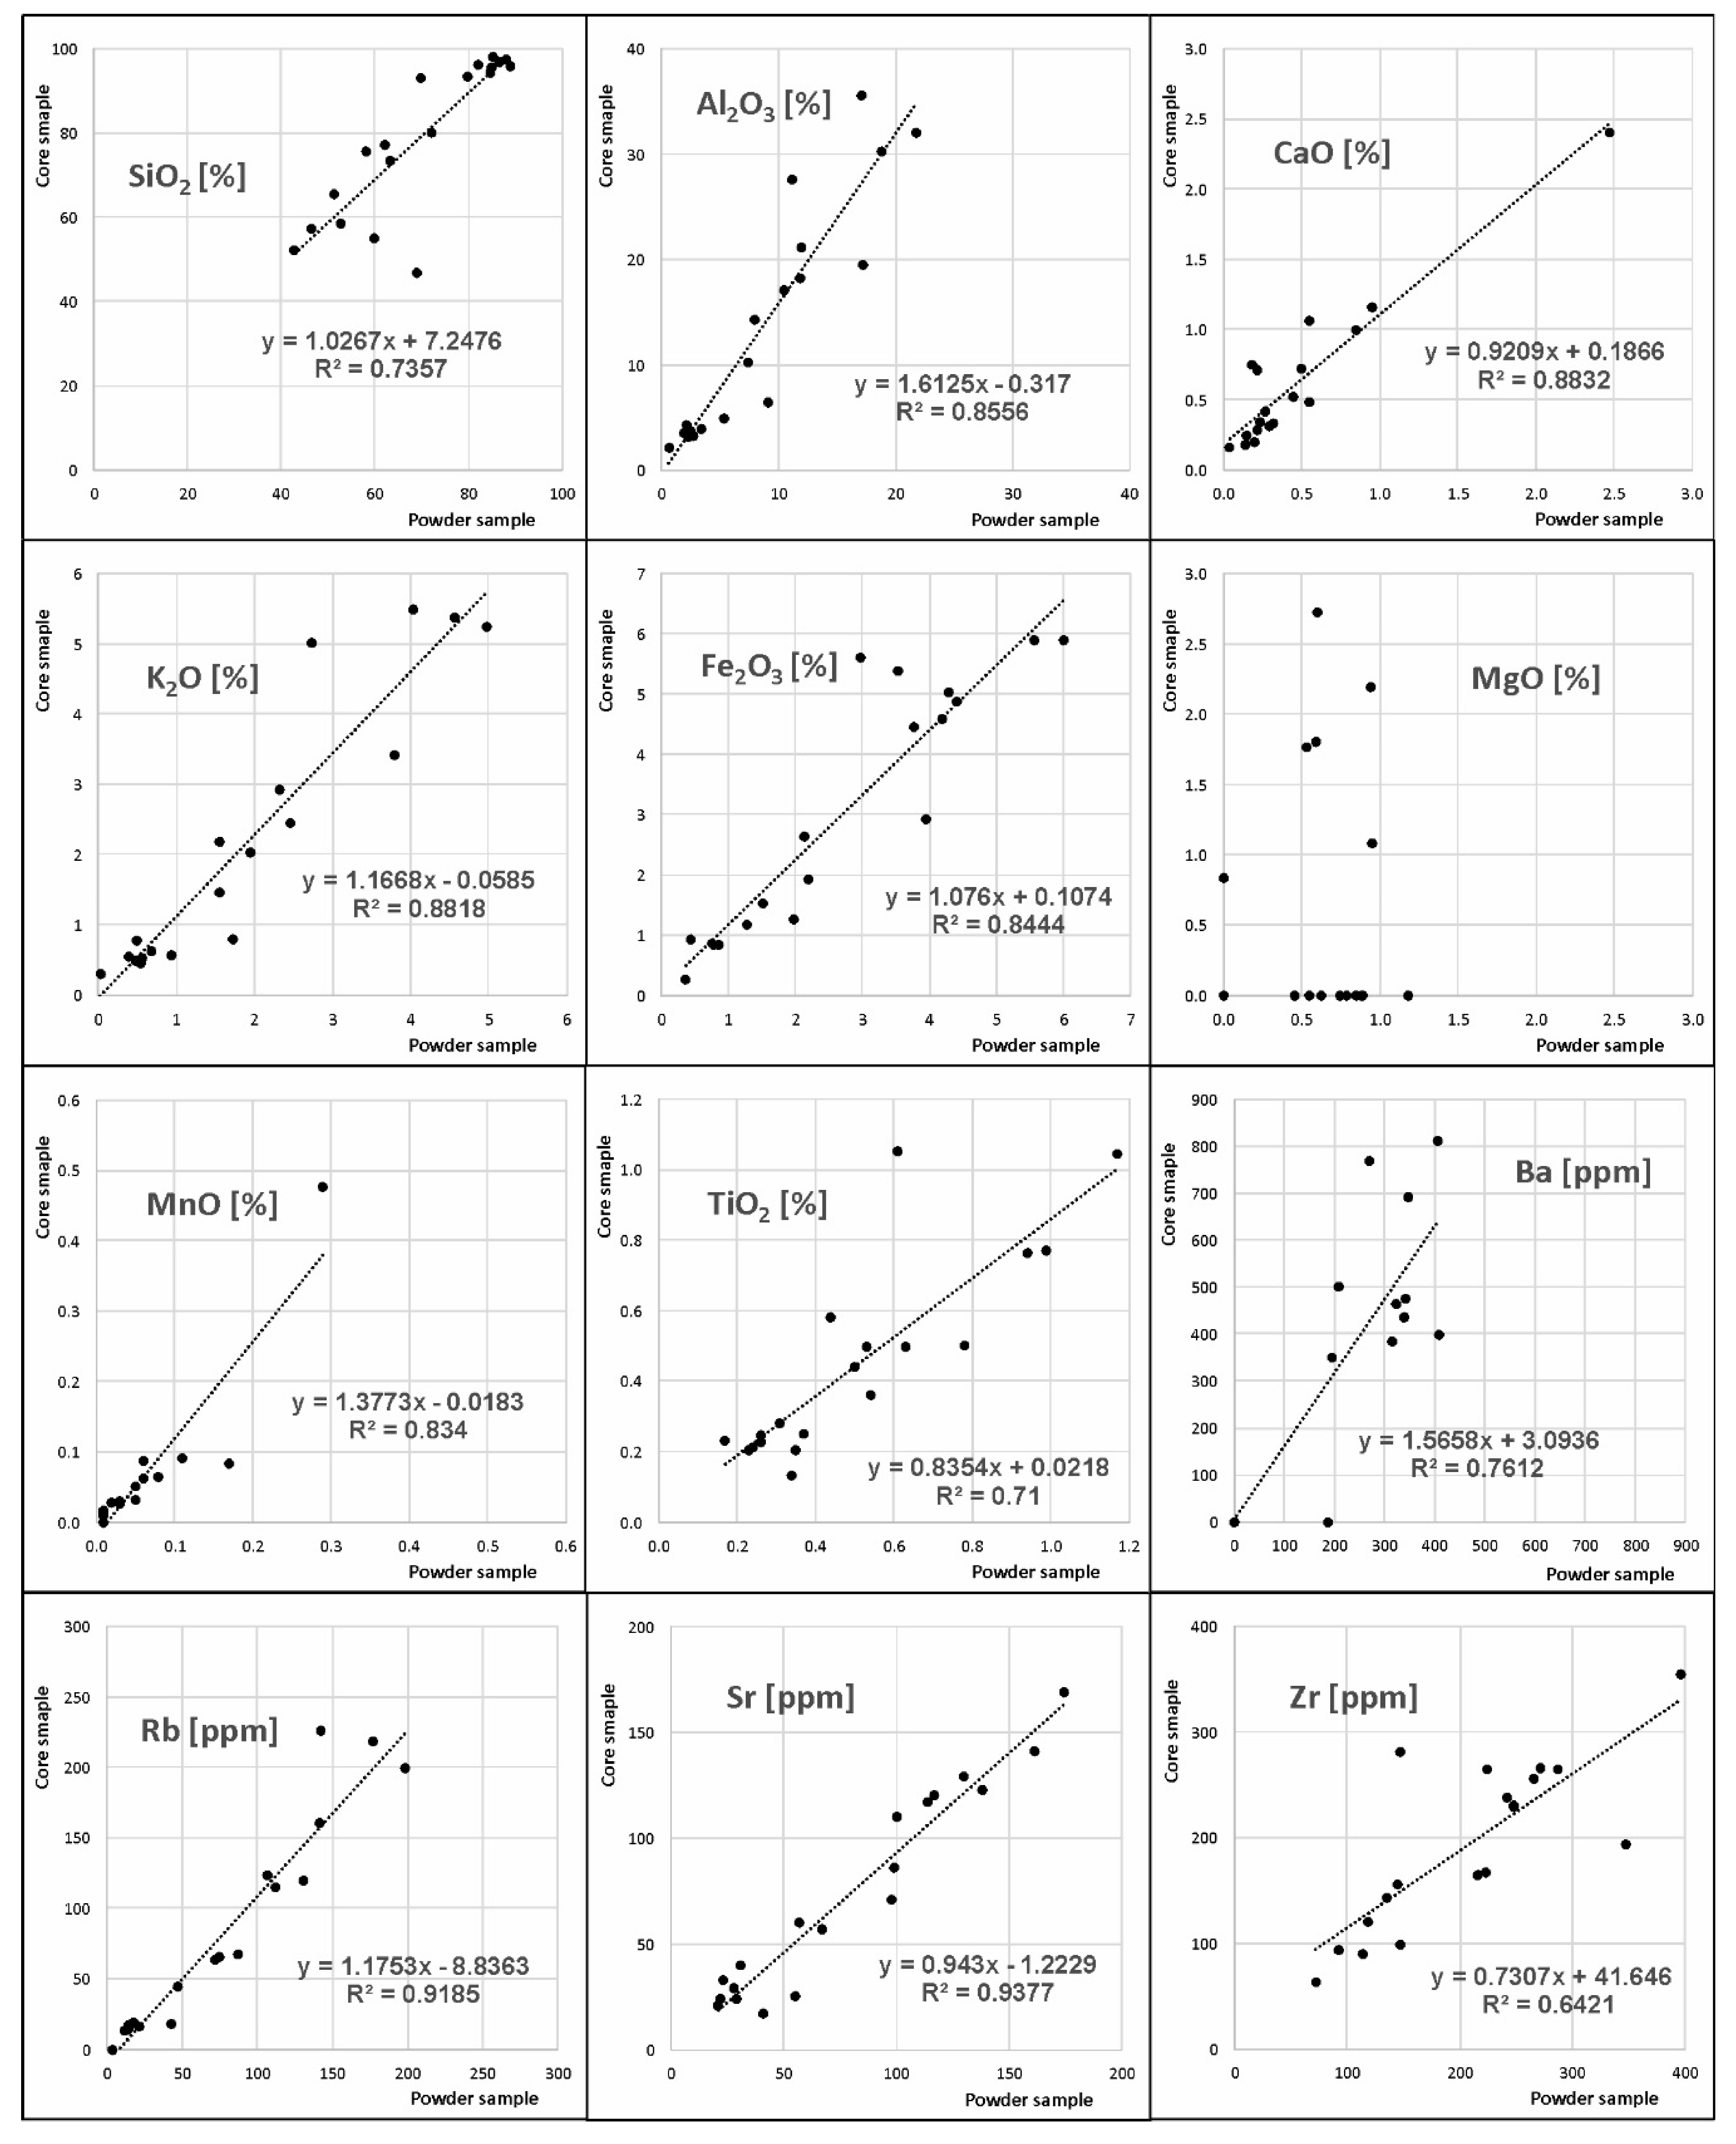
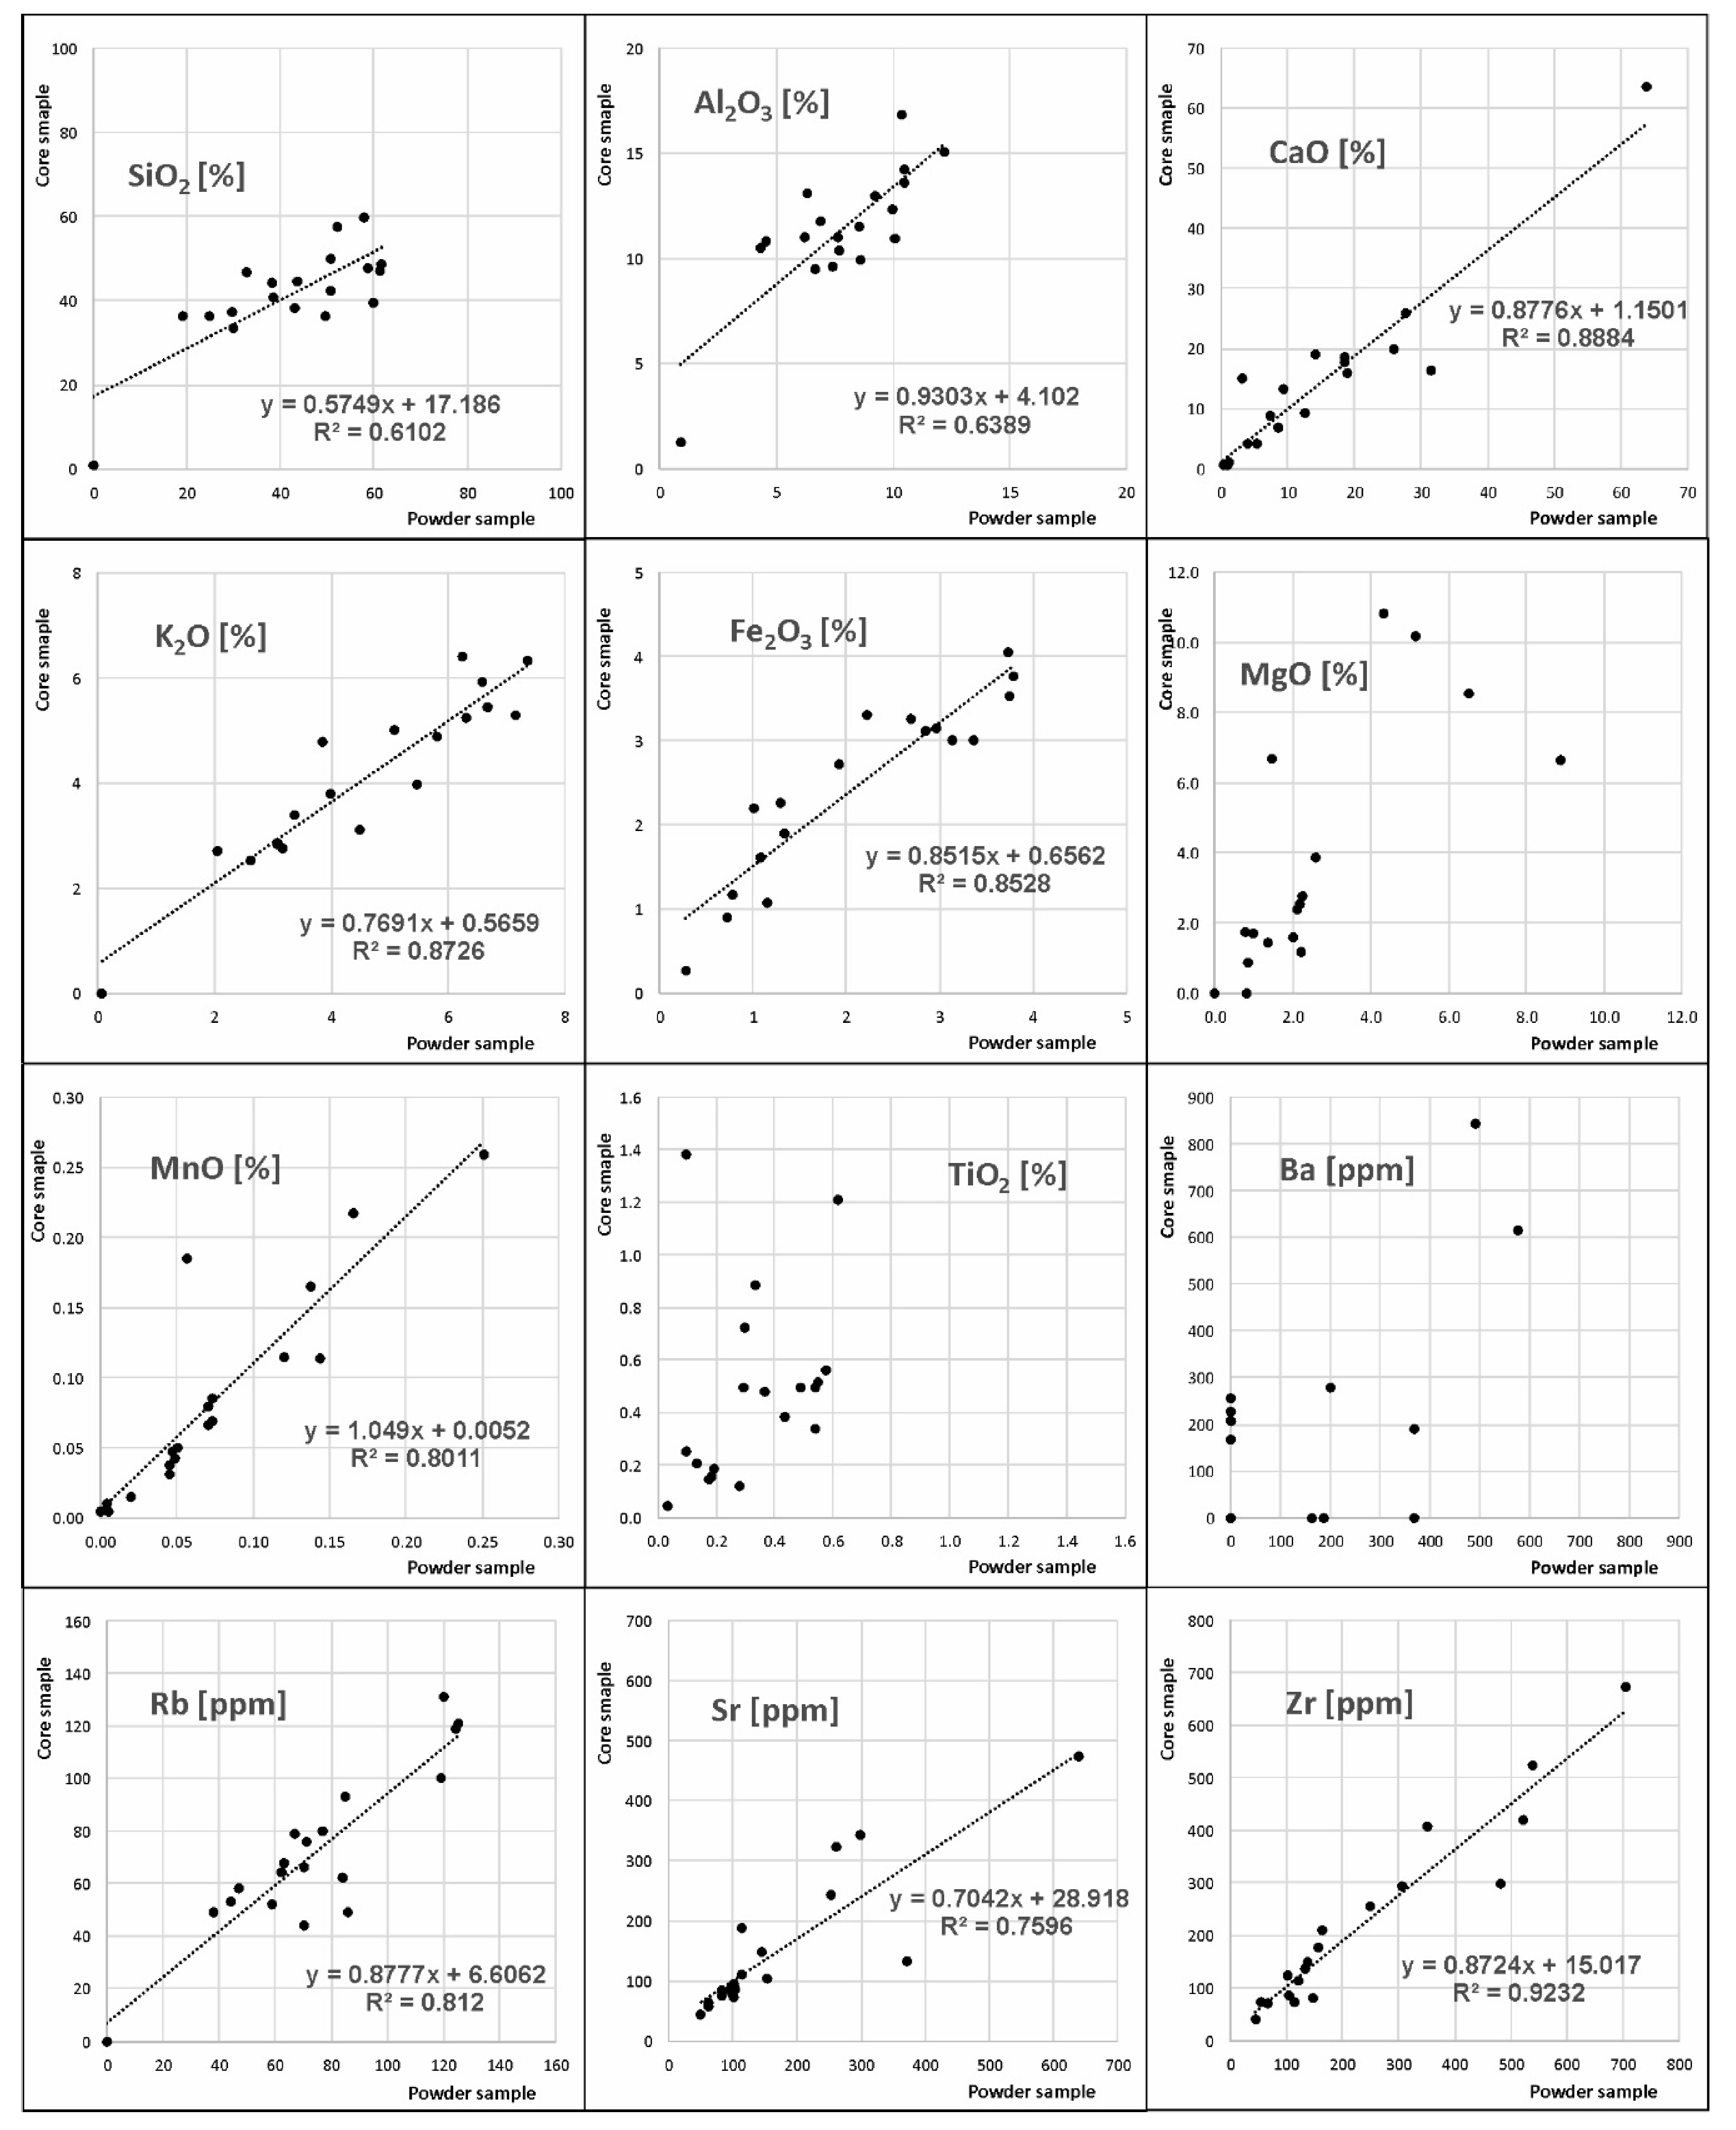
3.1. Comparison of Results Obtained from Measurements on Cores and Drill Cuttings

At the beginning, the analysis was conducted with regard to the impact of rock material comminution degree on results obtained with the use of a pXRF owing to the fact that, during hydrocarbon exploration, mineralogical investigation is carried out both on solid samples coming from full size and sidewall cores as well as on drill cuttings collected during borehole drilling when cores are not collected. Because of the necessity to reduce costs, coring is most frequently conducted on a fragmentary basis, and in the remaining part of the borehole, less expensive drill cuttings are collected. The reconstruction of a lithological profile for the entire borehole interval requires combining results gained for both types of research material.
There is one more problem concerning the procedure of cuttings cleaning before milling. Cuttings are usually contaminated with components of drilling fluid, which is a mixture of fluids and solids. The most basic function of a drilling fluid is the transportation of drilled cuttings to the surface. Reaching the surface, cuttings are mechanically removed from the fluid before it is recirculated downhole, but they are never completely devoid of solid drilling fluid components. The problem arises because drilling fluid components are usually minerals (for example bentonite clay, barite, calcium carbonate or hematite) and their granulation overlaps with granulation of cuttings mineral components. Sometimes, cuttings are also contaminated by fragments of damaged borehole casing, which is easy to remove with the use of neodymium magnet.
As mentioned above, cuttings are usually extremely inhomogeneous and contain grains of different sizes. The granulation of cuttings is usually dependent on the technic of drilling (the applied drill bit), lithology, mineralogy, and geomechanical properties of drilled rocks. Every washing of cutting leads to the uncontrolled removal of the finest grain fractions, usually clay minerals and the softest minerals. It changes the mineralogy of cuttings in ways that are hard to predict, unless we can get clean rock chips. In our opinion, the better solution is to make the proper result correction after XRD analysis. This should be carefully examined for each individual case. Our results show that, in some cases, there is no need to make correction at all.
Conducting measurements on drill cuttings implies the necessity of carrying out measurements on milled material. Such samples are significantly heterogeneous and with significantly differentiated granulation. Obtaining consistent results is possible only after checking their homogeneous comminution degree. The influence of grinding on results of measurements taken with a portable XRF spectrometer has already been analysed by the authors with the example of Silurian rocks from the W-1 borehole (Figure 5). To illustrate the impact of the grain size on the pXRF measurement results, a comparison of the results obtained for cores and milled core samples was done.
The above-mentioned studies indicated that, even in the case of fine-grained rocks, varied results would be obtained for light elements. Contents of the light elements on the core were significantly higher than in powder samples, which must be related to higher density of core samples as compared to powder samples. This effect is less and less explicit for heavier elements. It is the example of the impact of air presence in the pore space in the powder sample. It doesn’t influence heavy elements, but is a sufficient barrier for weak fluorescent radiation from light elements.
In the case of samples analysed for the purpose of this research, it was decided to refer the results of a similar experiment to the results of a detailed analysis carried out in a stationary laboratory. Within this experiment, before grinding the samples that were to be dispatched to the ACTLABS laboratory, measurements were also made on entire solid rock fragments collected form the core. Comparative results for the Kobylin-1 and Biesiekierz-2 boreholes are presented in Figure 6 and Figure 7, respectively. At a glance, quite considerable discrepancies can be noticed between both results for the Biesiekierz–2 borehole, which must be related to a coarse-grained character of a number of arkosic sandstones occurring in the drilled geological profile as well as to a small size of a pXRF portable spectrometer measurement window (0.5 × 1 cm). Quarzitic sandstones from the Kobylin-1 borehole are fine- or very fine-grained and much more homogenous.
On this basis, it was decided that if it would be possible for pXRF measurements to be conducted on a powder material, and averaged. Unfortunately, this is not always possible in the case of archival borehole, because of core material purchase expenses. Then, it is worth realizing that results will be burdened with an error related to the lack of homogeneity in research material, the error being the bigger the larger the size of granulation of studied rocks. It was simultaneously identified that because the density of tested preparation is of great importance for obtained results, if possible, identical processing should be applied during pXRF measurements.

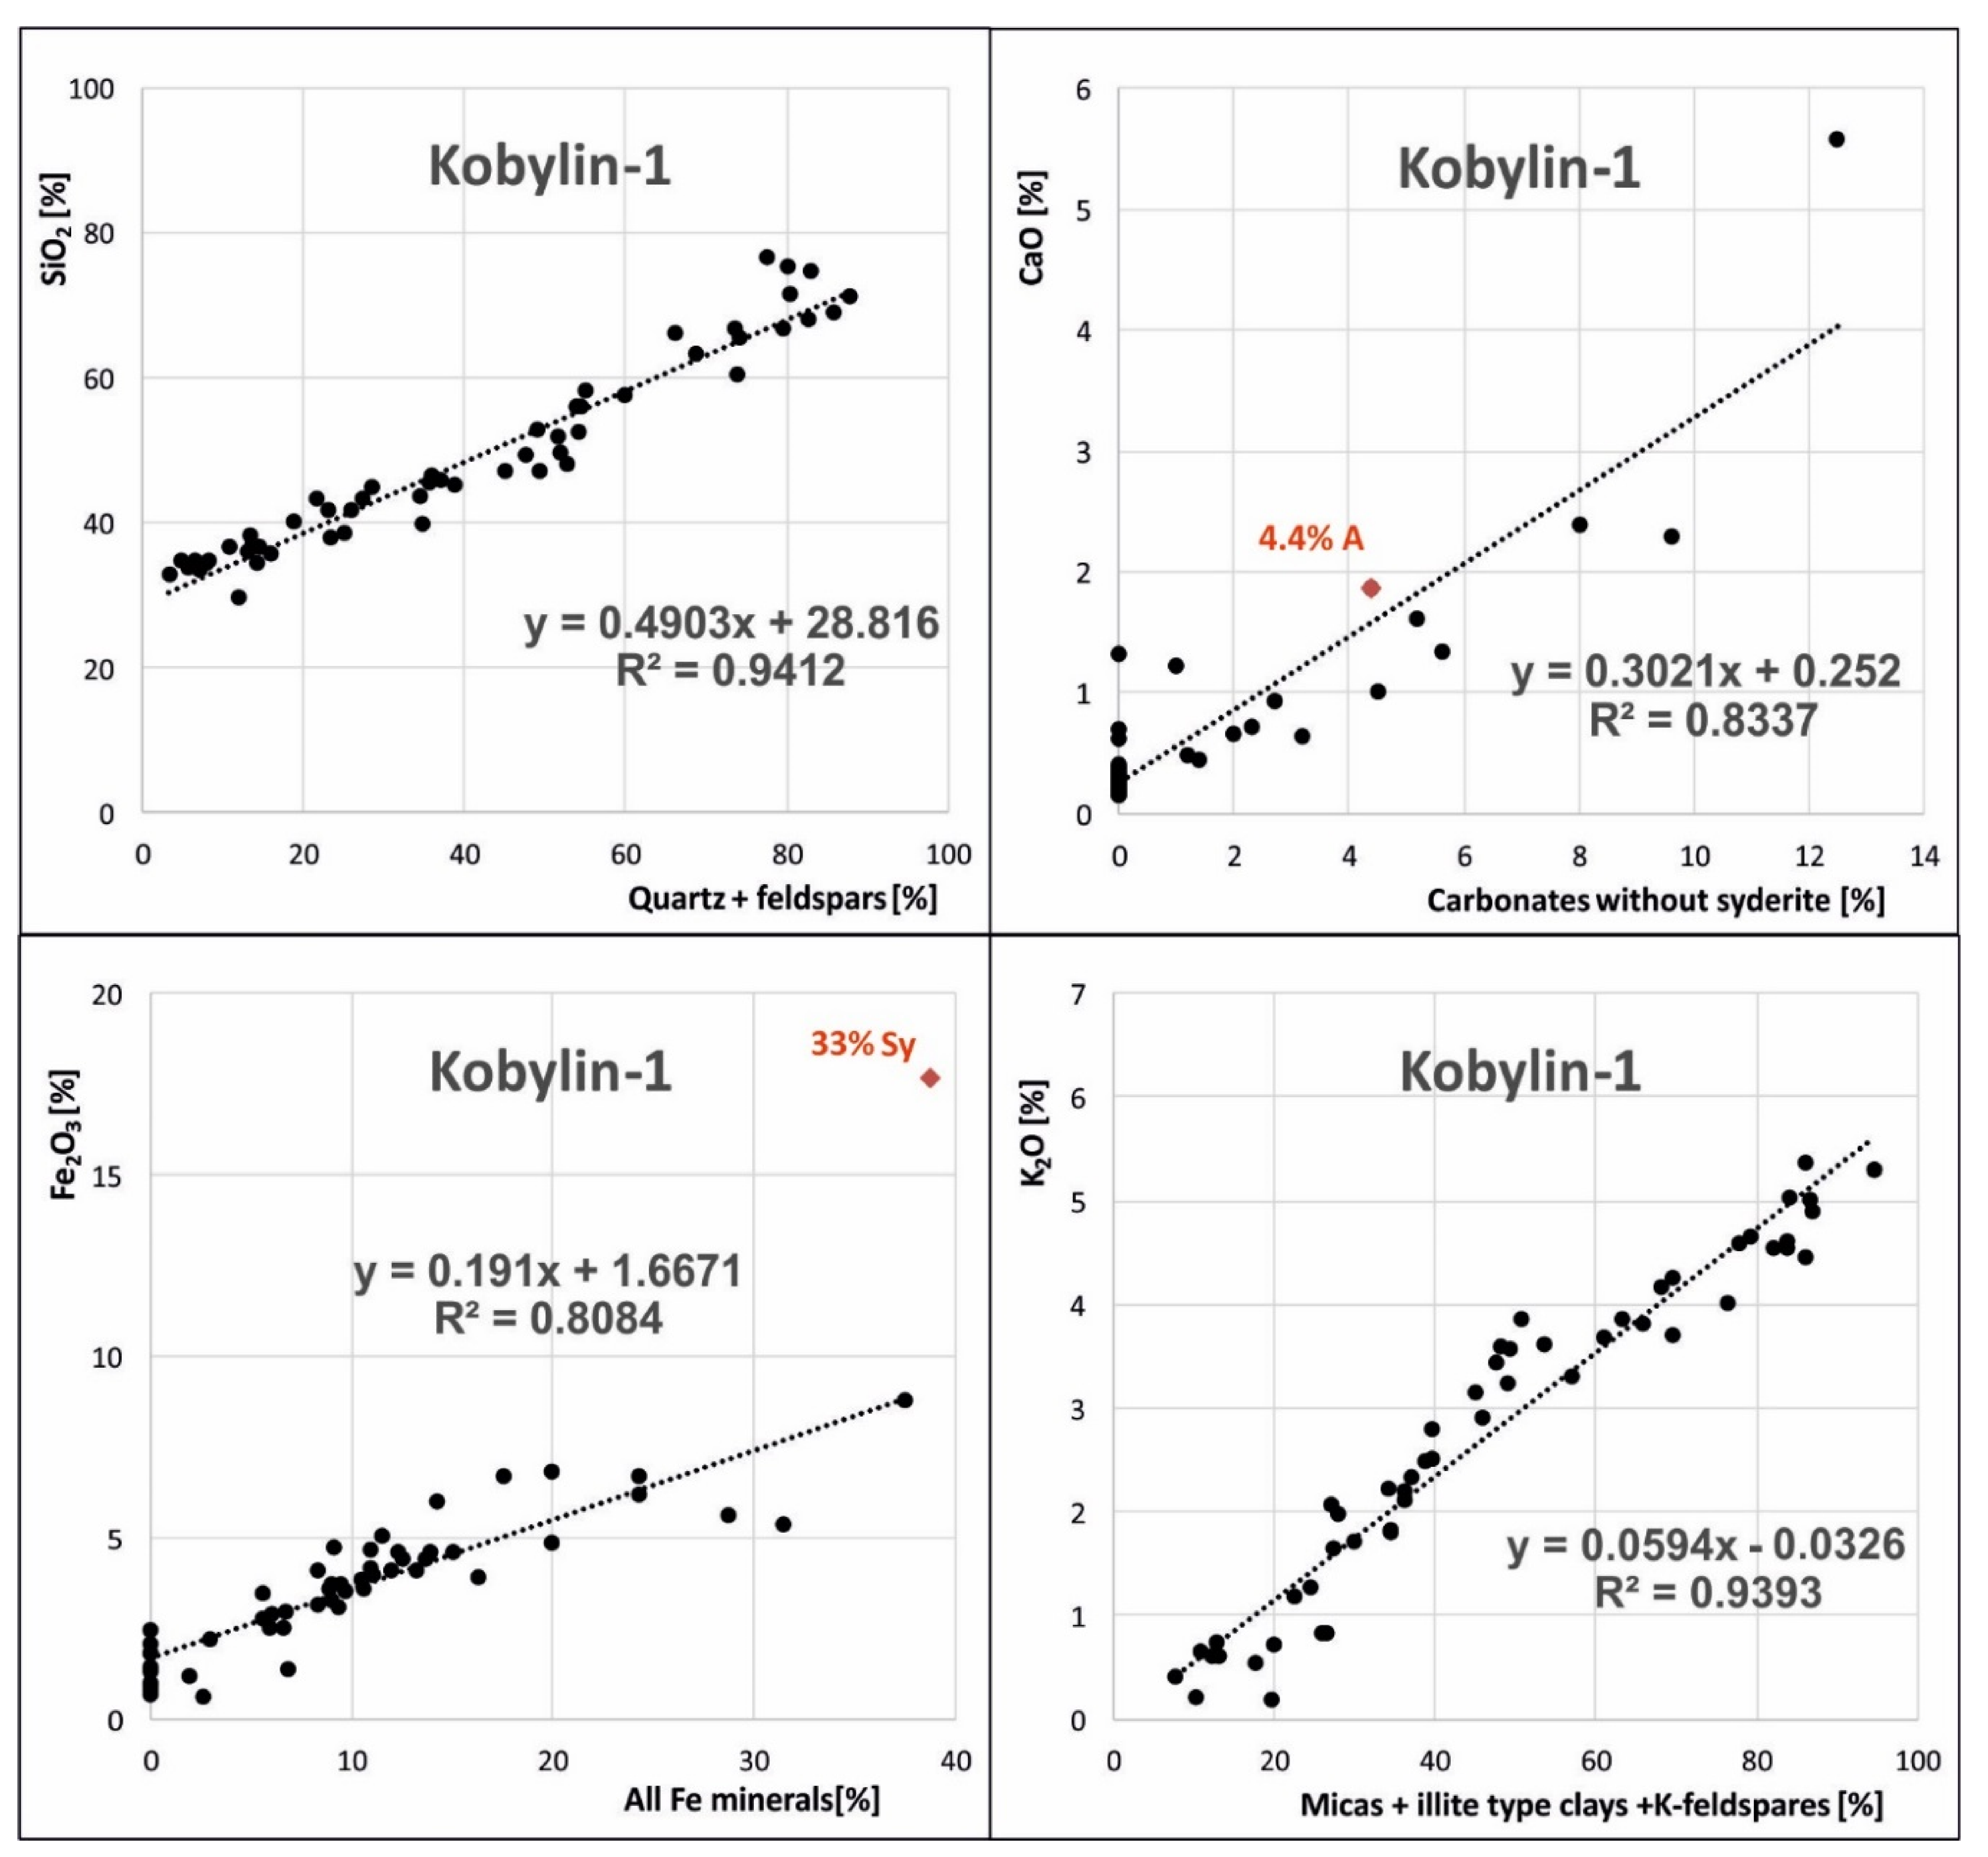
3.2. Mineralogical Model for Carboniferous Rocks from the Kobylin-1 Borehole

A mathematical mineral composition model for Carboniferous rocks from the Kobylin-1 borehole was developed based on the results of 51 XRD analyses produced within the borehole investigation. Exemplary XRD patterns obtained for samples from the Kobylin-1 borehole are presented below in Figure 8.
Carboniferous samples from this borehole contain mainly quartz, in the lower part of the profile also albite type plagioclases and small amounts of potassium feldspars as well as clay minerals, namely micas and illite group clay minerals, chlorites, and sometimes traces of kaolinite. The remaining mineral components occur only in some samples and mainly in small amounts, although in a great variety. One can deal here both with various carbonates, e.g., dolomite, ankerite, siderite, and calcite, as well as with anhydrite and various iron compounds, e.g., pyrite and hematite.
Figure 9 presents main correlations among selected mineralogical and chemical components prepared for Carboniferous rocks from the Kobylin-1 borehole: for the sum of quartz and feldspars as well as SiO2, for the sum of carbonates and CaO, for the sum of micas and illite as well as K2O, and finally, for chlorites and Fe2O3. A weaker correlation between CaO and carbonates results from the presence of siderite and anhydrite in the samples.

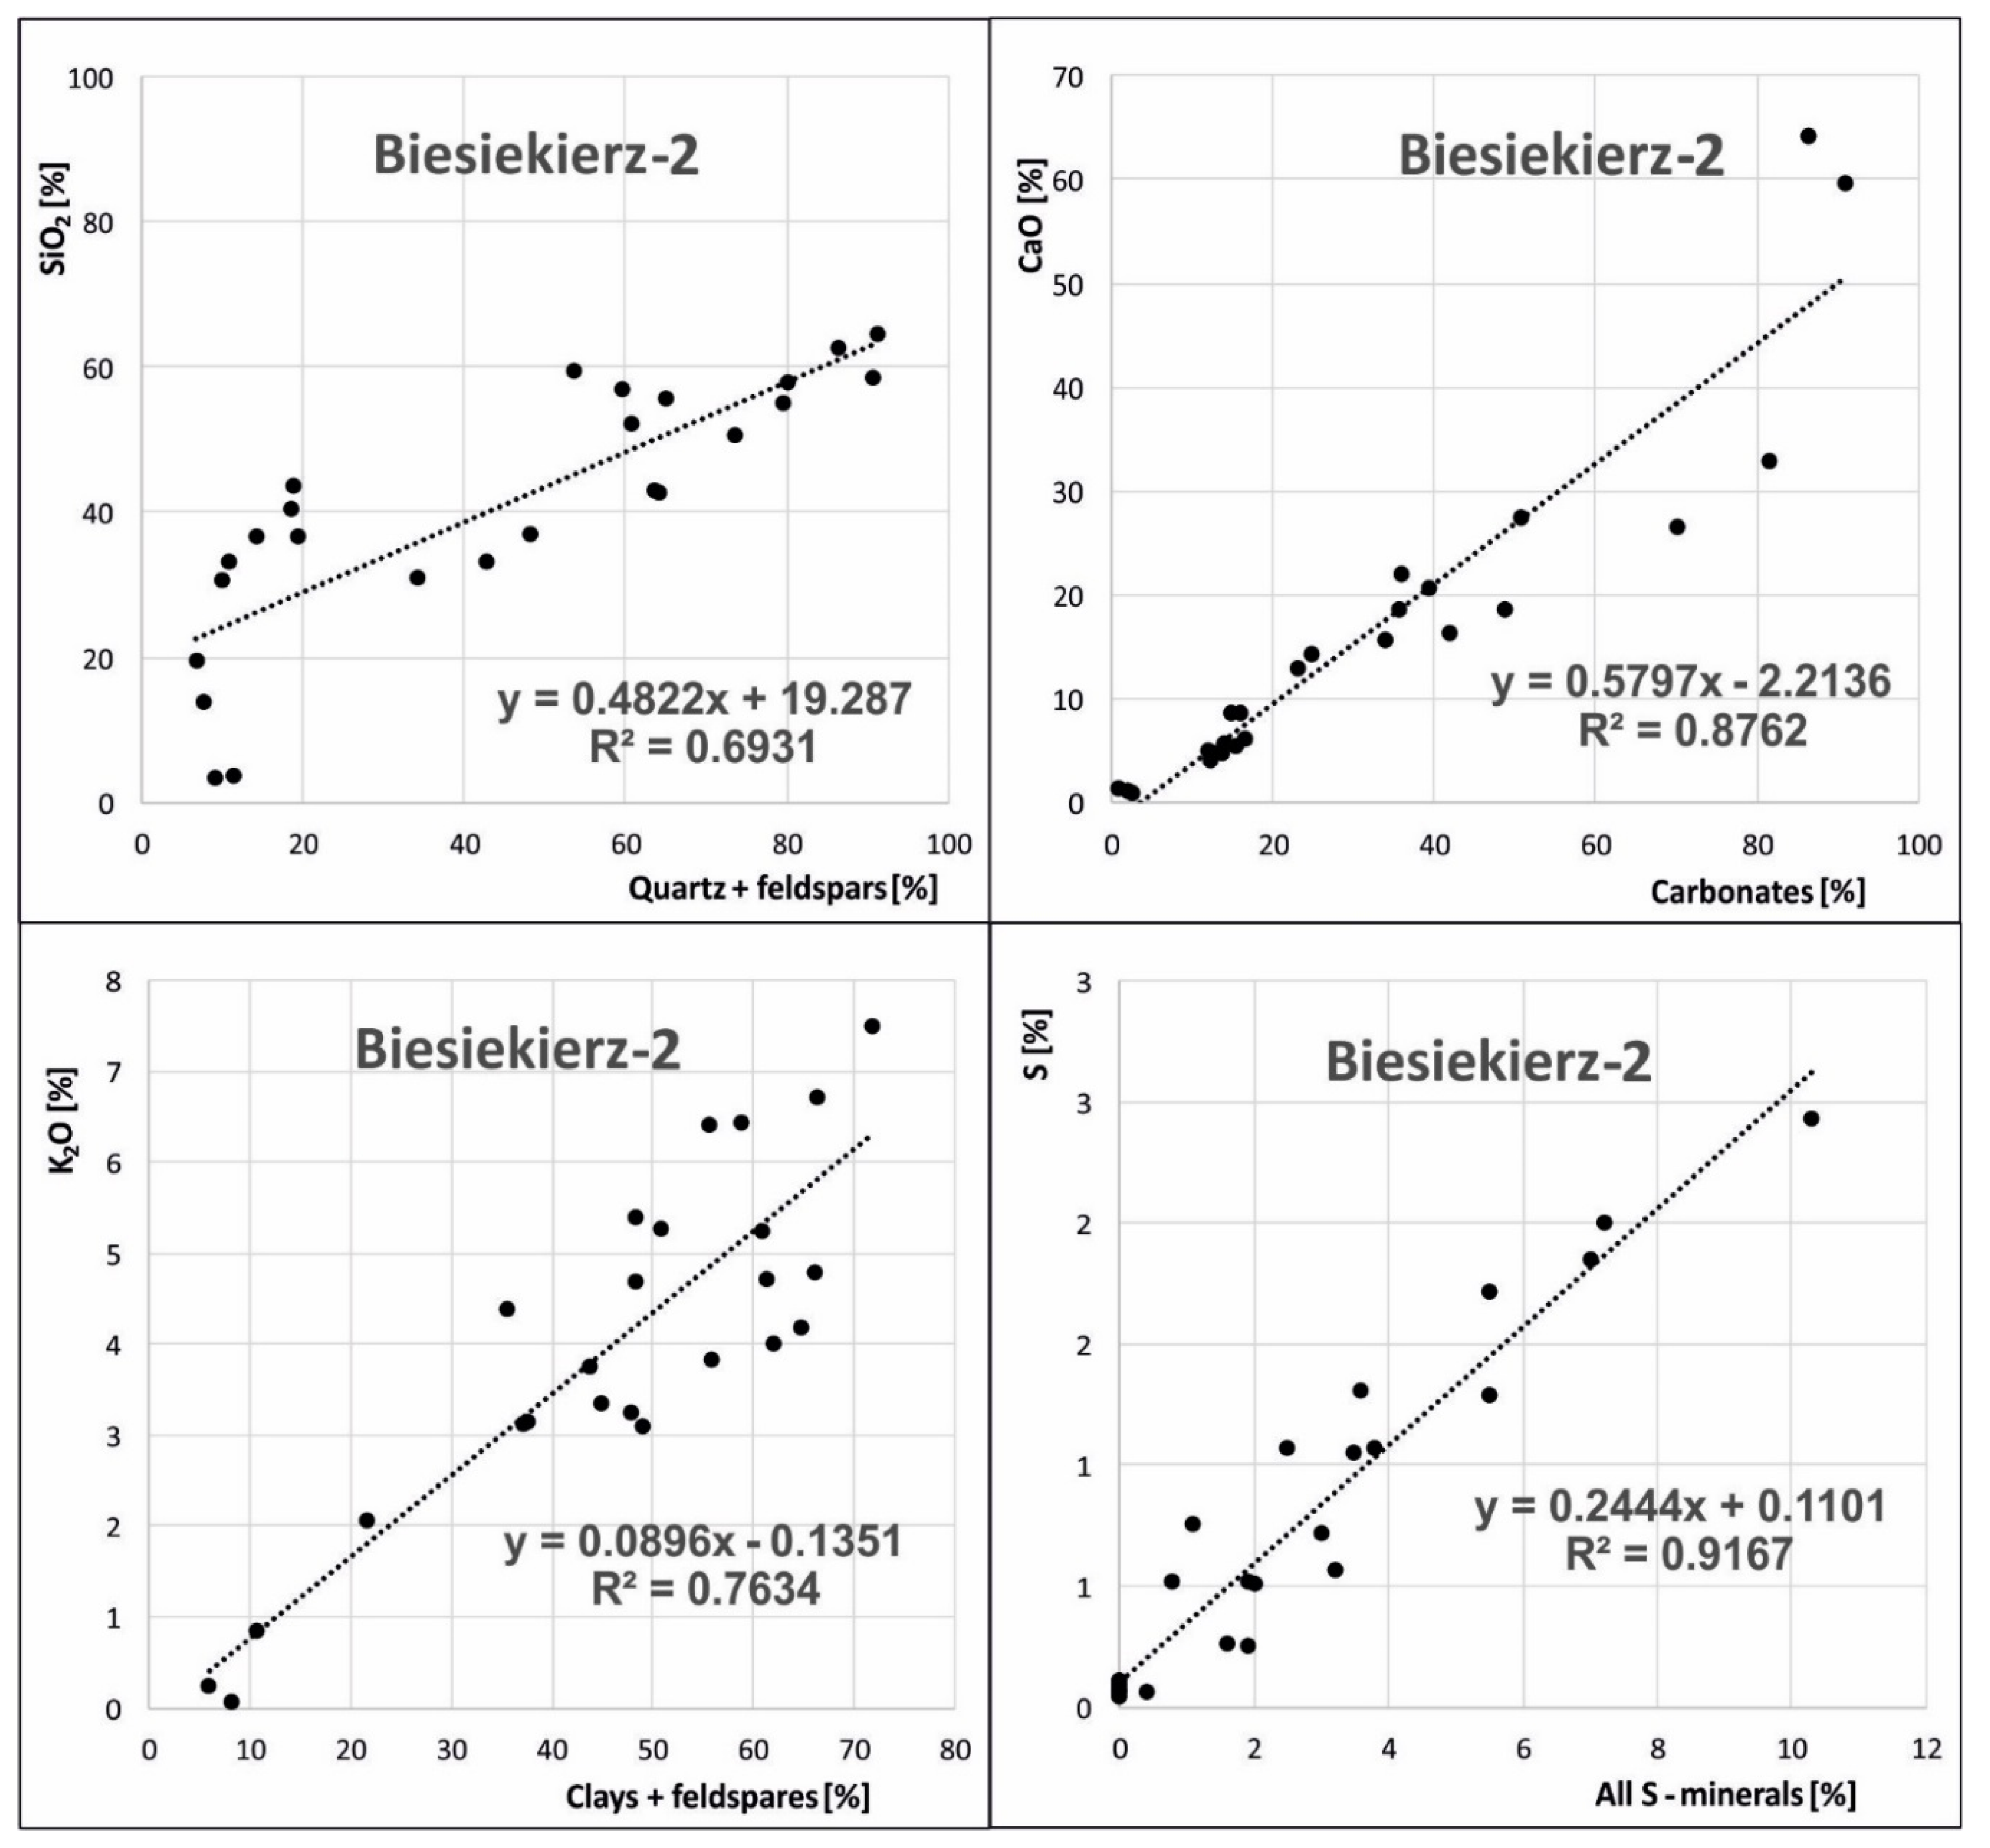
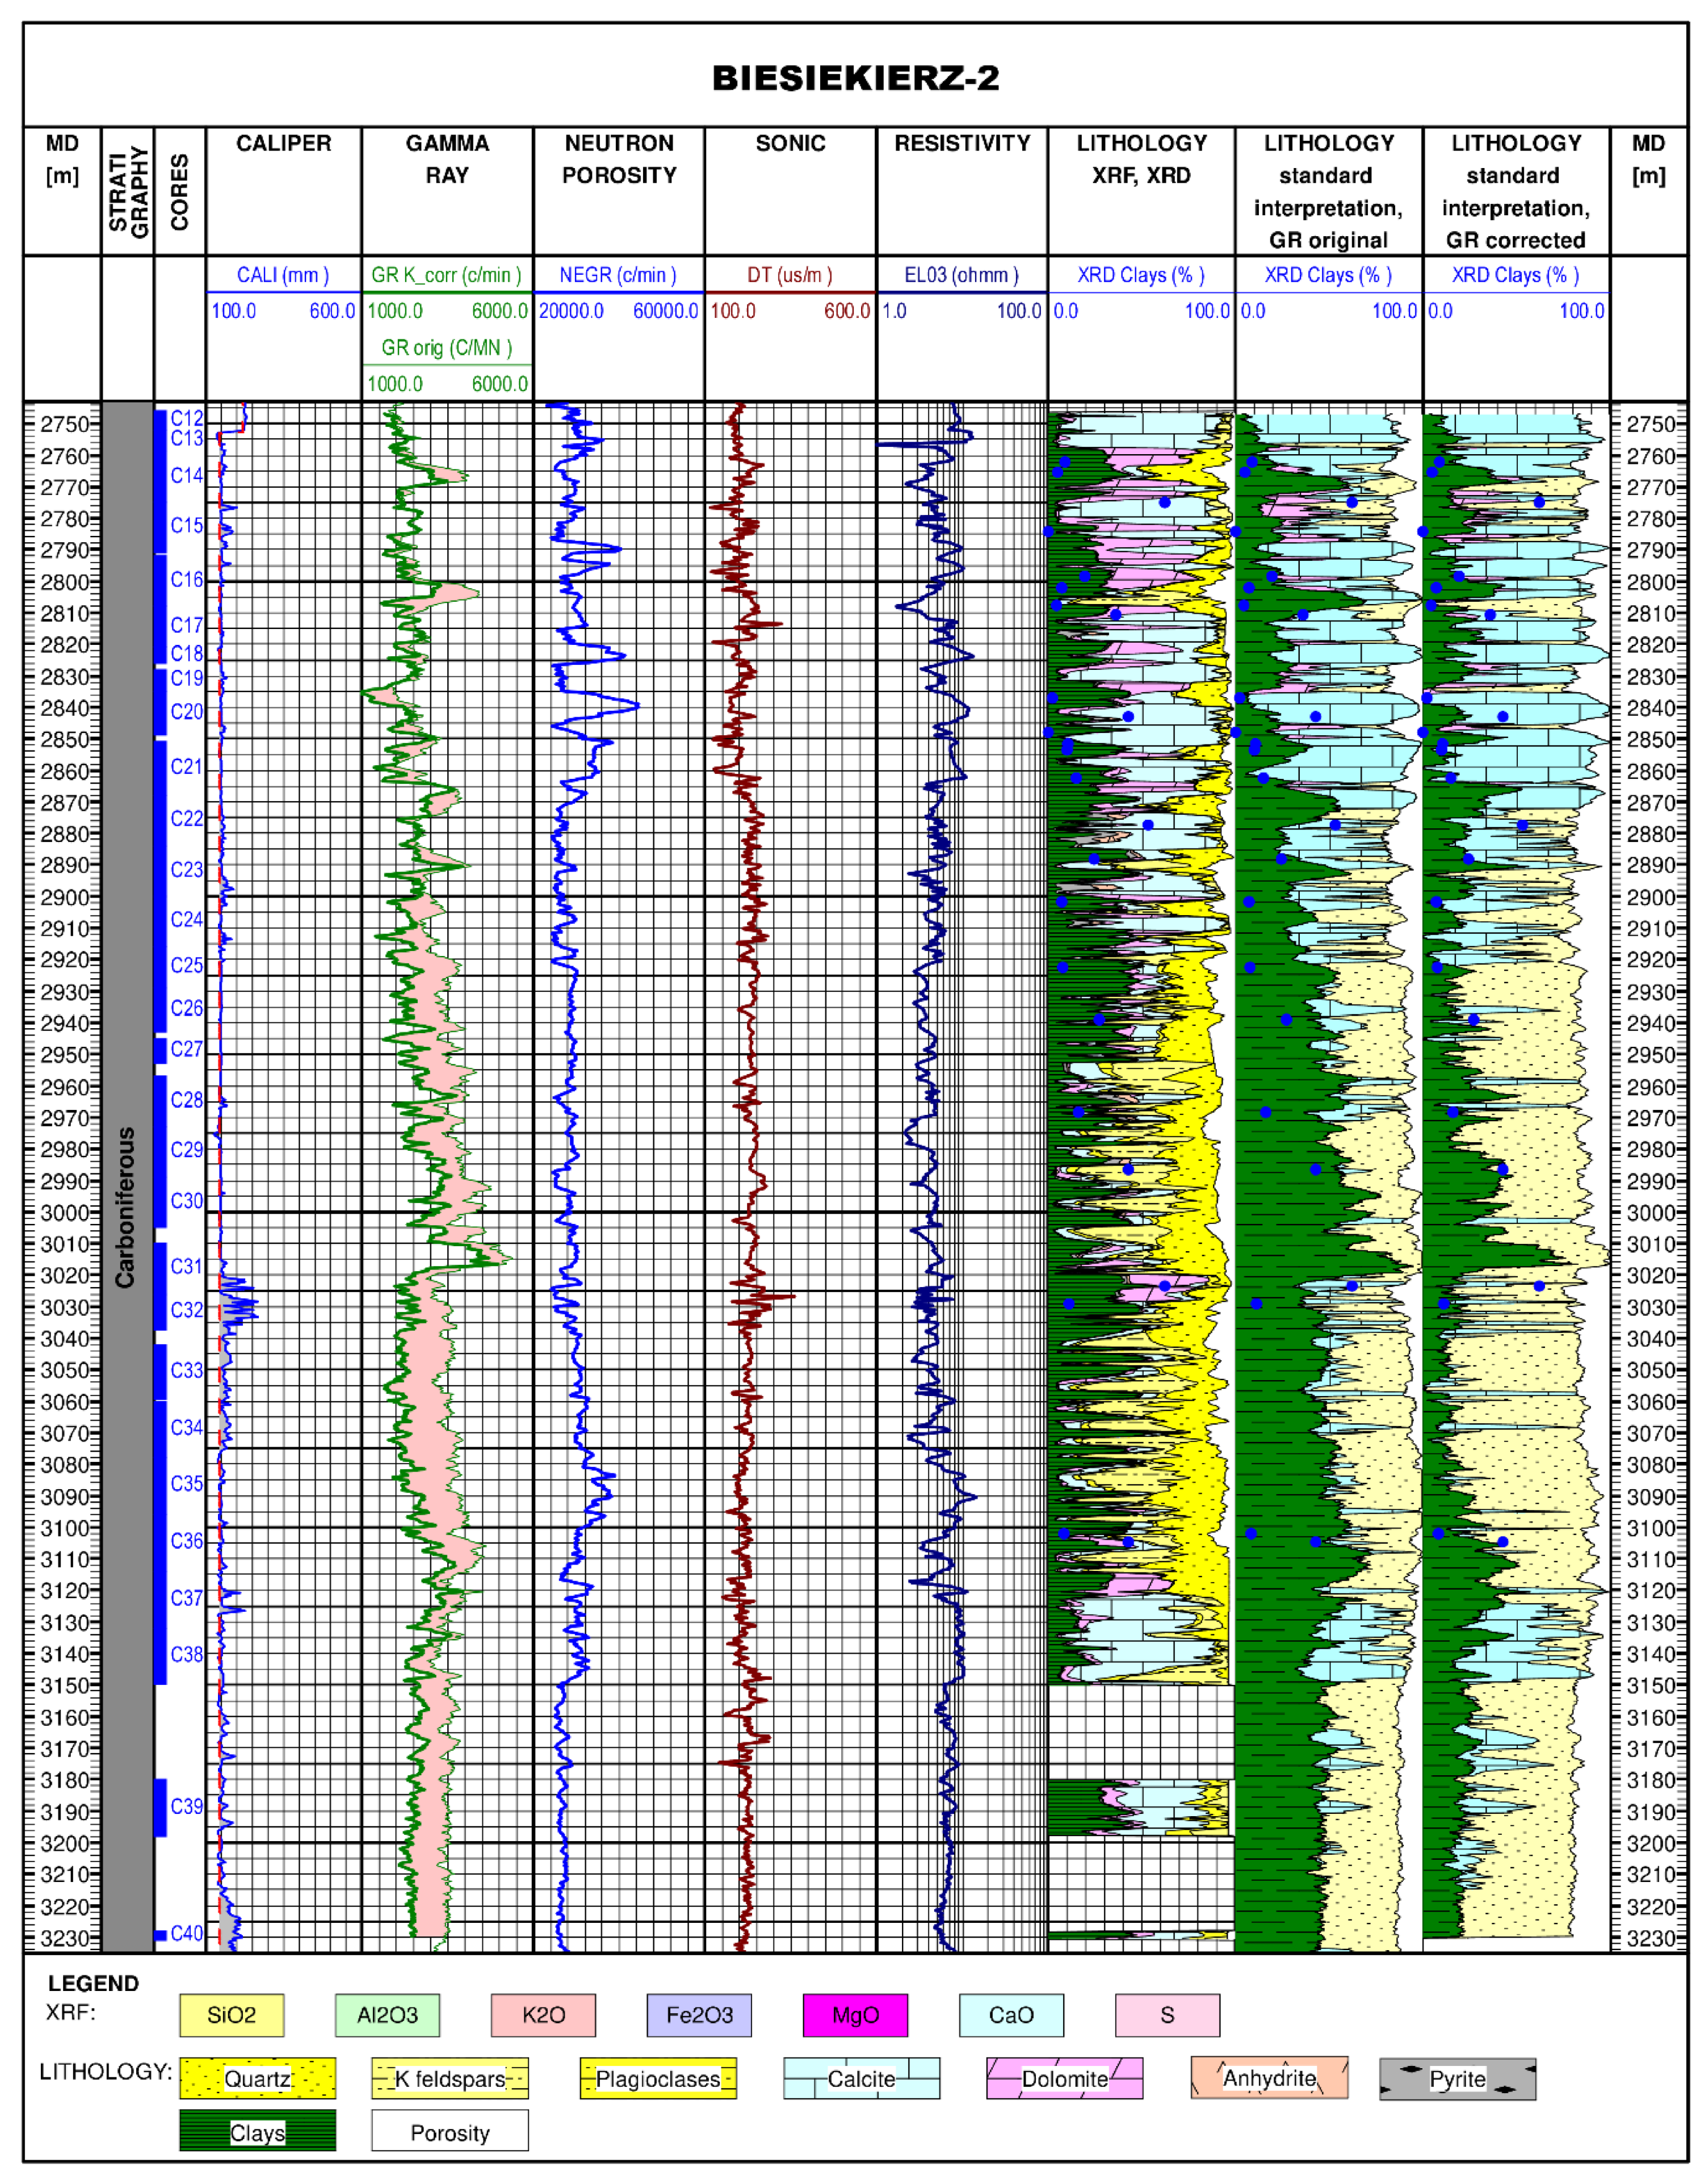
3.3. Mineralogical Model for Carboniferous Rocks from the Biesiekierz-2 Borehole

A mathematical mineral composition model for Carboniferous rocks from the Biesiekierz-2 borehole was developed based on the results of 25 XRD analyses produced within the borehole investigation. In this case, a considerably greater changeability of mineral composition is to be dealt with. In the drilled profile, there are both clastic rocks and carbonate ones: arkosic sandstones, claystones, sandstones with carbonate cement, marls, limestone, and dolomites. Exemplary XRD patterns obtained for samples from the Biesiekierz-2 borehole are presented below in Figure 10. Correlations between the mineralogical and chemical composition in this case are characterised by significantly lower correlation coefficients than obtained for the samples from the Kobylin-1 borehole, as represented in Figure 11.
As was been mentioned earlier, the common occurrence of feldspars, both potassium feldspars and plagioclases, is characteristic for the rock complex being described. They are present in different amounts in all the samples. All the samples also include quartz and carbonates. Carbonates are represented here by calcite, dolomite and ankerite, present in tested samples in different proportions. Illite group minerals and kaolinite dominate in the composition of clay fraction. Chlorites were identified only in a small number of samples and only in trace amounts. The presence of very different sulphur minerals, namely pyrite, gypsum, and anhydrite, were recorded in the studied rock material.

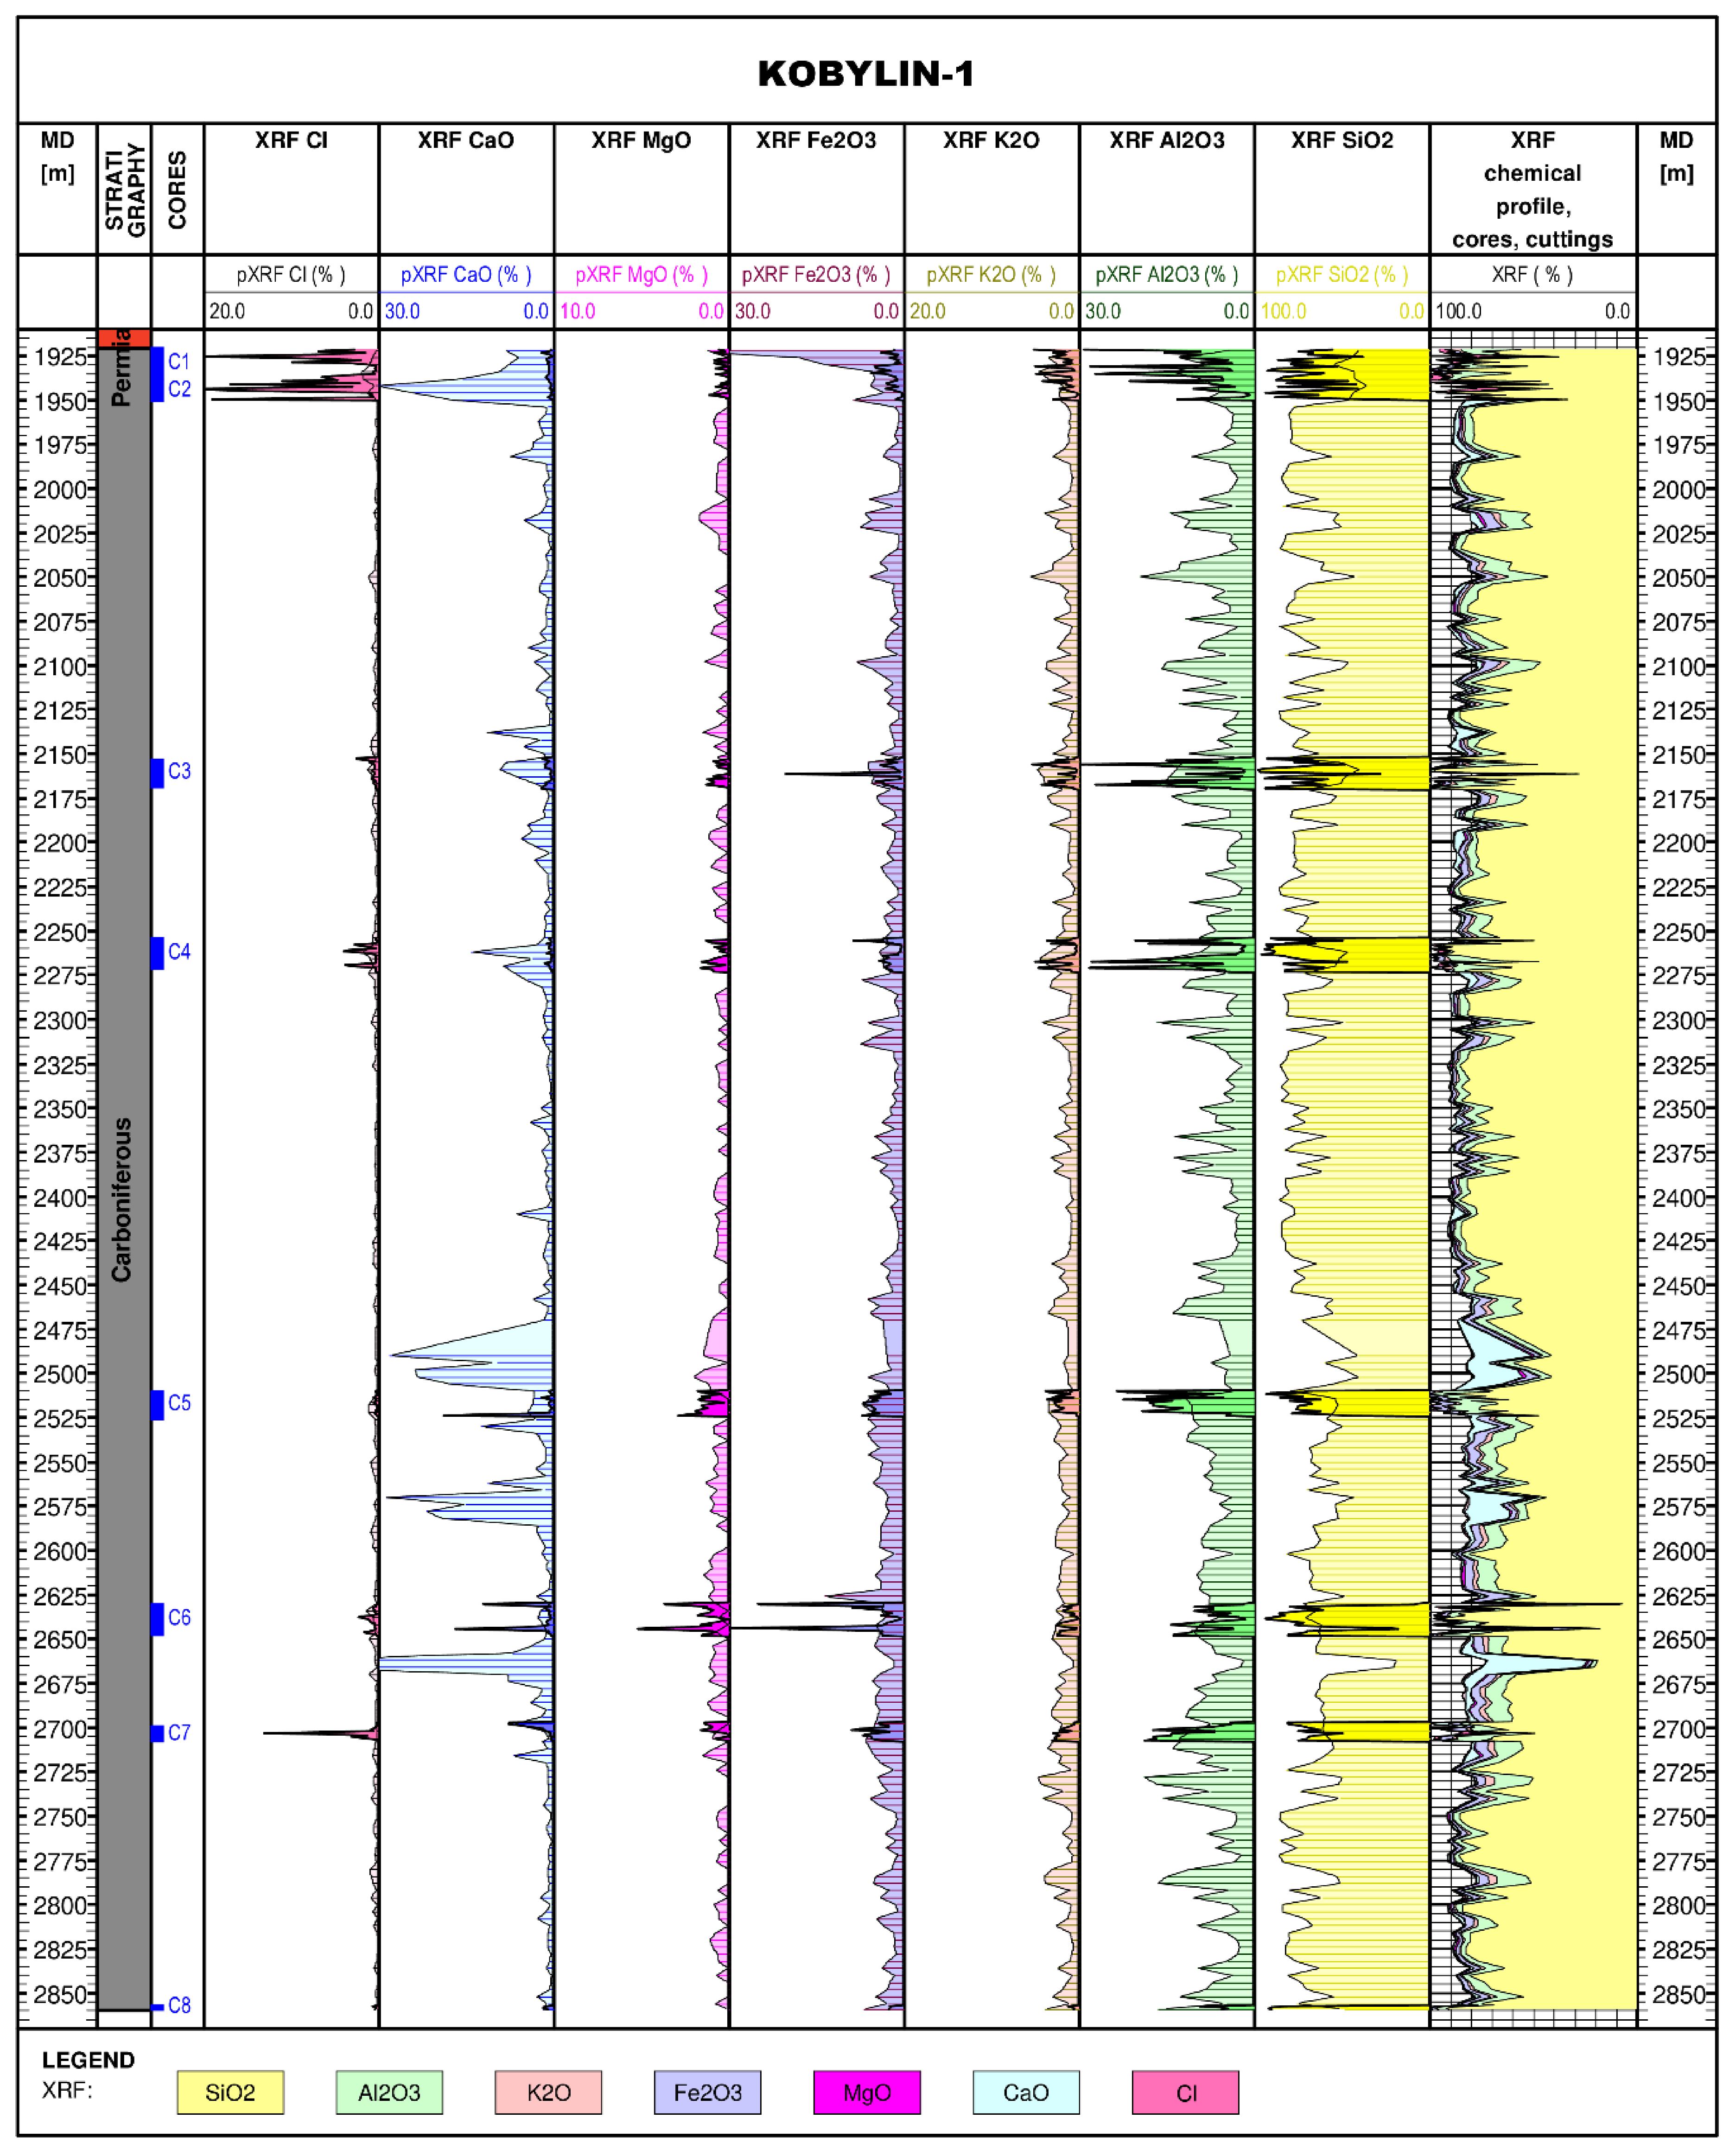
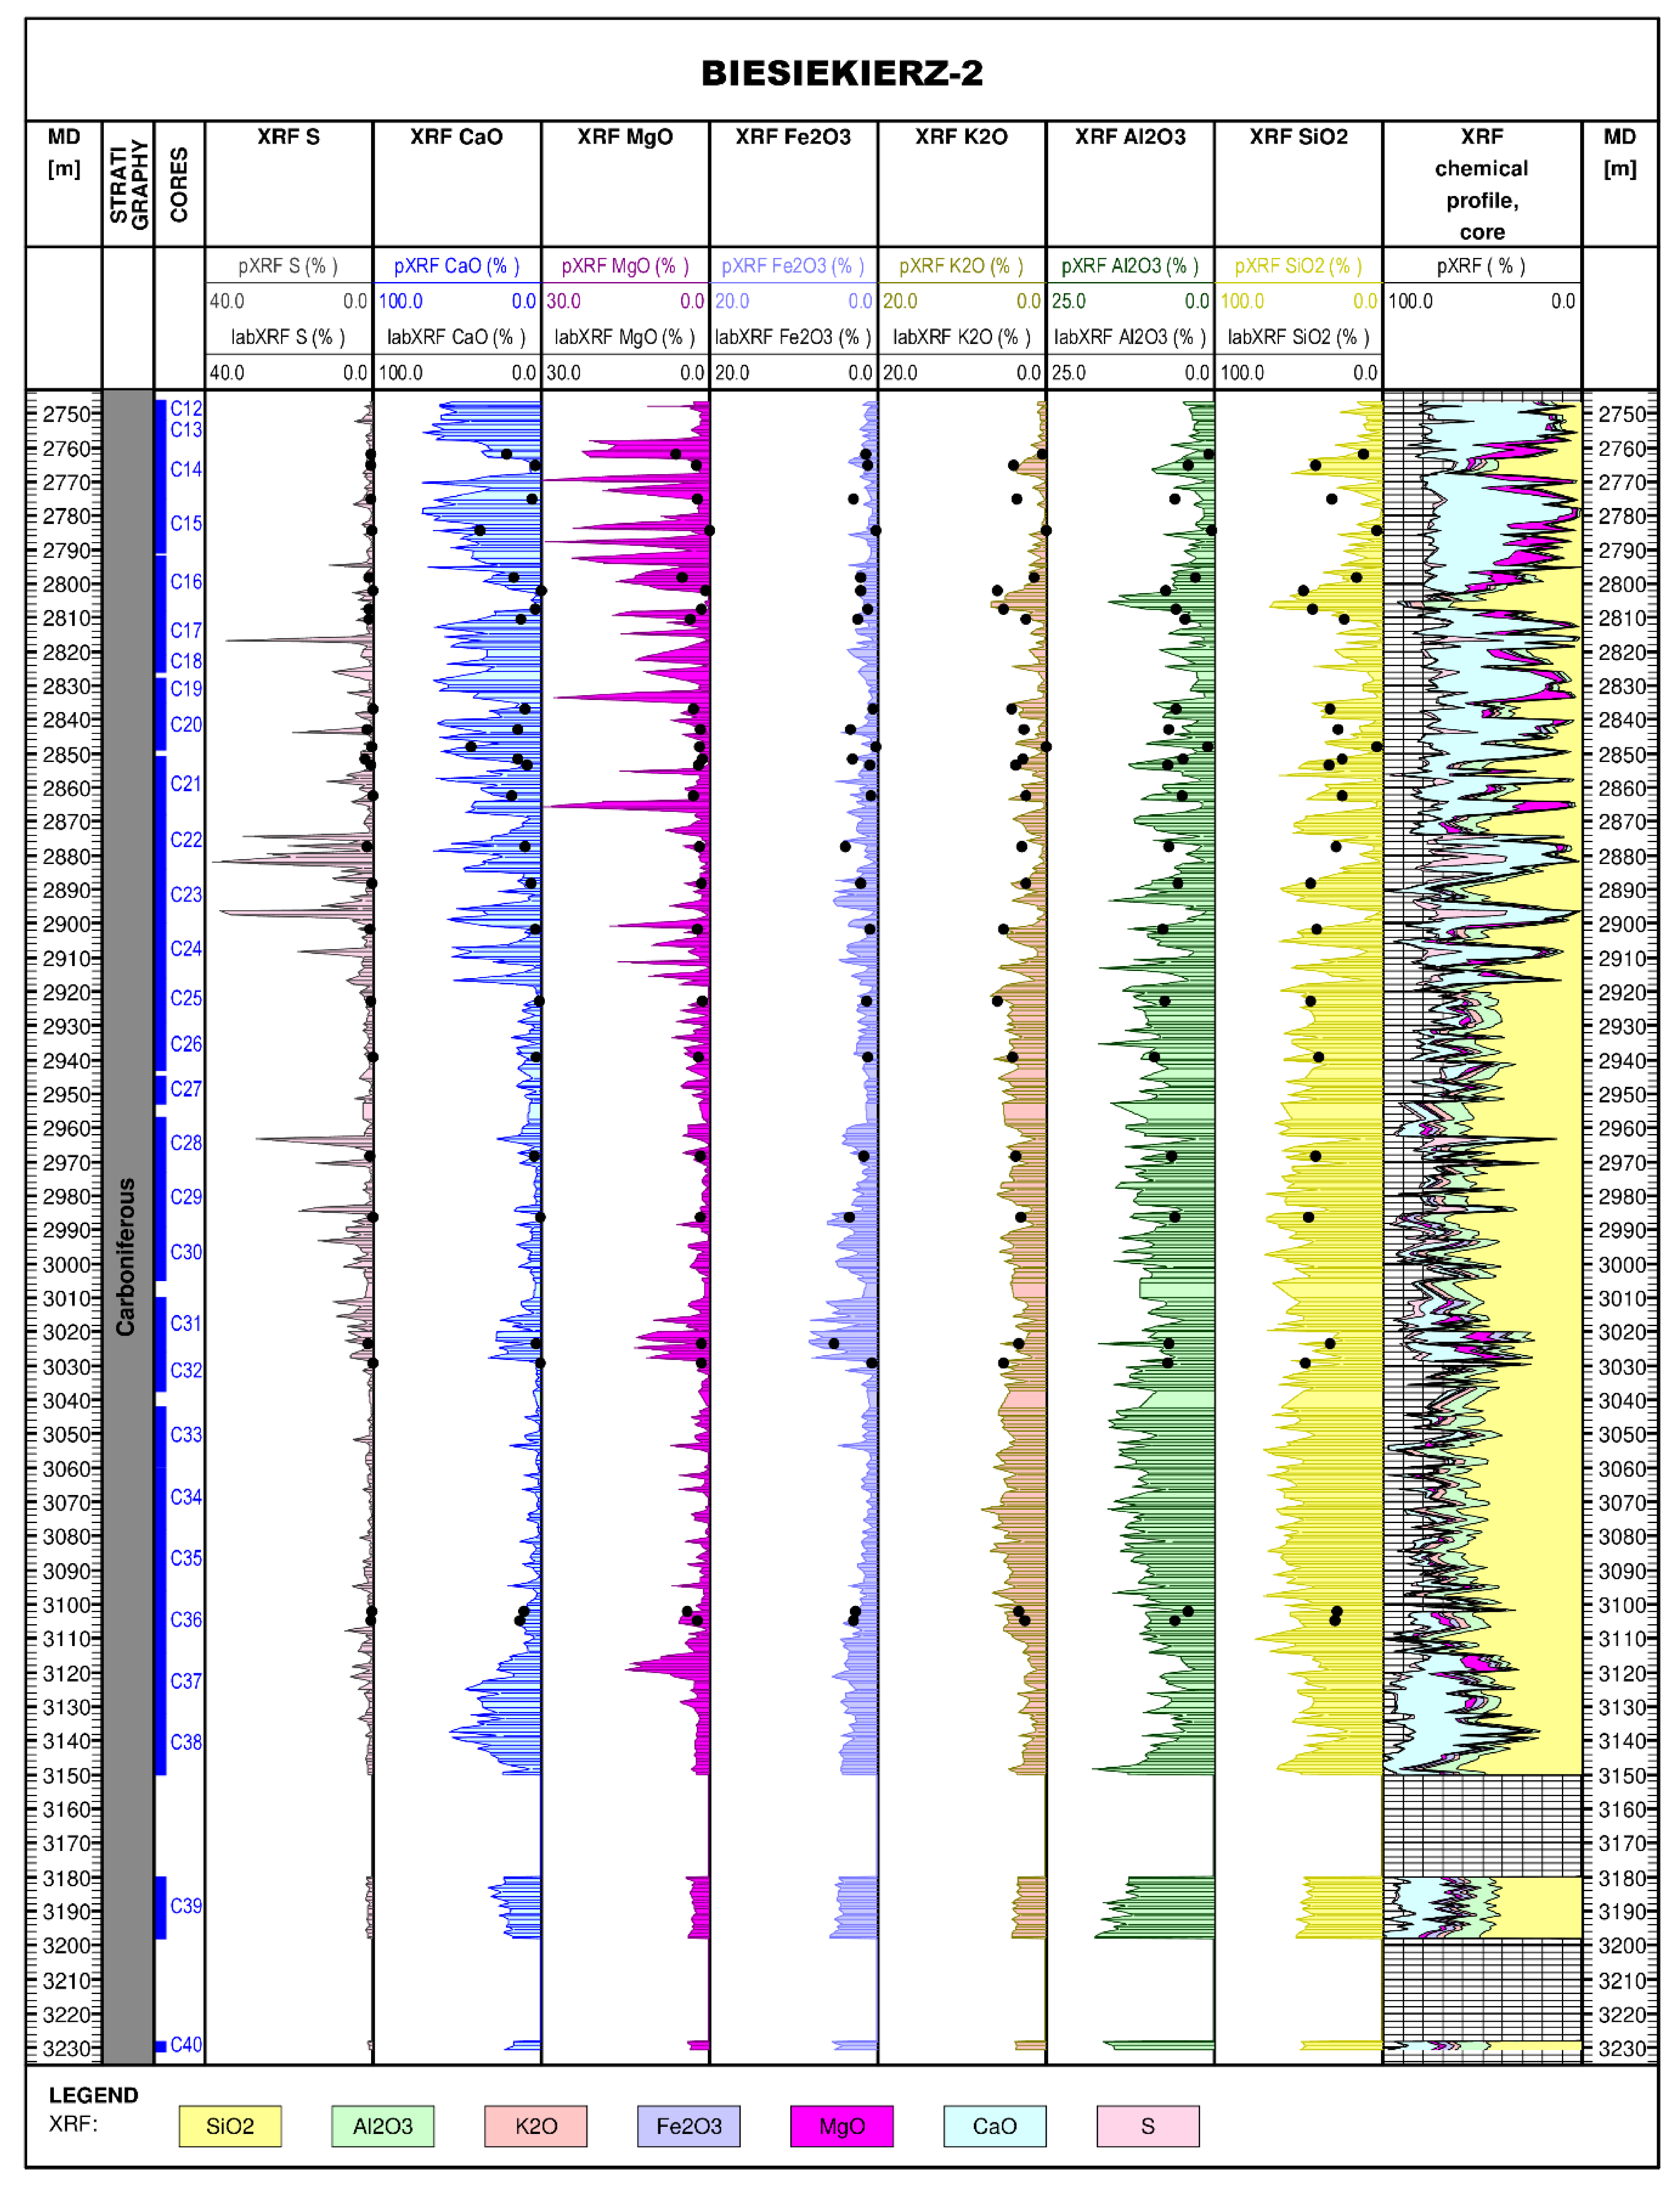
3.4. XRF Measurement Results for the Kobylin-1 and Biesiekierz-2 Boreholes

The results of pXRF measurements carried out in the Kobylin-1 and Biesiekierz-2 boreholes were presented graphically in Figure 12 and Figure 13, respectively. The above-mentioned graphs juxtapose both values recorded for particular selected chemical components (in the form of oxides) as well as their cumulative value (in the last column).
As has already been mentioned, in the case of the Kobylin-1 borehole, measurements were made both on core samples with the step-width of at least one measurement per 1 m (per box) and on drill cuttings, collected with a constant step-width of 4 m, which is fairly frequent as for drill cuttings. The results of pXRF measurements for particular elements taken on cores and drill cuttings were juxtaposed in the same columns—core measurements are presented in a more intense colour (Figure 12).
In the case of the Biesiekierz-2 and Biesiekierz -1 boreholes, measurements were made only on a core material with the step-width of ca. 1 m. During the analysis, the authors strove to take into account all drilled rock lithological types occurring in the geological profile. Graphs showing the changeability of particular chemical component contents along with depth were prepared for the Biesiekierz-2 borehole (Figure 13). The graphs also show the results of measurements conducted in the Actlabs laboratory on powdered samples for which XRD mineralogical analysis was produced.

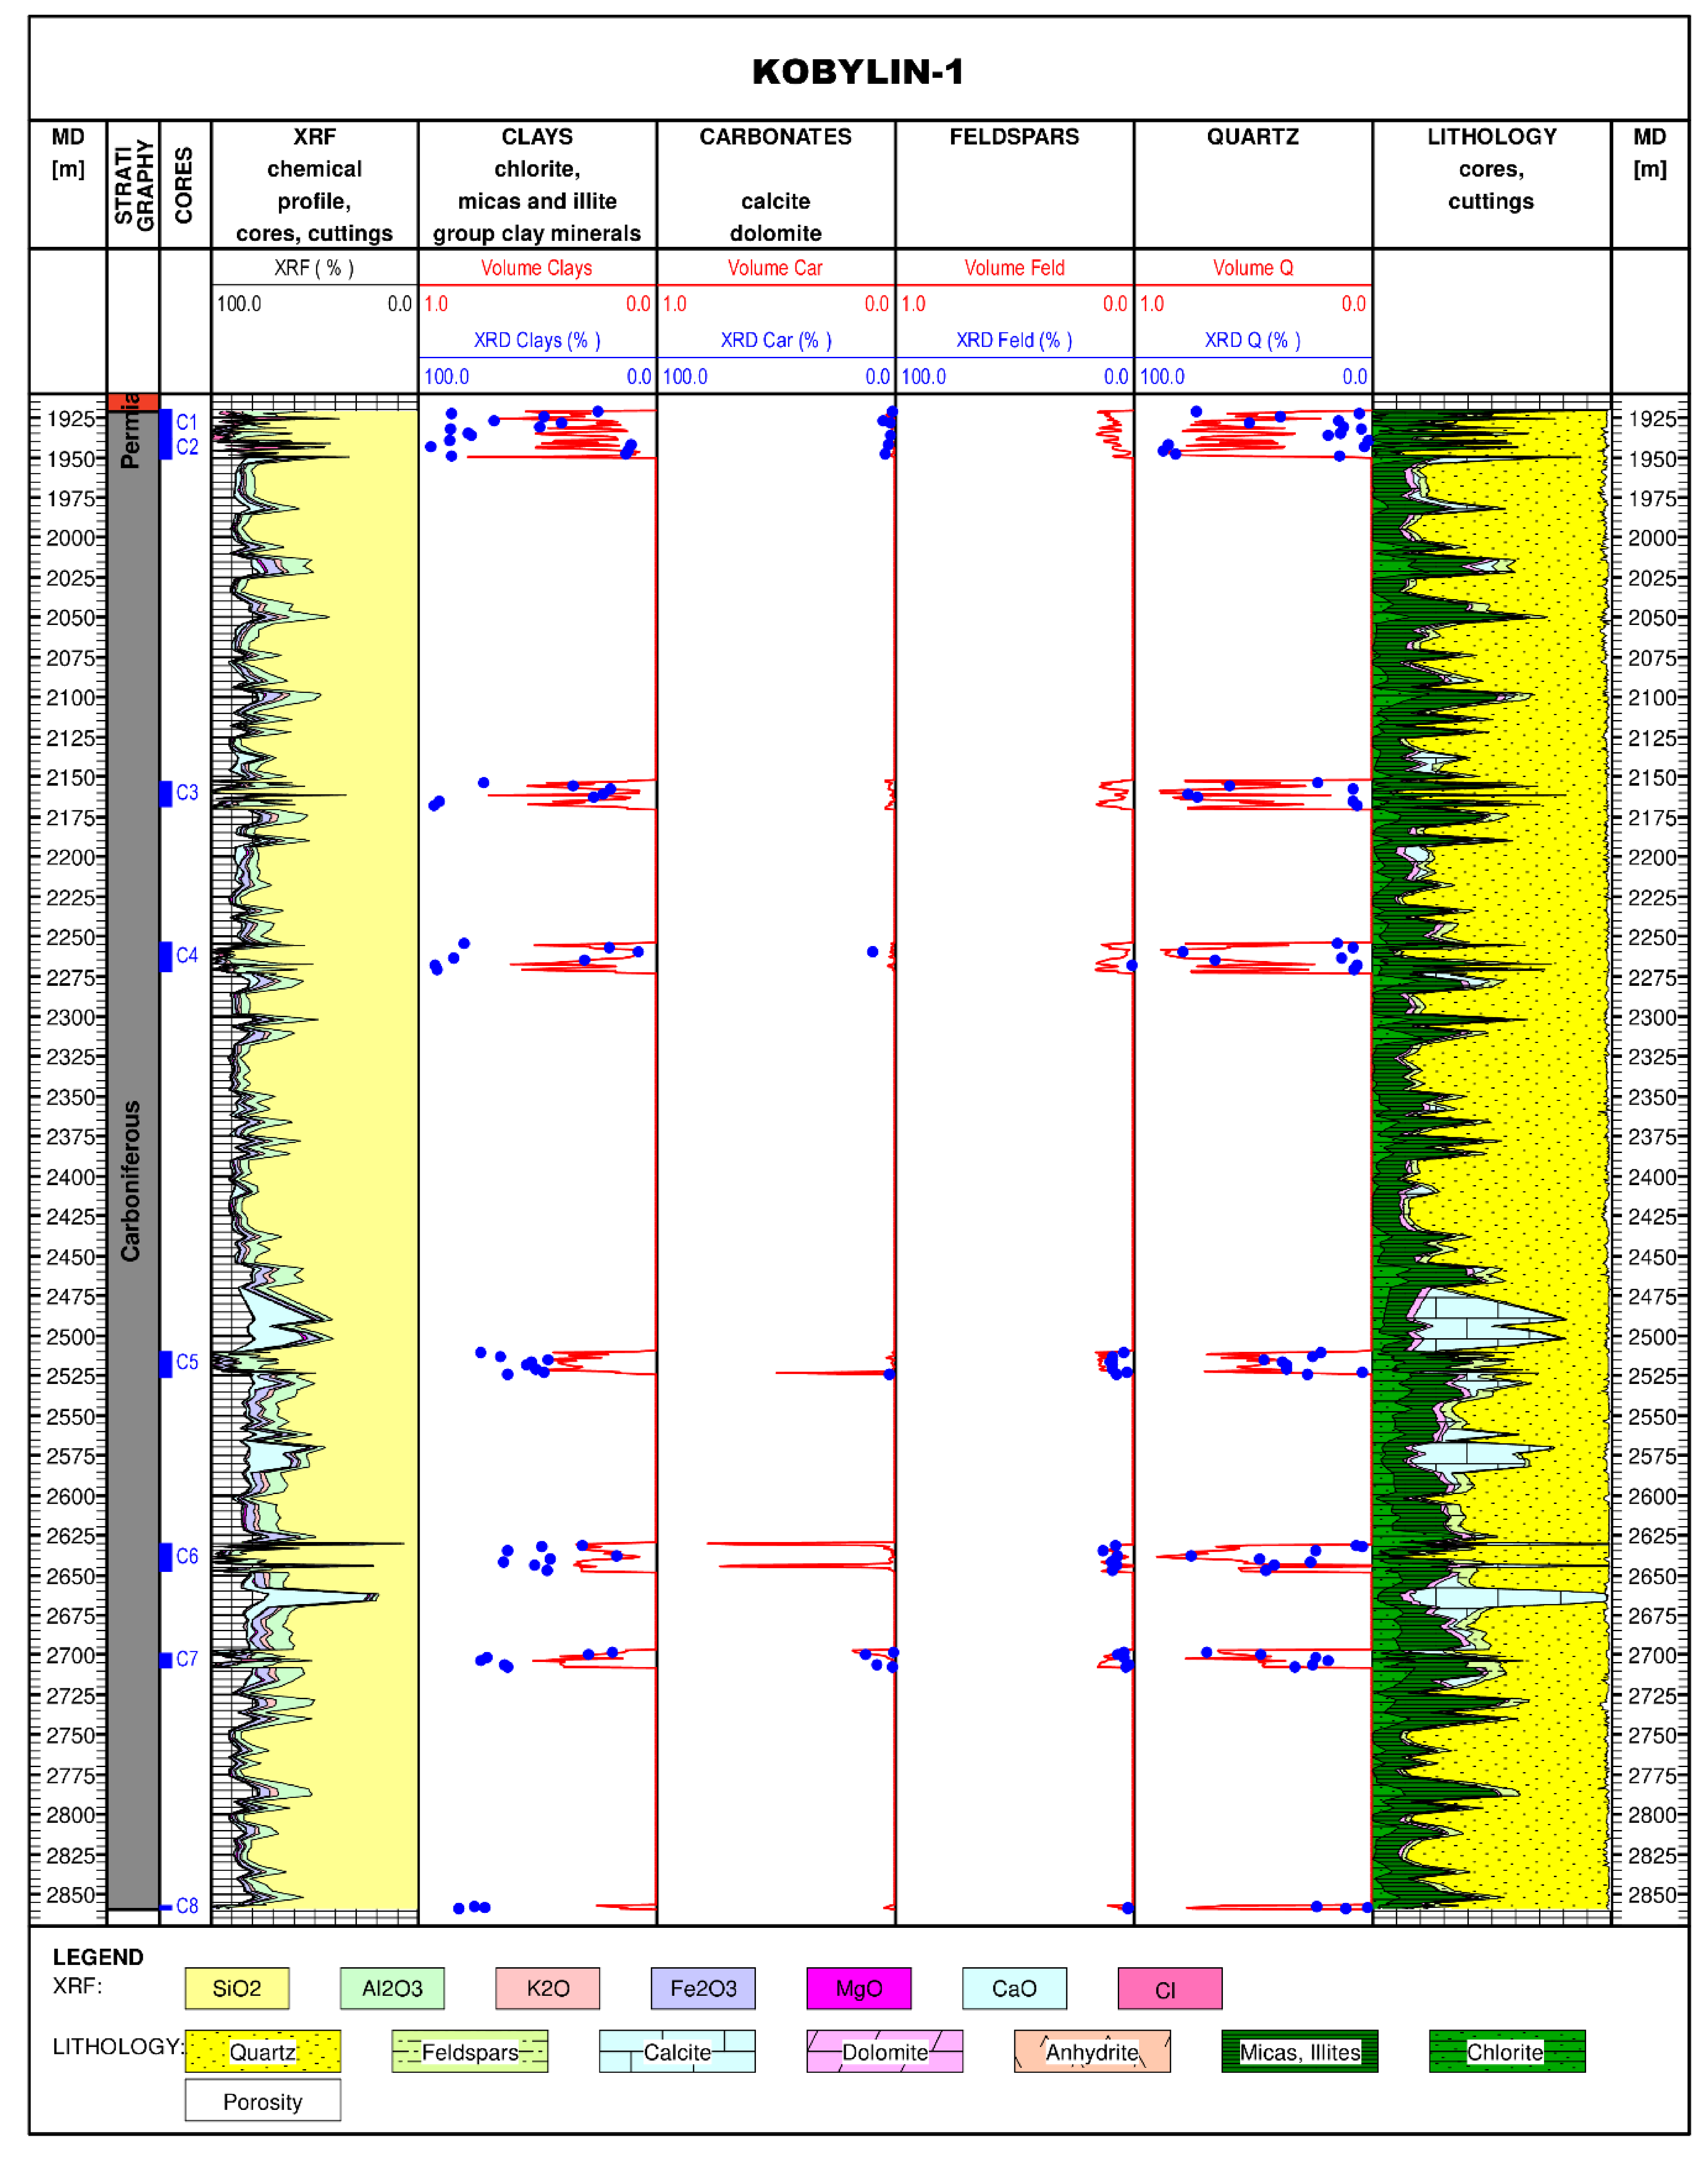
3.5. Reconstruction of Lithological Profile for the Kobylin-1 Borehole

Mineral composition calculations, as previously mentioned, are based on developed models combining a chemical composition with a mineral composition. These models, on the one hand, define kinds of minerals composing rocks drilled in a given region. On the other hand, they determine empirical dependencies between a chemical composition (XRF data) and a mineral composition (XRD data). The following mineralogical composition model was adopted for the Kobylin-1 borehole, based on the results of detailed mineralogical studies:
Quartz (Q)
Feldspars (F)
Calcite (C), Dolomite (D)—carbonates
Micas and illite group clay minerals (M), Chlorite (Ch)—clay content
Porosity (PHI)
The equation describing the adopted mineralogical composition model:
Q + F + C + D + I + Ch + ∑cl + PHI = 1
The adopted algorithm:
1. Carbonates:
2. Dolomite:
3. Calcite:
4. Brittleness (quartz + feldspars):
5. Quartz:
6. Feldspars:
7. Clay content (sum of clay minerals):
8. Chlorite:
9. Micas and illite group clay minerals:
10.  Porosity:
 Crb = f(CaO)
 D = f(MgO)
 C = Węg − Dol
 Q + F = f(SiO2)
 Q = f(SiO2)
 F = Q_Sk − Q
 ∑cl = f(Al2O3)
 Ch = f(Fe2O3)
 M = ∑cl − Ch
 PHI—provided porosity logs were applied
Earlier determined relationships (Figure 9) combining a chemical composition with a mineral one were applied in calculations:
Carbonates:    C + D = f(CaO)  y = 2.495x − 0.5648
Dolomite:    D = f(MgO)  y = 0.1238x + 1.8183
Quartz:    Q = f(SiO2)  y = 1.8995x − 55.303
Brittleness:    Q + F = f(SiO2)  y = 1.9195x − 52.915
Clay content:    ∑cl = f(Al2O3)  y = 4.3271x + 5.2454
Chlorite:    Ch = f(Fe2O3)  y = 4.1544x − 5.1799
Because for the Kobylin-1 borehole, there were two sets of measurements taken on core samples and drill cuttings. The calculated lithological profile is presented in two versions: core samples and drill cuttings (Figure 14). The combined results constituting the final lithological profile calculation effect for this borehole are presented in the last right column.

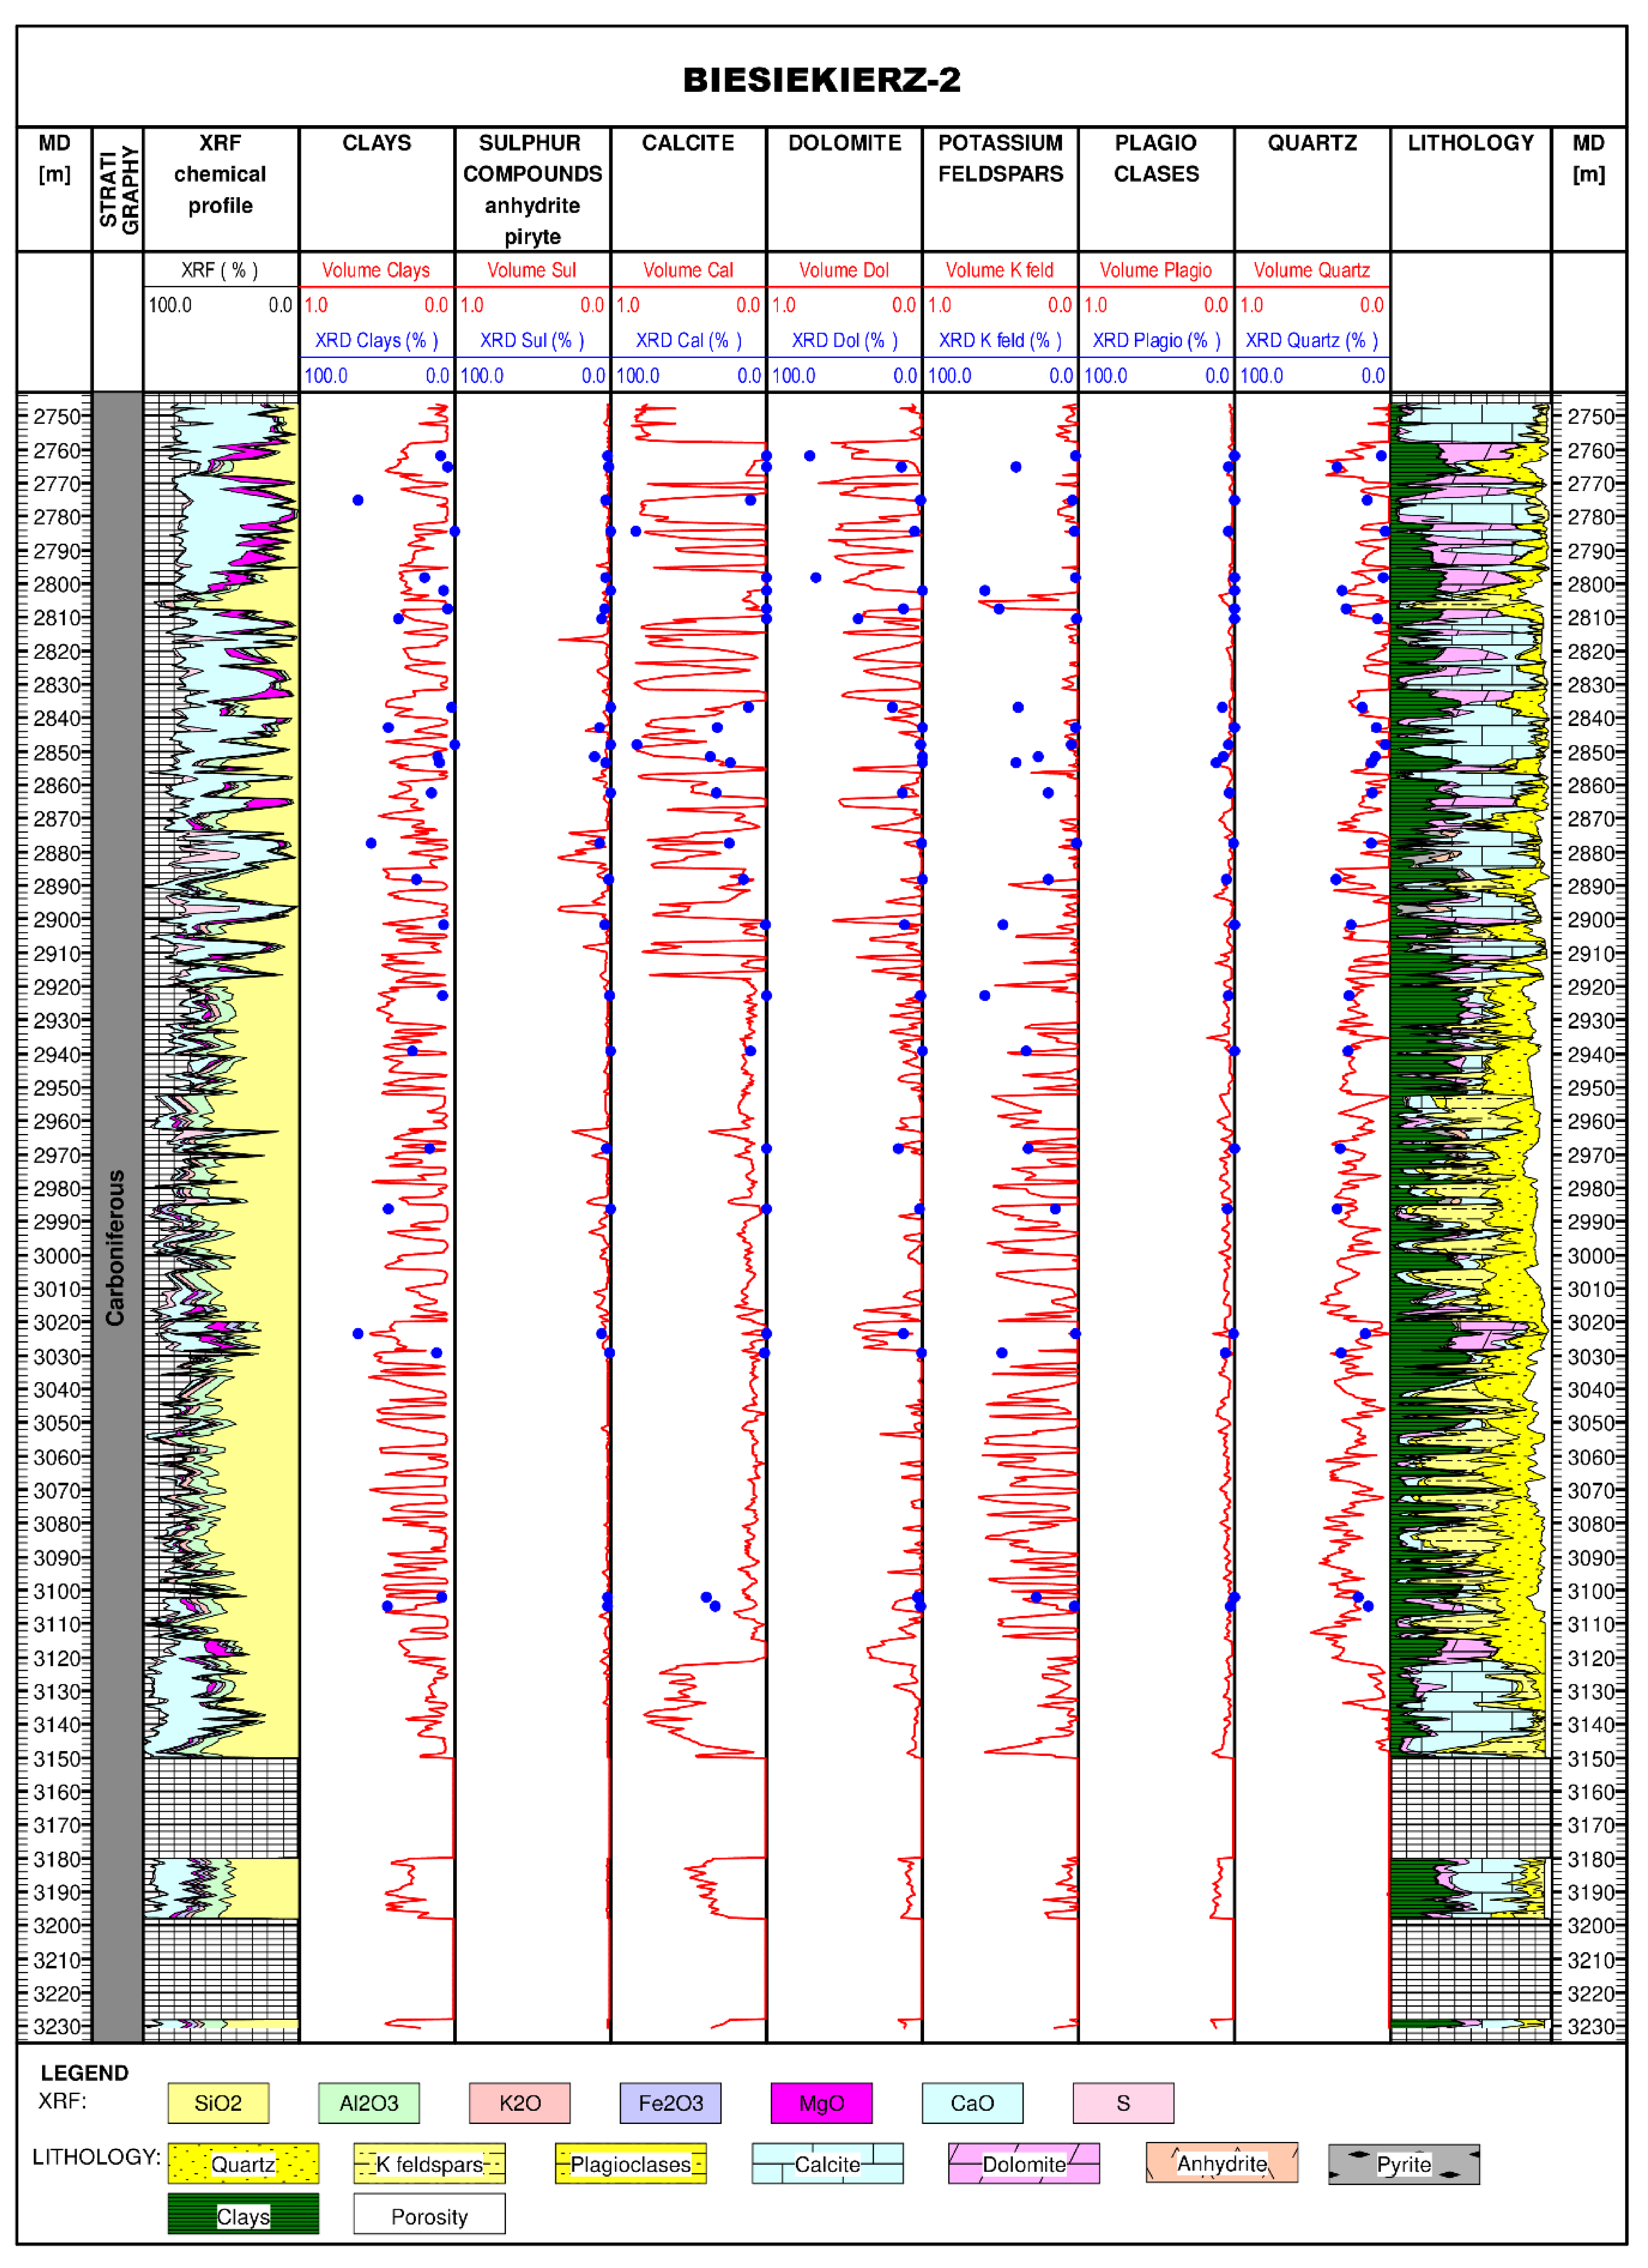
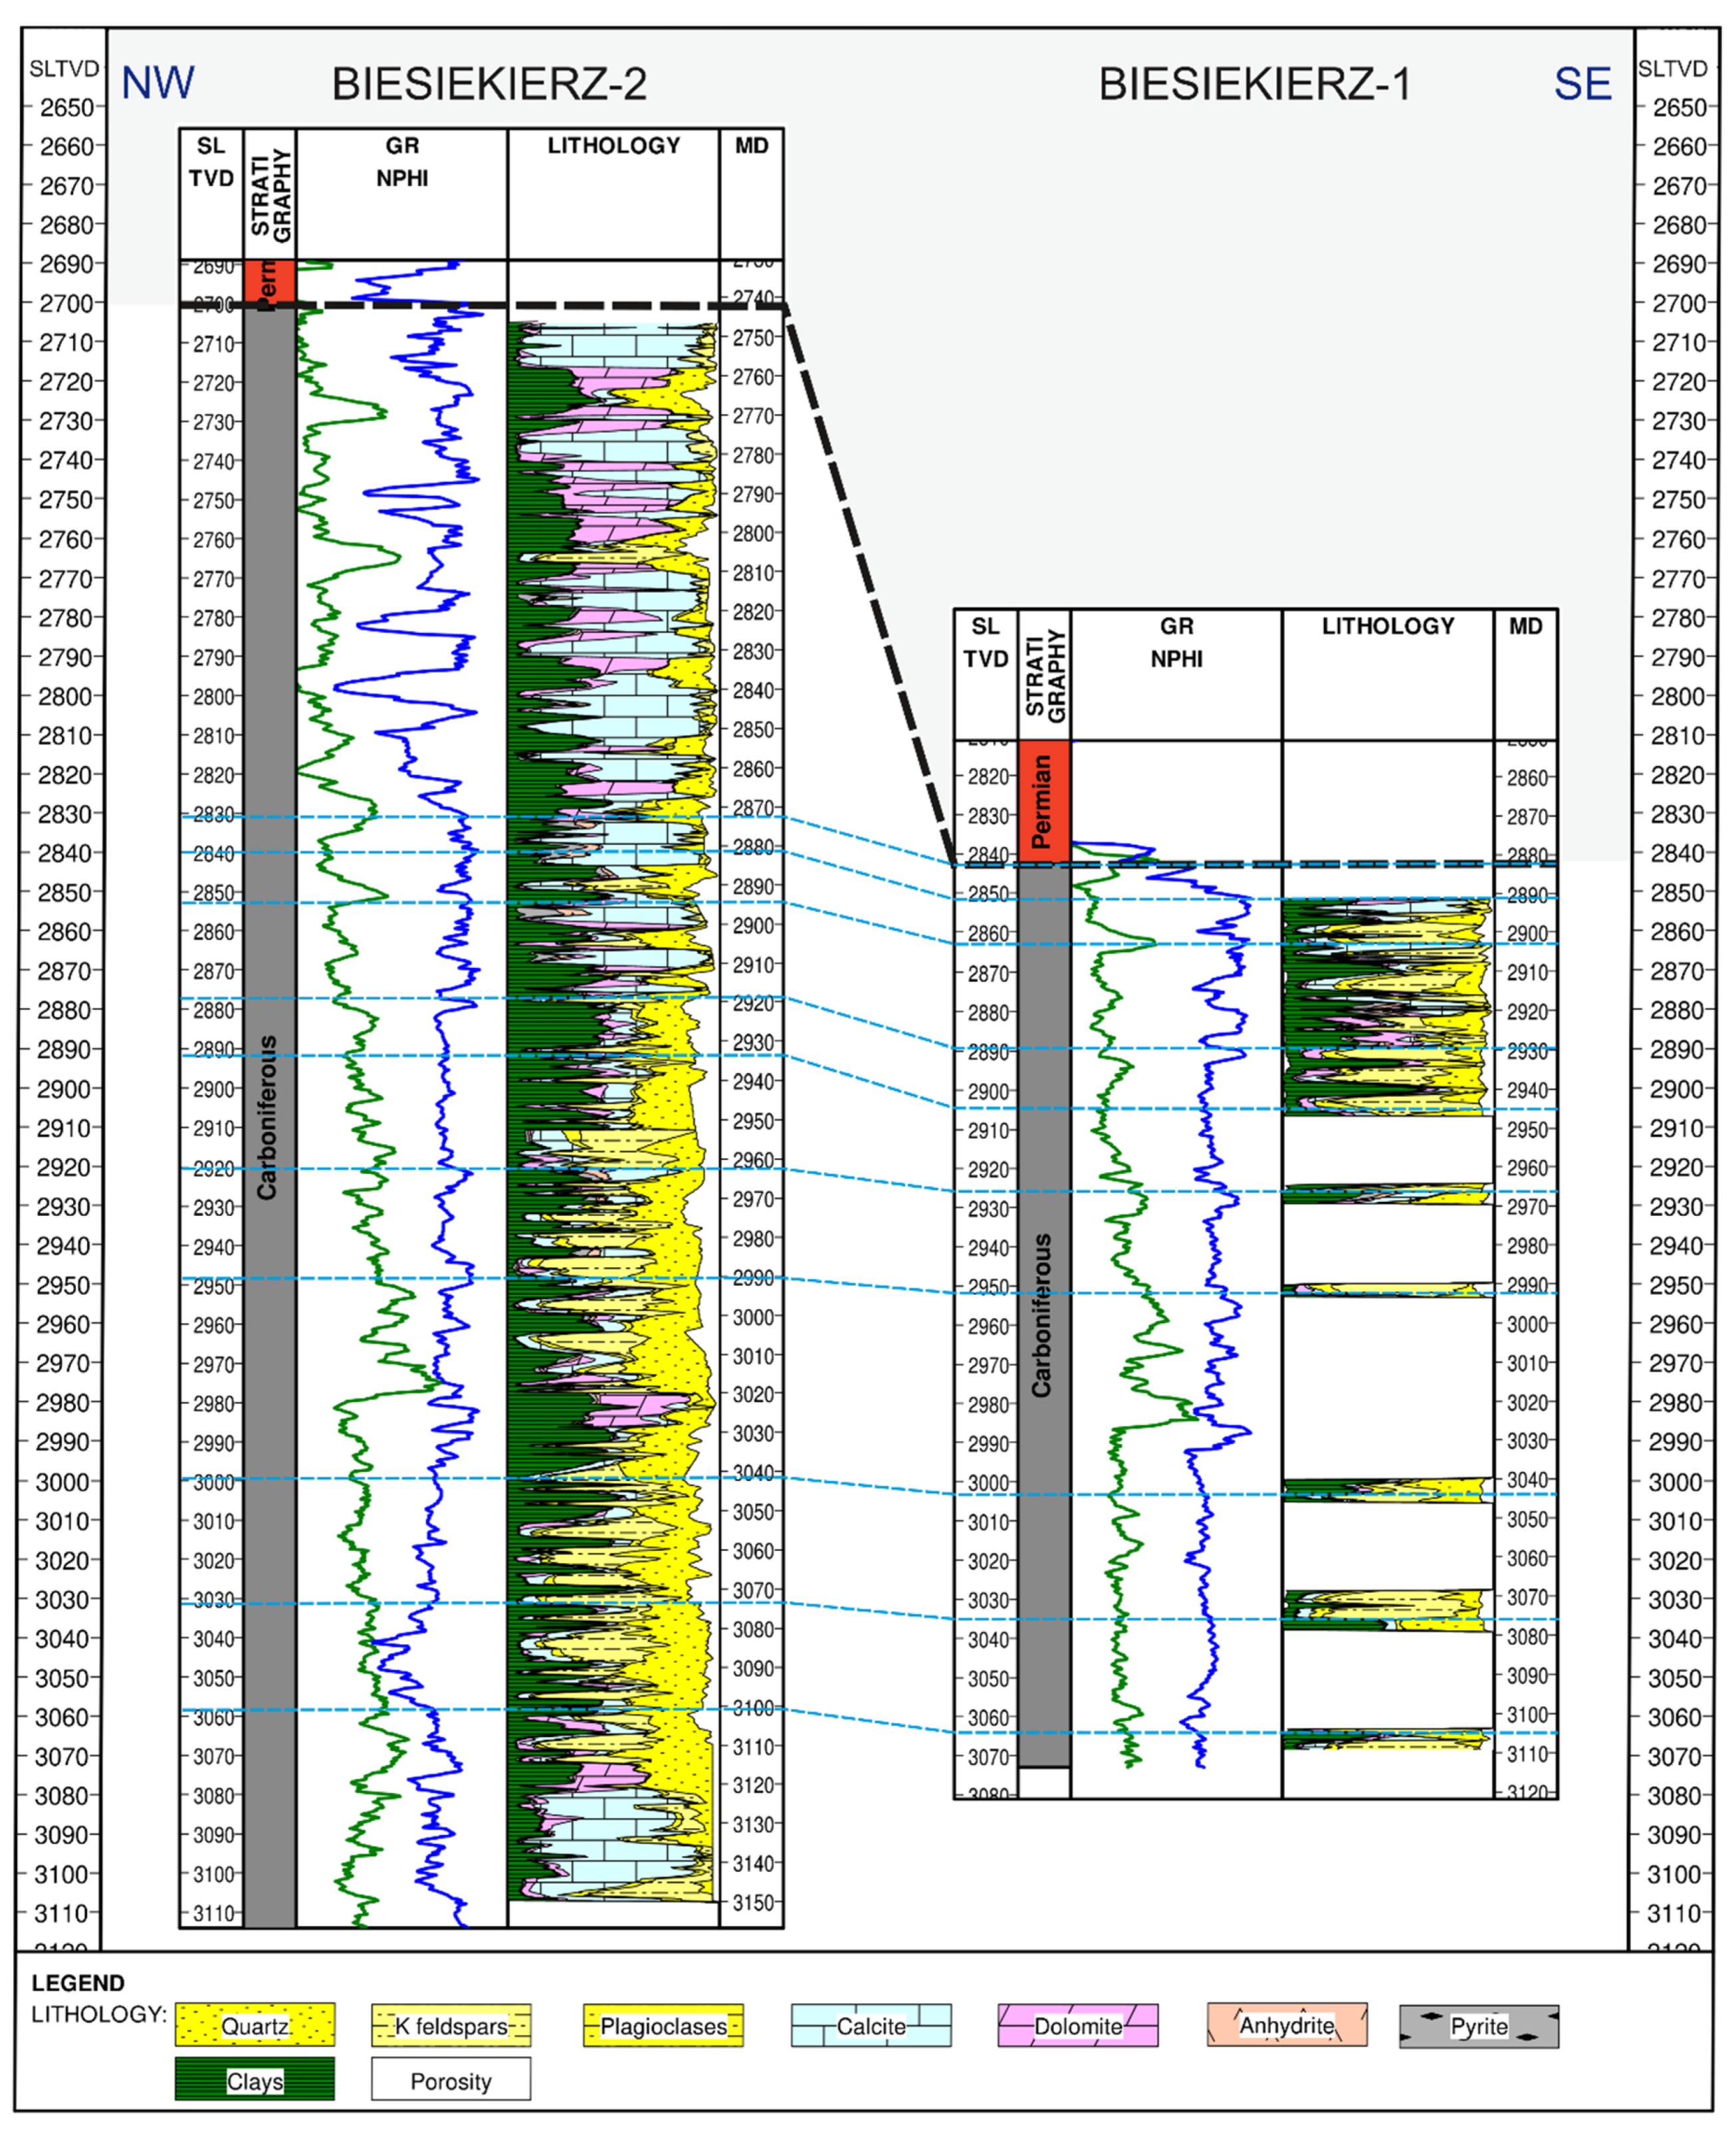
3.6. Reconstruction of Lithological Profiles for the Biesiekierz-2 and 1 Boreholes

The following mineralogical composition model was adopted in line with the mineral composition defined for the Biesiekierz-2 and Biesiekierz-1 boreholes:
Quartz (Q)
Plagioclases (Pl), Potassium feldspars (F—K)  —feldspars
Calcite (C), Dolomite (D)  —carbonates
Anhydrite (A), Pyrite (P)  —sulphur compounds
Clay content (∑cl)
Porosity (PHI)
The equation describing the adopted mineralogical composition model:
  • Q + F—K+ Pl + C + D + A + P + ∑cl + PHI = 1        (1)
The adopted algorithm:
1. Carbonates:
2. Dolomite:
3. Calcite:
4. Sulphur compounds:
5. Anhydrite:
6. Pyrite:
7. Clay content + potassium feldspars:
8. Clay content + feldspars:
9. Brittleness:
10.  Plagioclases: (2) → (3)
11.  Quartz: (3) → (1)
12.  Clay content: (4) → (1)
13.  Potassium feldspars: (5) → (2)
14.  Porosity:
 Crb = f(CaO)
 D = f(MgO)
 C = Crb-D
 S = f(S)
 A = S* index—adopted coefficient
 P = S* (1 − index)
 ∑cl + F—K = f(K2O)   (2)
 ∑cl + F—K + Pl = f(Al2O3)     (3)
 Q + F—K + Pl = f(SiO2)         (4)
 Pl = f(Al2O3) − f(K2O)
 Q = 1 − PHI − Crb − S − f(Al2O3)
 ∑cl = 1 − PHI − Crb − S − f(SiO2)    (5)
 F—K = f(K2O) − 1 + PHI + Crb + S + f(SiO2)
 PHI—the applied porosity logs are based on samples from the final report
Earlier determined dependencies/relationships (Figure 11) combining a chemical composition with a mineral one were applied in calculations:
Sulphur minerals (anhydrite + pyrite):    A + P = f(S)  y = 4.8548x − 0.2192
Carbonates:    C + D = f(CaO)  y = 2.3867x + 7.016
Dolomite:    D = f(MgO)  y = 14.11x − 19.676
Brittleness (quartz + feldspars):    Q + F = f(SiO2)  y = 1.9883x − 15.982
Clay content + feldspars:    ∑cl + F = f(Al2O3)  y = 7.8624x + 5.3036
Clay content + potassium feldspars:    ∑cl + F—K = f(K2O)  y = 9.4461x + 18.23
The calculated lithological profile for the Biesiekierz-2 borehole was presented in the last right column of Figure 15.

3.7. Comparison of Lithological (Composition) Reconstruction Results with XRD Mineral Composition Benchmark Results

Graphs presenting calculation results for contents of particular mineral components based on the pXRF measurements (Figure 14 and Figure 15), apart from earlier described cumulative columns containing lithological composition, also illustrate contents of particular minerals determined on the basis of the XRD method. In the case of the Kobylin-1 borehole, clay content (chlorite, illite), carbonate content (calcite, dolomite), feldspars, and quartz were presented on a cumulative basis. In the case of the Biesiekierz-2 borehole, the following contents were presented: clay content, sulphur compounds (anhydrite, pyrite), carbonates (split into calcite and dolomite), feldspars (presented separately, potassium feldspars and plagioclases), as well as quartz.
Analysing the described summary tables, it can be stated that the obtained calculation results of lithological compositions based on pXRF measurements and XRD/pXRF mineralogical models are consistent with benchmark results for XRD tests. Therefore, they credibly reconstruct the lithological compositions in both investigated boreholes. In the case of the Biesiekierz-2 borehole, despite the fact that the mineral composition of Carboniferous rocks is more complex here, still, the calculation results correspond very well to the XRD data, precisely identifying carbonate and sandstone-arkosic zones in the Carboniferous profile.

4. Discussion of the Obtained Results

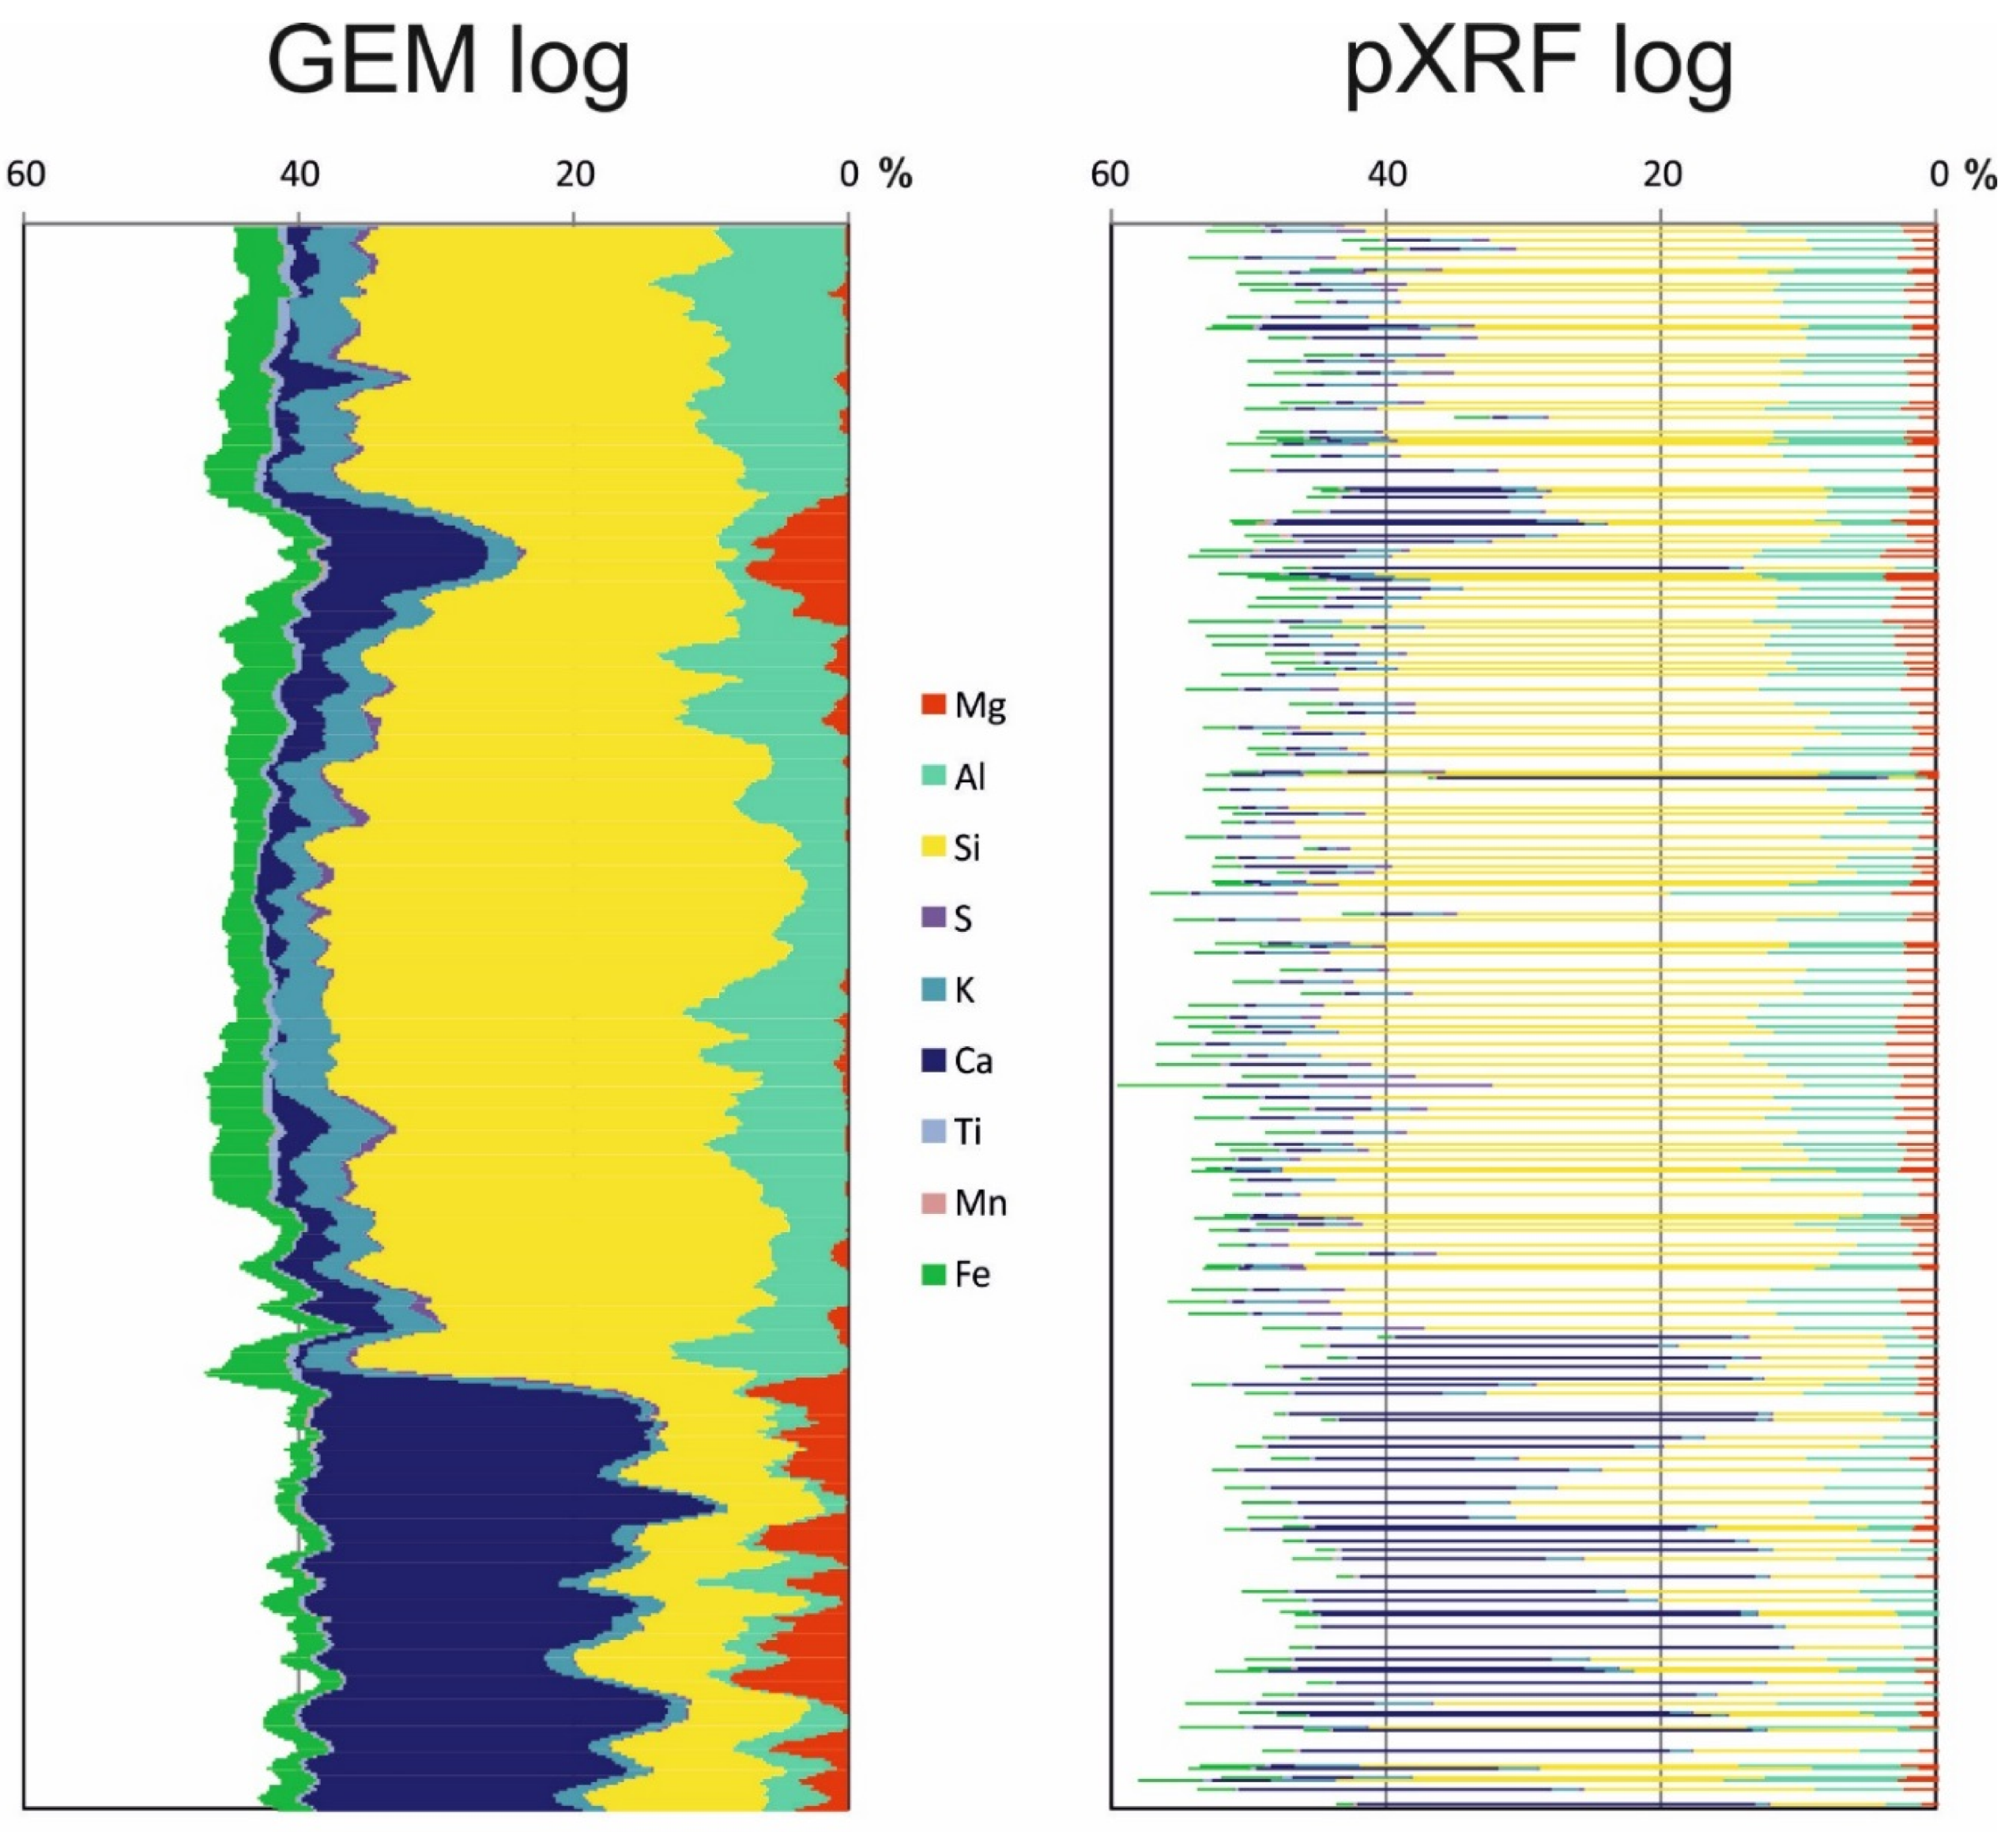
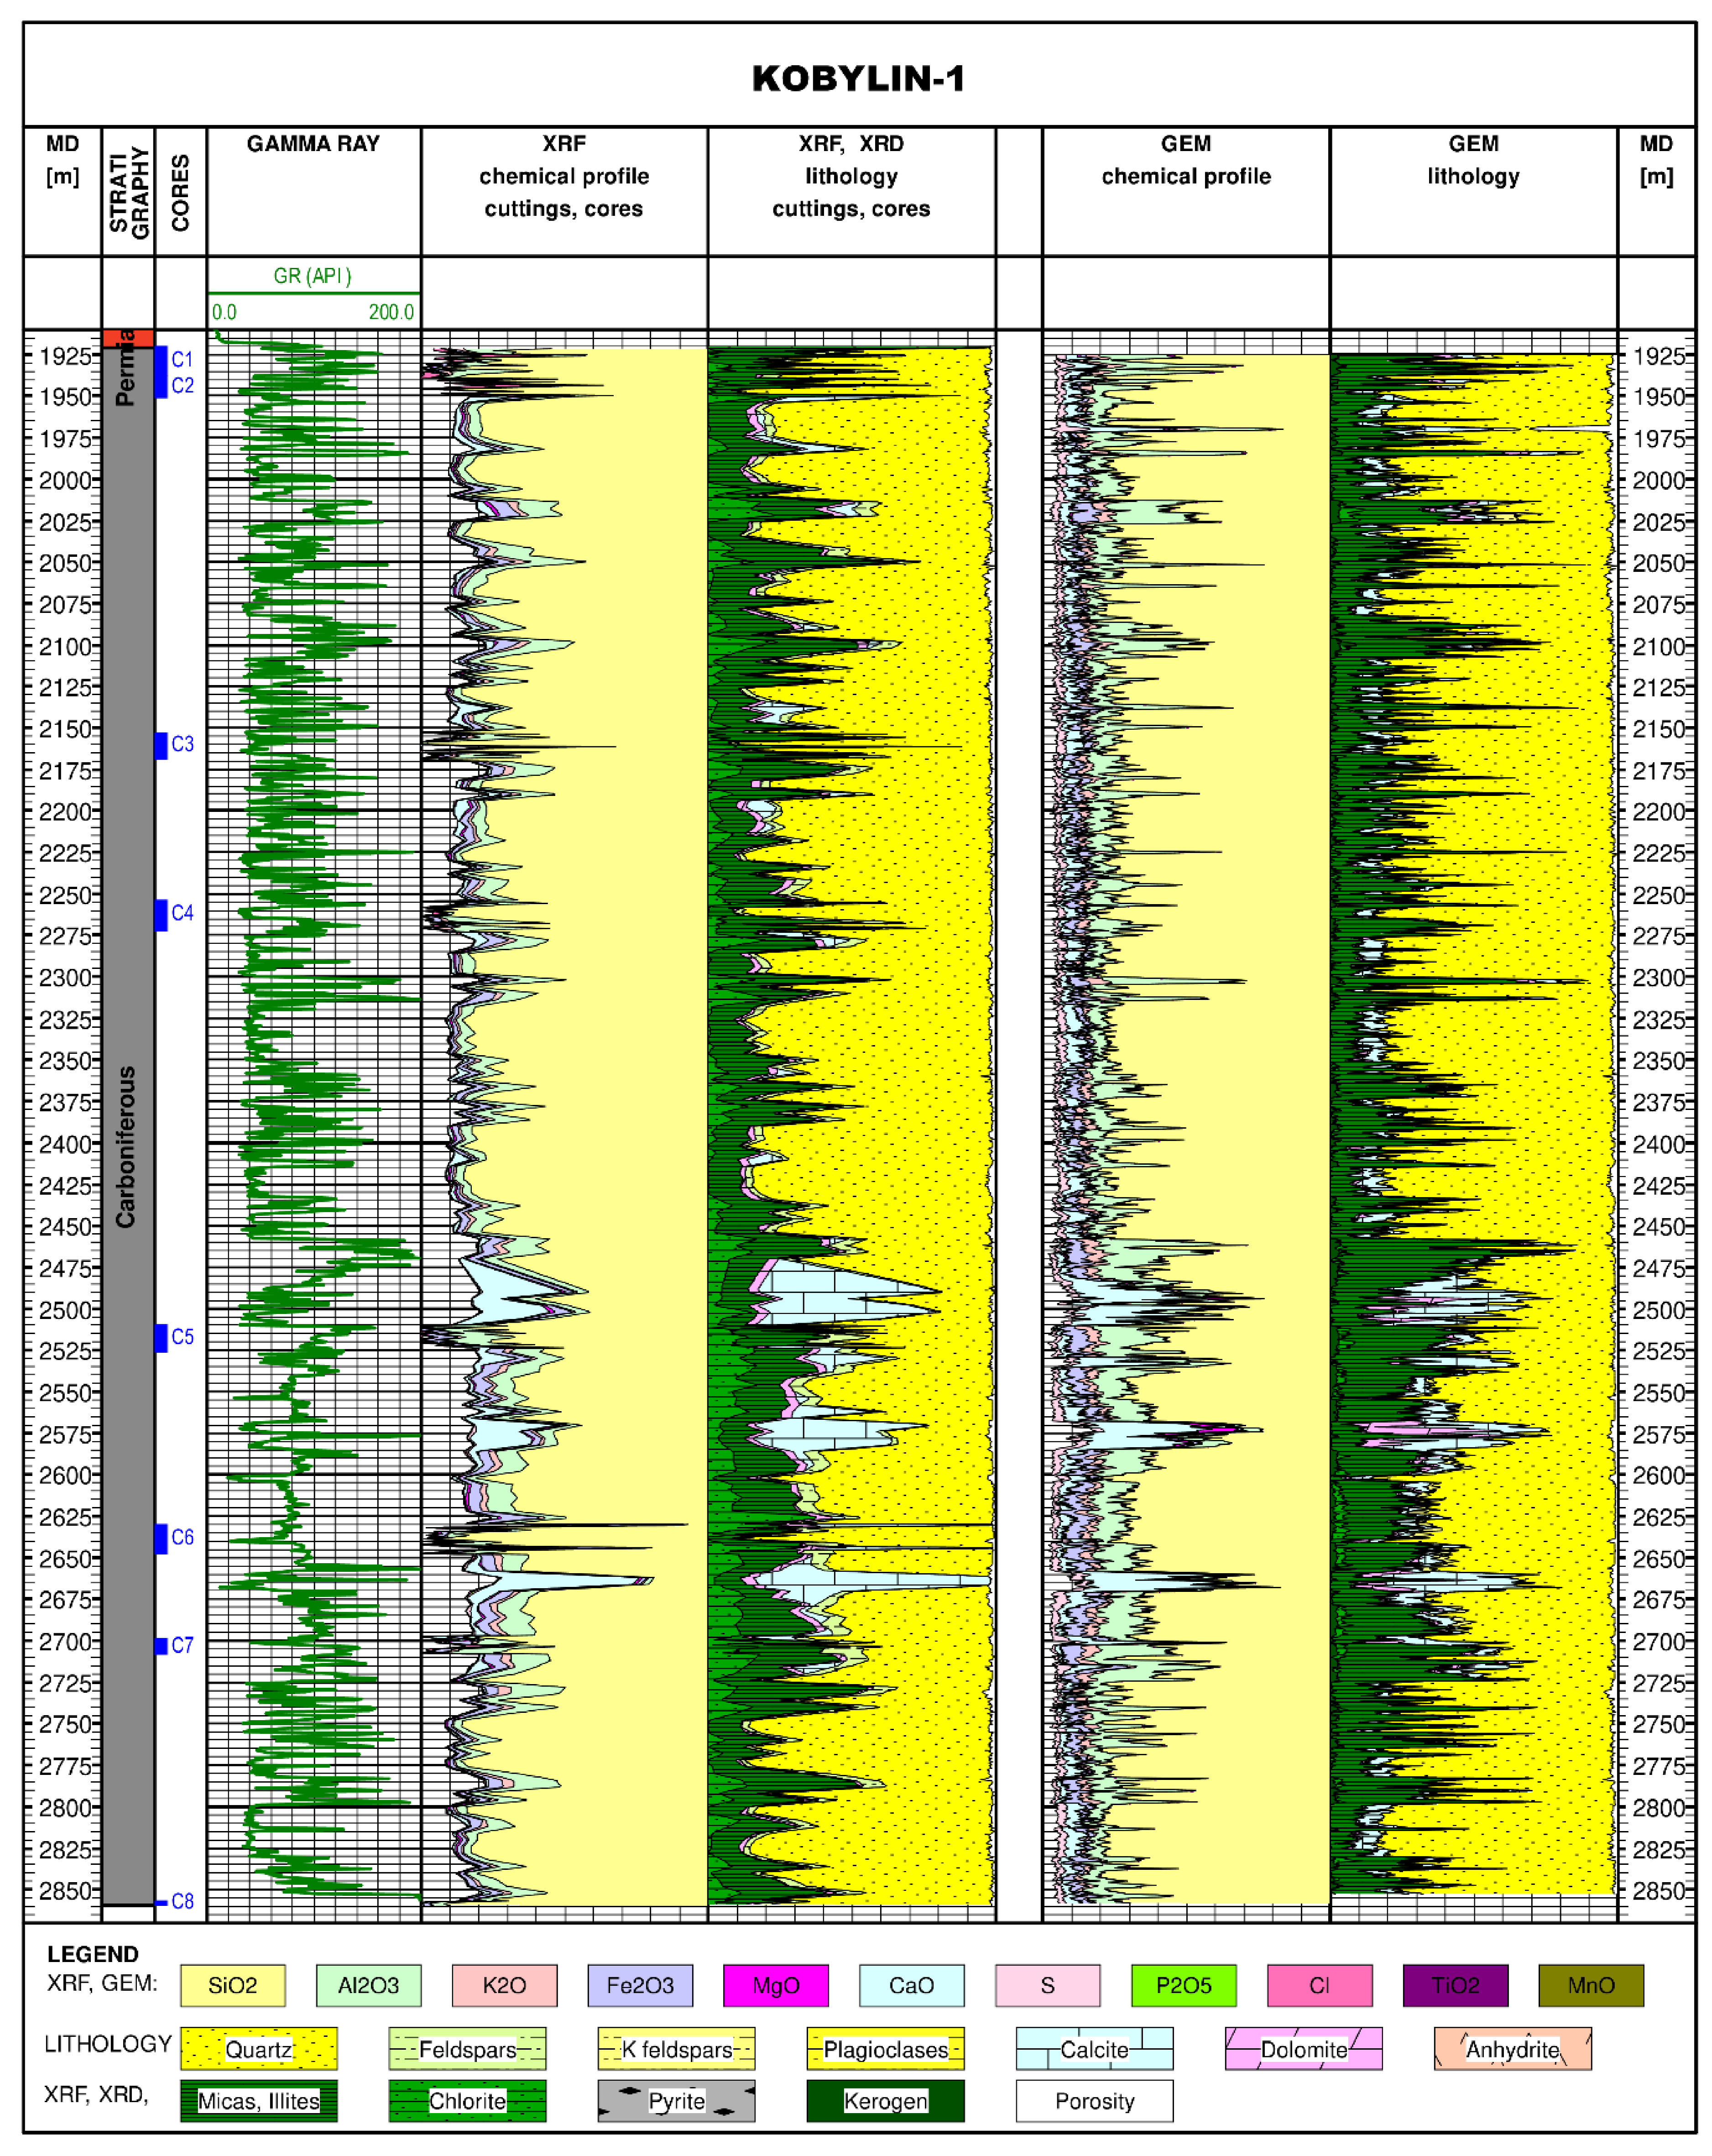
4.1. Comparison of pXRF Results with GEM Probe Measurements for the Kobylin-1 Borehole

Measurements were made in the Kobylin-1 borehole along with the interpretation of measurement data taken with a Halliburton GEM chemical probe. Figure 16 illustrates the juxtaposition of XRF measurements made on core samples and drill cuttings as well as combined lithological profile calculation results with corresponding GEM probe measurements and data interpretation. In order to make the comparison easier, XRF and GEM data as well as corresponding interpretation results were presented in an analogous manner. At a glance, the great consistency of both chemical measurements and lithological interpretation results can be noticed.
For obvious reasons, in our case, the vertical resolution of data based on drill cuttings is lower than the resolution of geophysical logs carried out in the borehole. However, it seems that all characteristic changes in chemical and lithological compositions recorded with a GEM probe are reflected in pXRF measurements as well as a corresponding lithological profile reconstruction. The explicit consistency of the lithological profile reconstruction for the Kobylin-1 borehole conducted based on pXRF measurements and the interpretation of results, regarding measurements carried out with the use of a GEM probe (Figure 16), ultimately proved that there is a possibility of producing this type of lithological profile based on drill cutting measurements.
Observed discrepancies are connected with the fact that the standard geophysical interpretation procedure utilizes assumed mineralogical/lithological models so on the assumption it is less accurate than the interpretation based on the result of precise mineralogical investigations. This is clearly visible in the example of clay minerals (Figure 16). It is worth noting that the compared lithological profiles still match each other very well. No distortions due to the presence of drilling fluid additives in drill cuttings were recorded in mineral composition analysis results. In our case, the drilling fluid contained barite and carbonates as a solid components. Barite is not present in analysed rocks in a big amount, so the content of Ba could be treated as an indicator of contamination level by drilling fluid. Conducted XRF analysis demonstrated that the total barium content did not exceeded 0.2% in cuttings from the Kobylin-1 borehole.4.2. Borehole correlation for the Biesiekierz-1 and Biesiekierz-2 boreholes.
Within the project, lithological profile reconstruction results were analysed in terms of their application for borehole correlations. The studied boreholes Biesiekierz-1 and Biesiekierz-2 are ca. 600 m apart from each other drilling a Carboniferous top at the depth of 2842.5 m TVDSL (Biesiekierz-1) and 2700.5 m TVDSL (Biesiekierz-2) respectively. A nearly 150-m difference in the depth of the Carboniferous top and a small distance between the boreholes raised the question of whether the lithological profile reconstruction results could explain the existing situation.
Figure 17 presents the correlative juxtaposition of these two boreholes, illustrating stratigraphy, GR, and NPHI logs, as well as the lithological profile reconstruction results. The diagram was drawn in the TVDSL scale, with the vertical depth referring to the sea level. The top of the Carboniferous was correlated in the diagram. Correlation lines linking characteristic parts of the lithological profile in the analysed boreholes were drawn.
In light of the conducted borehole correlation, it can be stated that the Biesiekierz-1 borehole drills only the bottom part of a carbonate sequence represented in the top part of the Carboniferous in the Biesiekierz-2 borehole. Thus, the Carboniferous in the Biesiekierz-1 borehole is generally represented by sandy-arkosic sediments, observed in the lower part of the Carboniferous profile in the Biesiekierz-2 borehole. However, a carbonate part present in the Biesiekierz-2 borehole is missing in the Biesiekierz-1 borehole probably due to the erosion.

4.2. Comparison of Lithological Profile Reconstruction Results with a Standard Interpretation of Geophysical Logging in the Biesiekierz-2 Borehole

Analysing the results of lithological profile reconstruction carried out in the Biesiekierz-2 borehole along with records of standard geophysical logging (Figure 18), it can be concluded that there is some inconsistency between the reconstruction results (meaning also pXRF and XRD measurements) and geophysical logging, especially clearly visible in the case of GR background radiation logging. Using the presented logs, it seems difficult to obtain a clay content value close to that suggested by XRD measurements.
Arkosic sandstones are described in the interval below 2090m MD in the analysed lithological profile. They are characterised by an increased potassium content in chemical measurements and in the calculated lithological profile are related to the presence of potassium feldspars. Thus, because of a high potassium content in arkosic sandstones, the shapes of GR background radiance logs do not correspond only to clay content, which is assumed during standard geophysical log interpretation. Unfortunately, well logging data do not contain a spectrometric gamma measurement, which would make it possible to split background radiation into uranium, potassium, and thorium and, as a consequence, would support a more reliable clay content calculation. Both boreholes were drilled before the popularisation of spectrometric gamma measurements in Poland, which happened in the 1990s (Biesiekirz-1 in 1970 and Biesiekierz-2 in 1986). The conducted pXRF analyses in a perfect way complete the information on the share of particular radioactive elements.
The interpretation of results regarding standard lithology with the use of original GR logs is presented in Figure 18 in the last but one right column. Also, point information on cumulative clay content measured in line with the XRD method was marked. It can be noticed that, especially in the interval below 2920 m MD the clay content value determined based on geophysical logs is considerably overestimated and, on the other hand, the volume of quartz, which in such an approach is the actual sum of quartz and feldspars, is underestimated.
Making use of existing XRF measurements, i.e., K2O content, a correction was made to the original GR logs. The corrected logs and the size of the correction are shown in the gamma ray column. With the use of the corrected logs, the lithological composition was recalculated and presented in the last right column. An essential change can be noticed in the clay and quartz contents as compared to calculations based on the original GR logs. The results correspond better with XRD mineralogical measurements.

5. Conclusions

Measurements made with a portable pXRF spectrometer open up new possibilities of lithological profile reconstructions, also for clastic, clay-rich formations. A reconstructed lithological profile for the Kobylin-1 borehole is very consistent with GEM probe measurement results and their interpretation, which ultimately proved that there is a possibility of reconstructing lithological profiles based on drill cutting measurements. No distortions due to the presence of drilling fluid additives in drill cuttings were recorded in mineral composition analysis results, although they were not cleaned. Nonetheless, it should be noted that each geological formation is unique and demands dedicated mineralogical investigations, and of course, each cutting is different so a specific approach is required every time.
Although we recommend conducting the pXRF measurements on milled material, as presented in Section 3.1, we do not exclude the possibility of conducting the measurements directly on solid rocks. Sometimes, it is the only possibility, as in the case of archival cores. However, it is useful to know the limitation of such measurements. Especially, cuttings should be milled before measurements as they usually consist of different fraction fragments.
The presented method can also be applied in archival boreholes, providing tools for conducting borehole correlations as well as the verification and possible correction of well-log data. It allows to utilize geological information included in rich core material that was collected in the 1970s and the 1980s, when continuous coring in analysed stratigraphic sections was widely used, which, in turn, will allow to reduce a core collection from newly projected boreholes. Similar lithological profiles carried out on the basis of pXRF chemical composition analyses can also be applied for geological profiling conducted both on cores and outcrops. Owing to this, the changes in mineral composition of analysed rocks can be traced in detail simultaneously to a sedimentological description.
The presented methodology allows for the development of detailed, dedicated mathematical models of mineral composition for particular sedimentary basins. Determined mineralogical models of two geological objects: of the Lower Carboniferous from the region of Western Pomerania (the Biesiekierz-2 borehole) and of the Lower Carboniferous from the region of the Fore-Sudetic Monocline (the Kobylin-1 borehole) can, in the future, also be utilized in other boreholes drilled in the Carboniferous rocks in that region. It was tested on the example of the Biesiekierz-1 and -2 boreholes.
With the example of the Biesiekierz-2 and -1 boreholes, it was also demonstrated that lithological profile reconstruction results can be applied for borehole correlations, raising its credibility. Based on comparisons with geophysical curves for the Biesiekierz-2 borehole, the authors presented the possibility of introducing a constant correction regarding the presence of potassium feldspars while calculating a clay content. In the Biesiekierz-1 and -2 boreholes, the highest values recorded on gamma logs correspond to the presence of arkosic sandstones in a geological profile.

Author Contributions

S.K. was responsible for conceptualization, funding acquisition, project administration, methodology, investigation, formal analysis, writing—original draft preparation, reviewing, and editing, B.K. for conceptualization, software, formal analysis, writing—original draft preparation, reviewing, and editing, R.S. for methodology, investigation, and K.W. for conceptualization, funding acquisition, writing—reviewing. All authors have read and agreed to the published version of the manuscript.

Funding

The research was carried out within a project funded by PGNiG—Polish Oil and Gas Company.

Acknowledgments

The authors of the paper express their gratitude to PGNiG—Polish Oil and Gas Company for the possibility of publishing the results of the above mentioned research.

Conflicts of Interest

The authors declare no conflict of interest.

References

  1. Rider, M. The Geological Interpretation of Well Logs, 2nd ed.; Whittles Publishing: Dunbeath Mill, UK, 2000; ISBN 10:1870325362. [Google Scholar]
  2. Elis, D.V.; Singer, J.M. Well Logging for Earth Scientists, 2nd ed.; Springer: Dordrecht, The Netherlands, 2008; ISBN 978-1-4020-3738-2. [Google Scholar]
  3. Herron, M.M.; Herron, S.L. Geological application of geochemical well logging. In Geological Applications of Wireline Logs; Hurst, A., Lovell, M.A., Morton, A.C., Eds.; Geological Society of London Special Publication: London, UK, 1990; Volume 48, pp. 165–175. ISBN 10:0903317966. [Google Scholar]
  4. Lofts, J.; Harvey, P.; Lovell, M. Reservoir characterization from downhole mineralogy. Mar. Pet. Geol. 1995, 12, 233–246. [Google Scholar] [CrossRef]
  5. Herron, M.M. Mineralogy from geochemical well logging. Clays Clay Miner. 1986, 34, 204–213. [Google Scholar] [CrossRef]
  6. Anderson, R.N.; Dove, R.E.; Broglia, C.; Silver, L.T.; James, E.W.; Chappell, B.W. Elemental and mineralogical analyses using geochemical logs from the Cajon Pass Scientific Drillhole, California, and their preliminary comparison with core analyses. Geophys. Res. Lett. 1988, 15, 969–972. [Google Scholar] [CrossRef] [Green Version]
  7. Colson, J.L.; Grau, J.A.; Herron, M.M.; Herron, S.L.; Schweitzer, J.S.; Hertzog, R.C.; Johnston, J. Applications Using Geochemical Logs. In Proceedings of the Middle East Oil Show (Society of Petroleum Engineers), Manama, Bahrain, 11–14 March 1989. [Google Scholar]
  8. Hertzog, R.; Colson, L.; Seeman, B.; O’Brien, M.; Scott, H.; McKeon, D.; Herron, M.; Grau, J.; Ellis, D.; Schweitzer, J. Geochemical logging with spectrometry tools. SPE Form. Eval. 1989, 4, 153–162. [Google Scholar] [CrossRef]
  9. Yarbrough, L.D.; Carr, R.; Lentz, N. X-ray fluorescence analysis of the Bakken and Three Forks Formations and logging applications. J. Pet. Sci. Eng. 2019, 172, 764–775. [Google Scholar] [CrossRef]
  10. Lemière, B. A review of pXRF (field portable X-ray fluorescence) applications for applied geochemistry. J. Geochem. Explor. 2018. [Google Scholar] [CrossRef] [Green Version]
  11. Smith, C.N.; Malicse, A. Chemostratigraphic studies of the Marcellus Shale by handheld X-ray fluorescence (HHXRF) analysis. In Proceedings of the AAPG Annual Conference, Houston, TX, USA, 10–13 April 2011. [Google Scholar]
  12. Rowe, H.; Hughes, N.; Robinson, N. The quantification and application of handheld energy-dispersive X-ray fluorescence (ED-XRF) in mudrock chemostratigraphy and geochemistry. Chem. Geol. 2012, 324, 122–131. [Google Scholar] [CrossRef]
  13. Spencer, R.; Weedmark, T. Application of X-Ray fluorescence (XRF) analyses to the characterization of tight reservoirs. Conference Paper. In Proceedings of the GasMexico Congress and Exhibition, Villahermosa, Mexico, 29–30 September 2015. [Google Scholar]
  14. Eberl, D. User’s Guide to RockJock–A Program for Determining Quantitative Mineralogy from Powder X-ray Diffraction Data; Open–File Report 03-78; U.S. Geological Survey: Boulder, Colorado, 2003.
  15. Środoń, J.; Drits, V.A.; McCarty, D.K.; Hsieh, J.C.C.; Eberl, D.D. Quantitative X-ray diffraction analysis of clay-bearing rocks from random preparations. Clays Clay Miner. 2001, 49, 514–528. [Google Scholar] [CrossRef]
  16. Chipera, S.J.; Bish, D.L. Fitting Full X-Ray diffraction patterns for quantitative analysis: A method for readily quantifying crystalline and disordered phases. Adv. Mater. Phys. Chem. 2013, 3, 47–53. [Google Scholar] [CrossRef] [Green Version]
  17. Rietveld, H.M. A profile refinement method for nuclear and magnetic structures. J. Appl. Crystallogr. 1969, 2, 65–71. [Google Scholar] [CrossRef]
  18. Taut, T.; Kleeberg, R.; Bergmann, J. The new Seifert Rietveld program BGMN and its application to quantitative phase analysis. Mater. Struct. 1998, 5, 57–64. [Google Scholar]
  19. Taylor, C.J.; Hińczak, I. Rietveld Made Easy: A Practical Guide to the Understanding of the Method and Successful Phase Quantifications; Sietronics Pty Limited: Mitchell, Australia, 2006. [Google Scholar]
  20. Skupio, R. The use of portable XRF spectrometer for measuring the chemical composition of rocks. Nafta-Gaz 2014, 11, 771–777. (In Polish) [Google Scholar]
  21. Kowalska, S. Quantitative analysis of the mineral composition of rocks containing clay minerals by Rietveld method. Nafta I Gaz 2013, 12, 887–893. (In Polish) [Google Scholar]
  22. Omotoso, O.; McCarty, D.K.; Kleeberg, R.; Hillier, S. Some successful approaches to quantitative mineral analysis as revealed by the 3rd Reynolds cup contest. Clays Clay Miner. 2006, 54, 748–760. [Google Scholar] [CrossRef]
  23. Żelaźniewicz, A.; Aleksandrowski, P.; Buła, Z.; Karnkowski, P.; Konon, A.; Oszczypko, N.; Ślączka, A.; Żaba, J.; Żytko, K. Regionalizacja Tektoniczna Polski; Komitet Nauk Geologicznych PAN: Wrocław, Poland, 2011; p. 60. ISBN 978-83-63377-01-4. [Google Scholar]
  24. Zagórska, U.; Kowalska, S.; Sláma, J.; Dziubińska, B.; Wolański, K. Detrital zircon provenance of Carboniferous sandstones of the Variscan Externides (SW Poland)–record of the eastern Variscides exhumation. Int. J. Earth Sci. 2020, 109, 2169–2187. [Google Scholar] [CrossRef]
Figure 1. Comparison of a chemical composition variability profile obtained with the use of a GEM probe with the one developed based on measurements taken with a portable pXRF spectrometer in a clay profile.
Minerals 10 01101 g001
Figure 2. Correlation of chemical analysis results from ACTLABS laboratory (ICP-OES method) with certified values (the NIST standards).
Minerals 10 01101 g002
Figure 3. Correlation of chemical analysis results obtained with the use of a portable pXRF spectrometer with certified values of the NIST standards.
Minerals 10 01101 g003
Figure 4. Location of boreholes selected for research against the map of Carboniferous rock range (after Żelaźniewicz et al. [23]).
Minerals 10 01101 g004
Figure 5. Correlation of results regarding measurements taken on powder samples and directly on cores for fine-grained rocks (the Silurian, the W-1 borehole). It is an illustration of the impact of the grain size on the pXRF measurement results.
Minerals 10 01101 g005
Figure 6. Correlation of chemical composition analysis results obtained in the INIG-PIB on solid and ground samples for the Kobylin-1 borehole.
Minerals 10 01101 g006
Figure 7. Correlation of chemical composition analysis results obtained in the INIG-PIB on solid and ground samples for the Biesiekierz-2 borehole.
Minerals 10 01101 g007
Figure 8. Exemplary XRD patterns for samples from the Kobylin-1 borehole. An example of a typical quartzite (upper) and clay-rich (lower) sample. Explanations: Q—quartz; F—feldspars; Pl—plagioclase; F-K—potassium feldspars; An—ankerite; M—micas and illite group clay minerals; Ch—chlorite; Σcl—sum of clay minerals; Zn—zincite (standard).
Minerals 10 01101 g008
Figure 9. A model combining the contents of different mineral components with the contents of particular elements (pXRF) for Carboniferous rocks from the Kobylin-1 borehole. Explanations: Fe—minerals: —chlorite, pyrite, hematite and siderite (Sy); A—anhydrite.
Minerals 10 01101 g009
Figure 10. Exemplary diffraction patterns for samples from the Biesiekierz-2 borehole. An example of a typical carbonate (upper) and arkosic sandstone (lower) sample. Explanations: Q—quartz; F—feldspars; Pl—plagioclase; F-K—potassium feldspars; C—calcite; D—dolomite; An—ankerite; Gy—gypsum; M—micas and illite group clay minerals; Kl—kaolinite; Σcl—sum of clay minerals, Zn—zincite (standard).
Minerals 10 01101 g010
Figure 11. A model combining the contents of different mineral components with the contents of particular elements (pXRF) for Carboniferous rocks from the Biesiekierz-2 borehole. Explanations: S—minerals—pyrite, marcasite, anhydrite and gypsum.
Minerals 10 01101 g011
Figure 12. Table of results regarding XRF measurements taken on core samples and drill cuttings in the Kobylin-1 borehole. The darker colour marks cored intervals.
Minerals 10 01101 g012
Figure 13. Table of results regarding XRF measurements taken on core samples in the Biesiekierz-2 borehole.
Minerals 10 01101 g013
Figure 14. The result of lithological profile reconstruction based on chemical composition measurements taken on core samples and drill cuttings in the Kobylin-1 borehole with XRD mineral composition measurements.
Minerals 10 01101 g014
Figure 15. Juxtaposition of results of lithological profile reconstruction carried out in the Biesiekierz-2 borehole with XRD mineral composition measurements.
Minerals 10 01101 g015
Figure 16. Juxtaposition of results regarding lithological profile reconstruction carried out in the Kobylin-1 borehole with a lithological profile interpretation based on GEM probe measurements.
Minerals 10 01101 g016
Figure 17. Correlative juxtaposition of the Biesiekierz-2 and Biesiekierz-1 boreholes. Intervals/levels considered correlative are marked with horizontal dotted lines on the graph.
Minerals 10 01101 g017
Figure 18. Comparison of lithological profile reconstruction results with a standard interpretation of geophysical logging for the Biesiekierz-2 borehole.
Minerals 10 01101 g018
Table 1. List of minerals occurring in sedimentary basins most frequently analysed for the purpose of hydrocarbon exploration in Poland. For minerals marked red, the oxide form of record cannot be applied.
MineralsChemical FormulaOxide Form
QuartzSiO2SiO2
CristobaliteSiO2SiO2
OpalSiO2·n(H2O)SiO2 + nH2O
Feldspars
OrthoclaseKAlSi3O81/2K2O + 1/2Al2O3 + 3SiO2
AlbiteNaAlSi3O81/2Na2O + 1/2Al2O3 + 3SiO2
AnorthiteCaAl2Si2O8CaO + Al2O3 + 2SiO2
Carbonates
CalciteCaCO3CaO + CO2
AragoniteCaCO3CaO + CO2
DolomiteCaMg(CO3)2CaO + MgO + 2CO2
SideriteFe(CO3)2FeO + 2CO2
AnkeriteCa(Fe, Mg, Mn) (CO3)2CaO + (Fe, Mg, Mn)O + 2CO2
MagnesiteMgCO3MgO + CO2
Sulphate
AnhydriteCaSO4CaO + SO3
GipsumCaSO4·2H2OCaO + SO3 + 2H2O
BariteBaSO4BaO + SO3
CelestineSrSO4SrO + SO3
Sulfide
PyriteFeS2Fe + 2S
MarcasiteFeS2Fe + 2S
GalenaPbSPb + S
SphaleriteZnSZn + S
Oxides
HematiteFe2O3Fe2O3
GoethiteFeO(OH)1/2Fe2O3 + 1/2H2O
RutileTiO2TiO2
AnataseTiO2TiO2
Chlorides/Fluorides
HaliteNaClNa + Cl
SylviteKClK + Cl
FluoriteCaF2Ca + 2F
ClaysApproximate chemical formula
KaoliniteAl4(Si4O10)(OH)8
MuscoviteKAl2Si3AlO10(OH,F)2
Illite(K, Na, NH4)0.90 (Al1.85Fe3+0.05Mg0.10) (Si3.20Al0.80) O10(OH)2
MontmorilloniteR+0.33 (Al1.67Mg0.33) Si4 O10(OH)2, where R - exchangeable cations
Fe-Chlorite(Fe++,Mg,Fe+++)5Al(Si3Al)O10(OH,O)8
Publisher’s Note: MDPI stays neutral with regard to jurisdictional claims in published maps and institutional affiliations.

