1. Introduction
In order to make urban areas more resilient to the effects of climate change, it is necessary to safeguard the presence of urban green areas and plan adaptation actions for future climate scenarios, such as, for example, applying green strategies to facilitate energy efficiency in metropolitan areas [
1]. The need to transform urban systems into areas more resilient to phenomena generated by climate change makes a detailed study of the characteristics of urban green areas, relationships with buildings and relationships with the social fabric a crucial activity for the planner. In fact, as highlighted in [
2], based on results of studies executed in different cities, urban green spaces play a primary role in the sustainable development of a city.
In recent research, Geographical Information System (GIS)-based approaches have been implemented to analyze the characteristics of urban green spaces in sustainable urban planning. In [
3], a hierarchical GIS-based method applied to study the accessibility of urban green spaces is proposed. A GIS-based study of the characteristics of urban green areas in a city, such as the green areas per capita and the distribution of the distance and accessibility of green areas throughout the city, is performed in [
4]; this study is applied to the Turkish city of Kütahya. A GIS framework is proposed in [
5] to classify the urban green space (UGS), by considering the various typologies of green spaces and the distribution of recreational UGS; the authors apply their model to the study area of Nagpur City, India. A multicriteria analysis model implemented in a GIS platform is proposed in [
6] in order to detect suitable sites for urban green spaces; this method was applied to the city of Addis Ababa, Ethiopia.
In this research we present a GIS-based integrated application framework to support the decision makers in the study of the characteristics of UGSs and their relation with the city.
The main objective of this research was the experimentation of a GIS framework based on the partitioning model of a study area in urban contexts proposed in [
7], implemented to perform an unsupervised partitioning in the UGSs of an urban system. The proposed GIS-based framework allows optimization of the use of the expert’s knowledge to classify the different UGSs in the urban study area.
We partition the urban system in homogeneous urban areas in terms of types of UGS and relationships between the presence of urban green areas, social characteristics and the built environment. In fact, unlike other works in the literature, this research is focused on the problem of analyzing not only the characteristics of urban green areas but also the set of relationships within the entire urban context. The idea of the proposed framework is to partition the city into homogeneous areas with respect not only to the characteristics of urban greenery, but also to those of the built and social fabric, in order to offer the planner a tool that allows him to identify which areas of the urban system require prioritization of green adaptive interventions, and to be able to allocate the categories of intervention based on the characteristics of the urban fabric in these areas.
The main advantages of the proposed framework are the use of an unsupervised approach to partition the study area in UGSs and a high degree of usability and flexibility, as the expert can reconstruct or update the core set of indicators and the fuzzy rule set. In addition, the framework is independent from the choice of the core set of indicators and the classification of UGC types; in fact, this choice is made by the domain expert who can use the framework to autonomously build the core set of indicators, the classification of UGSs and the fuzzy rule set, based on their experience and knowledge.
We have tested our framework on an urban area constituted by the municipality of Pozzuoli, Italy. For the identification of all the indicators that comprehensively characterize the study area in terms of relationships between urban greenery, built heritage and the social fabric, and for the construction of the rules necessary for the classification of urban areas, the support of a pool of urban planning experts was used. Following the approach applied in [
7], initially we partition the study area into homogeneous zones provided by census atomic elements called microzones, defined as homogeneous areas of the urban system representing the smallest areas in which census data were collected on the resident population, on the type and number of buildings and properties, on the presence of industrial fabrics and services, etc.
Based on the values of the core set of indicators and considering a fuzzy rule set built by domain experts, each microzone is classified into a specific urban green area class (UGA class); to perform this classification we implement a fuzzy rule-based system in the GIS platform.
Generally, Mamdani [
8,
9] or Tagaki–Sugeno [
10,
11] models are applied in the deductive inference processes of a fuzzy rule-based system. Unlike the Mamdani model, in which each rule has a fuzzy output variable, in the Tagaki–Sugeno model it is a crisp variable.
GIS-based fuzzy rule systems are proposed in the literature in which the Mamdani model [
7,
12,
13], the Tagaki–Sugeno model [
14,
15] and a hybrid model [
16] are applied. In this research we use the Mamdani fuzzy rule-based model proposed in [
7], in which a center of gravity (CoG) method [
17] is used in the defuzzification process.
After classifying all microzones we use the spatial dissolve operator to aggregate adjoint microzones belonging to the same UGA class, to detect the urban green contexts (UGCs) corresponding to regions of the study area that are homogeneous with respect to the characteristics of the urban greenery and its relations with the buildings and social fabric.
The output of our framework is the production of a UGC map in which a thematic map of the UGC detected in the study area is generated. In addition, to evaluate the reliability of the UGC map, based on the concept of fuzzy reliability of the partitioning of a geographic area introduced in [
18] and following the process applied for evaluating the reliability of the urban context map proposed in [
7], we generate a reliability map in which the reliability of a UGC is calculated as a weighted average of the membership degree of the output class of the microzones spatially included in the UGC.
To measure the accuracy of the UGC classification, we compare the results with the UGC map obtained in supervised mode by the domain expert.
In
Section 2 we introduce our GIS-based framework and in
Section 3 a detailed description of the processes implemented is performed. In
Section 4 the results obtained applying our framework to the sample study area of Pozzuoli are shown. Final considerations are presented in
Section 5.
2. The GIS-Based UGC Classification Framework
Our GIS-based framework is composed of four components. The output of the last component is the production of the UGC map in which a thematic map of the UGCs detected in the study area is generated.
The framework is schematized in
Figure 1.
The four components of our framework are summarized below.
2.1. Microzone Dataset Creation
The aim of this component is the creation of the spatial dataset of the microzones, in which are calculated the indicators needed to classify the microzones with respect to the presence of greenery and to its ratio with buildings, waterproof open spaces and social characteristics.
In a first step, the spatial data acquired by different institutional and open sources are reconciled and handled in a spatial database.
Subsequently, for each microzone the calculus of the set of indicators constructed by the expert is performed. Each indicator is a function of a set of physical quantities assigned to elements of the urban system. The values of these physical quantities are calculated and then aggregated to the microzone. For example, a quantity given by the number of residential buildings in square meters is calculated by counting the buildings located in the microzone and dividing the result by the area of the microzone. Likewise, the ratio between the area covered by buildings or covered infrastructures and the area of open spaces is calculated by summing the areas covered by buildings and the areas covered by open spaces in each microzone.
Finally, the microzone dataset is created. This dataset is a spatial dataset formed by polygons given by the microzones in which the study area is partitioned. The features of each polygon are given by the indicators calculated previously.
2.2. Fuzzy Rule Set Creation
The actor of this component is the human domain expert. He is an urban planner (or a pool of urban planners) with expertise in urban regeneration issues. Initially, he selects the set of indicators needed to classify a region of the study area; each indicator measures a specific feature that contributes to connote an area of the urban system in relation to the presence of urban green and the type of built and social fabric. The indicator is a function measurable quantity of elements of the urban system.
The classification process uses the knowledge and experience of the domain expert, which is implemented by building a fuzzy rule set. The expert identifies the types of urban areas (UGA class) with respect to the characteristics of urban greenery and its relationships with buildings and population. Then, he constructs the fuzzy rule set; the variables of the fuzzy rules are fuzzy sets generated by constructing fuzzy partitions of the domain of each indicator. The fuzzy rule sets are generated by the domain expert in a user-friendly fashion: they are constructed as triangular of semi-trapezoidal fuzzy numbers, where the output fuzzy variable appearing in the consequents of the fuzzy rules is a fuzzy set modeling a UGA class.
2.3. Mamdani Fuzzy Rule System Execution
This component starts after the completion of phases 1 and 2. A Mamdani fuzzy rule system is implemented, which uses the fuzzy rule set prepared by the domain expert. This fuzzy rule system is used to classify microzones.
For each microzone the values of the indicators are fuzzified and the membership degree for the fuzzy sets appearing in the antecedents of the fuzzy rules are assigned. Then, the fuzzy inference component is applied by using the Mamdani min and max triangular norms; the discrete CoG defuzzification method proposed in [
7] is applied in the defuzzification process to assign the microzone to a UGA class
2.4. Urban Context Partitioning
This component starts after the completion of phase 3. The aim of this phase is to partition the study area into UGCs in which each UGC is marked with the label of a specific UGA class. A UGC is constructed by dissolving adjoining microzones belonging to the same UGA class. Finally, the thematic map of the urban contexts and the related reliability map are constructed.
The reliability of the UGC is given by a weighted average of the membership degree to the urban green area class of the microzones enclosed in the UGC; the weight is given by the area of the microzone, e.g., the greater the area of the microzone, the greater its impact on the reliability index assigned to the UGC.
The microzone dataset and fuzzy rule set creation components can be started in parallel until the creation of the spatial database normalized on the study area and the construction, by the domain expert, of the core set of indicators that characterize urban green space and its relationships with the built and social fabric. After the construction of the core set of indicators, these are calculated for each microzone in order to obtain the dataset of indicators.
The Mamdani fuzzy rule system components start when the outputs of the two previous components given by the dataset indicators of the microzone and the fuzzy rule set are produced; this component classifies each microzone, assigning it to a UGA class.
The UGC’s partitioning phase starts after all microzones have been classified; it merges neighboring microzones belonging to the same class, creating a UGC. For each UGC a reliability measure is performed by calculating the weighted average of the membership degree of the microzones spatially included in the UGC.
3. The GIS-Based UGC Classification Processes: An Experimental Case
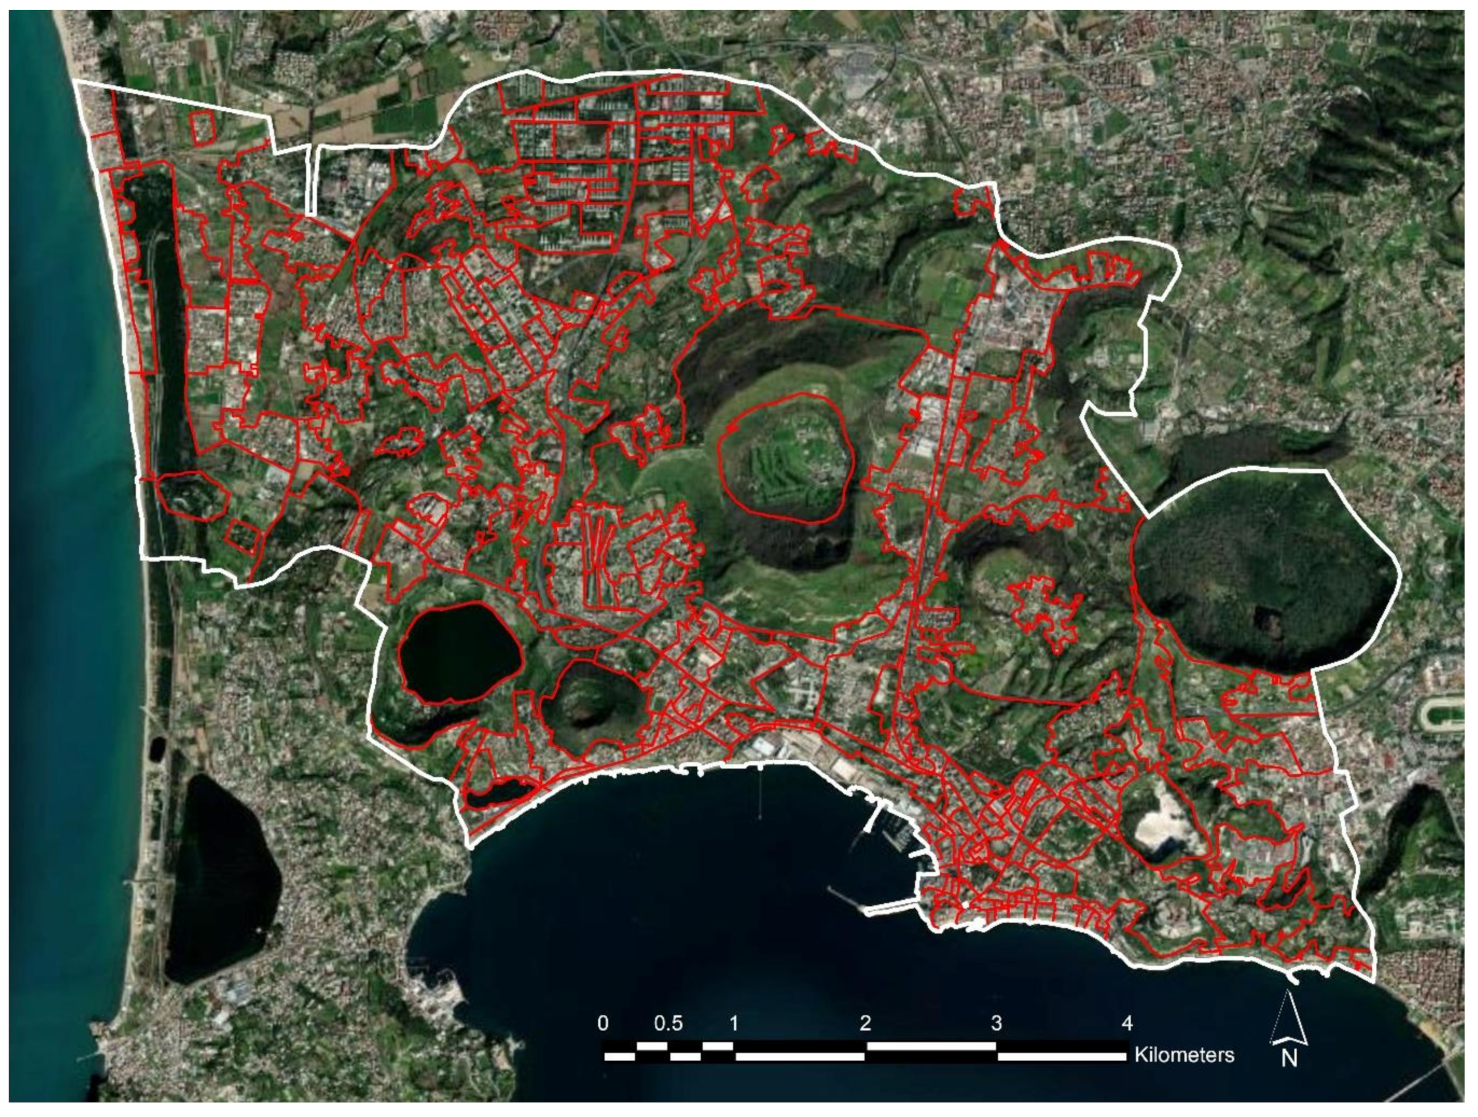
We have applied our framework to a study area in the municipality of Pozzuoli, Italy. The choice of this study area was motivated by the presence of different types of urban areas, such as industrial areas, modern residential areas, historic centers and tourist areas, and of diffuse types of urban green areas, such as urban and natural parks, wooded areas, tree-lined avenues, Mediterranean scrub areas, etc.
The study area is shown in
Figure 2; the municipality boundary is visible in white and the limits of the microzones are visible in red.
During the experimentation of our framework, the manager and officials of the municipality’s urban planning and land government department performed the functions of domain expert.
Below we describe all the processes implemented in applying the proposed framework.
3.1. Microzone Dataset Creation: Spatial Data Normalization
In order to create the normalized spatial database of the study area, we acquired different spatial datasets with different scales and coordinate systems.
The microzones into which the municipality was partitioned are given by the census tracts used by the Italian National Statistical Institute (ISTAT) as atomic census areas of structural and socio-economic indicators related to population, housing, industries and services.
The other geospatial datasets used to construct the spatial database of Pozzuoli were:
- −
the 2011 topographical database, on a 1:5000 scale, provided by the Campania Region;
- −
- −
- −
Municipal aerophotogrammetric spatial database on a 1:2000 scale;
- −
Other land use maps from the ISPRA institute.
All the datasets were normalized by georeferencing them in the UTM WGS84 zone 33 N projected coordinate system and extracting the data needed to analyze the structural and socioeconomic characteristics of the urban fabric. Data cleaning processes were applied to correct inconsistent data and delete redundancies, and geo-processing functions were used to aggregate all the data to any microzone.
3.2. Fuzzy Rule Set Creation: Indicator Settings
The domain expert identified those summary indicators necessary to characterize the types of UGC and constructed the set of empirical rules that make it possible to classify a microzone.
During this activity, seven synthetic indicators that allow categorizing of the microzone in relation to the urban greenery, the built and the resident population were selected by the domain experts.
In
Table 1 a description of the seven indicators is given.
The indicator I1 measures the ratio between the area covered by buildings and the number of inhabitants in the microzone; the indicator I2 provides information on the coverage of buildings with respect to the extension of the microzone. I3 measures the green area in square meters per capita; I4 measures the green area per capita considering only the disadvantaged residents. I5 measures in square meters the ratio between the green area and the number of households. The indicator I6 provides information on the coverage of green areas with respect to the extension of the microzone and the indicator I7 measures the percentage of the surface of the microzone covered by impermeable soils.
3.3. Microzone Dataset Creation—Calculus of Indicators by Microzone
After the domain expert had completed the construction of the core set of the indicators, a set of functions was implemented in the GIS environment to calculate the values of these indicators in each microzone.
To calculate the I1 indicator, the extension of the whole built area in the microzone was taken into consideration; this was related to the number of residents in the microzone. The extension of all the buildings in the microzone was taken into consideration; these data were obtained by calculating the area of all buildings of the built feature class extracted from the topographical database, on a 1:5000 scale, and from the municipal aero-photogrammetric dataset on a 1:2000 scale. The number of residents in the microzone was extracted from the socio-economic population ISTAT dataset.
The calculation of the I2 indicator was performed by comparing the extension of the built to the extension of the entire microzone.
To calculate the I3 indicator, the extension of urban green areas within the microzone was taken into account, and then related to the number of residents. The urban green areas extracted from the topographical database and the Corinne land cover soil use dataset; the extension of urban green areas within the microzone was obtained by using spatial intersect operators.
The calculation of the I4 indicator was carried out by comparing the overall extension of the urban green areas in the microzone with the number of disadvantaged residents, considered as residents aged under 10 years or over 65 years. The number of residents in the census area in the age groups under 10 and over 65 were extracted from the socio-economic population ISTAT dataset.
The I5 indicator was calculated by comparing the extension in square meters of the urban green areas in the microzone in relation to the number of families residing in the microzone. The number of families residing in the microzone was extracted from the socio-economic population ISTAT dataset.
The I6 indicator was calculated by comparing the extension of the urban green areas with the extension of the microzone.
The I7 indicator was calculated taking into account the extension of impermeable soils (squares, road areas, sidewalks, etc.), compared to the area of the microzone. The impermeable soils were extracted by the topographical database, the OpenStreetMap transportation datasets, the Corine Land Cover soil use and municipal aero-photogrammetric dataset.
3.4. Fuzzy Rule Set Creation: Construction of the Fuzzy Rule Set
The seven indicators selected by the domain expert identify the input variables of the fuzzy rule set to be built.
In order to create the fuzzy rules, a fuzzy partition of the domain of each indicator is constructed by the domain expert using triangular, S-shape and Z-shape fuzzy numbers.
Figure 3 shows the fuzzy numbers used and their membership functions.
In
Table 2 the fuzzy sets created for each indicator are shown.
In order to extract the fuzzy rules, the expert defines the taxonomy of the UGA class. In our experiment, the following set of urban area classes is considered, in which each class characterizes a type of urban area characterized by the presence of urban green space with specific characteristics.
The domain expert defined five UGA classes and they are described in
Table 3.
To each UGA class is assigned a fuzzy set defined in the domain [0, 1]; the five fuzzy sets are shown in
Table 4.
Based on their knowledge, the expert extracts the set of fuzzy rules needed to classify the microzones. The fuzzy rules are written in the following form:
where I
1, I
2, I
n, are input variables in the rule corresponding to n indicators and Z is the output variable corresponding to a UGA class. The operator Δ
h (h = 1, …, n) is given by an AND or an OR connective. In this fuzzy rule I
hk is the label of a fuzzy set in the fuzzy partition of the indicator I
h and Z
k is the label of a fuzzy set in the fuzzy partition of the UGA class.
In our experimental case, a fuzzy rule set of 69 fuzzy rules was constructed by the expert. The fuzzy rules containing OR connectives were split in order to obtain a fuzzy rule set given by fuzzy rule sets with only AND connectives.
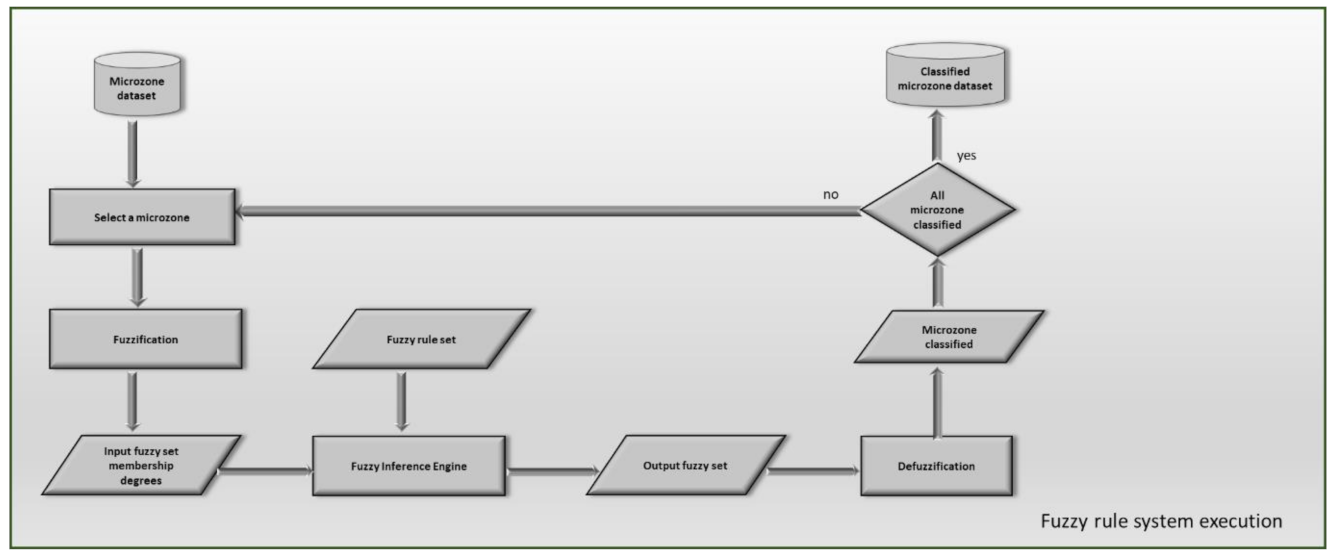
3.5. Mamdani Fuzzy Rule System Execution: Classification of the Microzone
In this phase, a classification process based on a Mamdani fuzzy rule-based system is applied to each microzone; the input of this phase is given by the microzone dataset in which for each microzone are stored the calculated values of the indicators.
The fuzzy rule system implemented to classify the microzones is schematized in
Figure 4.
For each microzone, the fuzzification component converts the crisp values of the indicators in the membership degree to the fuzzy sets used to handle the input variables in the antecedent of the fuzzy rules; the fuzzy inference engine component implements the inference and aggregation on fuzzy rules processes, creating the output fuzzy set. The defuzzification component applies the CoG method used in [
7] to defuzzify the output fuzzy set; this component classifies the microzone, assigning it to the UGA class corresponding to the output fuzzy set to which the membership degree in the center of gravity is highest.
The output of this process is the creation of the classified microzone dataset in which for each microzone is stored the label of the UGA class to which the microzone belongs and the membership degree to the correspondent fuzzy set.
3.6. UGC Partitioning: Construction of the UGC Map
In this phase, spatially adjoint microzones belonging to the same UGA class were aggregated using a spatial dissolve operator to form a UGC. Moreover, a measure of the reliability of the classification of the UGC, normalized in the range [0, 1], was obtained by computing a weighted average of the membership degrees to the fuzzy set of the UGA class to which the UGC belongs, for the microzones included in the UGC; the weight is given by the area of the microzone.
Formally, the reliability value
Uk of the
kth UGC is given by
where
ui is the membership degree to the fuzzy set of the UGA class and
Ai is the area of the
ith microzone included in the UGC.
Finally, the UGC map and the UGC reliability map were built.
4. Test Results
We implemented our framework and all the spatial analysis and geoprocessing functions on the GIS ESRI ArcGIS Desktop 10.8 suite; the fuzzy rule-based inference system, constructed in C ++ language, has been encapsulated in the GIS platform.
After executing the preprocessing phase, the value of the seven indicators were calculated by microzone.
In
Figure 5 is shown a thematic map of the indicator I
1, giving, in square meters, the built-up area by resident. The thematic map was obtained by setting five thematic classes and applying the thematic natural breaks classification method; this method is based on the Jenks thematic classification method [
19,
20], an optimization algorithm that finds the breaks of each class minimizing the variance within classes and maximizing the variance between classes.
Figure 5 shows that the indicator I
1 is particularly high in microzones consisting mainly of tourist areas with few residents, where the buildings consist mainly of villas that occupy a large surface area.
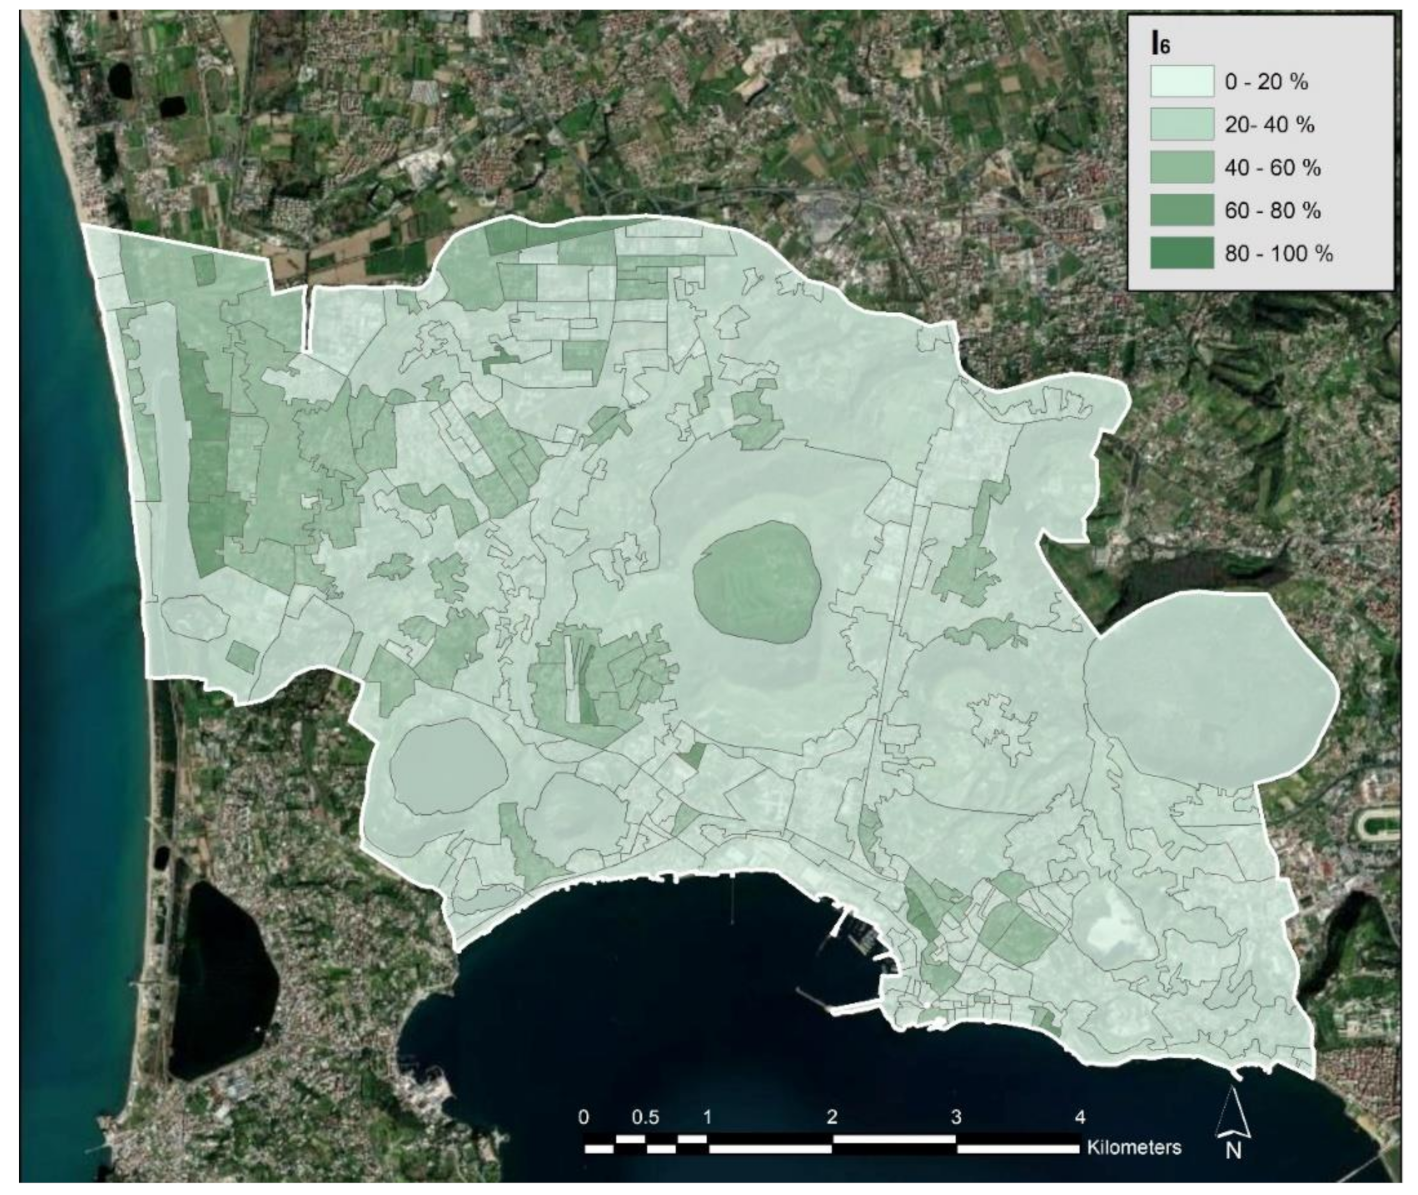
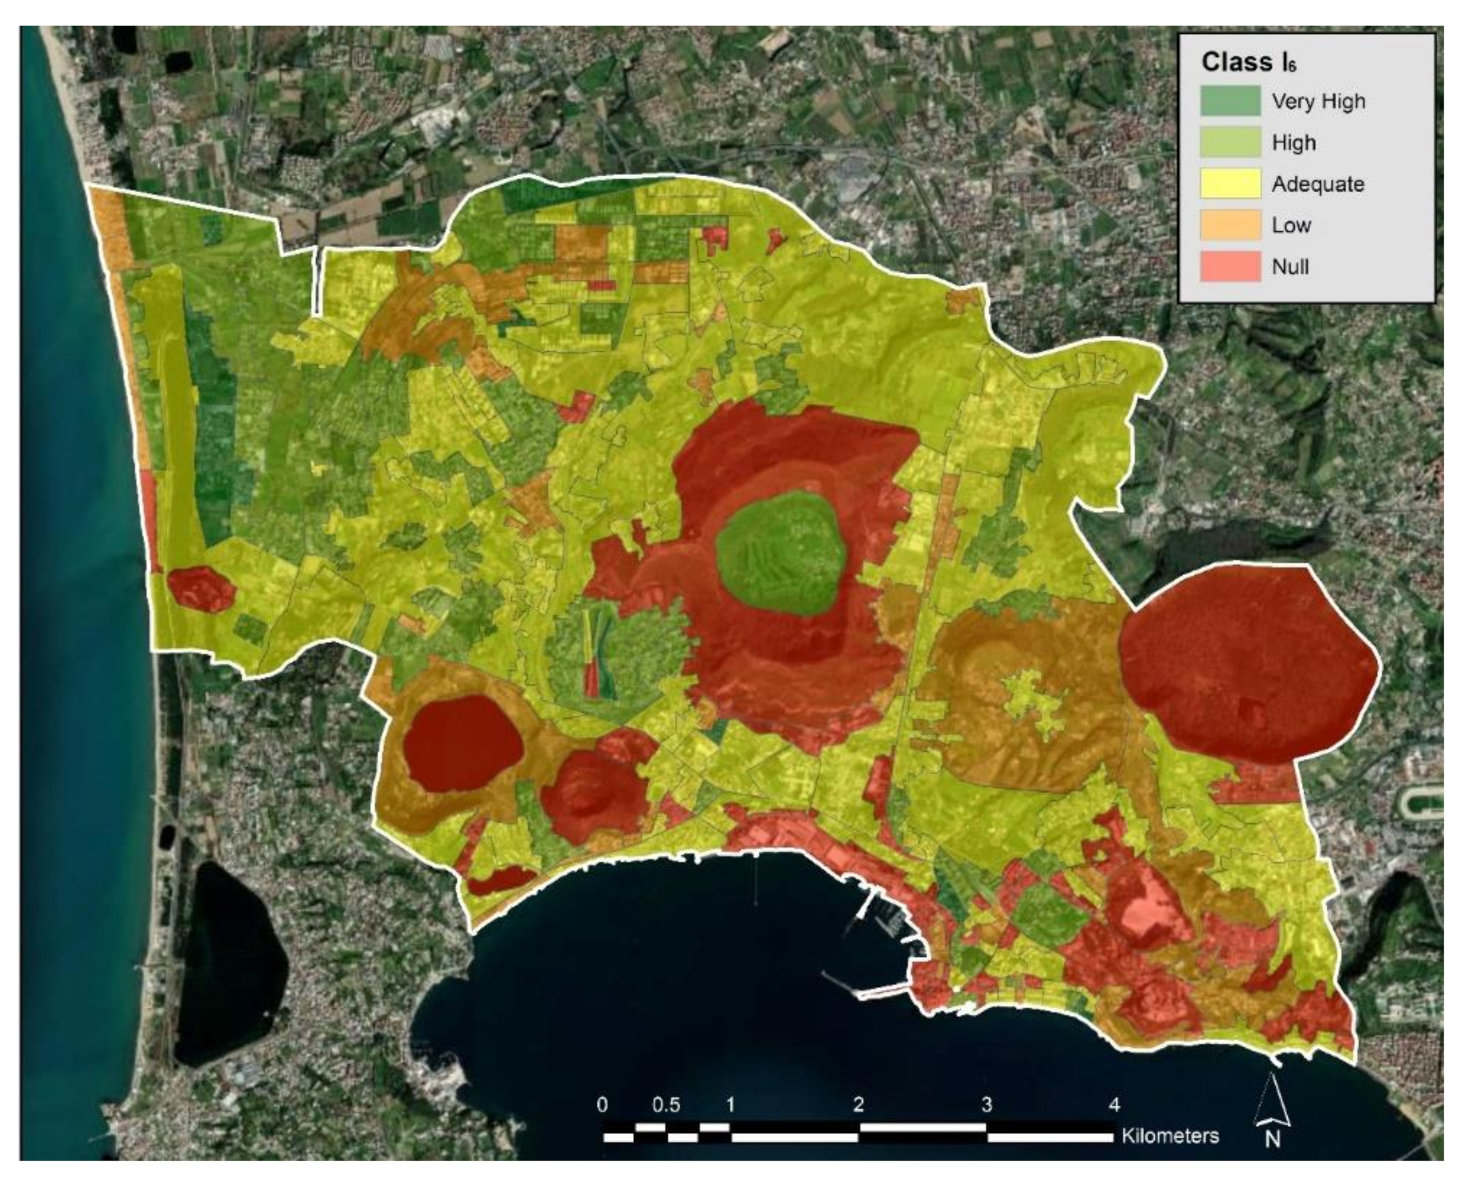
In
Figure 6 is shown a thematic map of the indicator I
6, giving, in percent, the ratio between the extension of the urban green regions in the microzone and the area of the microzone. The thematic map was obtained by setting five thematic classes and applying the equal interval thematic classification method; this method finds the breaks of each class so that the range of values in each class has the same amplitude. This indicator has a high value especially in microzones significantly covered by natural parks.
After the fuzzification process each indicator was fuzzified considering the fuzzy sets constructed by the expert shown in
Table 2.
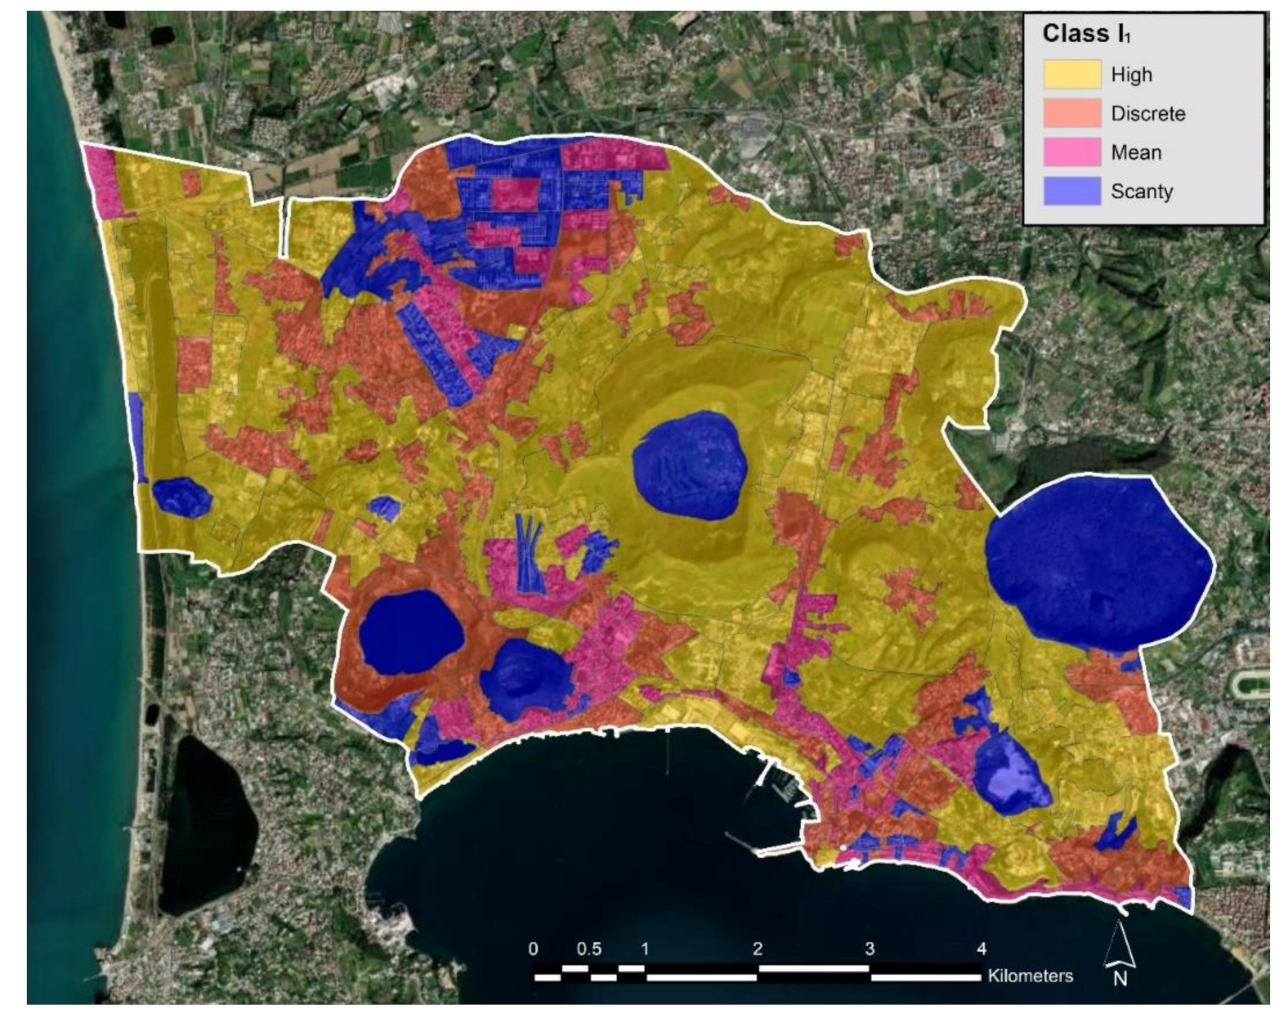
In
Figure 7 is shown the thematic map of the fuzzified indicator I
1, in which the name of the class is the label of the fuzzy set to which the microzone belongs with the highest membership degree. The microzones classified as High are tourist areas and densely populated areas.
Figure 8 shows the thematic map of the fuzzified indicator I
6. The microzones in which a significant part of the surface is covered by urban green areas are classified as Very High and High.
After executing the fuzzy rule-based system, the classification of the microzones by UGA class was performed. This result is shown in
Figure 9. The microzones covering tourist residential areas with a high presence of greenery and the microzones covering park areas are classified as class 5. The microzones that fall in the historical centers or in densely populated areas, and in which there are no public green areas, belong to class 2.
Finally, spatially adjoint microzones belonging to the same UGA class were dissolved to form a UGC. The final map of the UGCs is shown in
Figure 10.
The largest UGC, which covers over 60% of the municipal area, is classified as UGA class 4, i.e., an urbanized area with urban greenery. This result shows that in the municipality of Pozzuoli, on average, there is a high ratio between the urban green area and the population, which can facilitate the design of eco-sustainable transformations of the city. The UGCs classified as 1 (densely urbanized or industrial area with no urban greenery and high presence of built surfaces and waterproof open spaces) are densely populated areas with popular housing.
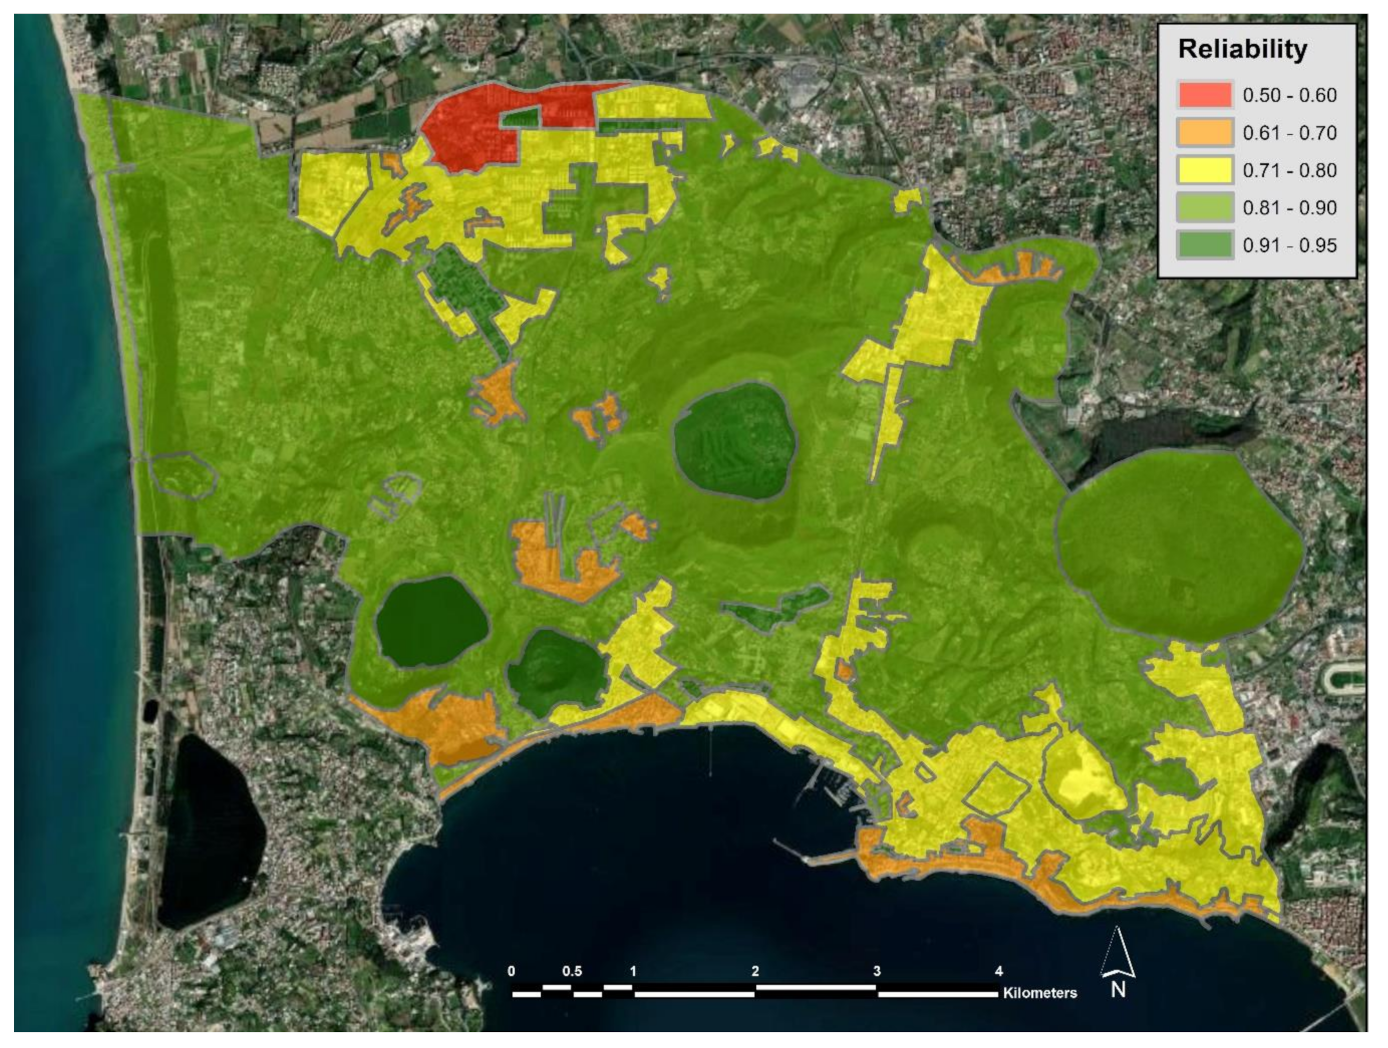
The thematic map in
Figure 11 shows the spatial distribution of the reliability. The reliability assigned to the UGCs varies in a range between 0.58 and 0.95. The UGCs with highest reliability values are UGCs classified in the UGA class 5, consisting of a single microzone.
To evaluate the accuracy of our method, we compared the partitioning in UGCs of the municipality of Pozzuoli obtained using our framework with the one produced by the expert in a supervised mode by directly applying his detailed knowledge of the study area.
To produce this partitioning the expert, instead of carrying out this activity starting from the partitioning of the study area in microzones, used local knowledge of the city in his possession, and produced the partitioning of the area of the municipality of Pozzuoli in UGCs on the basis of deductive processes from his experience. He classified each UGC using the labels of the UGA class created previously. We call the UGC constructed by the expert UGCE (UGC constructed by the Expert).
In
Figure 12 is shown the final thematic map of the UGCEs created by the expert.
In order to evaluate the performance of our method, for each green area class we measured the percentage of the area of UGCs belonging to this UGA class that is covered by UGCEs belonging to the same class. We obtained these results selecting the UGCs and the UGCEs belonging to this class, measuring the area of the intersecting regions between the UGCs and the UGCEs selected and dividing this area by the area of the UGCs selected.
In
Table 5 are shown the results obtained.
Table 5 shows that over 50% of the area of UGCs classified in any class is covered by UCGEs belonging to the same class. Only 52.50% of the area of the UGCs belonging to UGA class 1 are covered by UGCEs belonging to the same class. The remaining 47.50% of this area is largely covered by UCGs belonging to classes 2 and 3, that is, to urban or dense urban areas with a presence of urban greenery (not nothing but minimal); this result can be explained by the fact that, since these areas are not very extensive, the discrepancy is greater compared to the areas of the UGC belonging to this class detected on a more detailed scale by the expert.
The UGCs with a percentage greater than 80% covered by UGCEs belonging to the same class are the UGCs belonging to the urban area classes 2 and 4. This is because the UGCs belonging to class 2 are mainly well-located industrial areas and those belonging to class 4 mainly refer to a very extensive urbanized region with a high presence of urban greenery, correctly detected with the use of the framework.
To complete this comparative analysis, we measured the percentage of the area of UGCEs belonging to each UGA class that is classified in the same class using our framework. We calculated this measure selecting the UGCEs and the UGCs belonging to this class and dividing this area by the area of the UGCEs selected.
The results obtained are shown in
Table 6.
Table 6 shows that over 79% of the area of UGCEs classified in any class is covered by UCGs, except for UGA class 3 in which the percentage of area covered by UGCs of the same class is 54.62%; this result can be explained by the fact that the discrepancy is greater compared to the areas of the UGC belonging to this class detected on a more detailed scale by the expert. As a good part of 45.48% of the extension of UGCEs belonging to class 3 is covered by UGCs belonging to class 2, this result is probably due to the fact that those areas which, at a detailed scale, have been identified by the expert as dense urban regions with a minimal presence of urban greenery, are detected with the use of the proposed framework only as urban regions with a minimal presence of urban green.
In general, the discrepancies observed are mainly attributable to the detail scale of the data used. In fact, the microzone in the framework represents an atomic region that is uniquely classified, while the expert, in detail, can highlight different urban issues within a region covered by a microzone.
5. Final Considerations
Aim of this research was to build a GIS-based framework to assist the decision maker that allows, in unsupervised mode, partitioning of an urban area based on the presence and characteristics of urban greenery and in relation to the built and social fabric.
The framework provides the user with a tool that allows use of the expert’s knowledge to recognize and classify the different green areas of an urban system. It integrates a Mamdani fuzzy rule-based inference system which, with the aid of a core set of indicators and a set of fuzzy rules built by the expert, appropriately classifies the microzones, i.e., the atomic regions in the study area. After combining spatially adjacent microzones belonging to the same UGA class, the study area is partitioned into UGCs and, for each UGC, the reliability of the classification is also assessed.
Comparative tests were carried out by comparing the partitioning in UGCs of the study area created through the use of the framework with that performed by the expert, based on knowledge of the urban system and at a detailed scale.
The results show that over 50% of the UGC areas belonging to a UGA class are covered by UGCs built by the expert belonging to the same class.
One of the main features of the framework is its high usability and flexibility; the user can easily insert or update the core set of indicators and the fuzzy rule set; he can refine this knowledge base over time, increasing the reliability of the UGC thematic map.
In subsequent research we intend to significantly expand the experimentation carried out by applying our framework to many other urban areas, involving many other experts to carry out all the comparative tests. Furthermore, in this research we intend to analyze in detail the variation in the resulting thematic map and the increase of its reliability to refine the core set of indicators and the set of fuzzy rules.
In addition, in the future we intend to further deepen this research both by experimenting with the framework in other problems that require partitioning in specific regions of a study area and their classification, and by using massive spatial datasets at a scale of detail to refine the accuracy of partitioning.


