Article

GNSS-R-Based Snow Water Equivalent Estimation with Empirical Modeling and Enhanced SNR-Based Snow Depth Estimation

1
School of Environmental Science and Spatial Informatics, China University of Mining and Technology, Xuzhou 221000, China
2
School of Geodesy and Geomatics, Wuhan University, Wuhan 430079, China
3
Key Laboratory of Geospace Environment and Geodesy, Ministry of Education, Wuhan 430079, China
*
Author to whom correspondence should be addressed.
Remote Sens. 2020, 12(23), 3905; https://doi.org/10.3390/rs12233905
Submission received: 21 October 2020 / Revised: 20 November 2020 / Accepted: 24 November 2020 / Published: 28 November 2020

Abstract

:
Snow depth and snow water equivalent (SWE) are two parameters for measuring snowfall. By exploiting the Global Navigation Satellite System reflectometry (GNSS-R) technique and thousands of existing GNSS Continuous Operating Reference Stations (CORS) deployed in the cryosphere, it is possible to improve the temporal and spatial resolutions of the SWE measurement. In this paper, a fusion model for combining multi-satellite SNR (Signal to Noise Ratio) snow depth estimations is proposed, which uses peak spectral powers associated with each of the snow depth estimations. To simplify the estimation of SWE, the complete snowfall period over a winter season is split into snow accumulation, transition, and melting period in accordance with the variation characteristics of snow depth and SWE. By extensively using in situ snow depth and SWE observations recorded by snow telemetry network (SNOTEL) and regression analysis, three empirical models are developed to describe the relationship between snow depth and SWE for the three periods, respectively. Based on the snow depth fusion model and the SWE empirical models, an SWE estimation algorithm is proposed. Three data sets recorded in different environments are used to test the proposed method. The results demonstrate that there exists good agreement between the in situ SWE measurements and the SWE estimates produced by the proposed method; the root-mean-square error of SWE estimations is smaller than 6 cm when the SWE is up to 80 cm.

Graphical Abstract

1. Introduction

The snow water equivalent (SWE) describes the amount of liquid water in the snowpack, which is the depth of water if the snow cover over the ground becomes liquid. Because SWE is related to the runoff of rivers and variation of the groundwater level, it plays an important role in the policy-making for water resource management. However, it is impractical to monitor SWE with a high temporal and spatial resolution using traditional techniques, such as a manual sampling method or other measurement instruments (e.g., snow pillow), due to being labor-intensive, time-consuming or expensive [1]. Global Navigation Satellite System reflectometry (GNSS-R) makes use of the GNSS signals to remotely monitor the characteristics of the object surface which reflects the signals. This technique has been investigated for the measurement of a range of geophysical parameters, including ocean surface height and wind speed, soil moisture, vegetation, snow depth and SWE [2,3,4,5]. Thousands of GNSS CORS (Continuously Operating Reference Station) have been established over the world for the purpose of high precision positioning or earth plate movement monitoring, and lots of the GNSS stations are located in cold regions. By making use of the GNSS-R technique, these stations located in cold regions could also provide a cost-effective way for SWE monitoring.
The idea of using GNSS observations for SWE estimation was initially presented by Jacobson in 2010 [6]. Based on SNR observations of geodetic GNSS receivers and GNSS-R technique, Jacobson proposed a nonlinear least squares fitting algorithm to estimate the snow depth and snow density (and therefore the SWE). Although in situ SWE measurements were not available for comparison, the study presents the potential for estimating SWE with GNSS observations. Based on the algorithm, the first attempt to retrieve SWE of dry snow by GNSS-IR was performed in 2012 [7]. Because of the complex effect of snow components (e.g., ice particles, air and liquid water) on the GNSS reflected signals, the estimated SWE error is rather large, with the relative error being more than 60%. By making use of SNR observations by linear polarization GNSS antenna, Rodriguez-Alvarez et al. developed a theoretical model to describe the relation between the snow density and notch position of the SNR series [8]. GNSS-R-based snow density (and thus SWE) can be obtained based on the model and GNSS observations. However, only a small amount of in situ data collected at different areas were used to validate the correlation between GNSS-R-based snow density estimates and the in situ observations. Except for the GNSS-R technique, the GNSS refraction technique has also been used for SWE estimation, e.g., the GNSS carrier phase shift method and SNR attenuation method [9,10]. As the technique has to bury the GNSS antenna into the snowpack, it is not suited for many scenarios, such as the use of data collected by CORS receivers. Since the accuracy of GNSS-R-based snow depth estimation has been well proved [11,12,13,14,15], it is a convenient way to estimate SWE by making use of the GNSS-R snow depth estimates and an empirical model for converting the snow depth to SWE. McCreight et al. gave a good review on the snow density-based SWE modeling and developed a statistical model for converting daily snow depth observations to SWE, which is more suitable for SWE estimation from GNSS-R-based snow depth [16]. In the following studies, the model was used to estimate SWE at 18 GPS stations and the result shows a good accordance with the in situ result [5]. Those models require meteorological information on region, elevation, season or climatological variables. However, GNSS stations may not be equipped with weather instrumentation or the meteorological data may not be recorded at the stations, so that the existing models would not be applicable in many cases. For this reason, this paper focuses on establishing a weighted average method to improve the accuracy of SNR-based daily SD estimation and developing more common empirical models for converting the snow depth estimations to SWE estimations without involving any other season or climatological variables, significantly simplifying the SWE estimation.
The remainder of this paper is organized as follows. In the next section, SNR-based snow depth estimation is studied and the proposed data fusion method is described; about 500,000 measurements of snow depth and SWE recorded by snow telemetry (SNOTEL) network are used to develop the empirical model for converting the snow depth to SWE by using regression analysis; an SNR-based SWE estimation strategy is then proposed. In Section 3, data used for validating the proposed method are introduced, which were recorded in three different geographical regions. The validation results are presented in Section 4. Discussions on the proposed methods and results are provided in Section 5. Section 6 concludes this paper.

2. Methods

2.1. Fusion of Multi-Satellites Snow Depth Estimations

For GNSS receivers fixed on the ground with a zenith-looking antenna, the received GNSS signal is the interferometric signal, which consists of the direct GNSS signal and reflected GNSS signals. The strength of the received GNSS signals and noise level are recorded by the GNSS receiver as SNR observations. The direct component of the SNR observations can be modeled as a low-order polynomial in general and removed from SNR observations to obtain the multipath SNR observations (or detrended SNR observations), which can be written as [11]:
SNR m = A cos ( 2 π 2 H λ sin θ ) = A cos ( 2 π f sin θ )
where A is the amplitude of multipath SNR signal; H is GNSS antenna height when the ground is covered by snow; λ is the GNSS signal wavelength of interest; θ is the GNSS satellite elevation angle; and f is the main frequency (or spectral peak frequency) of SNR observation series. Note that Equation (1) only considers the specular reflection path for simplicity in the theoretical analysis. In fact, because of the influence of the reflecting surface roughness and variety of snow layers on the GNSS signal, the realistic reflection of GNSS signals is diffused and the GNSS antenna would capture signals reflected from many points. However, among all the captured reflected signals, the signal reflected at the specular point has the shortest propagation path and the signal energy captured by the antenna mostly comes from the signals reflected around the specular point. This is the reason why one may only consider the specular reflection path for simplicity in theoretical analysis.
The series of multipath SNR observations is a quasi-sinusoidal signal periodically oscillating with respect to the sine of the elevation angle [13]. If the sine of the elevation angle is taken as the independent variable, the main frequency of the series f has a relationship with the antenna height (H) relative to the snow-covered ground surface as:
H = λ f 2
If the antenna height in the snow-free case H0 is known in advance, the snow depth h can be estimated by:
h = H 0 H
Clearly, the precision of SNR-based snow depth estimations depends on the precision of the SNR series main frequency estimation, which is obtained by spectral analysis suited for unevenly sampled data such as Lomb-Scargle spectral analysis. The unmodeled multipath interference and receiver noise would contaminate the multipath SNR observation series, and produce the bias in the peak frequency of the series, degrading the snow depth estimation accuracy [17]. The antenna height estimation obtained by Equation (2) is based on the assumption that there is only one layer of snow reflecting the GNSS signal. In reality, there may be several snow layers reflecting the signals. GNSS signals reflected from the inner layers would interfere with the signals reflected over the top layer, resulting in an overestimation of antenna height and thus underestimation of snow depth [13]. Correction of the bias would improve the accuracy of the snow depth estimation; however, it is non-trivial to model and remove the bias. Nevertheless, it is useful to develop a technique to model and remove the bias in the future.
Figure 1 shows an example of simulated multipath SNR series of GPS L1 signals and the results of the Lomb-Scargle spectral analysis. The antenna height is set at 2.5 m, and the surface is flat; the radiation pattern of GNSS antenna TRM55971.00 and a typical complex dielectric constant of dry snow (2-0.0005j) are used for the calculation of the amplitudes of the SNR series [14]. For convenience, three Gaussian noise components are respectively added to the noise-free SNR series to produce three noise-corrupted series with different noise levels. The three SNR values (denoted by S/N) of those three simulated multipath SNR series are 15 dB, 10 dB and 5 dB, respectively. It can be observed that the presence of noise results in variation in the peak frequencies; stronger noise causes a larger peak frequency shift. The peak frequency error is about 0.4 when the S/N of the simulated multipath SNR series is 5 dB. The peak frequency error would lead to a bias of about 4 cm in snow depth estimation for GPS L1 signals. Thus, a quantitative indicator of the noise level is useful, as the noise level indicates the precision of the peak frequency estimation, and hence, the snow depth estimation precision. It can also be seen from Figure 1 that the peak of the power spectral density (PSD) is inversely proportional to the noise level. This implies that the peak of the PSD obtained by the spectral analysis on the multipath SNR series could be used as an indicator of the precision of the peak frequency estimation.
To evaluate the impact of noise, 20 different Gaussian noise levels are selected, corresponding to the S/N from 1 dB to 20 dB with an interval of 1 dB. For a given noise level, 1000 noise sequences are generated, and each of them is added to the noise-free multipath SNR series to produce a noise-corrupted multipath SNR series. Then, the Lomb-Scargle spectrum analysis is applied to the SNR series to obtain the peak PSD and the corresponding peak frequency. Subtracting the peak frequency from the theoretical one in the noise-free case produces the noise-induced frequency error. Repeating the procedure for all other 999 noise-corrupted multipath SNR series under the same noise level, a sequence of 1000 peak frequency errors and 1000 peak PSD values are obtained. After repeating the procedure for all other 19 noise levels, 20,000 samples are obtained for the peak frequency error, corresponding to 20,000 samples of peak PSD.
All the peak PSD samples are arranged into bins centered at eight different peak PSD values (0.2, 0.25, 0.3, 0.35, 0.4, 0.45, 0.5 and 0.55), and the width of each bin is 0.05. Each of the central peak PSD values represents all the peak PSD samples within the bin. The root mean square (RMS) of the peak frequency error within each bin is calculated. Thus, a distribution of the RMS of the peak frequency error versus the peak PSD is obtained, as shown in Figure 2, where three different antenna heights are tested. Obviously, the RMS of the peak frequency error decreases with the increased peak PSD. The RMS of the peak frequency error is marginally different under different antenna heights. However, the variation pattern of the RMS of the peak frequency error versus the peak PSD is almost the same. Using the exponential fitting produces the exponential fitting functions as:
R M S E f = α e β p
where α and β are the fitting parameters and p is the peak PSD. The fitting curves under three different antenna heights are also shown in Figure 2. The correlation coefficients between the simulated and the fitted RMS of peak frequency error are 0.9903, 0.9907 and 0.9877 for three different antenna heights, respectively, indicating a valid fitting. In addition to the three antenna heights (2.0 m, 3.0 m and 4.0 m), six more antenna heights (1.0 m, 1.5 m, 2.5 m, 3.5 m, 4.5 m and 5 m) are also tested, producing nine groups of two fitting parameters (α and β) and one group of correlation coefficients (R), as shown in Table 1. It can be seen that all of the correlation coefficients between the simulated and fitted RMS of the peak frequency error are larger than 0.98. The fitting parameter α ranges from 1.9 to 2.2, while the fitting parameter β varies between −6 and −5. As those two fitting parameters are not sensitive to the antenna height, it is reasonable to take the average of each parameter series as the final value. Then, the exponential fitting function of Equation (4) can be rewritten as:
R M S E f = 2.06 e 5.57 p
Since the precision of SNR-based antenna height estimation and that of snow depth estimation are proportional to precision of spectral peak frequency estimation, the exponential function in Equation (5) can be used to weight snow depth estimations related to individual satellites. Thus, a fusion model is developed to combine multi-satellites snow depth estimations in a given period (e.g., a day) as:
h ¯ = 1 i = 1 n 1 R M S E f i i = 1 n 1 R M S E f i h i
where hi is SNR-based snow depth estimation for the i-th GNSS satellite. Substituting Equation (5) into Equation (6), the weighted average snow depth fusion model can be written as:
h ¯ = 1 i = 1 n e 5.57 p i i = 1 n e 5.57 p i h i
where pi is the peak PSD of multipath SNR observation series for the i-th GNSS satellite. Assume that the GNSS antenna height is 5.0 m when ground is snow-free and consider eight different snow depths ranging from 0.5 m to 4.0 m with an interval of 0.5 m. For each snow depth, five SNR series are produced with noise levels of 2 dB, 4 dB, 6 dB, 8 dB and 10 dB, respectively. Each noise-corrupted SNR series is used to generate a snow depth estimate. Then, the normal average method (NA) and weighted average (WA) method are used to determine the final snow depth estimate. Repeating the procedure 200 times, 200 normal average estimates and 200 weighted average estimates are produced for each antenna height. This simulation result shows that the RMS of the snow depth estimation error is 0.91 cm for the former and 1.37 cm for the latter. The relative snow depth estimation accuracy has improved considerably (about 34%) by using the weight average fusion model. Note that, although Equations (5) and (7) are obtained based on the simulation of GPS L1 band signals, simulation results, including GPS L2 and L5 and BDS B1, B2 and B3 band signals show that the difference of the fitting parameters in the weighted average snow depth fusion model is marginal for different GNSS band signals if the GNSS antenna gain pattern is not significantly different. In addition, the performance of the weighted average snow depth fusion model for BDS B1 and B2 and GPS L1 and L2 signals based on snow depth observations has also been evaluated in Section 4.1.

2.2. SWE Empirical Model

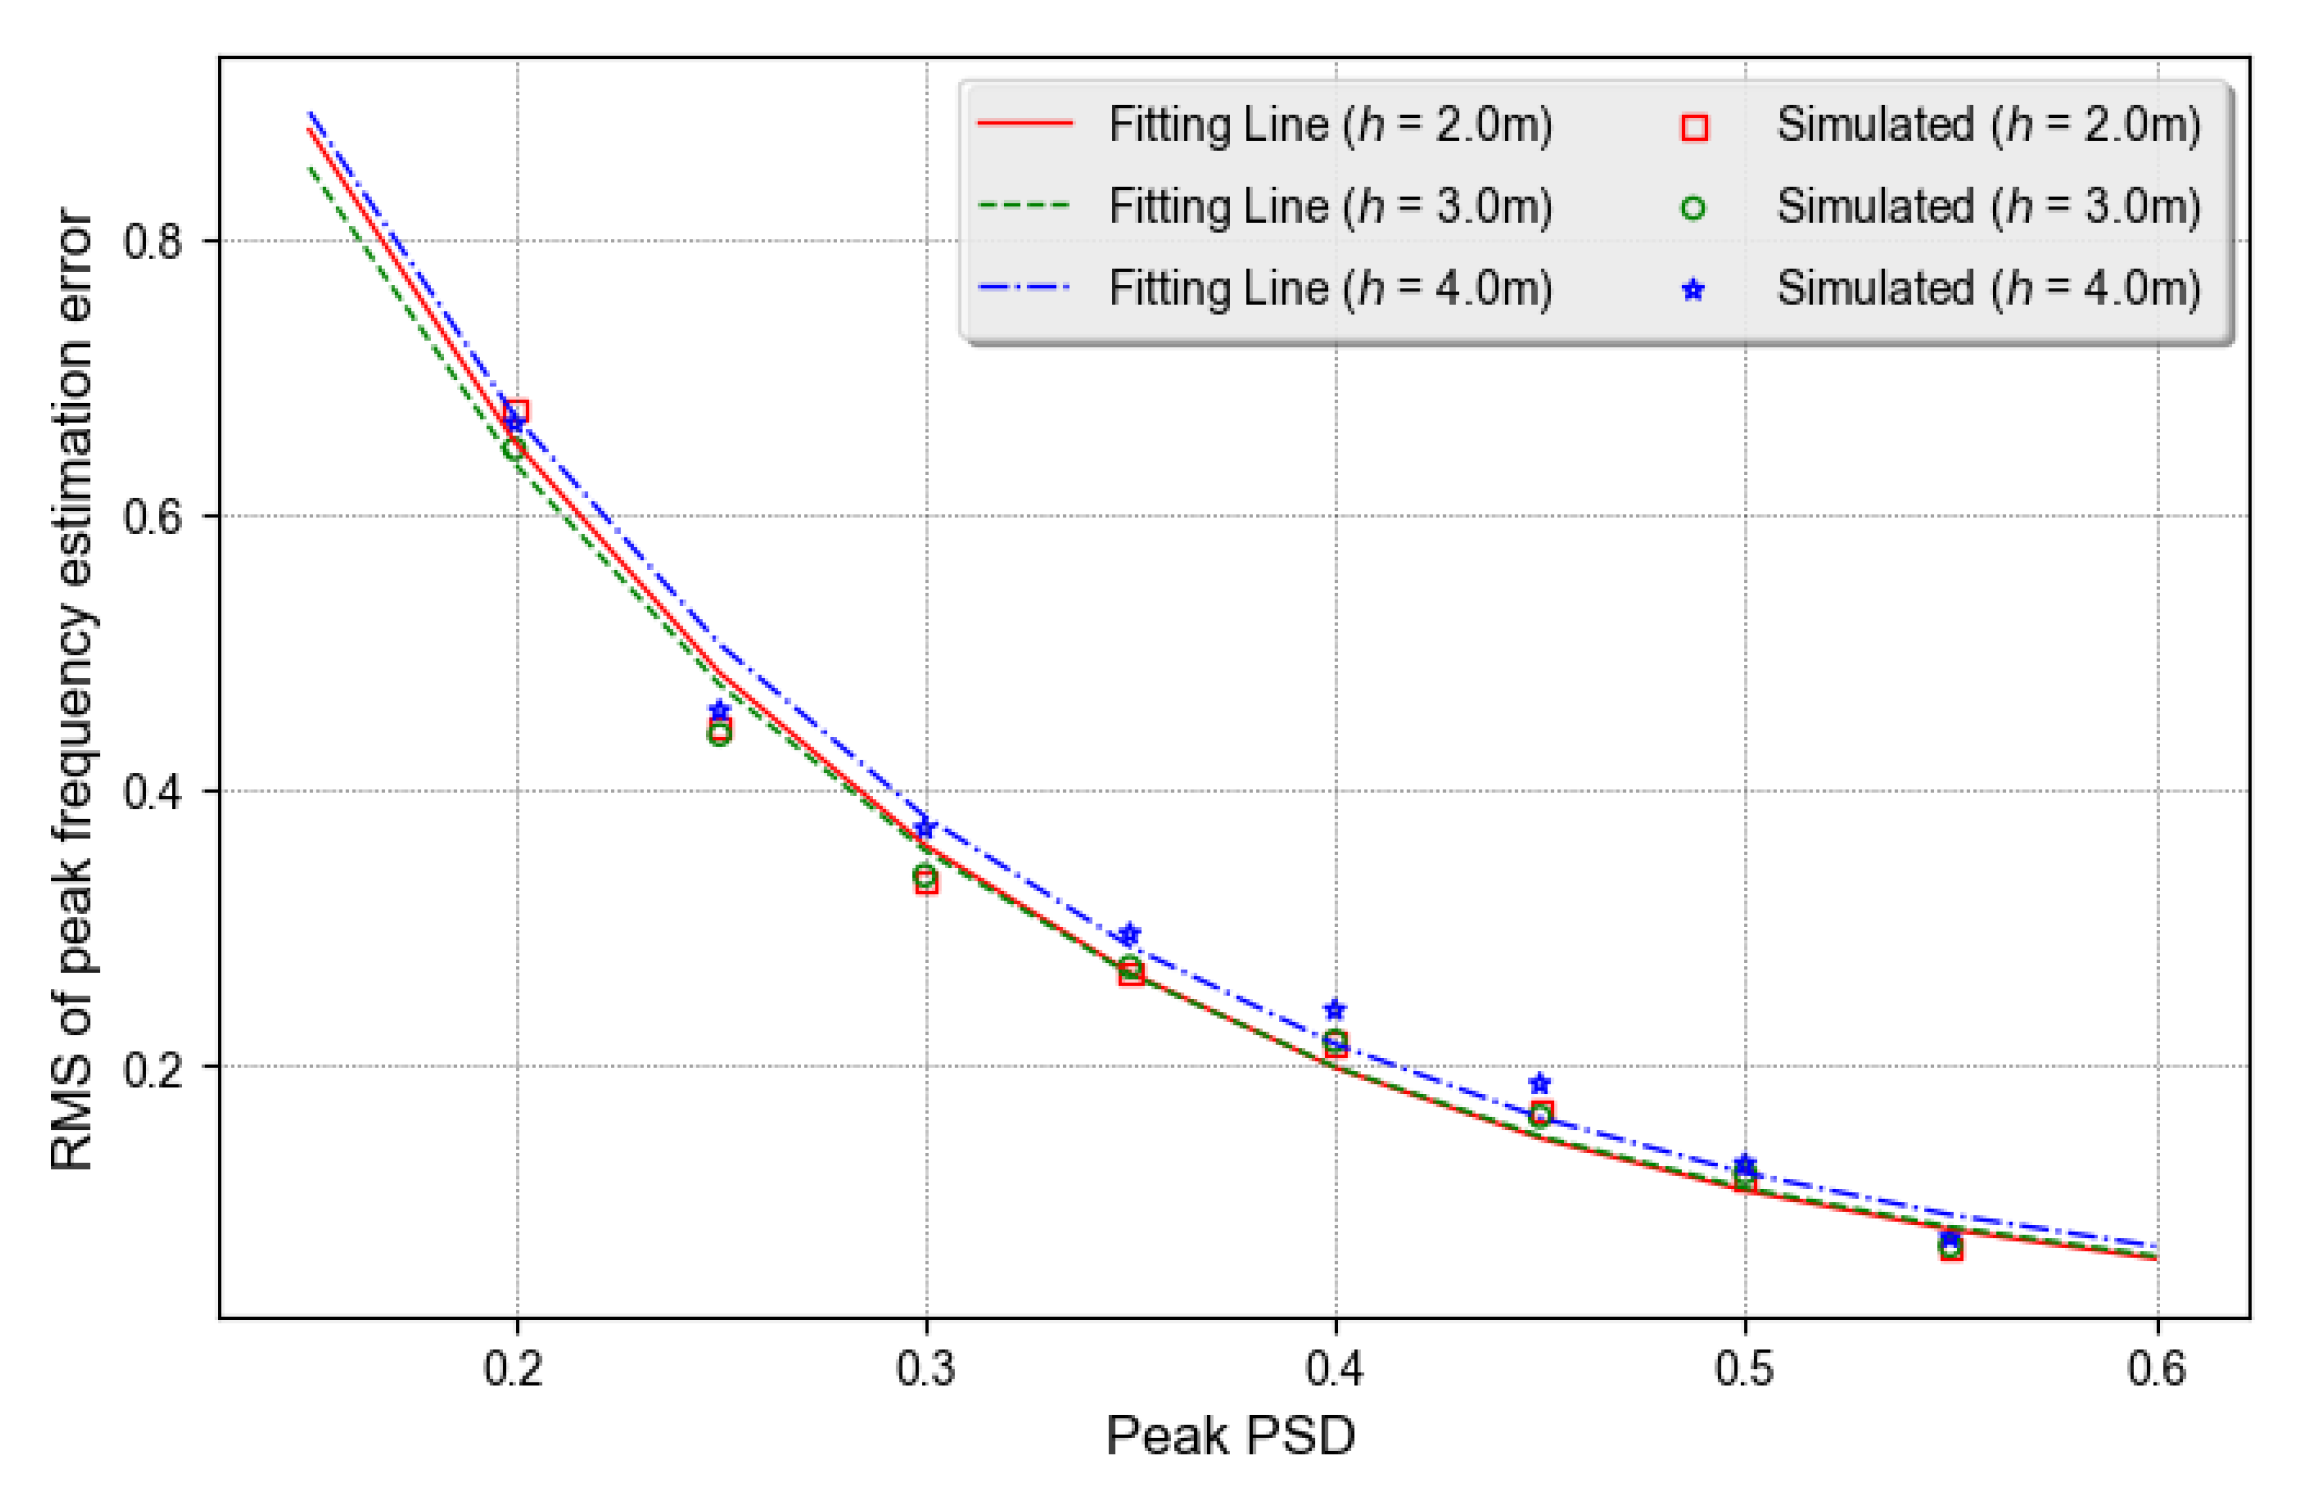
2.2.1. Data Preprocessing

The data set used to develop the empirical model was collected at the sites of the snow telemetry (SNOTEL) network, which is operated by the Natural Resource Conservation Service (NRCS), U.S. [18,19]. The snow depth and SWE data collected at 612 SNOTEL sites from 1 August 2010 to 1 August 2015 are used to develop the empirical model. When the snow cover duration in a winter season is shorter than 90 days, the snow depth in the season is typically smaller than 50 cm, as observed from the data sets, and the snowpack would present irregular variation patterns, such as multiple snowfall and snow-melting cycles in a single winter season. Therefore, the data in the five years are examined to select the data according to the criteria: (a) the maximum snow depth at each of the selected site is more than 50 cm; (b) snow cover duration in a winter season is over 90 days for each of those sites. As shown in Figure 3, the elevations of the selected sites are quite different (from ~800 m to ~3500 m) although they are all distributed in the western part of the U.S.
In order to remove physically implausible measurements of the ultrasonic snow depth sensor and snow pillow, a normal range of snow density, which is calculated by division of SWE and snow depth measurement, is selected within 0.03 g/cm3 to 0.7 g/cm3. If the calculated snow density is out of the normal range, the snow depth and SWE observations are removed from the data set. Because of the significant fluctuation of the daily snow depth observations, which are caused by noise or interference, a moving average filtering method with a filtering window length of 7 days is used to process the raw daily snow depth observations. The filtered daily snow depth observations are obtained by:
h ( i ) = n = i k n = i + k h ~ s n o w ( n ) 2 k + 1 w i t h i k
where h ~ s n o w is the raw daily snow depth observations and k is the filtering window length. The filtered daily snow depths and raw SWE observations are used to establish the empirical model.

2.2.2. Empirical Modeling

The snow depth usually increases until reaching its maximum, and then it sharply decreases until there is no snow on the ground. Therefore, as shown in Figure 4, the variation of SWE versus snow depth presents a hysteresis loop and produces multivalued SWE for each snow depth in a snow season. It can be observed in Figure 4 that before the snow depth reaches its maximum within the snow accumulation period (Paccum), SWE slowly increases with the increase of snow depth. After SWE reaches its maximum, and thus, when the snow melting period (Pmelt) starts, as the snow depth decrease rate is much larger than the snow density increase rate, SWE decreases with the decrease of the snow depth. Although the increase rate and decrease rate of SWE are different, SWE is proportional to the snow depth in both of those two periods. In the period between the two days when the snow depth and SWE reach the maximum separately (i.e., the snow transition period, Ptran), the snow depth decrease rate is smaller than the rate of snow density increase; thus, SWE increases with the decrease of snow depth. Because of the significant difference in the variation pattern of SWE versus the snow depth in the three periods, it is necessary to develop three separate regression models to convert the snow depth to SWE for Paccum, Pmelt and Ptran, respectively.
Taking the snow depth as the independent variable and SWE as the dependent variable, a scatterplot of SWE versus the snow depth for Paccum and Pmelt are shown in Figure 5. It can be observed that SWE increases with an increase of snow depth for both phases in general. Fitting those discrete points by first-, second- and third-order polynomial produces three fitting equations for three individual phases. The fitting coefficients and fitting errors for the Paccum and Pmelt phases are listed in Table 2 and Table 3, respectively. It can be seen that the fitting performance in terms of both correlation coefficient and RMSE improves with higher order polynomials. However, the improvement is very marginal, for example, the correlation coefficient difference between the second and third order polynomials is only 0.0009 and the RMSE difference is just 0.12 cm for Paccum. It would be more sensible to opt for the simpler model with a lower order polynomial at the cost of negligible performance degradation. Therefore, the second-order polynomials are selected as the regression models for Paccum and Pmelt:
{ S W E P a c c u m = 0.0004 h 2 + 0.2417 h 1.1 ( h > 4.6 cm ) S W E P m e l t = 0.0002 h 2 + 0.4301 h 1.5 ( h > 3.4 cm )
Note that the lower limits of these two regression models are applied to guarantee positive SWE estimations in the presence of the estimation error. As the snow depth in most of the observations used for developing the regression models is smaller than 500 cm, those two models may not be suited for scenarios where the snow depth is significantly greater than 500 cm.
Figure 6 shows the scatterplot of SWE versus the snow depth in Ptran. For clarity, only eight results related to six SNOTEL sites are presented. Contrary to Paccum and Pmelt, the SWE basically increases with the decrease of snow depth in Ptran. The statistical results show that there is a significantly linear correlation between the snow depth and SWE in the period, and the relationship at each site can be modeled with a linear regression equation:
S W E P t r a n = a h + b
An analysis of all of the stations revealed that there is no significant relevance between the parameter a and snow depth, or climatological parameters (e.g., air temperature and precipitation). Although the slope of the equation ranges between −3.5 and 1 basically, most of the values are clustered around the range from −1.5 to 0.5, which account for 98% of the total number. Therefore, one takes the average of the parameters between −1.5 and 0.5 as the value of parameter a, which is given by:
a = 0.3515
Intuitively, the parameter b is relevant to the maximum of snow depth for each snow season. This can be seen clearly in Figure 7, which shows a scatterplot of parameter b and the corresponding maximum of the snow depth of the snow season. Based on the linear distribution pattern shown in Figure 7, the relationship between the maximum of the snow depth and parameter b can be obtained by using the least squares fitting as:
b = 0.7745 h max 17.03
where hmax is the maximum of snow depth in a given snow season. Then, by substituting Equations (11) and (12) into Equation (10), the regression model in Ptran can be rewritten as:
S W E P t r a n = 0.3515 h + 0.7745 h max 17.0 ( h max > 40.3 cm )
Note that the lower limit of the maximum snow depth specified in Equation (13) is to guarantee that the SWE is larger than zero. When the maximum snow depth is smaller than 40.3 cm, the Ptran would be very short; the whole snow season could be split into two periods (Paccum and Pmelt) at the point of maximum snow depth, and make use of Equation (9) to convert the snow depth into SWE. In addition, a fit result of SNOTEL station 1000 obtained by Equation (13) has also been shown in Figure 6. It can be seen that there is a good accordance between the in situ SWE observations and the fitted one. The mean, STD and RMS of the fitting error of the regression model for Ptran are −2.43 cm, 10.9 cm and 11.17 cm, respectively, which are considerably larger than those for Paccum and Pmelt. However, as the duration of Ptran is much shorter than Paccum and Pmelt, the modeling error would only have a marginal effect on the SWE estimation over a whole snow season.
By using the regression models of Equations (9) and (13), snow depth observations can be converted into SWE in the corresponding period. Before the conversion, three periods in a snow season need to be divided to determine which regression model should be used. Paccum and Ptran are separated by the day when the maximum snow depth occurs in a snow season, which can be easily obtained from a series of SNR-based snow depth estimations in the season. On the other hand, it is non-trivial to determine the day when Ptran ends or when the Pmelt starts, because on what day the maximum SWE occurs in a snow season is unknown in advance. However, the day separating the two periods Ptran and Pmelt can be determined by using the fact that the modeled SWEs of Ptran and Pmelt are equal on the separating day:
S W E P t r a n ( h t m ) = S W E P m e l t ( h t m )
where htm is the snow depth on the intersection point of the two models, corresponding to the maximum SWE. Substituting Equation (13) and the second equation of Equation (9) into Equation (14), the snow depth htm can be determined by:
0.0002 h t m 2 + 0.7815 h t m 0.7745 h max + 15.552 = 0
It can be proven that Equation (15) always has two real solutions (one is negative and the other is positive) when the maximum snow depth is greater than 40.3 cm and smaller than 500 cm. By making use of the least squares fitting, the relationship between the maximum snow depth and htm when the snow depth maximum is in the range of 40.3 cm to 500 cm can be described as:
h t m = 0.8893 h max 9.6
In summary, the relationship between SWE and snow depth is described by the regression models covering the whole snow season as:
S W E ( h ) = { S W E P a c c u m ( h ) ( 4.6 < h < h max ) S W E P m e l t ( h ) ( h max h > 3.4 ) if h max 40.3 cm S W E ( h ) = { S W E P a c c u m ( h ) ( 4.6 < h < h max ) S W E P t r a n ( h ) ( h max h > h t m ) S W E P m e l t ( h ) ( h t m h > 3.4 ) if 40.3 cm < h max < 500 cm
Figure 8 shows the distribution of modeled SWE residuals versus snow depth and the residual distributions for the three periods. Basically, the fitting residual of SWE increases with the increase of snow depth for all three models. The mean modeled SWE residuals of the three periods are 0.27 cm, −2.43 cm and −0.64 cm, that is, there is a bias in all three periods and the one in the transition period is significant. It can be seen from the left panel of the figure that there is a clear minor increasing trend from −3.3 cm to 5.7 cm for Paccum when SD is in the range of 0 m to 1 m, a decreasing trend from 8.9 cm to −10.3 cm when SD goes from 0.4 m to 1.5 m for Pmelt, and an increasing trend from −3.5 cm to 7.4 cm when SD goes from 0.1 m to 1 m. The reason of this bias is that the proposed model only considers the relationship between SD and SWE. SWE is affected by multiple parameters, although SD plays the most important role. It is more accurate to develop a multi-parameter (including climate parameters) model to estimate SWE, if those parameters could be obtained precisely.

2.3. Algorithm of SNR-Based SWE Estimation

Based on the SNR observations recorded by the GNSS receiver and SWE conversion model established above, the algorithm of the SNR-based SWE estimation is then developed. The algorithm can be described as follows:
(a)
Input GNSS observation files and navigation files in a snow season;
(b)
Calculate the satellite elevation angle and extract GNSS SNR observations within 5° to 25°;
(c)
Select SNR sequences with a clear periodical oscillating pattern;
(d)
Perform the Lomb-Scargle spectral analysis for the sequences of “sinθ-SNR”;
(e)
Calculate the antenna height and snow depth by Equation (2) and (3), respectively;
(f)
Select the calculating results with a PSD peak larger than 0.1;
(g)
Fuse the multi-satellite snow depth estimations for each day by Equation (7);
(h)
If the maximum of the daily snow depth is larger than 40.3 cm in the snow season:
(h.1)
Calculate the snow depth htm corresponding to the maximum SWE, and divide the snow depth into three sequences (Paccum, Ptran and Pmelt) by the maximum snow depth and the snow depth htm;
(h.2)
Convert those three sequences of snow depth into the SWE sequence by the second equation in Equation (17).
(i)
If the maximum snow depth is smaller than 40.3 cm in the snow season:
(i.1)
Divide the snow depth into two sequences (Paccum and Pmelt) by the maximum snow depth;
(i.2)
Convert those two sequences of snow depth into an SWE sequence by the first equation in Equation (17).
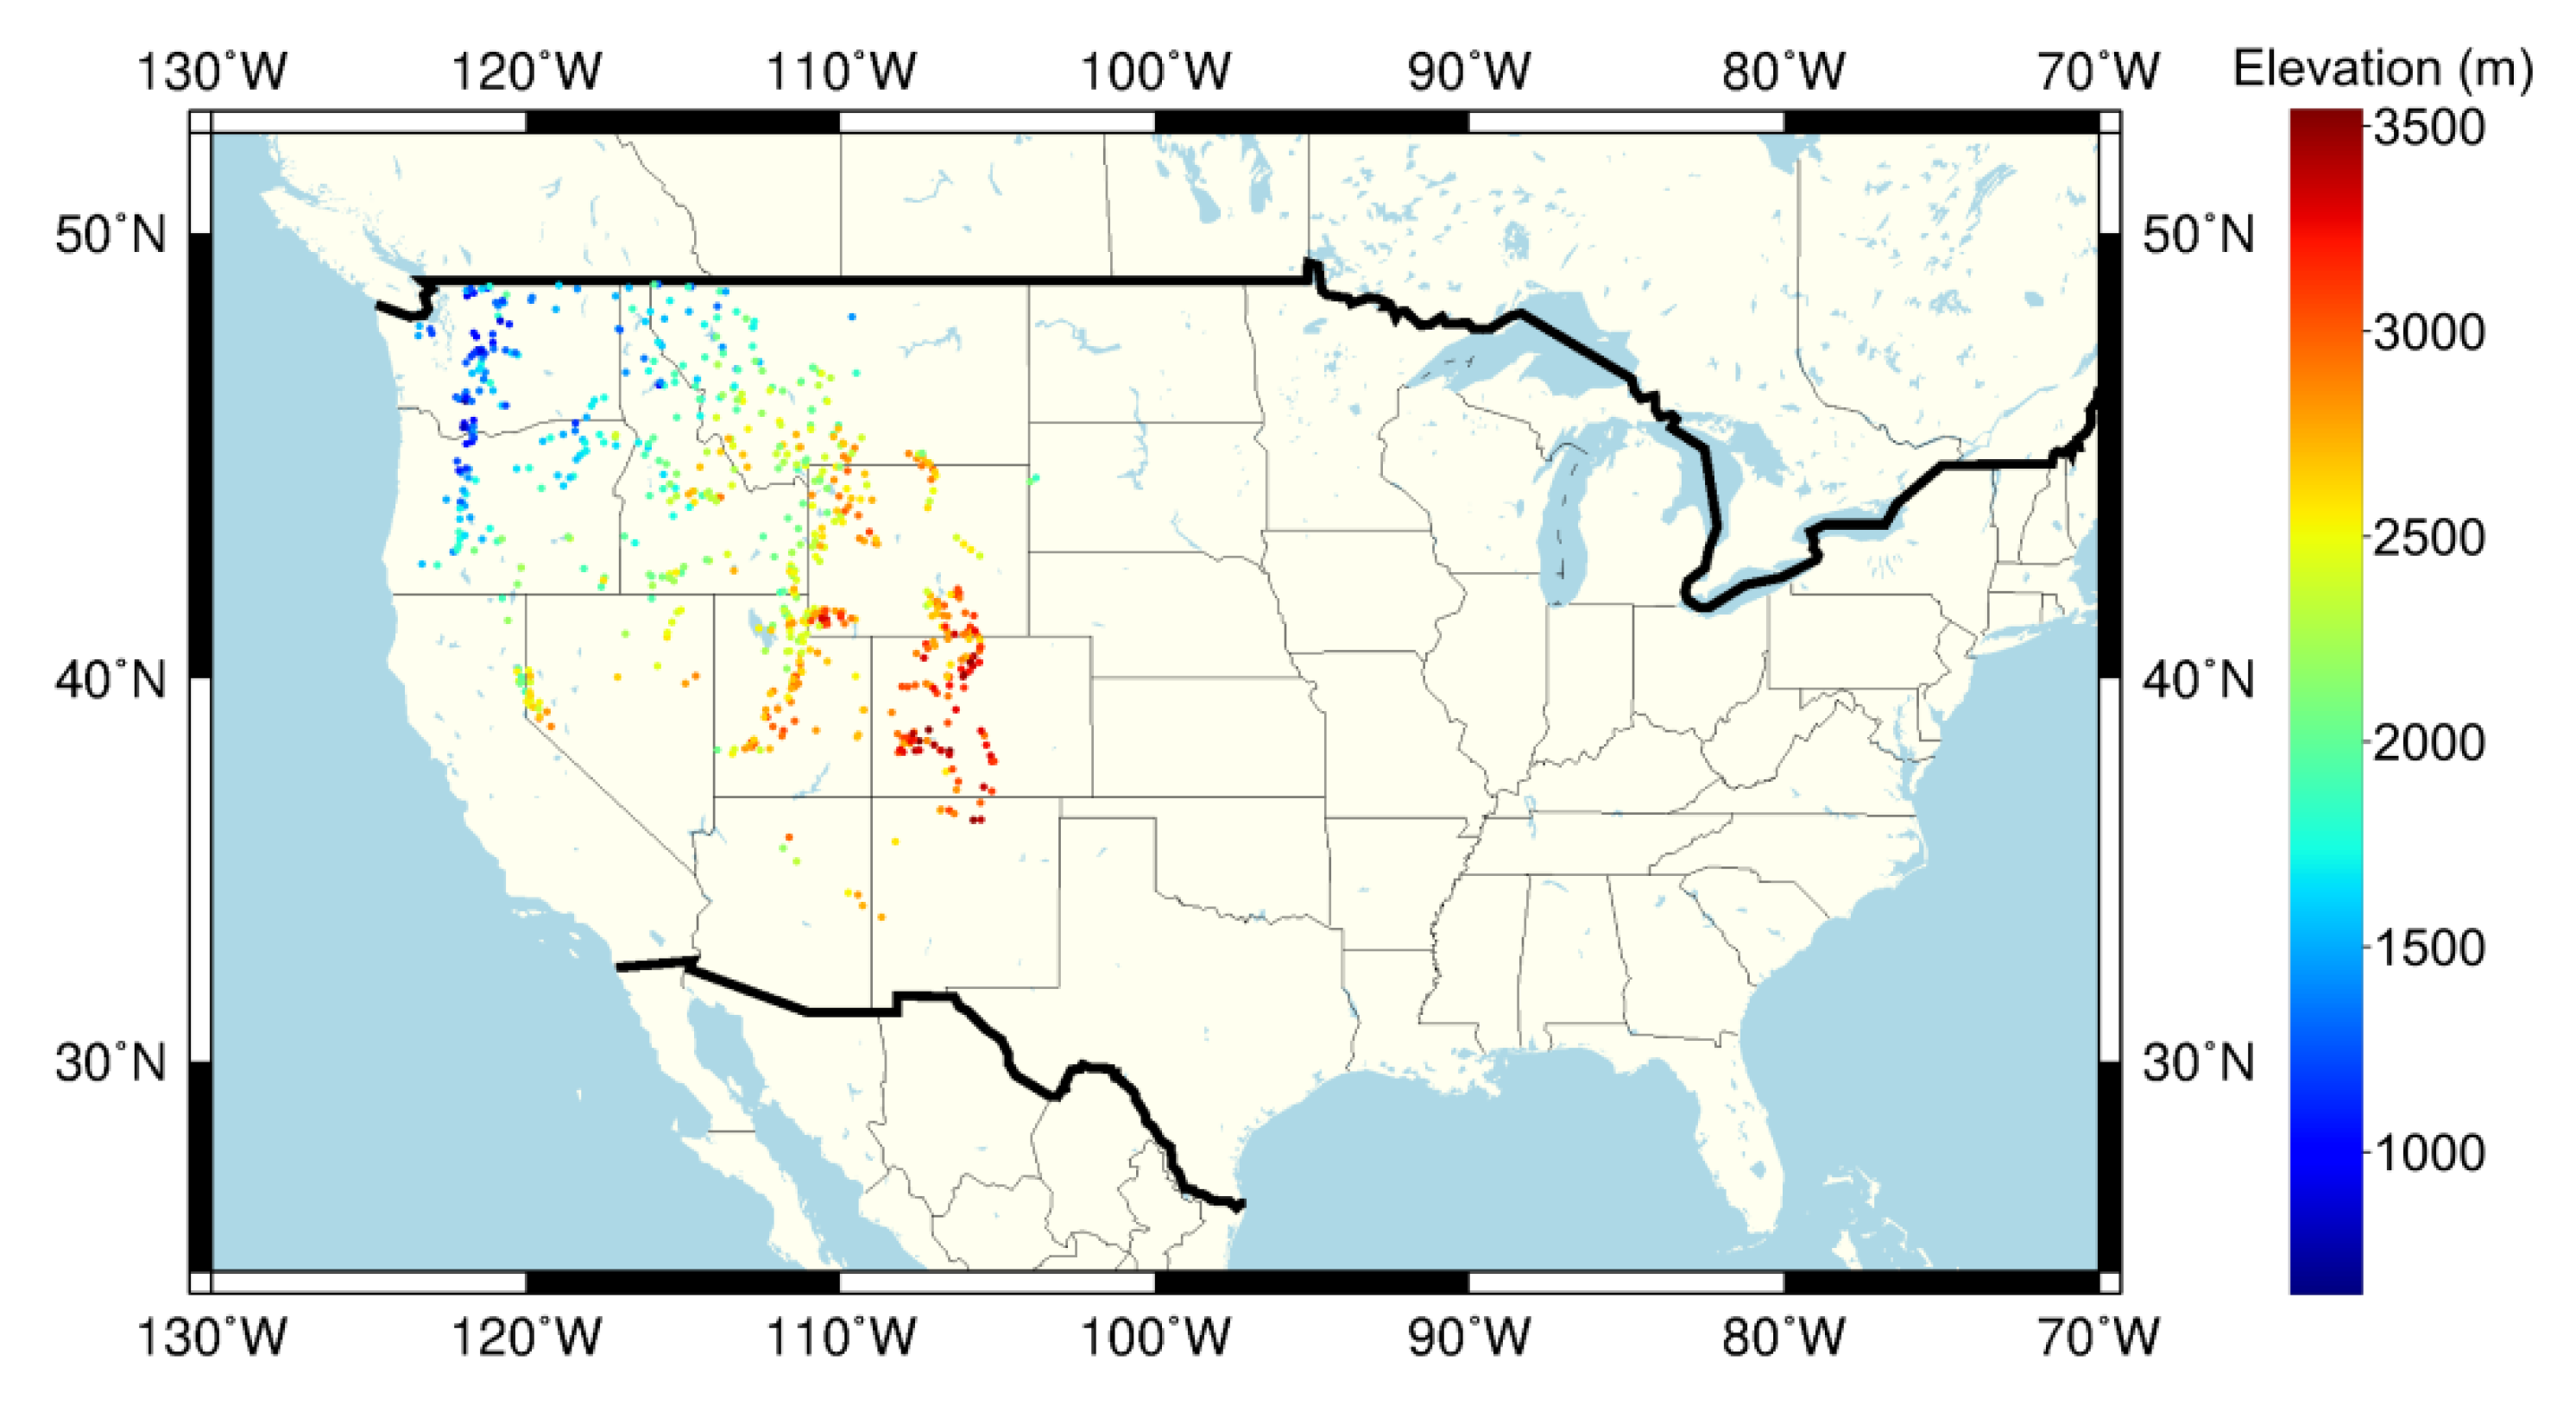
Note that the restriction of GNSS SNR observations to remain within 5° to 25° is to guarantee sufficient strength of GNSS reflected signals so that a clear oscillation pattern will occur and an accurate spectral peak frequency can be obtained (i.e., main frequency), which is the basis of GNSS interferometric application. In addition, as shown in Figure 2, a lower peak PSD of SNR sequence would produce a larger error in the main frequency (and thus snow depth) estimation. Therefore, each selected SNR sequence with respect to the sine of the elevation angle should have a PSD peak larger than the threshold, such as 0.1 in this case, for the purpose of the precision assurance of the snow depth estimations. In the case where real-time daily snow depth and SWE estimation is required, the maximum snow depth is unknown in advance, so the procedure is modified slightly as follows. Suppose that the snow depth and SWE estimation is performed immediately after snowfall starts. Then, after getting the snow depth estimates, the SWE is calculated daily with the Paccum model if the snow depth estimate is in an increase trend. If the daily snow depth estimate decreases considerably a couple of times compared to the previous ones, then the calculation of the Paccum model is likely over; this may be further validated by historical snow depth data. If the maximum snow depth estimate is smaller than 40.3 cm, then the Pmelt model is used to calculate the SWE; otherwise, the Ptran model is employed to calculate the SWE. In the Ptran case, when the snow depth estimate drops to htm a few times, the Pmelt model is used to calculate the SWE.

3. Data

Three field data sets are used to evaluate the proposed method. The first data are snow depth and SWE observations collected at SNOTEL sites from 2 August 2015 to 1 August 2020, which were not used for developing the models. A comparison between modeled SWE and in situ ones are performed for three periods. The second and third data sets collected at different geographical locations are used to validate the proposed GNSS-R SWE estimation algorithm. Both of these two data sets include GNSS observations and the in situ SD and SWE observations. In addition to the comparison with the in situ SWE observations, a comparison with the typical climatological snow density model-based SWE estimations has also been performed.
The second data set was collected in an experimental campaign conducted in Harbin, Heilongjiang Province, China, from 26 December 2017 to 17 January 2018. The receiver used to collect GNSS signals was a Trimble Net R9 with an antenna type of TRM 55971.00. Coordinate of the receiver location is (44°51′42.3″ N, 128°31′55.2″ E). Details about the environment of the GNSS station and the snow depth variation during the campaign can be found in [14,15]. As shown in Figure 9, a transparent plastic tube with an internal diameter of 5.3 cm and length of 1 m was used to sample the snowpack nine times a day. Plastic containers were used to hold the snow samples and the samples were delivered into a room. After the snow sample melts completely, some volumetric cylinders were used measure the volume of melt water. The SWE is simply equal to the quotient from dividing the volume of melt water (in units of cm3) by the area of the inner cross section of the tube, which is 5.32π/4 cm2. The average of nine SWE observations in a day is treated as the in situ daily SWEs measurements. The daily in situ snow depth and SWE measurements recorded during the campaign are within the range of 18.4 cm−54.7 cm and 4.6 cm−13.5 cm, respectively.
The third data set was collected from a GPS station (RN86) in Rich, Utah, U.S, with coordinates being (41°51′53.6″ N, 111°30′9.0″ W). The GNSS receiver at the station is Trimble Net R9 with an antenna of 57917.00, which has an antenna gain pattern similar to 55971.00. Details about the environment of the GPS station can be found in [20]. There is a typical SNOTEL site (1098), which is about 350 m away from the GPS station. Similar to most of the SNOTEL sites, the site of 1098 is settled in the forest, of which the environment is significantly different with the GPS station. Data collected over 23 satellite tracks were used to estimate the SWE around the GNSS station. Note that the snow depth and SWE data of the SNOTEL site 1098 have not been used in the establishment of the SWE empirical models in Section 2.2.

4. Experimental Results

4.1. Validation of SWE Empirical model

Scatterplots of the empirical model-based SWE estimates versus SNOTEL SWE observations for the three periods (accumulation period, transition period and melting period) of the first data set are shown in Figure 10. The RMS of the empirical model-based SWE estimation errors are 6.03 cm, 9.97 cm and 8.85 cm for the three periods, respectively. This can be also seen in Table 4, which shows the mean, STD and RMS of errors of the empirical model-based SWE estimations for the three periods.

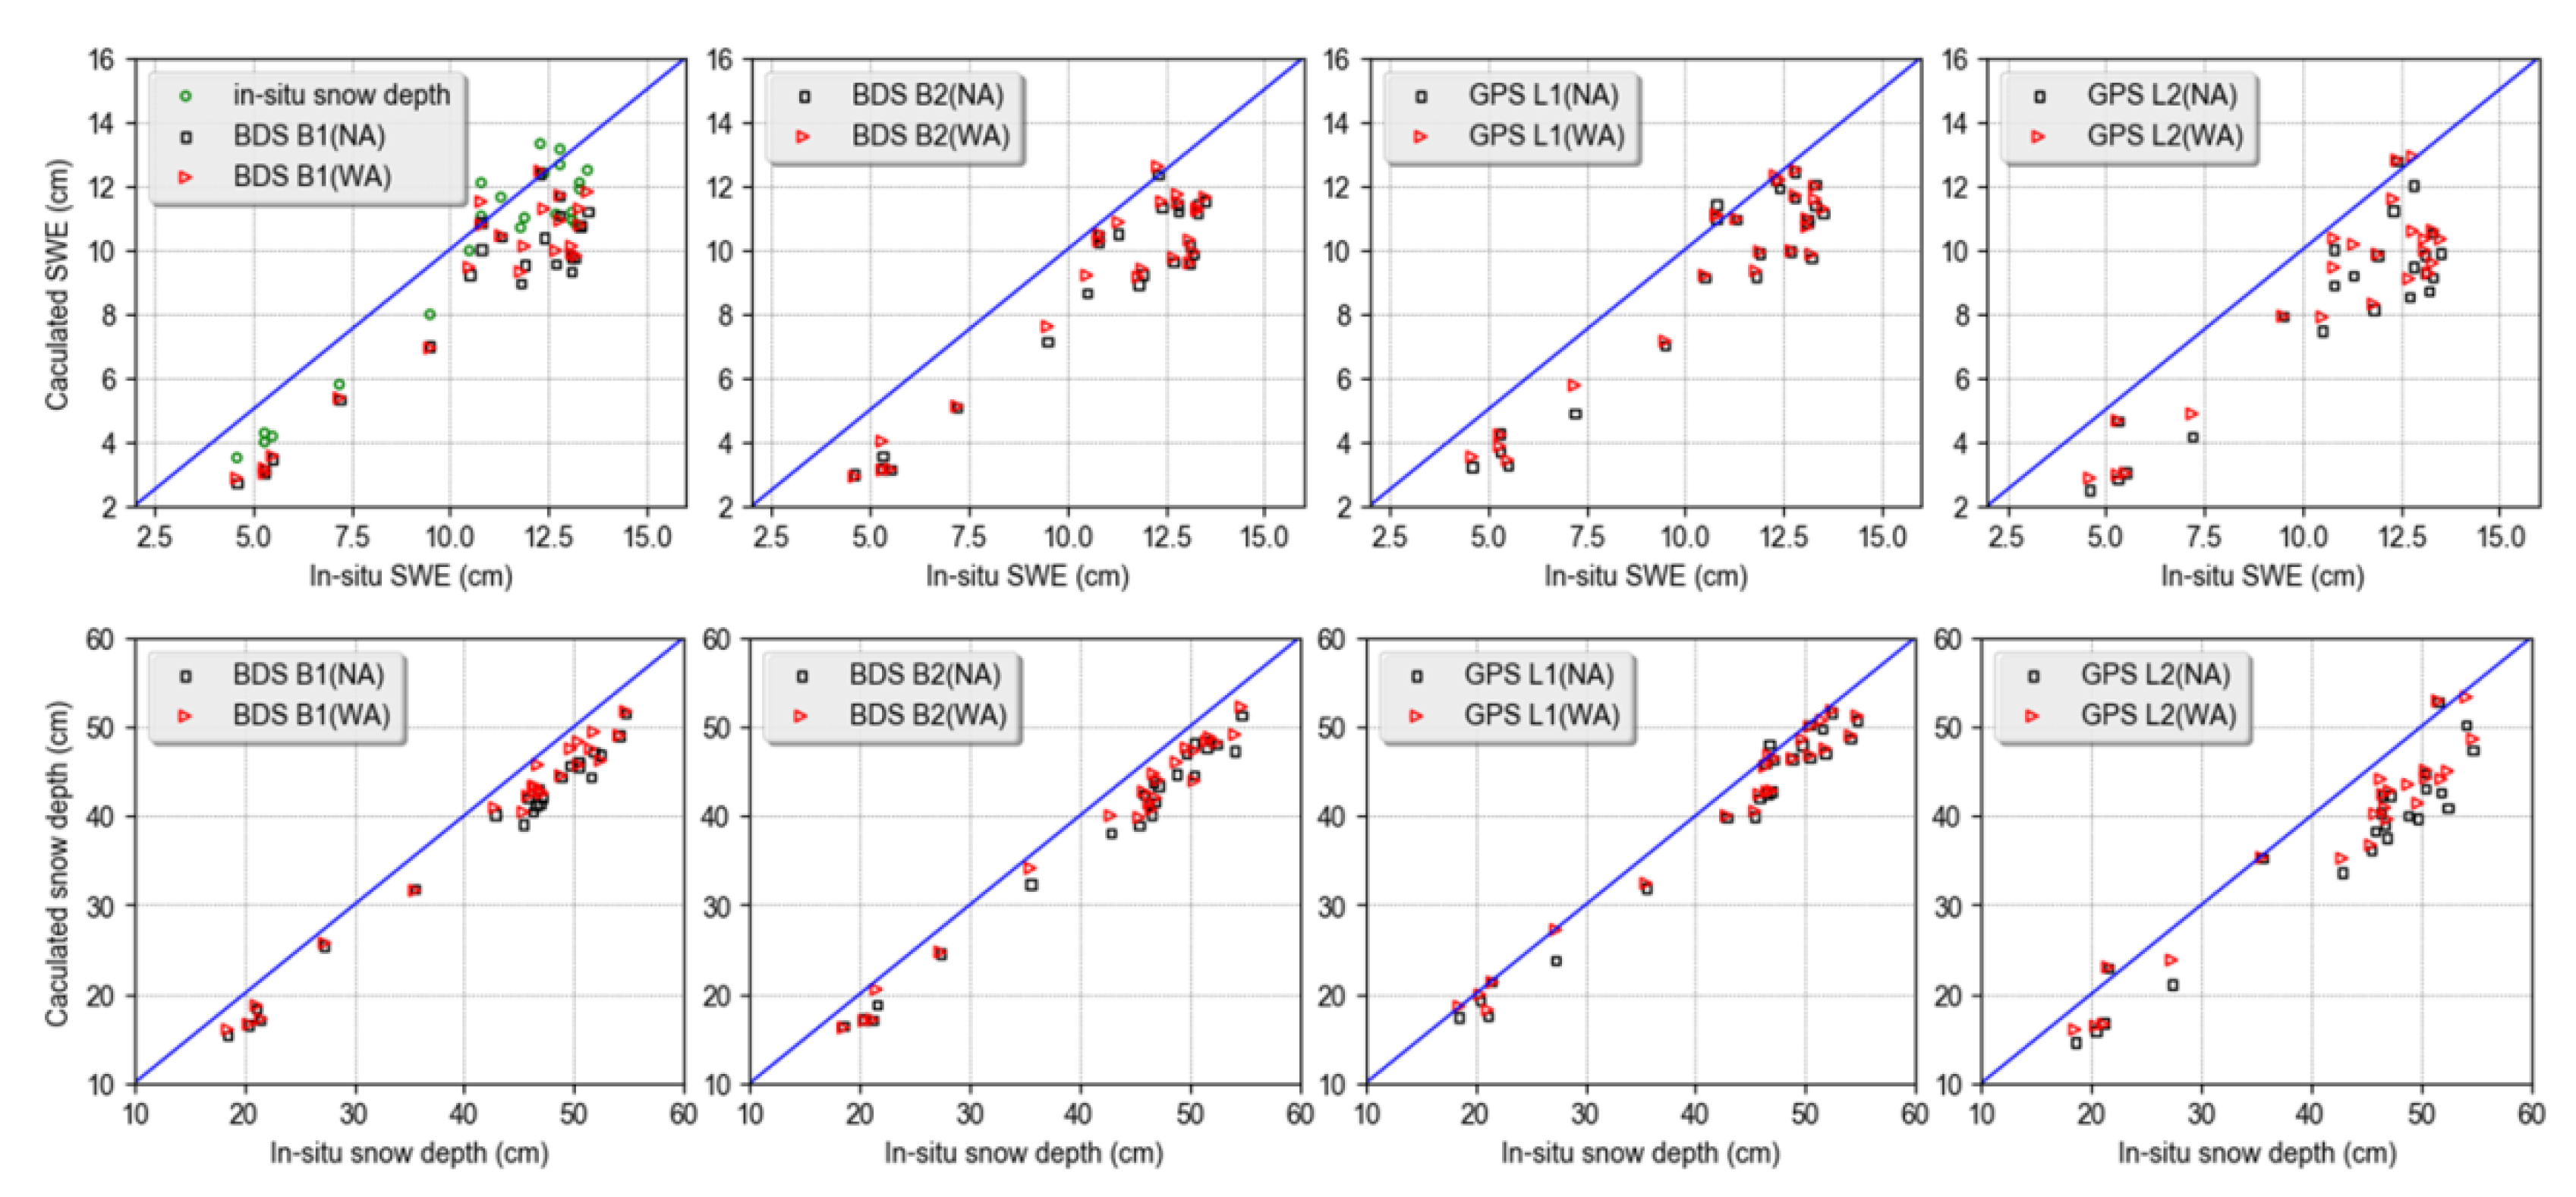
4.2. Results with Data Collected in Hartbin, China

Four BDS satellites with B1 and B2 signal SNR observations and five GPS satellites with L1 and L2 signal SNR observations are used to test the proposed method. According to the snow depth records over the years in the area, the snow depth hit its maximum in February. Therefore, the empirical model of Paccum was used to convert the SNR-based snow depth into SWE. Figure 11 shows the scatterplot of the in situ SWE versus the SNR-based SWE, and the scatterplot of the in situ snow depth versus the SNR-based snow depth. Note that the SNR-based snow depth estimations, produced by two different average techniques, are presented in the figure; NA refers to the results obtained by the normal average and WA refers to the results obtained by the weighted average, which is obtained by Equation (7). Therefore, two different SWE estimations, calculated by those two different snow depths, respectively, are also produced and presented in the figure. Table 5 shows the mean, STD and RMS of errors in the SNR-based SWE estimation.

4.3. Results with Data Collected at RN86, U.S.

The GPS L1 SNR observations from 15 Augustus 2012 to 25 June 2013 are used to estimate the snow depth at the GPS station, and the estimated snow depths are then substituted into the SWE empirical models established in Section 2.2 to obtain the SWE estimations. The SNOTEL site also has the in situ snow depth measurements recorded by snow depth sensor, denoted by SNOTEL SD, and the proposed empirical model is used to yield the SNOTEL SD-based SWE estimations. The SNOTEL SWE observations, which are measured by snow pillow, SNOTEL SD-based SWE and SNR SD-based SWE estimations, are all shown in Figure 12. Also shown in Figure 12 are the SWE estimates obtained by the typical climatological snow density model (Sturm model, [21]) and the SNOTEL SD for the purpose of comparison. The version of the model used for converting the snow depth to SWE is Prairie, and related parameters (ρmax, ρ0, k1, k2) are 0.5941 gcm−3, 0.2332 gcm−3, 0.0016 cm−1 and 0.0031 cm−1 respectively.
The left of Figure 13 shows the scatterplot of SNOTEL SWE observations versus SNOTEL SD-based observations and SNR SD-based SWE estimations. The right of Figure 13 shows the scatterplot of SNOTEL SD-based observations versus SNR SD- and six manual-based SD observations in the snow season. Note that the error free line is an idealized line used as a reference to tell the deviation of the calculated SWE estimations from the SNOTEL SWE observations (ground truth). Table 6 shows the mean, STD and RMS of errors of SNOTEL SD-based, SNR SD-based and calibrated SNR SD-based SWE estimations in the snow season.

5. Discussion

It can be observed from Figure 10 and Table 4 that the empirical model based SWE estimates agree well with the SNOTEL SWE measurements in general. This indicates that empirical models established in Section 2.2 are valid and effective.
It can be seen from Figure 11 and Table 5 that the SNR-based SWE estimations contain a significant negative bias. The estimation error of SNR-based SWE comes from two error sources: SNR-based snow depth estimation error and SWE empirical model error. The main reason for the negative bias of the SNR-based SWE estimations shown in Figure 11 is the underestimation of snow depth by the SNR-based method. Since both GNSS signals are reflected from the snow surface and those reflected under the snow surface are received, the SNR-based snow depth estimates would be smaller than the real ones in general; this could be observed on the right figure of Figure 11. By making use of in situ (or, ruler measured) snow depth and the Paccum SWE empirical model, in situ snow depth-based SWE estimations can be calculated, as shown on the left figure of Figure 11 and Table 5. It can be seen from Table 5 that the mean error of in situ snow depth-based SWE estimations is −0.82 cm. This empirical model induced bias is mainly related to the modeling method. Due to imperfect modeling, the proposed model has a systematic negative residual about −1 cm for Paccum when SWE is in the range of 5 cm to 15 cm, as shown in Figure 8. It is useful to develop techniques to remove or significantly reduce such bias. Although there is a negative bias, the SWE empirical model is well suited to describe the relationship between snow depth and SWE in Paccum at different locations. Compared with the use of normal average of snow depth, the use of weighted average by Equation (7) can reduce the SWE estimation errors by 9.7%, 5.8%, 6.3% and 13.5% for BDS B1, BDS B2, GPS L1 and GPS L2 signals, respectively. In addition, the use of GPS L2 signal for SWE estimation produces a relatively large error. This is mainly caused by the considerably lower strength of the legacy GPS L2P(Y) code used for the evaluation; a lower strength of the GNSS signal would produce a larger error in the snow depth estimation [22], degrading the SWE estimation performance.
It can be seen in Figure 12 that the developed model performs better than the Sturm model in the snow accumulation period and snow melt period. The RMS errors of SWE estimation based on the proposed empirical model and Sturm model are 3.58 cm and 6.13 cm, respectively, indicating the significant accuracy enhancement with the proposed model. The accuracy of the Sturm model-based SWE estimations is in accordance with previous studies in general (e.g., [16,21]). The previous studies generally take all the snowpack observations as a whole and establish an empirical model, ignoring the fact that the variation pattern of SWE is much different in different periods of a snow season. Because of the complexity of the snowpack in the transition period, the model does not perform well. Fortunately, the duration of the transition period is much shorter than the other two periods, so the estimation error would not produce a significant effect on the whole SWE estimation accuracy.
It can be observed from the left of Figure 13 that SNR SD-based SWE estimations perform much more poorly with a large negative bias from SNOTEL SWE observations. However, the variation patterns of SWE in the snow season are almost the same for those two results. The large negative bias here is mainly caused by the difference in the snow depth distribution in the area, as shown on the right of Figure 13. Snow depth is easily affected by environmental factors (e.g., topography, wind or sunshine duration), and is highly variable even within the space of a few hundred meters [23]. Wind-caused snow depth redistribution mainly results from wind force-induced erosion of snow surface, snow transport caused by blowing and snow deposition [24]. In fact, the amount of snowfall in the two sites should be the same; however, as the environment of the GNSS station is open and has a certain slope, the snowpack around the station can be easily blown away by the wind, making the snow depth much lower than that at the SNOTEL site. While the SNOTEL site is settled in the forest, trees around the site would block the wind, and thus, hinder the movement of snow. Because the six snow depth measurements made manually at the GNSS station are consistent with the SNR-based snow depth estimates, we believe that the snow depth estimates by the GNSS-R method are reliable. Accordingly, the SWE estimates at the GNSS station would also be reliable and accurate.
Although the snow depth is rather different between the GNSS station and SNOTEL site, the variation trend of the snow depth in the snow season is very similar, with a correlation coefficient of 0.97. Taking the GNSS station-observed snow depth (or, SNR SD) as the independent variable and the SNOTEL site-observed snow depth (or, SNOTEL SD) as the dependent variable, linear regression models for calibrating snow depth at the GNSS station into snow depth at the SNOTEL site can be obtained by using least squares method as:
h SNR   SD calibrated = { 1.2787 h SNR   SD + 10.9 ( Before   the   maximum   snow   depth ) 0.8960 h SNR   SD + 76.8 ( After   the   maximum   snow   depth )
Note that, because the relationship between the SNR SD and SNOTEL SD before the maximum snow depth is different from that after the maximum snow depth, the regression analysis is carried out at those two different periods separately. In addition, because the snow depth around the GNSS station is significantly smaller than that of the SNOTEL site, the snowpack around the GNSS station already melted away on a day during the melting period while the SNOTEL site still had a snow depth between 40 and 60 cm, which needed more days to melt away. Thus, SD and SWE observations of the period are not used for calibrating. Based on the regression models, the calibrated SNR SD in the snow season can be obtained. As shown on the right of Figure 13, the calibrated SNR SD agrees well with the SNOTEL SD. The calibrated SNR SD yields a better SWE estimation, and the residuals are evenly distributed with a relatively small bias, as shown in Figure 12 and on the left of Figure 13. Through the influence of SWE empirical model error, both the SNOTEL SD-based and the calibrated SNR SD-based SWE estimations overestimate the in situ SWE in the middle of December 2012, February 2013 and early May 2013. In general, the calibrated SNR SD-based SWE estimates agree well with the SNOTEL SWE measurements.
It can be observed from the comparison of the SNOTEL site and GNSS site-based SWE estimations that the spatial variability of SWE is drastic and is easily affected by environmental factors. Making full use of the thousands of GNSS stations deployed over the world would improve the estimation of the spatial variability of SWE and the accuracy of large-scale SWE monitoring. Although the proposed method has a good performance for SD estimations, the developed empirical model for converting GNSS-R SD to SWE estimation might not be well applicable for some snow classes (e.g., Tundra and Taiga). The models in the paper were developed without considering the variations in the temperature, air pressure, wind speed or humidity. Thus, they would be independent of meteorological data. In addition, as indicated in [21], when the SWE empirical models are developed mainly using snow depth and SWE data collected on the Prairie, the models would be more applicable for Prairie snow. However, as the snow class of Alpine and Maritime is rather similar to that of Prairie, the models would also be applicable for these two different scenarios once the variation pattern of snowpack is in accordance with the typical one. The developed models would be suited for scenarios where the reflection surface is flat and the footprint or the effective scattering zone is within the flat snow surface. In the presence of a significant slope over the effective scattering zone, the effect of slope should be mitigated. Additionally, if an obstacle occurs in the area of the footprint or if the footprint covers a non-snow surface, considerable error would be induced, and the effect should also be mitigated. It is useful to handle these two issues in the future.

6. Conclusions

In this paper, mathematical models have been developed to describe the relationship between snow depth and SWE. The winter season with snow cover is divided into two or three periods depending on the maximum snow depth, and for each period, a converting model has been established through a regression analysis on the in situ snow depth and SWE observations. Compared with the existing SWE estimation algorithms, these developed polynomial models greatly simplify the estimation of SWE. SNR-based snow depth estimation is also revisited. The simulation-based theoretical analysis has shown that the error of the SNR-based snow depth estimation is an exponential function of the peak PSD. Based on the observation, a fusion model has been developed for multi-satellite snow depth estimations, to enhance the snow depth estimation accuracy considerably. Three experimental data sets recorded in different environments were used to test the proposed SWE estimation method. The results demonstrate that there exists good agreement between the SWE estimates by the proposed SWE estimation method and the in situ SWE measurements.
Future research will focus on using data of multiple frequency signals and multiple GNSS constellations to improve the SWE estimation accuracy. It is also useful to develop techniques to reduce the bias in the estimation of snow depth and SWE. In addition, it is a future research direction to make use of multi-source data (e.g., GNSS, remote sensing satellite) to monitor the long-term snowpack variation with high temporal and spatial resolution for the purpose of climate variation prediction.

Author Contributions

Conceptualization, K.Y., Y.L. and J.L.; methodology, T.J.; software, Y.L. and Q.W.; validation, K.Y., Y.L. and X.C.; formal analysis, K.Y.; data curation, Y.L.; writing—original draft preparation, K.Y.; visualization, Y.L.; supervision, K.Y.; funding acquisition, K.Y. All authors have read and agreed to the published version of the manuscript.

Funding

This research was funded by the National Natural Science Foundation of China, grant number 41574031 and 41721003, and the Natural Science Foundation of Hubei Province, grant number 2019CFB427.

Conflicts of Interest

The authors declare no conflict of interest.

References

  1. Kinar, N.J.; Pomeroy, J.W. Measurement of the physical properties of the snowpack. Rev. Geophys. 2015, 53, 481–544. [Google Scholar] [CrossRef]
  2. Yu, K.; Rizos, C.; Dempster, A. GNSS-Based Model-Free Sea Surface Height Estimation in Unknown Sea State Scenarios. IEEE J. Sel. Top. Appl. Earth Obs. Remote Sens. 2013, 7, 1424–1435. [Google Scholar] [CrossRef]
  3. Small, E.E.; Larson, K.M.; Braun, J.J. Sensing vegetation growth with reflected GPS signals. Geophys. Res. Lett. 2010, 37, 1–12. [Google Scholar] [CrossRef]
  4. Katzberg, S.; Torres, O.; Grant, M.; Masters, D. Utilizing calibrated GPS reflected signals to estimate soil reflectivity and dielectric constant: Results from SMEX02. Remote Sens. Environ. 2006, 100, 17–28. [Google Scholar] [CrossRef] [Green Version]
  5. McCreight, J.L.; Small, E.E.; Larson, K.M. Snow depth, density, and SWE estimates derived from GPS reflection data: Validation in the western US. Water Resour. Res. 2014, 50, 6892–6909. [Google Scholar] [CrossRef]
  6. Jacobson, M. Inferring Snow Water Equivalent for a Snow-Covered Ground Reflector Using GPS Multipath Signals. Remote Sens. 2010, 2, 2426–2441. [Google Scholar] [CrossRef] [Green Version]
  7. Jacobson, M. Snow Water Equivalent Estimation for a Snow-Covered Prairie Grass Field by GPS Interferometric Reflectometry. Positioning 2012, 3, 31–41. [Google Scholar] [CrossRef] [Green Version]
  8. Rodriguez-Alvarez, N.; Aguasca, A.; Valencia, E.; Bosch-Lluis, X.; Camps, A.; Ramos-Perez, I.; Park, H.; Vall-Llossera, M. Snow Thickness Monitoring Using GNSS Measurements. IEEE Geosci. Remote Sens. Lett. 2012, 9, 1109–1113. [Google Scholar] [CrossRef]
  9. Henkel, P.; Koch, F.; Appel, F.; Bach, H.; Prasch, M.; Schmid, L.; Schweizer, J.; Mauser, W. Snow Water Equivalent of Dry Snow Derived From GNSS Carrier Phases. IEEE Trans. Geosci. Remote Sens. 2018, 56, 3561–3572. [Google Scholar] [CrossRef] [Green Version]
  10. Steiner, L.; Meindl, M.; Fierz, C.; Marty, C.; Geiger, A. Monitoring snow water equivalent using low-cost GPS antennas buried underneath a snowpack. In Proceedings of the 2019 13th European Conference on Antennas and Propagation (EuCAP), Krakow, Poland, 31 March–5 April 2019. [Google Scholar]
  11. Larson, K.M.; Gutmann, E.D.; Zavorotny, V.U.; Braun, J.J.; Williams, M.W.; Nievinski, F.G. Can we measure snow depth with GPS receivers? Geophys. Res. Lett. 2009, 36, L17502. [Google Scholar] [CrossRef] [Green Version]
  12. Ozeki, M.; Heki, K. GPS snow depth meter with geometry-free linear combinations of carrier phases. J. Geod. 2012, 86, 209–219. [Google Scholar] [CrossRef] [Green Version]
  13. Yu, K.; Ban, W.; Zhang, X.; Yu, X. Snow Depth Estimation Based on Multipath Phase Combination of GPS Triple-Frequency Signals. IEEE Trans. Geosci. Remote Sens. 2015, 53, 5100–5109. [Google Scholar] [CrossRef]
  14. Yu, K.; Li, Y.; Chang, X. Snow Depth Estimation Based on Combination of Pseudorange and Carrier Phase of GNSS Dual-Frequency Signals. IEEE Trans. Geosci. Remote Sens. 2018, 57, 1817–1828. [Google Scholar] [CrossRef]
  15. Li, Y.; Chang, X.; Yu, K.; Jin, T.; Li, J. Estimation of snow depth using pseudorange and carrier phase observations of GNSS single-frequency signal. GPS Solut. 2019, 23, 118. [Google Scholar] [CrossRef]
  16. McCreight, J.L.; Small, E.E. Modeling bulk density and snow water equivalent using daily snow depth observations. Cryosphere 2014, 8, 521–536. [Google Scholar] [CrossRef] [Green Version]
  17. Bilich, A.; Larson, K.M. Mapping the GPS multipath environment using the signal-to-noise ratio (SNR). Radio Sci. 2007, 42, 1–16. [Google Scholar] [CrossRef]
  18. Serreze, M.C.; Clark, M.P.; Armstrong, R.L.; McGinnis, D.A.; Pulwarty, R.S. Characteristics of the western United States snowpack from snowpack telemetry (SNOTEL) data. Water Resour. Res. 1999, 35, 2145–2160. [Google Scholar] [CrossRef] [Green Version]
  19. Dressler, K.A.; Fassnacht, S.R.; Bales, R.C. A Comparison of Snow Telemetry and Snow Course Measurements in the Colorado River Basin. J. Hydrometeorol. 2006, 7, 705–712. [Google Scholar] [CrossRef]
  20. Nievinski, F.G.; Larson, K.M. Inverse Modeling of GPS Multipath for Snow Depth Estimation—Part II: Application and Validation. IEEE Trans. Geosci. Remote Sens. 2014, 52, 6564–6573. [Google Scholar] [CrossRef]
  21. Sturm, M.; Taras, B.; Liston, G.E.; Derksen, C.; Jonas, T.; Lea, J. Estimating Snow Water Equivalent Using Snow Depth Data and Climate Classes. J. Hydrometeorol. 2010, 11, 1380–1394. [Google Scholar] [CrossRef]
  22. Tabibi, S.; Nievinski, F.G.; Dam, T.V. Statistical comparison and combination of GPS, GLONASS, and multi-GNSS multipath refectometry applied to snow depth retrieval. IEEE Trans. Geosci. Remote Sens. 2017, 55, 3773–3785. [Google Scholar] [CrossRef]
  23. López-Moreno, J.I.; Fassnacht, S.R.; Heath, J.T.; Musselman, K.N.; Revuelto, J.; Latron, J.; Moran-Tejeda, E.; Jonas, T. Small scale spatial variability of snow density and depth over complex alpine terrain: Implications for estimating snow water equivalent. Adv. Water Resour. 2013, 55, 40–52. [Google Scholar] [CrossRef] [Green Version]
  24. Dyunin, A.K.; Kvon, Y.D.; Zhilin, A.I.M.; Komarov, A.A. Effect of snow drifting on large-scale aridization. In Glaciers-Ocean-Atmosphere Interactions; IAHS Publication No. 208; IAHS Press: Wallingford, UK, 1991; pp. 489–494. [Google Scholar]
Figure 1. Simulated multipath SNR series with different noise levels and the spectrograms.
Remotesensing 12 03905 g001
Figure 2. The root mean square (RMS) of the peak frequency estimation error as a function of peak power spectral density (PSD).
Remotesensing 12 03905 g002
Figure 3. Distribution of snow telemetry network (SNOTEL) stations which are used for modeling.
Remotesensing 12 03905 g003
Figure 4. Typical variation of SWE versus snow depth over a snow season.
Remotesensing 12 03905 g004
Figure 5. Scatterplot of SWE versus the snow depth and the polynomial fitting results in Paccum (upper) and Pmelt (lower).
Remotesensing 12 03905 g005
Figure 6. Scatterplot of SWE versus snow depth and the polynomial fitting results in Ptran.
Remotesensing 12 03905 g006
Figure 7. Scatterplot of snow depth maximums versus parameters b, and the fitting line obtained by using least squares method.
Remotesensing 12 03905 g007
Figure 8. Heat map of the modeled SWE residuals versus the snow depth (left) and the residuals probability density (right) for the three periods.
Remotesensing 12 03905 g008
Figure 9. The experimental campaign conducted in Harbin, China.
Remotesensing 12 03905 g009
Figure 10. Scatterplot of the in situ SWE versus the modeled SWE estimates for Paccum (a), Ptran (b) and Pmelt (c).
Remotesensing 12 03905 g010
Figure 11. Scatterplot of in situ SWE versus SNR-based SWE estimates (left), and scatterplot in situ snow depth versus SNR-based snow depth estimates (right). NA stands for normal average and WA stands for weighted average.
Remotesensing 12 03905 g011
Figure 12. Comparison of SNOTEL SWE, SNOTEL SD-based SWE and SNR SD-based SWE estimations in a snow season.
Remotesensing 12 03905 g012
Figure 13. Scatterplot of the SNOTEL SWE estimates versus SNOTEL SD-based, SNR SD-based and calibrated SNR SD-based SWE estimates (left); scatterplot of SNOTEL SD-based observations versus SNR SD-based estimates in three periods and calibrated SNR SD-based estimates (right).
Remotesensing 12 03905 g013
Table 1. Fitting parameters and correlation coefficients for different antenna heights.
Antenna Height (m)αβR
1.02.12−5.790.9886
1.52.06−5.430.9840
2.02.14−5.940.9903
2.51.91−5.050.9807
3.02.03−5.800.9907
3.51.99−5.340.9864
4.02.08−5.670.9877
4.52.16−5.670.9887
5.02.06−5.470.9849
Table 2. Fitting polynomial coefficients and correlation coefficients for Paccum and Pmelt.
PhasePolynomialsFitting Polynomial CoefficientsR
3rd2nd1stc
Paccum1st--0.3484−5.82020.9696
2nd-0.00040.2417−1.11020.9775
3rd−0.92 × 10−68.7 × 10−40.17610.73310.9784
Pmelt1st--0.4748−4.92210.9679
2nd-0.00020.4301−1.4780.9695
3rd−1.78 × 10−61.2 × 10−40.27192.60270.9709
Table 3. Mean, STD and RMS of errors of fitting models for Paccum and Pmelt.
PhasePolynomialsFitting Error
Mean (cm)STD (cm)RMSE (cm)
Paccum1st0.005.935.93
2nd0.275.125.13
3rd−0.015.015.01
Pmelt1st0.008.398.39
2nd−0.648.248.27
3rd0.007.997.99
Table 4. Mean, STD and RMS of the errors for the developed empirical model-based SWE estimation.
PeriodMean (cm)STD (cm)RMS (cm)
Paccum−0.205.765.77
Ptran−1.279.409.48
Pmelt−0.078.128.13
Table 5. Mean, STD and RMS of errors in SNR-based SWE estimation.
BandMethodMean (cm)STD (cm)RMS (cm)
--Ruler−0.820.981.28
BDS B1NA−2.031.022.28
WA−1.761.052.05
BDS B2NA−1.930.952.15
WA−1.770.992.03
GPS L1NA−1.521.051.85
WA−1.411.011.73
GPS L2NA−2.471.302.79
WA−2.071.242.42
Table 6. Mean, STD and RMS of errors for SNOTEL SD-based, SNR SD-based, and calibrated SNR SD-based SWE estimation.
MethodMean (cm)STD (cm)RMSE (cm)
SNOTEL SD1.533.233.58
SNR SD−10.269.5013.98
Calibrated SNR SD1.984.925.31
Publisher’s Note: MDPI stays neutral with regard to jurisdictional claims in published maps and institutional affiliations.

