Risk Factors for Chronic Kidney Disease in Older Adults with Hyperlipidemia and/or Cardiovascular Diseases in Taipei City, Taiwan: A Community-Based Cross-Sectional Analysis


Abstract
:1. Introduction
2. Materials and Methods
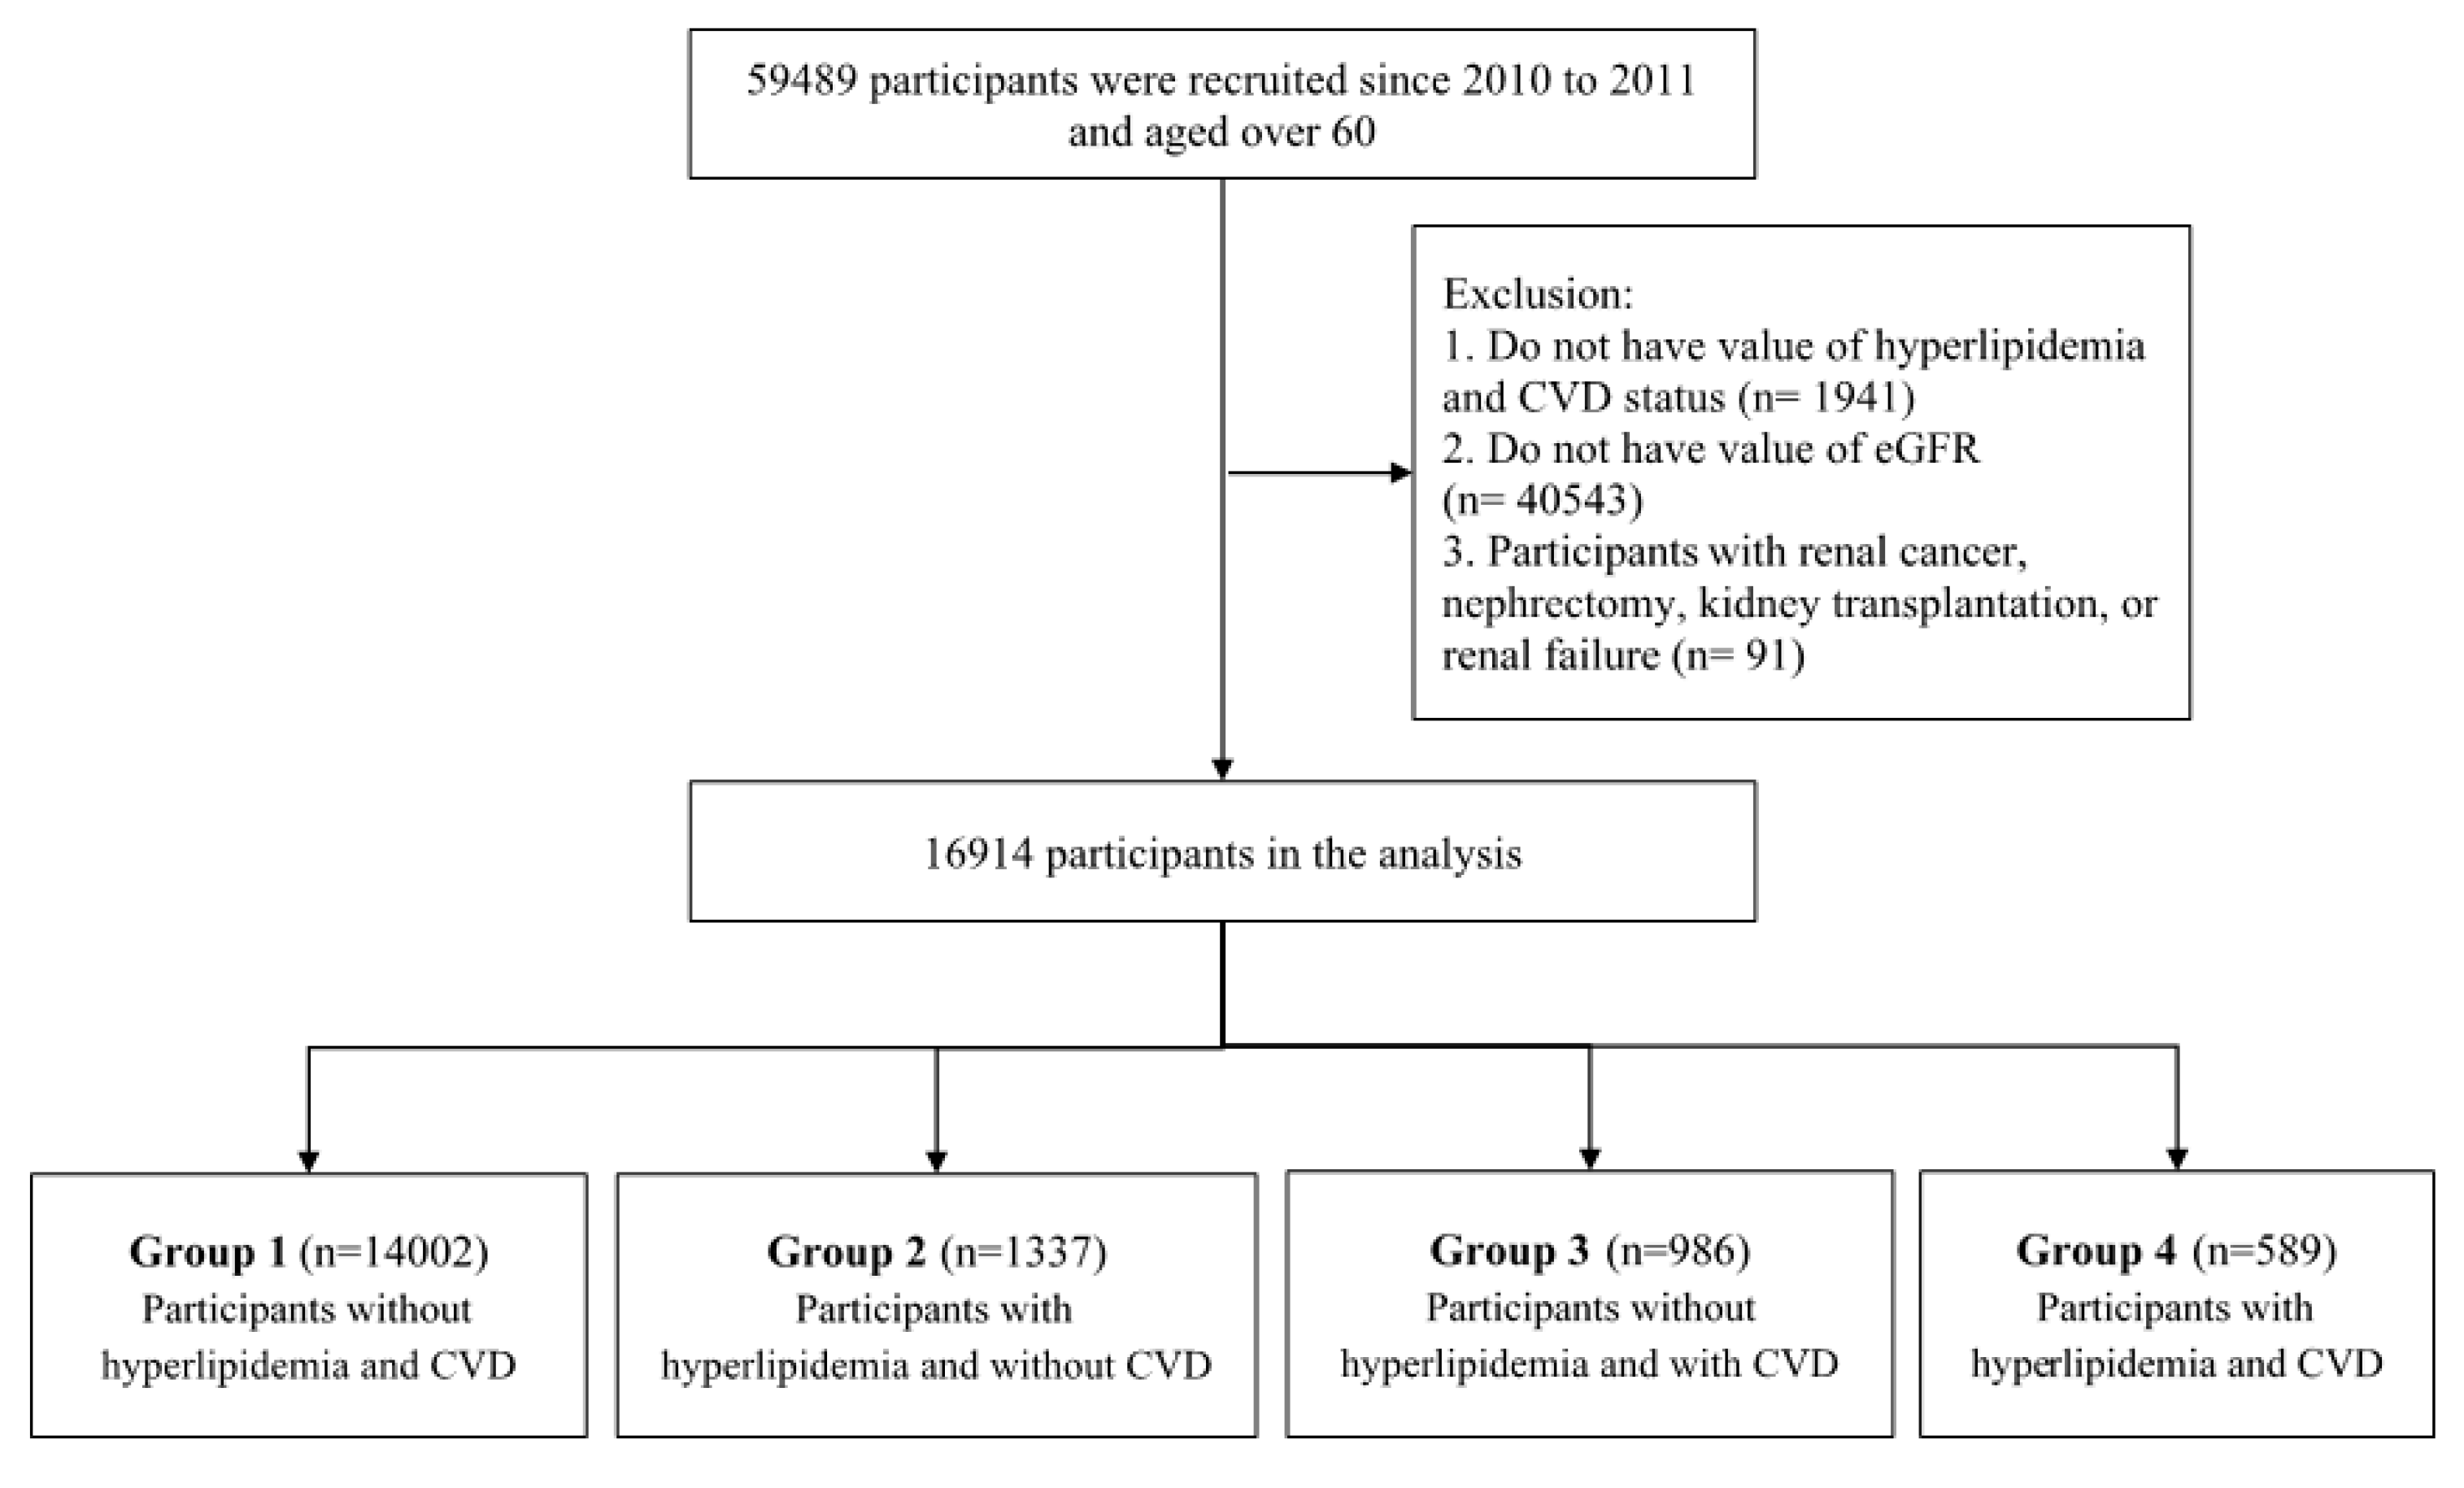
2.1. Population and Definition
2.2. Data Extraction
2.3. Statistical Analysis
3. Results
3.1. Clinical Characteristics of the Study Population
3.2. The Association of Laboratory Values, Comorbidity, and Future Risk of CKD
4. Discussion
5. Conclusions
Author Contributions
Funding
Acknowledgments
Conflicts of Interest
References
- Siemens, T.A.; Riella, M.C.; De Moraes, T.P.; Riella, C.V. APOL1 risk variants and kidney disease: What we know so far. Braz. J. Nephrol. 2018, 40, 388–402. [Google Scholar] [CrossRef] [PubMed]
- Takemoto, Y.; Naganuma, T. Economic Issues of Chronic Kidney Disease and End-Stage Renal Disease. Contrib. Nephrol. 2019, 198, 87–93. [Google Scholar] [CrossRef] [PubMed]
- Kuo, H.-W.; Tsai, S.-S.; Tiao, M.-M.; Yang, C.-Y. Epidemiological Features of CKD in Taiwan. Am. J. Kidney Dis. 2007, 49, 46–55. [Google Scholar] [CrossRef] [PubMed]
- National Institutes of Health. National Institute of Diabetes and Digestive and Kidney Diseases: U.S. Renal Data System. In USRDS 2013 Annual Data Report: Atlas of Chronic Kidney Disease and End-Stage Renal Disease in the United States; National Institutes of Health: Bethesda, MD, USA, 2013. [Google Scholar]
- Subbiah, A.K.; Chhabra, Y.K.; Mahajan, S. Cardiovascular disease in patients with chronic kidney disease: A neglected subgroup. Hear. Asia 2016, 8, 56–61. [Google Scholar] [CrossRef] [PubMed] [Green Version]
- Siddiqi, N.; Sharabas, I. Cardiovascular disease risk profiles comparison among dialysis patients. Saudi J. Kidney Dis. Transplant. 2016, 27, 692. [Google Scholar] [CrossRef]
- Sarnak, M.J.; Levey, A.S.; Schoolwerth, A.C.; Coresh, J.; Culleton, B.; Hamm, L.L.; McCullough, P.A.; Kasiske, B.L.; Kelepouris, E.; Klag, M.J.; et al. Kidney Disease as a Risk Factor for Development of Cardiovascular Disease. Circulation 2003, 108, 2154–2169. [Google Scholar] [CrossRef]
- Dounousi, E.; Duni, A.; Marinaki, S.; Boletis, J.N. Framing and managing cardiovascular risk in chronic kidney disease: From native to transplanted kidney. Contin. Cardiol. Educ. 2017, 3, 70–77. [Google Scholar] [CrossRef] [Green Version]
- Stenvinkel, P.; Carrero, J.J.; Axelsson, J.; Lindholm, B.; Heimbürger, O.; Massy, Z. Emerging Biomarkers for Evaluating Cardiovascular Risk in the Chronic Kidney Disease Patient: How Do New Pieces Fit into the Uremic Puzzle? Clin. J. Am. Soc. Nephrol. 2008, 3, 505–521. [Google Scholar] [CrossRef] [Green Version]
- Sarnak, M.J.; Amann, K.; Bangalore, S.; Cavalcante, J.L.; Charytan, D.M.; Craig, J.C.; Gill, J.S.; Hlatky, M.A.; Jardine, A.G.; Landmesser, U.; et al. Chronic Kidney Disease and Coronary Artery Disease. J. Am. Coll. Cardiol. 2019, 74, 1823–1838. [Google Scholar] [CrossRef]
- Bulbul, M.C.; Dağel, T.; Afsar, B.; Ulusu, N.N.; Kuwabara, M.; Covic, A.; Kanbay, M. Disorders of Lipid Metabolism in Chronic Kidney Disease. Blood Purif. 2018, 46, 144–152. [Google Scholar] [CrossRef]
- Mineo, C.; Deguchi, H.; Griffin, J.H.; Shaul, P. Endothelial and Antithrombotic Actions of HDL. Circ. Res. 2006, 98, 1352–1364. [Google Scholar] [CrossRef] [PubMed] [Green Version]
- Vaziri, N.D. Causes of dysregulation of lipid metabolism in chronic renal failure. Semin. Dial. 2009, 22, 644–651. [Google Scholar] [CrossRef] [PubMed]
- Li, P.K.-T.; Weening, J.J.; Dirks, J.; Lui, S.L.; Szeto, C.C.; Tang, S.; Atkins, R.C.; Mitch, W.E.; Chow, K.M.; D’Amico, G.; et al. A report with consensus statements of the International Society of Nephrology 2004 Consensus Workshop on Prevention of Progression of Renal Disease, Hong Kong, 29 June 2004. Kidney Int. 2005, 67, S2–S7. [Google Scholar] [CrossRef] [PubMed] [Green Version]
- Meisinger, C.; Döring, A.; Löwel, H. Chronic kidney disease and risk of incident myocardial infarction and all-cause and cardiovascular disease mortality in middle-aged men and women from the general population. Eur. Hear. J. 2006, 27, 1245–1250. [Google Scholar] [CrossRef] [Green Version]
- Bongard, V.; Dallongeville, J.; Arveiler, D.; Ruidavets, J.B.; Cottel, D.; Wagner, A.; Ferrieres, J. Assessment and characteristics of chronic renal insufficiency in France. Ann. Cardiol. Angeiol. 2012, 61, 239–244. [Google Scholar] [CrossRef] [PubMed]
- Gayoso-Diz, P.; Otero-González, A.; Rodríguez-Álvarez, M.X.; García, F.; González-Quintela, A.; De Francisco, A.L.M. Strategy to estimate risk progression of chronic kidney disease, cardiovascular risk, and referral to nephrology: The EPIRCE Study. Nefrologia 2013, 33, 223–230. [Google Scholar]
- Li, J.; Atasoy, S.; Fang, X.; Angerer, P.; Ladwig, K.-H. Combined effect of work stress and impaired sleep on coronary and cardiovascular mortality in hypertensive workers: The MONICA/KORA cohort study. Eur. J. Prev. Cardiol. 2019, 2047487319839183. [Google Scholar] [CrossRef]
- He, W.; Goodkind, D.; Kowal, P. An Aging World: 2015, International Population Reports; US Government Printing Office: Washington, DC, USA, 2016.
- Chen, Y.-T.; Shih, C.-J.; Ou, S.-M.; Hung, S.-C.; Lin, C.-H.; Tarng, D.-C.; Taiwan Geriatric Kidney Disease (TGKD) Research Group. Periodontal Disease and Risks of Kidney Function Decline and Mortality in Older People: A Community-Based Cohort Study. Am. J. Kidney Dis. 2015, 66, 223–230. [Google Scholar] [CrossRef]
- Ou, S.-M.; Chen, Y.-T.; Shih, C.-J.; Tarng, D.-C. Impact of physical activity on the association between lipid profiles and mortality among older people. Sci. Rep. 2017, 7, 1–9. [Google Scholar] [CrossRef] [Green Version]
- Tseng, T.-J.; Wu, Y.-S.; Tang, J.-H.; Chiu, Y.-H.; Lee, Y.-T.; Fan, I.-C.; Chan, T.-C. Association between health behaviors and mood disorders among the elderly: A community-based cohort study. BMC Geriatr. 2019, 19, 60. [Google Scholar] [CrossRef] [Green Version]
- Tseng, W.-C.; Chen, Y.-T.; Lin, Y.-P.; Ou, S.-M.; Yang, C.-Y.; Lin, C.-H.; Tarng, D.-C.; the Taiwan Geriatric Kidney Disease (TGKD) Research Group. Hyperuricemia Predicts an Early Decline in Renal Function among Older People: A Community-Based Cohort Study. Sci. Rep. 2019, 9, 1–10. [Google Scholar] [CrossRef] [PubMed]
- Matsushita, K.; Mahmoodi, B.K.; Woodward, M.; Emberson, J.R.; Jafar, T.H.; Jee, S.H.; Polkinghorne, K.R.; Shankar, A.; Smith, D.H.; Tonelli, M.; et al. Comparison of Risk Prediction Using the CKD-EPI Equation and the MDRD Study Equation for Estimated Glomerular Filtration Rate. JAMA 2012, 307, 1941–1951. [Google Scholar] [CrossRef] [PubMed] [Green Version]
- National Kidney Foundation. K/DOQI clinical practice guidelines for chronic kidney disease: Evaluation, classification, and stratification. Am. J. Kidney Dis. 2002, 39, S1–S266. [Google Scholar]
- Levey, A.S.; Bosch, J.P.; Lewis, J.B.; Greene, T.; Rogers, N.; Roth, D.R. A More Accurate Method To Estimate Glomerular Filtration Rate from Serum Creatinine: A New Prediction Equation. Ann. Intern. Med. 1999, 130, 461–470. [Google Scholar] [CrossRef] [PubMed]
- Lim, W.-H.; Choi, E.-K.; Han, K.-D.; Rhee, T.-M.; Lee, H.-J.; Lee, S.-R.; Kang, S.-H.; Cha, M.-J.; Oh, S. Proteinuria Detected by Urine Dipstick Test as a Risk Factor for Atrial Fibrillation: A Nationwide Population-Based Study. Sci. Rep. 2017, 7, 1–10. [Google Scholar] [CrossRef]
- Neugarten, J.; Acharya, A.; Silbiger, S.R. Effect of gender on the progression of nondiabetic renal disease: A meta-analysis. J. Am. Soc. Nephrol. JASN 2000, 11, 319–329. [Google Scholar]
- Yamagata, K.; Ishida, K.; Sairenchi, T.; Takahashi, H.; Ohba, S.; Shiigai, T.; Narita, M.; Koyama, A.H. Risk factors for chronic kidney disease in a community-based population: A 10-year follow-up study. Kidney Int. 2007, 71, 159–166. [Google Scholar] [CrossRef] [Green Version]
- Leehey, D.J.; Moinuddin, I.; Bast, J.P.; Qureshi, S.; Jelinek, C.S.; Cooper, C.; Edwards, L.C.; Smith, B.M.; Collins, E.G. Aerobic exercise in obese diabetic patients with chronic kidney disease: A randomized and controlled pilot study. Cardiovasc. Diabetol. 2009, 8, 62–68. [Google Scholar] [CrossRef] [Green Version]
- Schori, D.; Hofmann, K.; Abel, T. Social inequality and smoking in young Swiss men: Intergenerational transmission of cultural capital and health orientation. Int. J. Public Health 2013, 59, 261–270. [Google Scholar] [CrossRef]
- Bonevski, B.; Paul, C.; Jones, A.; Bisquera, A.; Regan, T. Smoky homes: Gender, socioeconomic and housing disparities in second hand tobacco smoke (SHS) exposure in a large population-based Australian cohort. Prev. Med. 2014, 60, 95–101. [Google Scholar] [CrossRef]
- Giang, K.B.; Van Minh, H.; Allebeck, P. Alcohol consumption and household expenditure on alcohol in a rural district in Vietnam. Glob. Health Action 2013, 6, 18937. [Google Scholar] [CrossRef] [PubMed]
- Pilić, L.; Dzakula, A. [Socioeconomic status and risky health behaviors in Croatian adult population]. Acta Med. Croat. Cas. Hravatske Akad. Med. Znan. 2013, 67, 25–35. [Google Scholar]
- Huang, H.-L.; Lee, C.-H.; Yen, Y.-Y.; Chen, T.; Chen, F.-L.; Ho, P.-S.; Lai, T.-C.; Tsai, W.-L.; Hsu, C.-C. School-level contextual factors associated with betel quid chewing among schoolchildren in Taiwan. Commun. Dent. Oral Epidemiol. 2009, 37, 58–67. [Google Scholar] [CrossRef] [PubMed]
- Xia, J.; Wang, L.; Ma, Z.; Zhong, L.; Wang, Y.; Gao, Y.; He, L.; Su, X. Cigarette smoking and chronic kidney disease in the general population: A systematic review and meta-analysis of prospective cohort studies. Nephrol. Dial. Transplant. 2017, 32, 475–487. [Google Scholar] [CrossRef] [PubMed]
- Kang, I.-M.; Chou, C.-Y.; Tseng, Y.-H.; Huang, C.-C.; Ho, W.-Y.; Shih, C.-M.; Chen, W. Association Between Betelnut Chewing and Chronic Kidney Disease in Adults. J. Occup. Environ. Med. 2007, 49, 776–779. [Google Scholar] [CrossRef]
- Lee, M.-S.; Lin, S.-C.; Chang, H.-Y.; Lyu, L.-C.; Tsai, K.; Pan, W.-H. High prevalence of hyperuricemia in elderly Taiwanese. Asia Pac. J. Clin. Nutr. 2005, 14, 285–292. [Google Scholar]
- Liu, W.-C.; Hung, C.-C.; Chen, S.-C.; Yeh, S.-M.; Lin, M.-Y.; Chiu, Y.-W.; Kuo, M.-C.; Chang, J.-M.; Hwang, S.-J.; Chen, H.-C. Association of Hyperuricemia with Renal Outcomes, Cardiovascular Disease, and Mortality. Clin. J. Am. Soc. Nephrol. 2012, 7, 541–548. [Google Scholar] [CrossRef] [Green Version]
- Yang, C.-W.; Harris, D.C.; Luyckx, V.A.; Nangaku, M.; Hou, F.F.; Garcia, G.G.; Abu-Aisha, H.; Niang, A.; Sola, L.; Bunnag, S.; et al. Global case studies for chronic kidney disease/end-stage kidney disease care. Kidney Int. Suppl. 2020, 10, e24–e48. [Google Scholar] [CrossRef]
- Golmohammadi, S.; Tavasoli, M.; Asadi, N. Prevalence and Risk Factors of Hyperuricemia in Patients with Chronic Kidney Disease and Non-Alcoholic Fatty Liver. Clin. Exp. Gastroenterol. 2020, 13, 299–304. [Google Scholar] [CrossRef]
- Flessner, M.F.; Wyatt, S.B.; Akylbekova, E.L.; Coady, S.; Fulop, T.; Lee, F.; Taylor, H.A.; Crook, E. Prevalence and Awareness of CKD Among African Americans: The Jackson Heart Study. Am. J. Kidney Dis. 2009, 53, 238–247. [Google Scholar] [CrossRef] [Green Version]
- Tuot, D.S.; Plantinga, L.C.; Hsu, C.-Y.; Jordan, R.; Burrows, N.R.; Hedgeman, E.; Yee, J.; Saran, R.; Powe, N.R.; Centers for Disease Control Chronic Kidney Disease Surveillance Team. Chronic kidney disease awareness among individuals with clinical markers of kidney dysfunction. Clin. J. Am. Soc. Nephrol. 2011, 6, 1838–1844. [Google Scholar] [CrossRef] [PubMed] [Green Version]
- Liang, X.; Ye, M.; Tao, M.; Zheng, D.; Cai, R.; Zhu, Y.; Jin, J.; He, Q. The association between dyslipidemia and the incidence of chronic kidney disease in the general Zhejiang population: A retrospective study. BMC Nephrol. 2020, 21, 252. [Google Scholar] [CrossRef] [PubMed]
- Liu, M.; Zhang, P.; Lu, L.; Cao, Y.; Sun, R.-R.; Chen, S.; Zhang, P.-Y. Cardiovascular disease and its relationship with chronic kidney disease. Eur. Rev. Med. Pharmacol. Sci. 2014, 18, 2918–2926. [Google Scholar] [PubMed]
- Wahba, I.M.; Mak, R.H. Obesity and Obesity-Initiated Metabolic Syndrome: Mechanistic Links to Chronic Kidney Disease. Clin. J. Am. Soc. Nephrol. 2007, 2, 550–562. [Google Scholar] [CrossRef] [Green Version]

| Variables | Total a (n = 16,914) |
|---|---|
| Demographics | |
| Age, years | 74.9 ± 6.74 |
| Gender | |
| Female | 9381 (55.46%) |
| Male | 7533 (44.54%) |
| Marital status | |
| Married/cohabiting | 12,528 (74.07%) |
| Widowed/divorced/separated | 3704 (21.89%) |
| Never married | 664 (3.93%) |
| Missing value | 18 (0.11%) |
| BMI b level, kg/m2 | |
| Underweight | 754 (4.46%) |
| Normal | 8242 (48.73%) |
| Overweight | 5033 (29.76%) |
| Obese | 2741 (16.20%) |
| Missing value | 144 (0.85%) |
| Socioeconomics | |
| Educational attainment | |
| With high school diploma or higher degree | 9607 (56.80%) |
| Without high school diploma | 7307 (43.20%) |
| Income level | |
| Not poor | 16,519 (97.66%) |
| Poor | 395 (2.34%) |
| Lifestyle | |
| Exercise habit | |
| No | 2522 (14.91%) |
| Occasional | 5694 (33.67%) |
| Regular | 6475 (38.28%) |
| Missing value | 2223 (13.14%) |
| Alcohol drinking | |
| No | 13,804 (81.61%) |
| Yes | 3088 (18.26%) |
| Missing value | 22 (0.13%) |
| Current smoking | |
| No | 16,109 (95.24%) |
| Yes | 784 (4.64%) |
| Missing value | 21 (0.12%) |
| Betel nut chewing | |
| No | 16,804 (99.35%) |
| Yes | 65 (0.38%) |
| Missing value | 45 (0.27%) |
| Comorbidity c | |
| Hypertension | 1377 (8.14%) |
| Diabetes | 496 (2.93%) |
| Hyperlipidemia | 1926 (11.39%) |
| Hyperuricemia/gout | 1213 (7.17%) |
| Urinary tract stones | 47 (0.28%) |
| CVD | 1575 (9.31%) |
| Cancer | 4029 (23.82%) |
| Laboratory examinations | |
| Fasting glucose, mg/dL | 101.4 ± 20.69 |
| Total cholesterol, mg/dL | 190.1 ± 33.70 |
| Triglyceride, mg/dL | 115.7 ± 69.23 |
| HDL, mg/dL | 55.1 ± 15.19 |
| Uric acid, mg/dL | 5.7 ± 1.57 |
| BUN, mg/dL | 17.2 ± 6.11 |
| Creatinine, mg/dL | 0.9 ± 0.75 |
| Triglyceride/HDL, ratio | 2.4 ± 2.25 |
| ratio < 3.29 | 13,374 (79.07%) |
| ratio ≥ 3.29 | 3411 (20.17%) |
| Proteinuria | 2818 (16.66%) |
| Group 1 | Group 2 | Group 3 | Group 4 | |||||||||
|---|---|---|---|---|---|---|---|---|---|---|---|---|
| Low eGFR | High eGFR | p-Value | Low eGFR | High eGFR | p-Value | Low eGFR | High eGFR | p-Value | Low eGFR | High eGFR | p-Value | |
| (n = 3450) | (n = 10,552) | (n = 231) | (n = 1106) | (n = 215) | (n = 771) | (n = 120) | (n = 469) | |||||
| Demographics | ||||||||||||
| Age, years | 77.9 ± 7.04 | 74.1 ± 6.52 | <0.0001a | 75.1 ± 6.00 | 72.7 ± 5.20 | <0.0001a | 77.9 ± 6.71 | 75.1 ± 6.76 | <0.0001a | 76.9 ± 6.54 | 73.2 ± 5.37 | <0.0001a |
| Gender (%) | <0.0001b | 0.04b | 0.77 b | 0.15 b | ||||||||
| Female | 1731 (50.17%) | 5965 (56.53%) | 139 (60.17%) | 745 (67.36%) | 99 (46.05%) | 366 (47.47%) | 61 (50.83%) | 275 (58.64%) | ||||
| Male | 1719 (49.83%) | 4587 (43.47%) | 92 (39.83%) | 361 (32.64%) | 116 (53.95%) | 405 (52.53%) | 59 (49.17%) | 194 (41.36%) | ||||
| Marital status (%) | <0.0001b | 0.34 b | 0.04b | 0.40 b | ||||||||
| Married/cohabiting | 2401 (69.59%) | 7861 (74.50%) | 192 (83.12%) | 882 (79.75%) | 145 (67.44%) | 583 (75.62%) | 90 (75.00%) | 374 (79.75%) | ||||
| Widowed/divorced/separated | 888 (25.74%) | 2239 (21.22%) | 37 (16.02%) | 200 (18.08%) | 62 (28.84%) | 161 (20.88%) | 29 (24.17%) | 88 (18.76%) | ||||
| Never married | 156 (4.52%) | 440 (4.17%) | 2 (0.86%) | 24 (2.17%) | 8 (3.72%) | 26 (3.37%) | 1 (0.83%) | 7 (1.49%) | ||||
| Missing value | 5 (0.15%) | 12 (0.11%) | 0 (0%) | 0 (0%) | 0 (0%) | 1 (0.13%) | 0 (0%) | 0 (0%) | ||||
| BMI c level (%) | <0.0001b | 0.02b | 0.001b | 0.47 b | ||||||||
| Underweight | 154 (4.46%) | 496 (4.70%) | 6 (2.60%) | 43 (3.89%) | 12 (5.58%) | 31 (4.02%) | 2 (1.67%) | 10 (2.13%) | ||||
| Normal | 1518 (44.00%) | 5324 (50.45%) | 95 (41.13%) | 547 (49.46%) | 85 (39.53%) | 401 (52.01%) | 48 (40.00%) | 224 (47.76%) | ||||
| Overweight | 1056 (30.61%) | 3063 (29.03%) | 81 (35.06%) | 351 (31.73%) | 69 (32.09%) | 231 (29.96%) | 42 (35.00%) | 140 (29.85%) | ||||
| Obese | 686 (19.89%) | 1574 (14.92%) | 49 (21.21%) | 162 (14.65%) | 48 (22.33%) | 102 (13.23%) | 27 (22.50%) | 93 (19.83%) | ||||
| Missing value | 36 (1.04%) | 95 (0.90%) | 0 (0%) | 3 (0.27%) | 1 (0.47%) | 6 (0.78%) | 1 (0.83%) | 2 (0.43%) | ||||
| Socioeconomics | ||||||||||||
| Educational attainment (%) | <0.0001b | 0.08 b | 0.64 b | 0.38 b | ||||||||
| With high school diploma or higher degree | 1671 (48.43%) | 5870 (55.63%) | 152 (65.80%) | 794 (71.79%) | 149 (69.30%) | 519 (67.32%) | 88 (73.33%) | 364 (77.61%) | ||||
| Without high school diploma | 1779 (51.57%) | 4682 (44.37%) | 79 (34.20%) | 312 (28.21%) | 66 (30.70%) | 252 (32.68%) | 32 (26.67%) | 105 (22.39%) | ||||
| Income level (%) | <0.0001b | 0.14 b | 0.80 b | 0.50 b | ||||||||
| Not poor | 3313 (96.03%) | 10,324 (97.84%) | 229 (99.13%) | 1104 (99.82%) | 209 (97.21%) | 754 (97.80%) | 119 (99.17%) | 467 (99.57%) | ||||
| Poor | 137 (3.97%) | 228 (2.16%) | 2 (0.87%) | 2 (0.18%) | 6 (2.79%) | 17 (2.20%) | 1 (0.83%) | 2 (0.43%) | ||||
| Lifestyle | ||||||||||||
| Exercise habit (%) | 0.09 b | 0.85 b | 0.54 b | 0.05 b | ||||||||
| No | 447 (12.96%) | 1656 (15.69%) | 26 (11.25%) | 172 (15.55%) | 24 (11.16%) | 113 (14.66%) | 15 (12.50%) | 69 (14.71%) | ||||
| Occasional | 1088 (31.54%) | 3756 (35.60%) | 57 (24.68%) | 330 (29.84%) | 62 (28.84%) | 234 (30.35%) | 37 (30.83%) | 130 (27.72%) | ||||
| Regular | 1111 (32.20%) | 4263 (40.40%) | 70 (30.30%) | 438 (39.60%) | 69 (32.09%) | 317 (41.11%) | 26 (21.67%) | 181 (38.59%) | ||||
| Missing value | 804 (23.30%) | 877 (8.31%) | 78 (33.77%) | 166 (15.01%) | 60 (27.91%) | 107 (13.88%) | 42 (35.00%) | 89 (18.98%) | ||||
| Alcohol drinking (%) | 0.32 b | 0.78 b | 0.48 b | 0.18 b | ||||||||
| No | 2813 (81.54%) | 8682 (82.28%) | 187 (80.95%) | 882 (79.75%) | 164 (76.28%) | 607 (78.73%) | 90 (75.00%) | 379 (80.81%) | ||||
| Yes | 633 (18.35%) | 1856 (17.59%) | 44 (19.05%) | 222 (20.07%) | 51 (23.72%) | 163 (21.14%) | 30 (25.00%) | 89 (18.98%) | ||||
| Missing value | 4 (0.11%) | 14 (0.13%) | 0 (0%) | 2 (0.18%) | 0 (0%) | 1 (0.13%) | 0 (0%) | 1 (0.21%) | ||||
| Current smoking (%) | 0.17 b | 0.62 b | 0.29 b | 0.56 b | ||||||||
| No | 3267 (94.70%) | 10,054 (95.28%) | 220 (95.24%) | 1062 (96.02%) | 208 (96.74%) | 729 (94.55%) | 115 (95.83%) | 454 (96.80%) | ||||
| Yes | 179 (5.19%) | 485 (4.60%) | 11 (4.76%) | 42 (3.80%) | 7 (3.26%) | 41 (5.32%) | 5 (4.17%) | 14 (2.99%) | ||||
| Missing value | 4 (0.11%) | 13 (0.12%) | 0 (0%) | 2 (0.18%) | 0 (0%) | 1 (0.13%) | 0 (0%) | 1 (0.21%) | ||||
| Betel nut chewing (%) | 0.43 b | NA | NA | 0.37 b | ||||||||
| No | 3431 (99.45%) | 10,477 (99.29%) | 231 (100%) | 1099 (99.37%) | 214 (99.53%) | 767 (99.48%) | 119 (99.17%) | 466 (99.36%) | ||||
| Yes | 11 (0.32%) | 46 (0.44%) | 0 (0%) | 4 (0.36%) | 0 (0%) | 2 (0.26%) | 1 (0.83%) | 1 (0.21%) | ||||
| Missing value | 8 (0.23%) | 29 (0.27%) | 0 (0%) | 3 (0.27%) | 1 (0.47%) | 2 (0.26%) | 0 (0%) | 2 (0.43%) | ||||
| Comorbidityd | ||||||||||||
| Hypertension, yes (%) | 76 (2.20%) | 385 (3.65%) | <0.0001b | 65 (28.14%) | 333 (30.11%) | 0.61 b | 31 (14.42%) | 186 (24.12%) | 0.003b | 57 (47.50%) | 244 (52.03%) | 0.43 b |
| Diabetes, yes (%) | 20 (0.58%) | 117 (1.11%) | 0.01b | 33 (14.29%) | 115 (10.40%) | 0.11 b | 13 (6.05%) | 64 (8.30%) | 0.34 b | 32 (26.67%) | 102 (21.75%) | 0.31 b |
| Hyperuricemia/gout, yes (%) | 446 (12.93%) | 511 (4.84%) | <0.0001b | 36 (15.58%) | 62 (5.61%) | <0.0001b | 25 (11.63%) | 40 (5.19%) | 0.001b | 41 (34.17%) | 52 (11.09%) | <0.0001b |
| Urinary tract stones, yes (%) | 9 (0.26%) | 21 (0.20%) | 0.64 b | 2 (0.87%) | 5 (0.45%) | 0.35 b | 1 (0.47%) | 5 (0.65%) | 1.00 b | 0 (0%) | 4 (0.85%) | 0.59 b |
| Cancer, yes (%) | 628 (18.20%) | 2677 (25.37%) | <0.0001b | 37 (16.02%) | 283 (25.59%) | 0.003b | 29 (13.49%) | 164 (21.27%) | 0.01b | 39 (32.50%) | 172 (36.67%) | 0.46 b |
| Laboratory examinations | ||||||||||||
| Fasting glucose, mg/dL | 103.5 ± 24.85 | 101 ± 19.77 | <0.0001a | 104.1 ± 20.93 | 99.1 ± 16.32 | 0.0002a | 100.9 ± 18.18 | 99.48 ± 16.77 | 0.61 a | 103.3 ± 23.19 | 101.4 ± 21.09 | 0.86 a |
| Total cholesterol, mg/dL | 187.6 ± 34.07 | 191.1 ± 33.41 | <0.0001a | 196.2 ± 34.53 | 199.1 ± 32.82 | 0.24 a | 182.5 ± 32.96 | 179.7 ± 32.04 | 0.27 a | 181.5 ± 34.72 | 184.1 ± 34.04 | 0.47 a |
| Triglyceride, mg/dL | 125.4 ± 72.85 | 110.7 ± 68.77 | <0.0001a | 140.6 ± 67.33 | 130.2 ± 67.90 | 0.003a | 116.5 ± 55.22 | 98.78 ± 49.62 | <0.0001a | 141.95 ± 72.72 | 129.8 ± 68.16 | 0.15 a |
| HDL, mg/dL | 52.8 ± 15.08 | 56.4 ± 15.26 | <0.0001a | 49.9 ± 13.65 | 54.3 ± 14.27 | <0.0001a | 54.22 ± 16.23 | 53.76 ± 14.62 | 0.88 a | 45.13 ± 13.86 | 50.68 ± 13.41 | <0.0001a |
| Uric acid, mg/dL | 6.5 ± 1.72 | 5.5 ± 1.46 | <0.0001a | 6.5 ± 1.80 | 5.5 ± 1.22 | <0.0001a | 6.475 ± 1.75 | 5.623 ± 1.34 | <0.0001a | 6.971 ± 1.66 | 5.671 ± 1.27 | <0.0001a |
| BUN, mg/dL | 21.5 ± 8.73 | 15.9 ± 4.33 | <0.0001a | 20.5 ± 6.60 | 15.77 ± 3.86 | <0.0001a | 20.48 ± 6.50 | 16.25 ± 4.23 | <0.0001a | 24.65 ± 9.83 | 15.77 ± 3.97 | <0.0001a |
| Creatinine, mg/dL | 1.3 ± 0.62 | 0.9 ± 0.83 | <0.0001a | 1.2 ± 0.32 | 0.8 ± 0.16 | <0.0001a | 1.288 ± 0.36 | 0.8855 ± 0.18 | <0.0001a | 1.409 ± 0.55 | 0.8494 ± 0.17 | <0.0001a |
| Triglyceride/HDL, ratio | 2.7 ± 2.30 | 2.2 ± 2.22 | <0.0001a | 3.2 ± 2.28 | 2.7 ± 2.12 | <0.0001a | 2.4928 ± 1.77 | 2.1281 ± 2.11 | 0.001a | 103.3 ± 23.19 | 101.4 ± 21.09 | 0.003a |
| ratio < 3.29 | 2441 (70.75%) | 8746 (82.88%) | <0.0001b | 144 (62.34%) | 828 (74.86%) | 0.002b | 162 (75.35%) | 660 (85.60%) | 0.004b | 3.7777 ± 3.18 | 2.9107 ± 2.10 | 0.05 b |
| ratio ≥ 3.29 | 897 (26.00%) | 1802 (17.08%) | 80 (34.63%) | 278 (25.14%) | 48 (22.33%) | 111 (14.40%) | 70 (58.33%) | 323 (68.87%) | ||||
| Proteinuria, yes (%) | 887 (25.71%) | 1322 (12.53%) | <0.0001b | 73 (31.60%) | 176 (15.91%) | <0.0001b | 72 (33.49%) | 132 (17.12%) | <0.0001b | 49 (40.83%) | 146 (31.13%) | <0.0001b |
| Group 1 | Group 2 | Group 3 | Group 4 | |
|---|---|---|---|---|
| OR (95% CI) | OR (95% CI) | OR (95% CI) | OR (95% CI) | |
| Demographics | ||||
| Age | 1.08 (1.08–1.09) | 1.08 (1.05–1.11) | 1.06 (1.04–1.08) | 1.11 (1.08–1.15) |
| Gender | ||||
| Male (vs. female) | 1.29 (1.19–1.39) | 1.37 (1.02–1.83) | 1.06 (0.78–1.44) | 1.37 (0.92–2.05) |
| Marital status | ||||
| Married/cohabiting | 1 | 1 | 1 | 1 |
| Widowed/divorced/separated | 1.29 (1.19–1.42) | 0.85 (0.57–1.24) | 1.55 (1.09–2.18) | 1.37 (0.84–2.19) |
| Never married | 1.16 (0.96–1.39) | 0.38 (0.06–1.30) | 1.23 (0.51–2.67) | 0.59 (0.03–3.39) |
| BMI a level | ||||
| Normal weight | 1 | 1 | 1 | 1 |
| Underweight | 1.09 (0.89–1.31) | 0.80 (0.30–1.81) | 1.82 (0.87–3.62) | 0.93 (0.14–3.69) |
| Overweight | 1.21 (1.11–1.32) | 1.33 (0.95–1.84) | 1.41 (0.99–2.01) | 1.40 (0.88–2.23) |
| Obese | 1.53 (1.37–1.69) | 1.74 (1.18–2.55) | 2.22 (1.46–3.36) | 1.36 (0.79–2.29) |
| Socioeconomics | ||||
| Educational attainment | ||||
| Without high school diploma school (vs. with high school diploma or higher) | 1.34 (1.24–1.44) | 1.32 (0.98–1.78) | 0.91 (0.66–1.26) | 1.26 (0.79–1.98) |
| Income level | ||||
| Poor (vs. not poor) | 1.87 (1.51–2.32) | 4.82 (0.58–40.35) | 1.27 (0.46–3.11) | 1.96 (0.09–20.65) |
| Lifestyle | ||||
| Exercise habit | ||||
| Regular | 1 | 1 | 1 | 1 |
| No | 1.04 (0.92–1.17) | 0.95 (0.58–1.52) | 0.98 (0.58–1.61) | 1.51 (0.74–2.99) |
| Occasional | 1.11 (1.01–1.22) | 1.08 (0.74–1.58) | 1.21 (0.83–1.78) | 1.98 (1.15–3.46) |
| Alcohol drinking (vs. no) | 1.05 (0.95–1.16) | 0.94 (0.65–1.33) | 1.16 (0.80–1.65) | 1.42 (0.88–2.26) |
| Current smoking (vs. no) | 1.14 (0.95–1.35) | 1.26 (0.61–2.41) | 0.59 (0.24–1.27) | 1.41 (0.45–3.77) |
| Betel nut chewing (vs. no) | 0.73 (0.36–1.36) | NA | NA | 3.92 (0.15–99.51) |
| Comorbidity b | ||||
| Hypertension (vs. no) | 0.59 (0.46–0.76) | 0.91 (0.66–1.24) | 0.53 (0.35–0.79) | 0.83 (0.56–1.25) |
| Diabetes (vs. no) | 0.52 (0.31–0.82) | 1.44 (0.94–2.16) | 0.71 (0.37–1.28) | 1.31 (0.82–2.06) |
| Hyperuricemia/gout (vs. no) | 2.92 (2.55–3.33) | 3.11 (1.99–4.79) | 2.41 (1.41–4.04) | 4.16 (2.58–6.69) |
| Urinary tract stones (vs. no) | 1.31 (0.57–2.78) | 1.92 (0.27–8.98) | 0.72 (0.04–4.47) | NA |
| Cancer (vs. no) | 0.66 (0.59–0.72) | 0.56 (0.38–0.79) | 0.58 (0.37–0.87) | 0.83 (0.54–1.27) |
| Laboratory examinations | ||||
| Fasting glucose, mg/dL | 1.01 (1.00–1.01) | 1.01 (1.01–1.02) | 1.01 (0.99–1.01) | 1.00 (0.99–1.01) |
| Total cholesterol, mg/dL | 0.99 (0.99–0.99) | 0.99 (0.99–1.00) | 1.00 (0.99–1.01) | 0.99 (0.99–1.00) |
| Triglyceride, mg/dL | 1.00 (1.00–1.00) | 1.00 (1.00–1.00) | 1.01 (1.00–1.01) | 1.00 (1.00–1.01) |
| HDL, mg/dL | 0.98 (0.98–0.99) | 0.98 (0.97–0.99) | 1.00 (0.99–1.01) | 0.97 (0.95–0.98) |
| Uric acid, mg/dL | 1.54 (1.49–1.59) | 1.67 (1.48–1.89) | 1.47 (1.31–1.66) | 1.88 (1.56–2.30) |
| BUN, mg/dL | 1.19 (1.19–1.21) | 1.21 (1.17–1.26) | 1.18 (1.14–1.23) | 1.25 (1.19–1.33) |
| Triglyceride/HDL, ratio | 1.11 (1.09–1.13) | 1.09 (1.03–1.16) | 1.08 (1.01–1.17) | 1.14 (1.05–1.23) |
| ratio ≥ 3.29 (vs. ratio <3.29) | 1.78 (1.63–1.96) | 1.66 (1.22–2.24) | 1.76 (1.19–2.56) | 1.55 (1.02–2.34) |
| Proteinuria (vs. no) | 2.43 (2.21–2.67) | 2.44 (1.77–3.36) | 2.43 (1.73–3.41) | 2.94 (1.93–4.49) |
| Group 1 | Group 2 | Group 3 | Group 4 | |
|---|---|---|---|---|
| aOR (95% CI) | aOR (95% CI) | aOR (95% CI) | aOR (95% CI) | |
| Demographics | ||||
| Age | 1.06 (1.05–1.07) | 1.06 (1.03–1.10) | 1.03 (0.99–1.06) | 1.04 (0.98–1.11) |
| Gender | ||||
| Male (vs. female) | 0.60 (0.53–0.68) | 0.65 (0.41–1.01) | ||
| Marital status | ||||
| Married/cohabiting | 1 | 1 | ||
| Widowed/divorced/separated | 1.07 (0.93–1.21) | 1.80 (1.15–2.82) | ||
| Never married | 1.04 (0.79–1.35) | 2.06 (0.79–4.96) | ||
| BMI a level | ||||
| Normal weight | 1 | 1 | 1 | |
| Underweight | 0.95 (0.71–1.25) | 1.01 (0.24–3.32) | 1.43 (0.55–3.45) | |
| Overweight | 1.10 (0.97–1.25) | 1.08 (0.69–1.69) | 1.09 (0.69–1.69) | |
| Obese | 1.13 (0.97–1.31) | 0.81 (0.46–1.39) | 1.26 (0.72–2.16) | |
| Socioeconomics | ||||
| Educational attainment | ||||
| Without high school diploma school (vs. with high school diploma or higher) | 1.16 (1.03–1.29) | |||
| Income level | ||||
| Poor (vs. not poor) | 1.12(0.82–1.51) | |||
| Lifestyle | ||||
| Exercise habit | ||||
| Regular | 1 | 1 | ||
| No | 1.09 (0.94–1.27) | 0.72 (0.22–2.18) | ||
| Occasional | 1.09 (0.97–1.22) | 2.39 (1.05–5.69) | ||
| Comorbidity b | ||||
| Hypertension (vs. no) | 0.44 (0.29–0.66) | 0.59 (0.32–1.04) | ||
| Diabetes (vs. no) | 0.92 (0.39–1.94) | |||
| Hyperuricemia/gout (vs. no) | 1.94 (1.60–2.35) | 2.06 (1.07–3.89) | 3.37 (1.57–7.27) | 0.88 (0.32–2.22) |
| Cancer (vs. no) | 0.90 (0.79–1.03) | 0.63 (0.38–1.03) | 0.65(0.36–1.12) | |
| Laboratory examinations | ||||
| Fasting glucose, mg/dL | 0.99 (0.99–1.01) | 1.01 (0.99–1.02) | ||
| Total cholesterol, mg/dL | 0.99 (0.99–1.00) | |||
| Triglyceride, mg/dL | 1.00 (1.00–1.00) | 1.00 (0.99–1.01) | 1.01 (1.00–1.02) | |
| HDL, mg/dL | 1.00 (0.99–1.01) | 0.99 (0.96–1.01) | 0.99 (0.95–1.02) | |
| Uric acid, mg/dL | 1.43 (1.38–1.49) | 1.29 (1.11–1.51) | 1.21 (1.06–1.38) | 1.57 (1.19–2.12) |
| BUN, mg/dL | 1.18 (1.17–1.19) | 1.17 (1.12–1.22) | 1.15 (1.10–1.21) | 1.27 (1.18–1.38) |
| Triglyceride/HDL, ratio | ||||
| ratio ≥ 3.29 (vs. ratio < 3.29) | 1.31 (1.09–1.55) | 0.87 (0.45–1.66) | 0.77 (0.37–1.55) | 0.83 (0.29–2.27) |
| Proteinuria (vs. no) | 1.70 (1.48–1.95) | 1.78 (1.11–2.81) | 1.32 (0.83–2.08) | 2.10 (0.98–4.51) |
Publisher’s Note: MDPI stays neutral with regard to jurisdictional claims in published maps and institutional affiliations. |
© 2020 by the authors. Licensee MDPI, Basel, Switzerland. This article is an open access article distributed under the terms and conditions of the Creative Commons Attribution (CC BY) license (http://creativecommons.org/licenses/by/4.0/).
Share and Cite
Chang, H.-J.; Lin, K.-R.; Chang, J.-L.; Lin, M.-T. Risk Factors for Chronic Kidney Disease in Older Adults with Hyperlipidemia and/or Cardiovascular Diseases in Taipei City, Taiwan: A Community-Based Cross-Sectional Analysis. Int. J. Environ. Res. Public Health 2020, 17, 8763. https://doi.org/10.3390/ijerph17238763
Chang H-J, Lin K-R, Chang J-L, Lin M-T. Risk Factors for Chronic Kidney Disease in Older Adults with Hyperlipidemia and/or Cardiovascular Diseases in Taipei City, Taiwan: A Community-Based Cross-Sectional Analysis. International Journal of Environmental Research and Public Health. 2020; 17(23):8763. https://doi.org/10.3390/ijerph17238763
Chicago/Turabian StyleChang, Horng-Jinh, Kuan-Reng Lin, Junn-Liang Chang, and Meng-Te Lin. 2020. "Risk Factors for Chronic Kidney Disease in Older Adults with Hyperlipidemia and/or Cardiovascular Diseases in Taipei City, Taiwan: A Community-Based Cross-Sectional Analysis" International Journal of Environmental Research and Public Health 17, no. 23: 8763. https://doi.org/10.3390/ijerph17238763