Uptake and Effects of Cylindrospermopsin: Biochemical, Physiological and Biometric Responses in The Submerged Macrophyte Egeria densa Planch


Abstract
:1. Introduction
2. Materials and Methods
2.1. Plant Material
2.2. Chemicals
2.3. Experimental Design
2.4. Analysis of CYN
2.5. Hydrogen Peroxide (H2O2) Determination
2.6. Enzyme Extraction and Activity Measurement
2.7. Photosynthetic Pigment Contents
2.8. Plant Growth Parameters
2.9. Statistical Analysis
3. Results
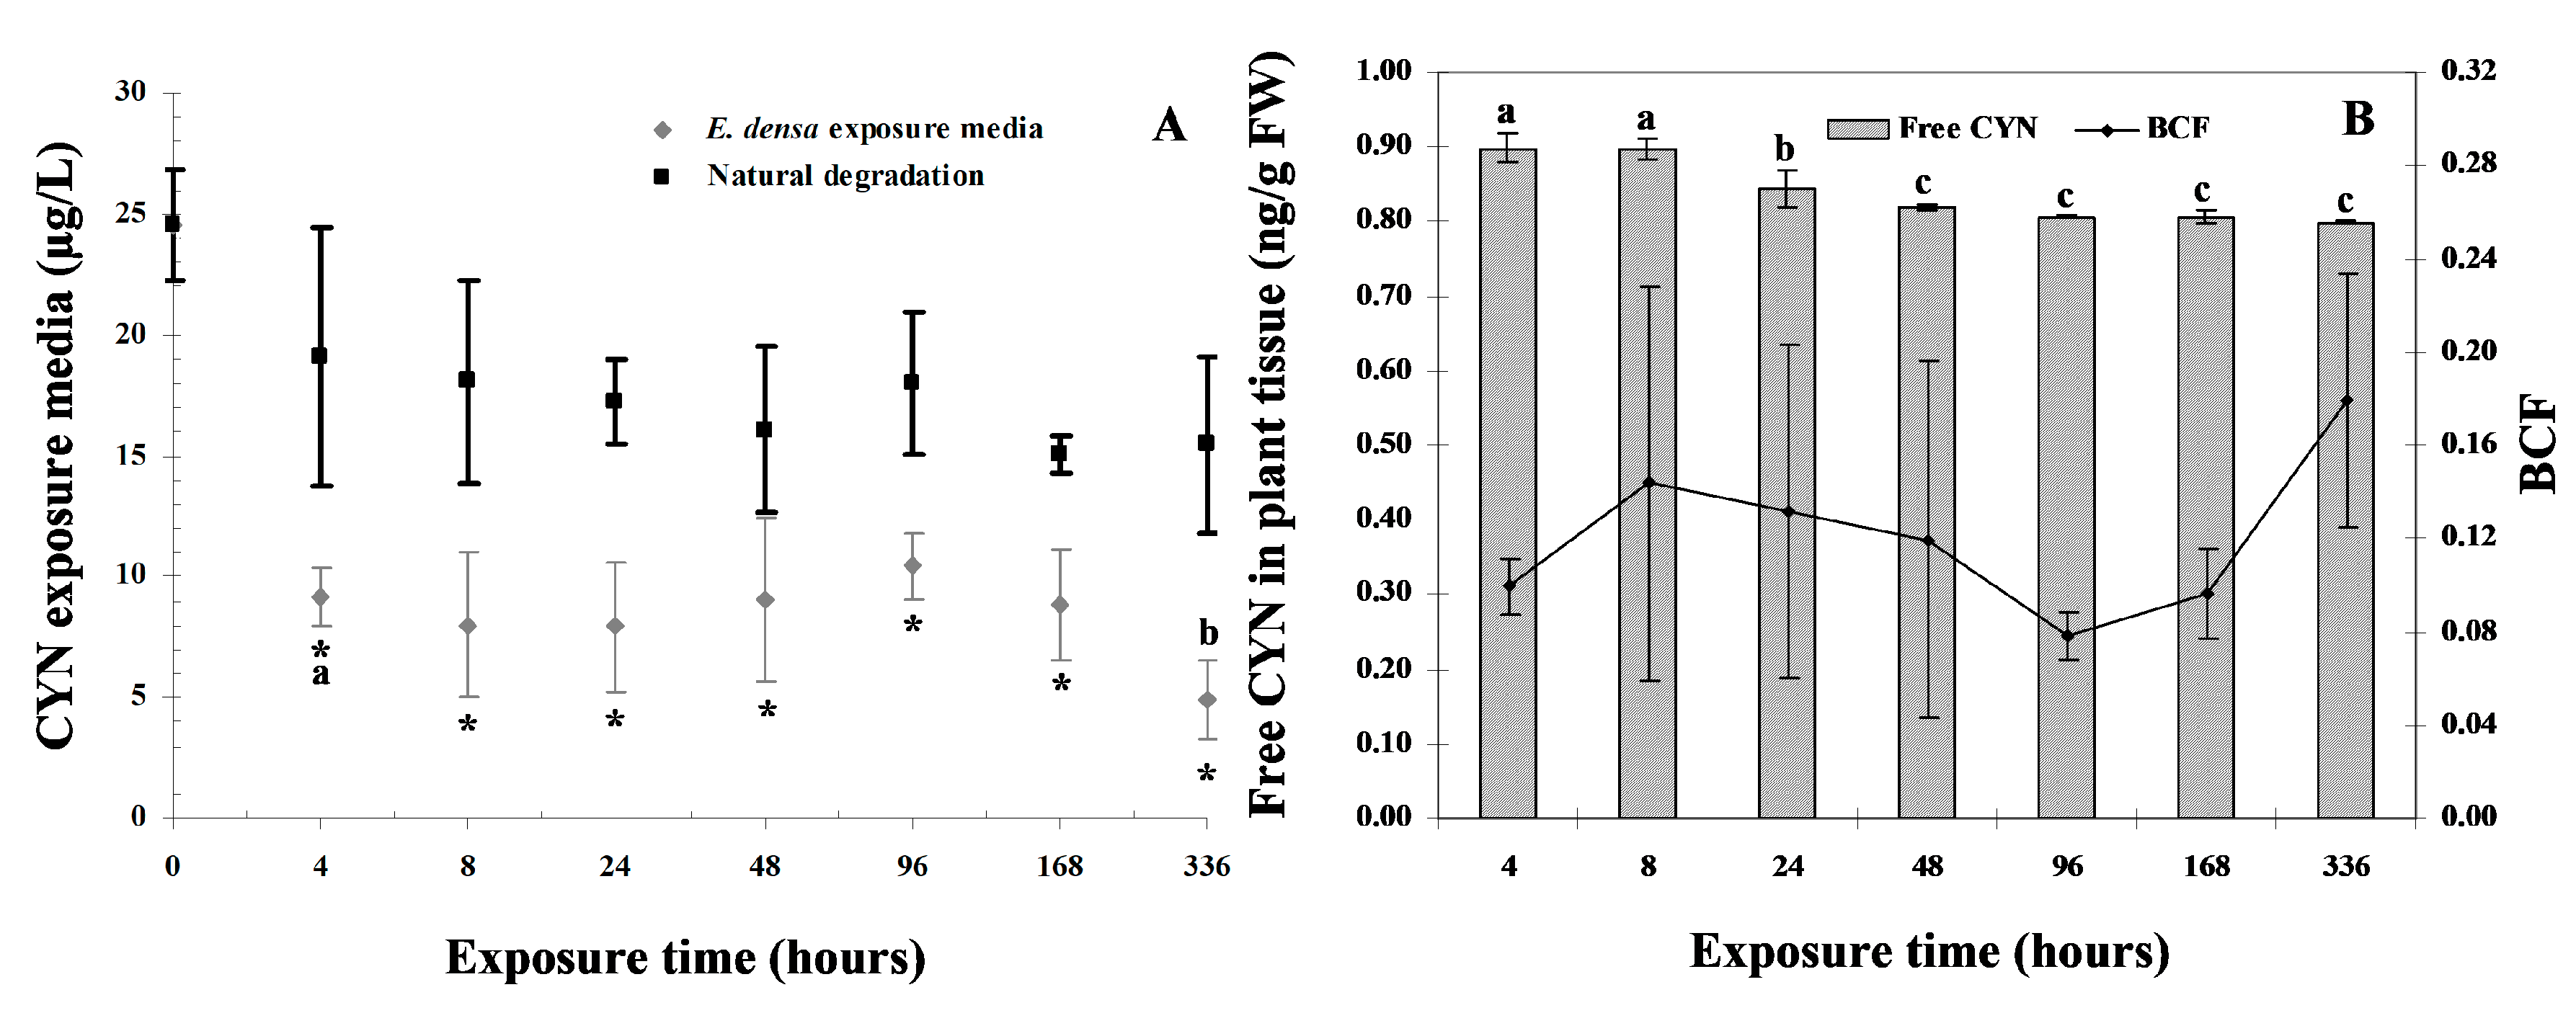
3.1. CYN Uptake
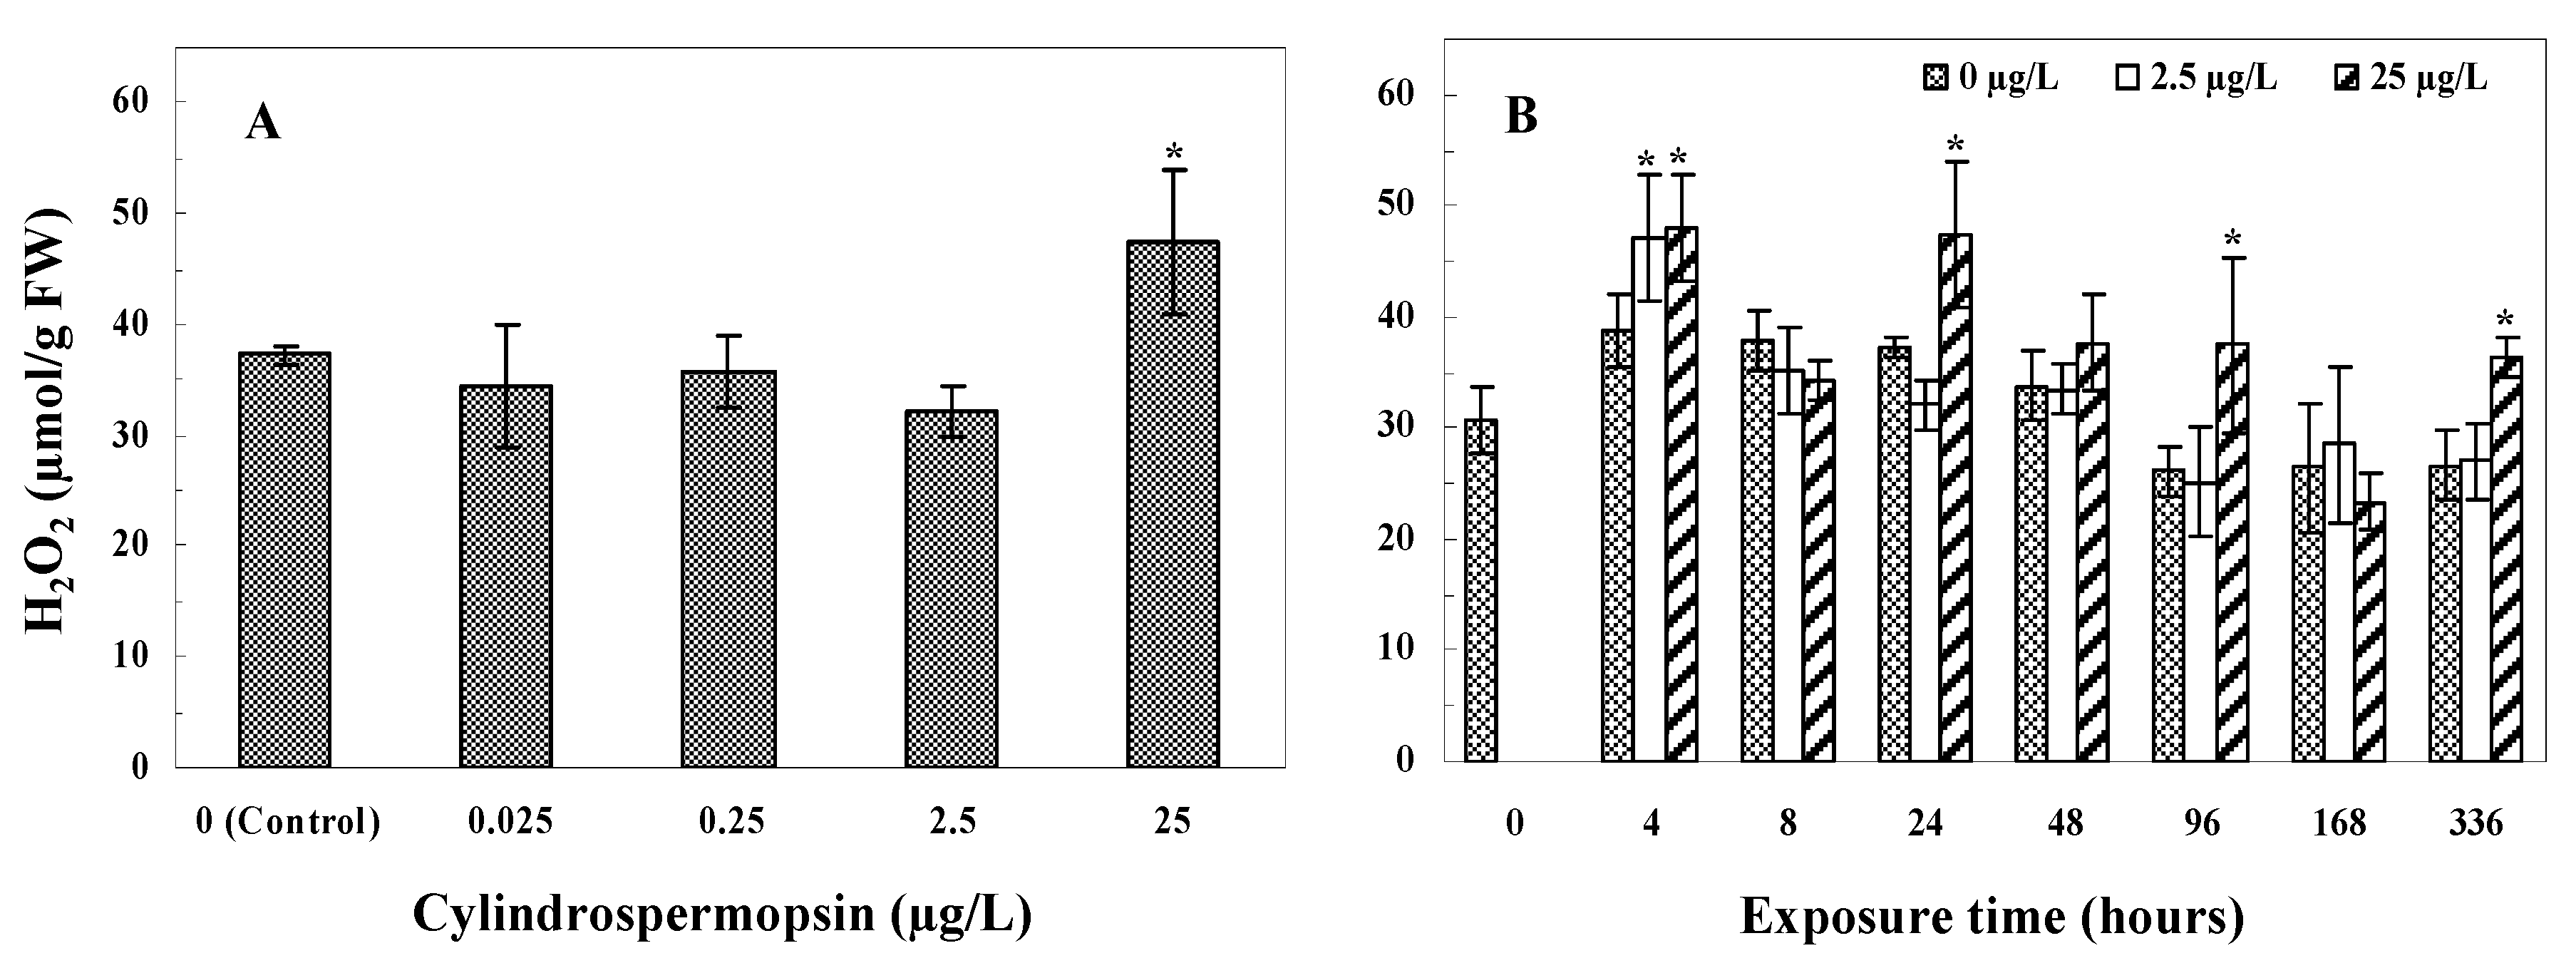
3.2. Hydrogen Peroxide (H2O2)
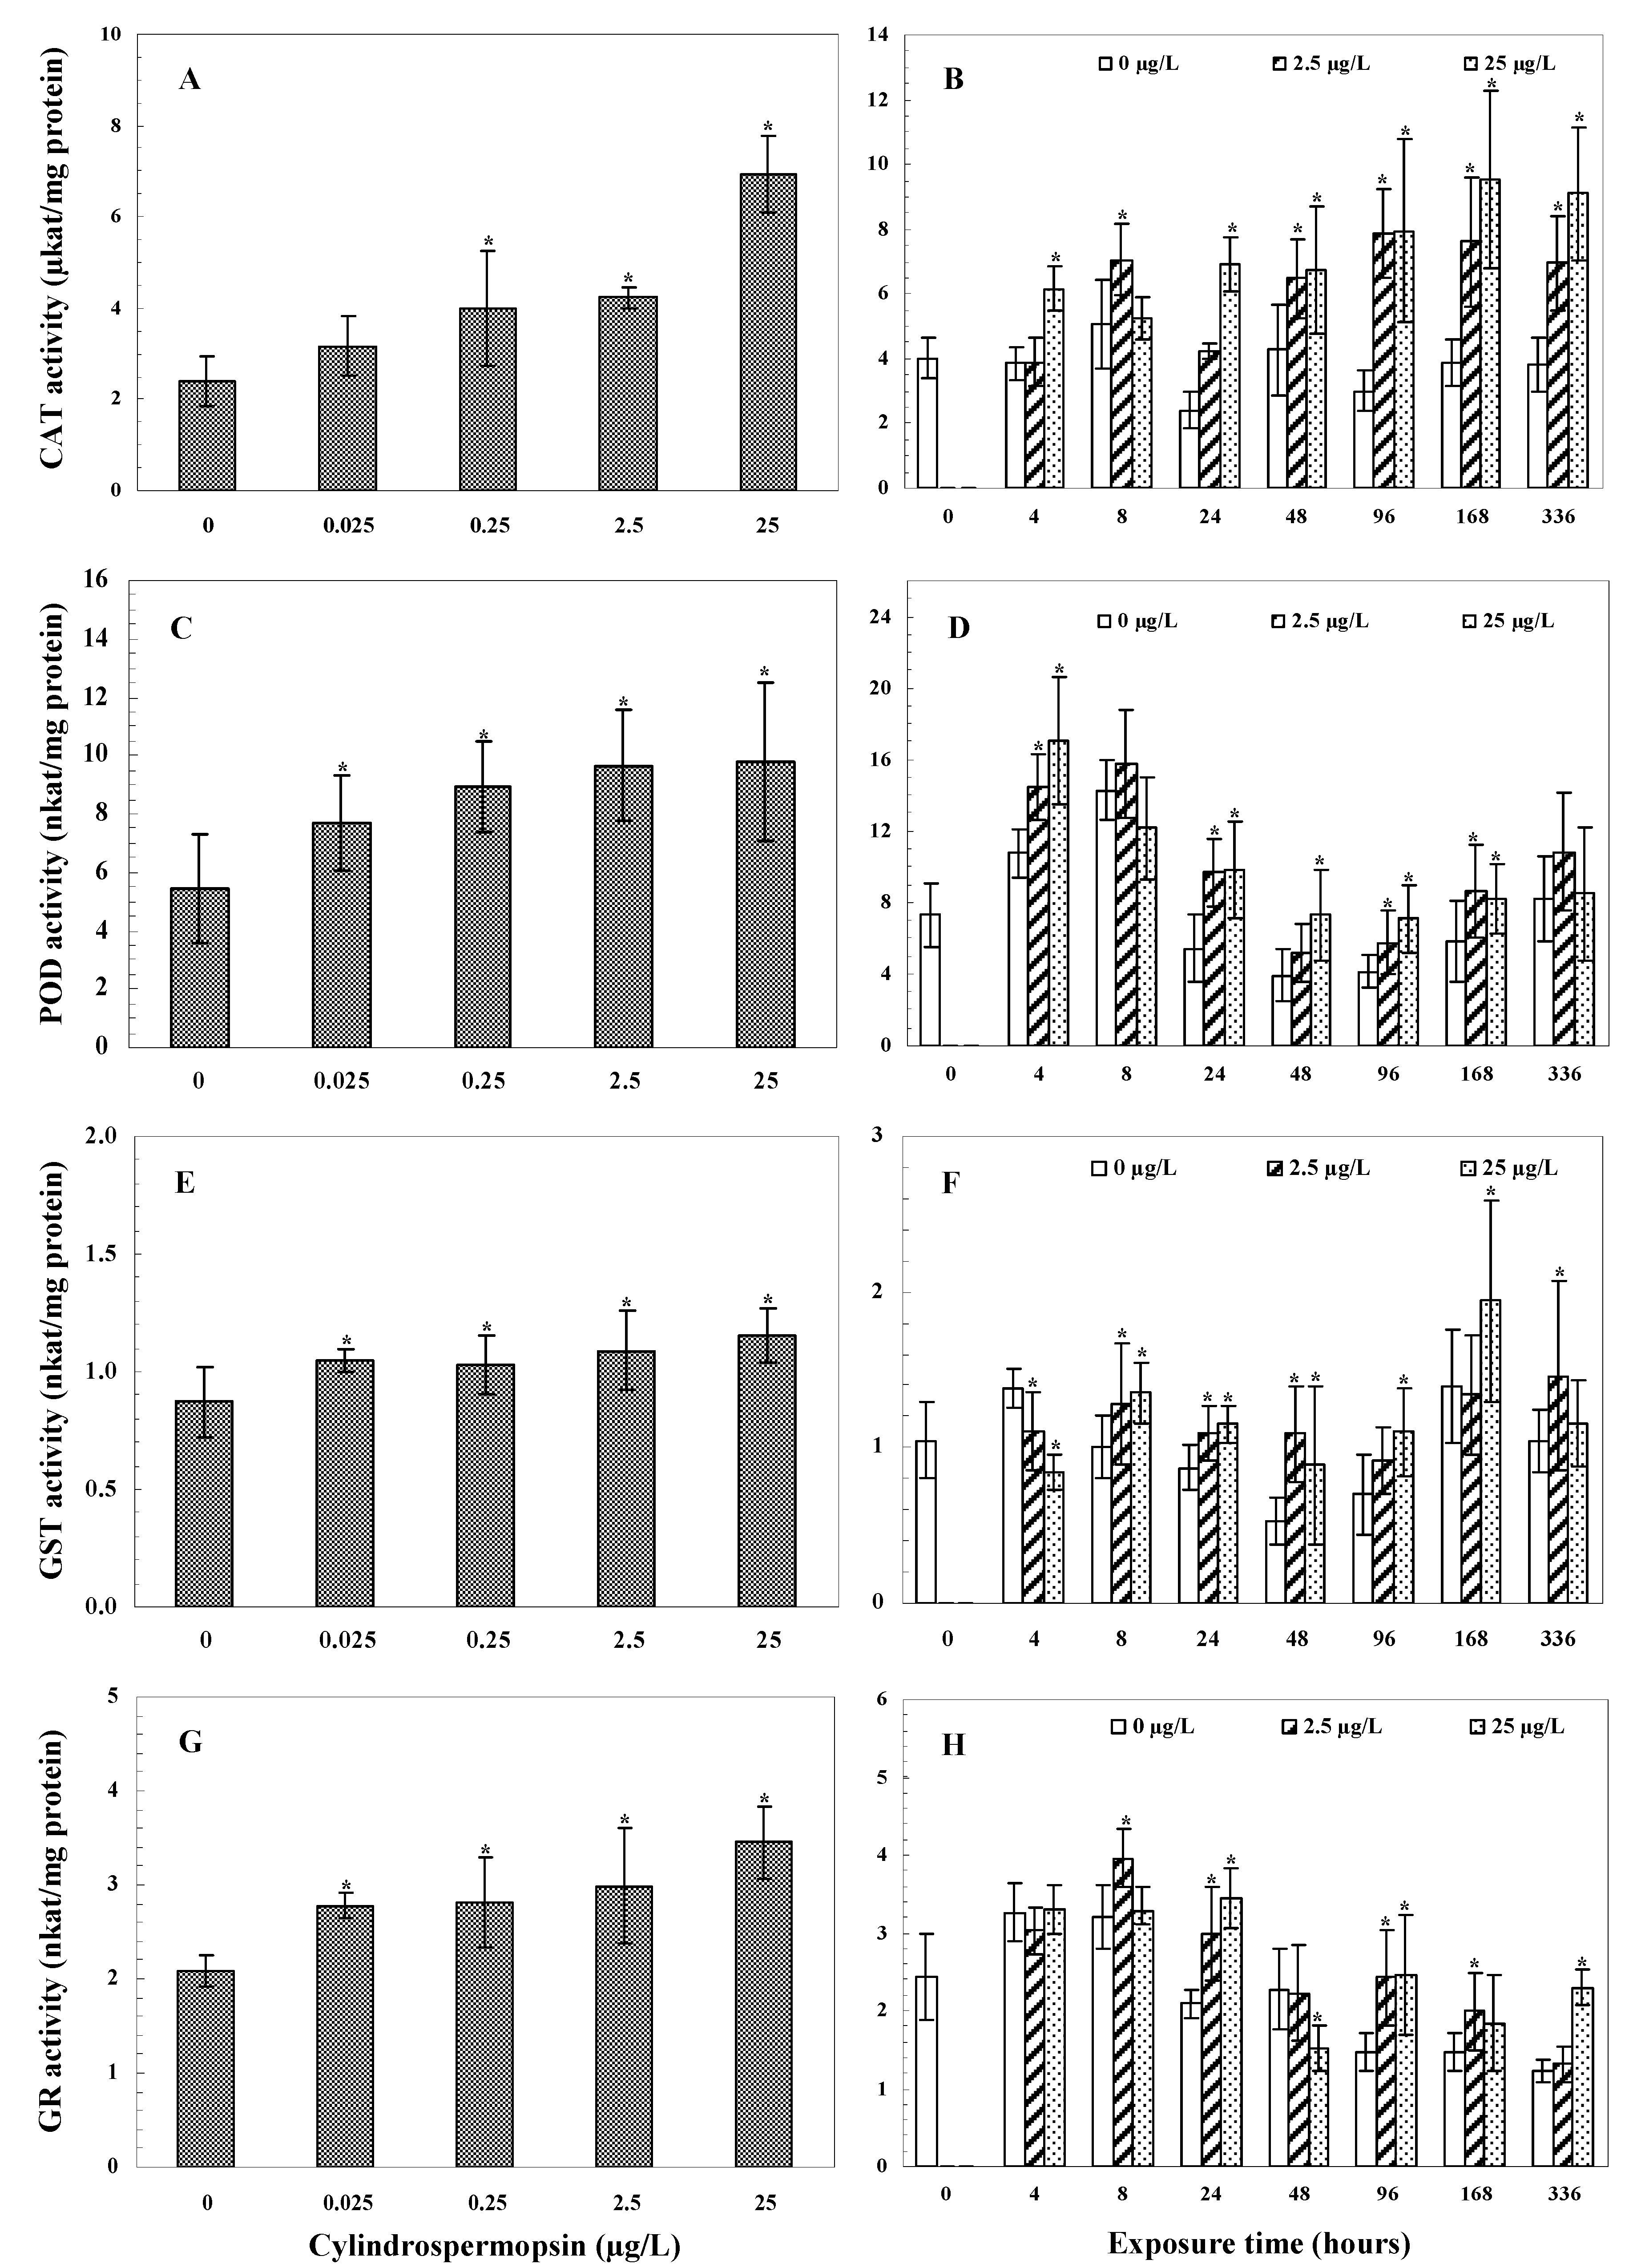
3.3. Enzyme Activity
3.3.1. CAT Activity
3.3.2. POD Activity
3.3.3. GST Activity
3.3.4. GR Activity
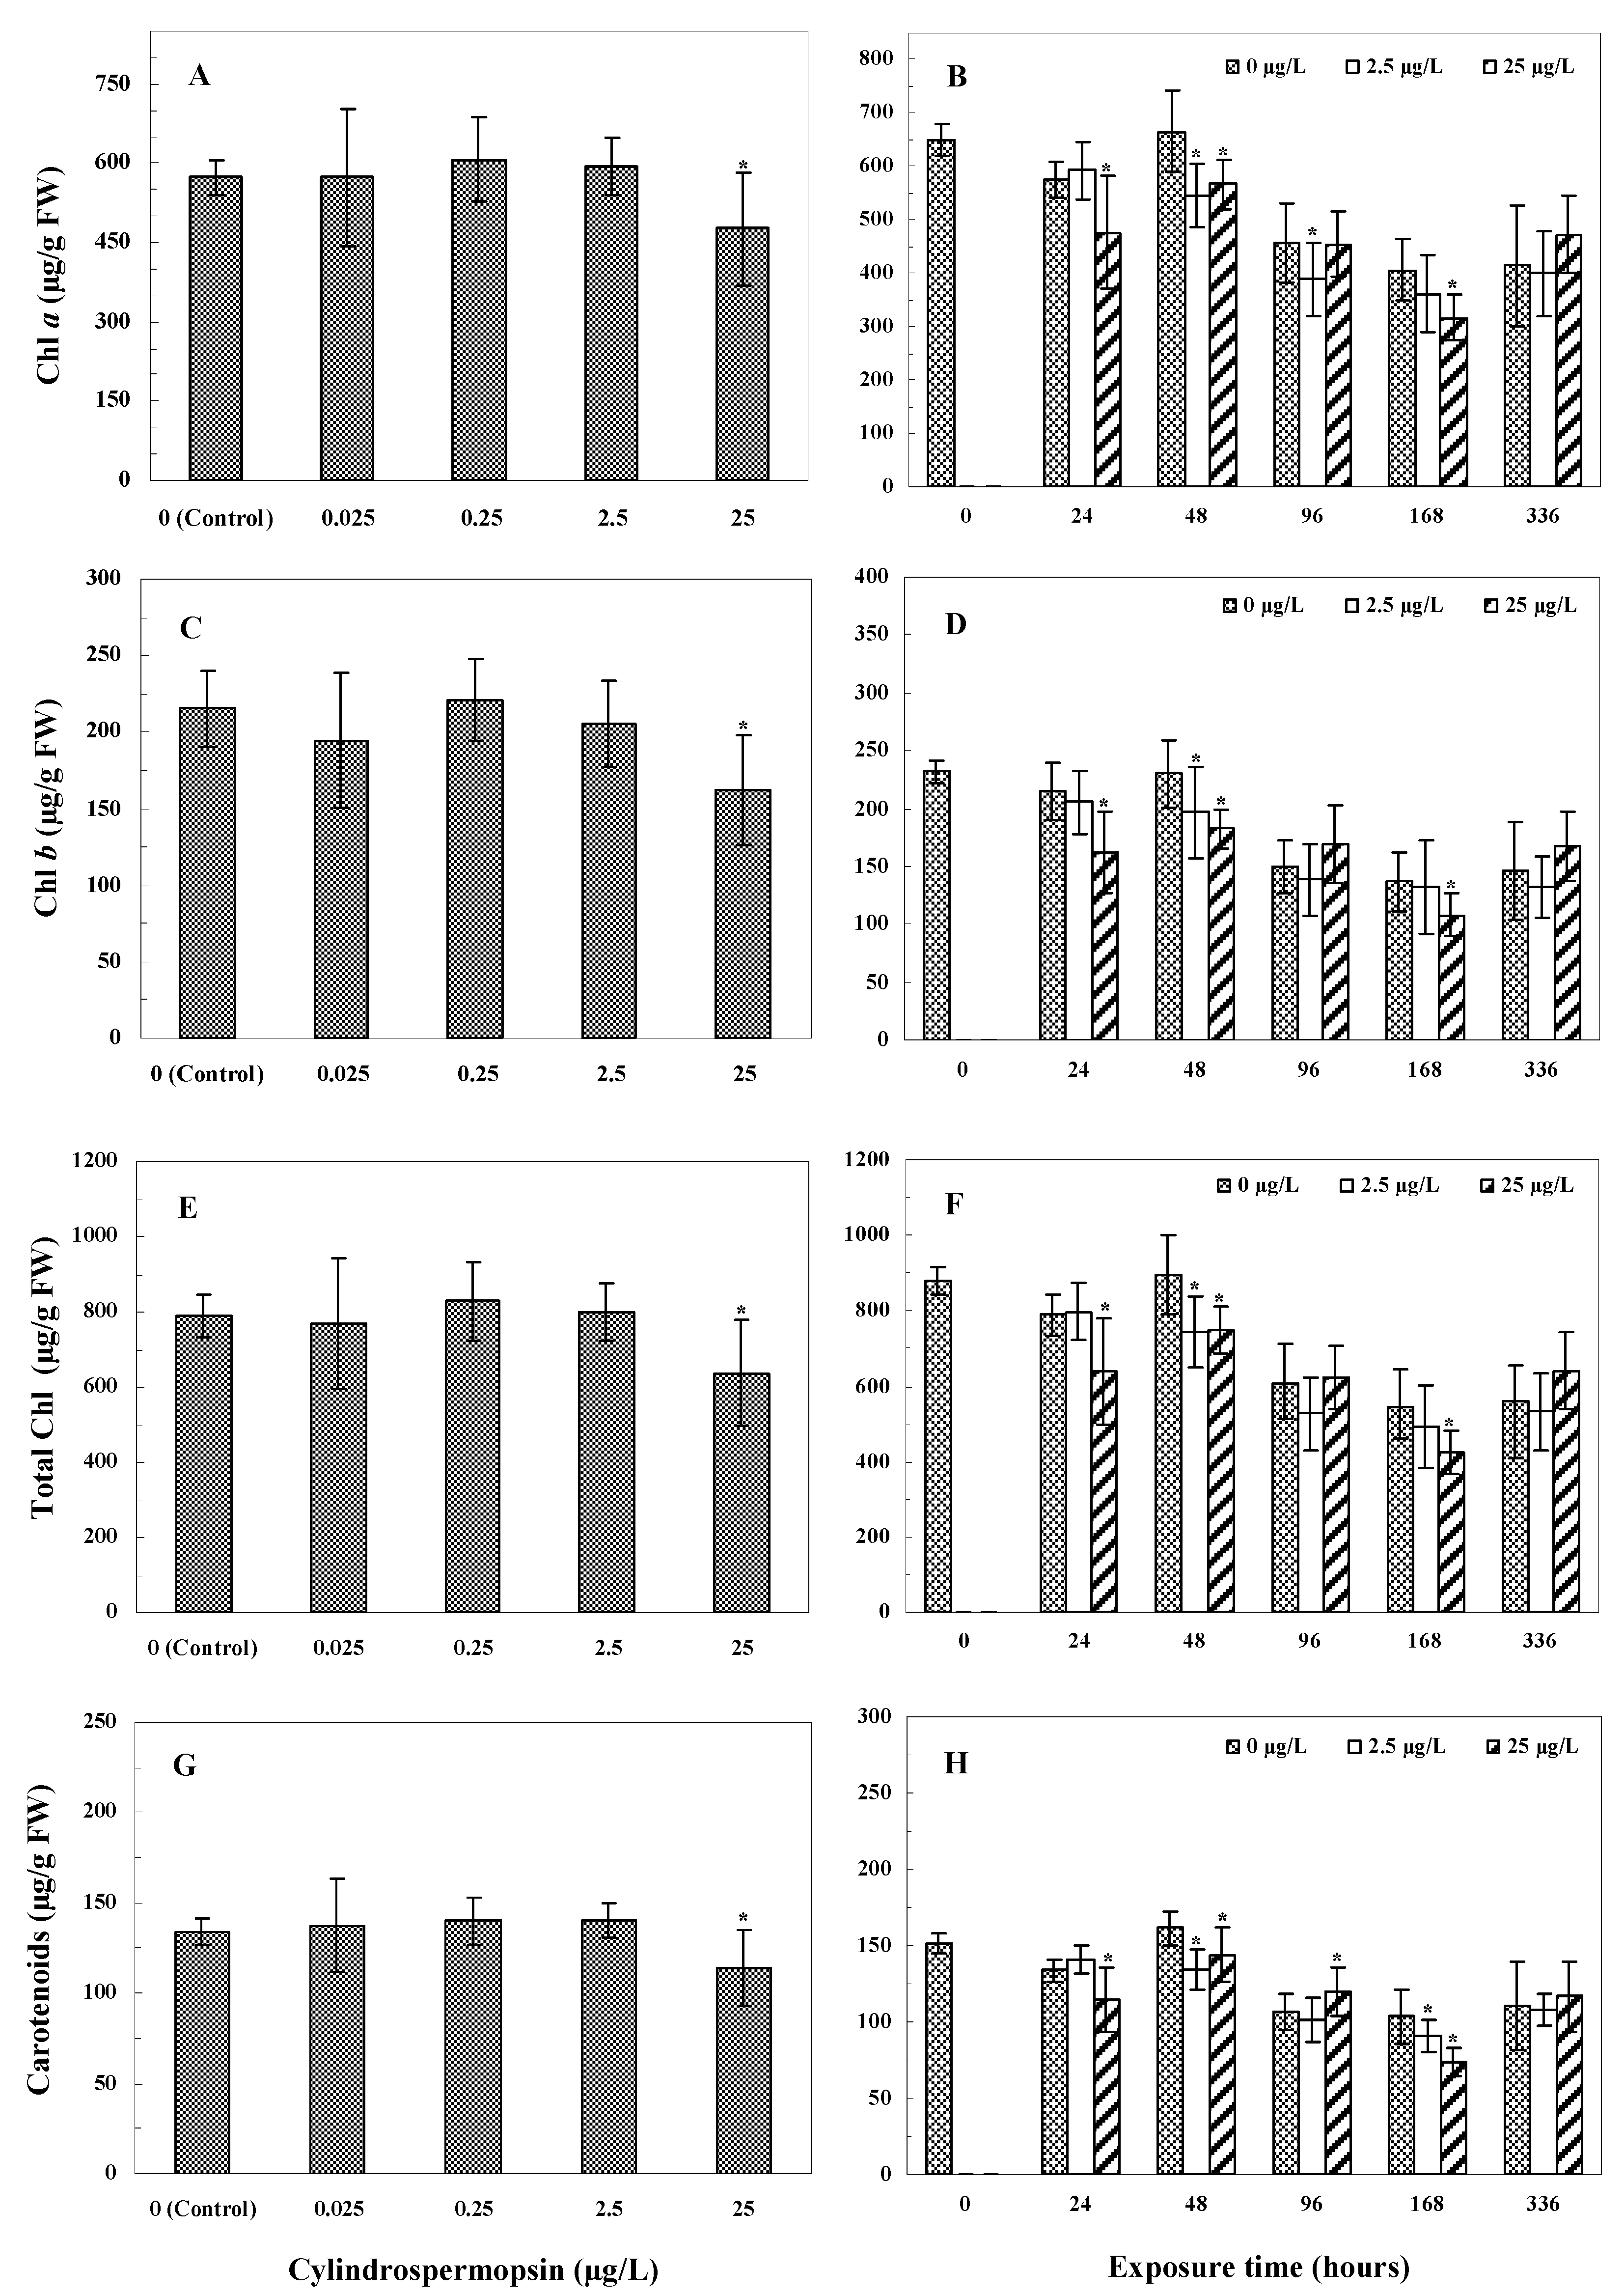
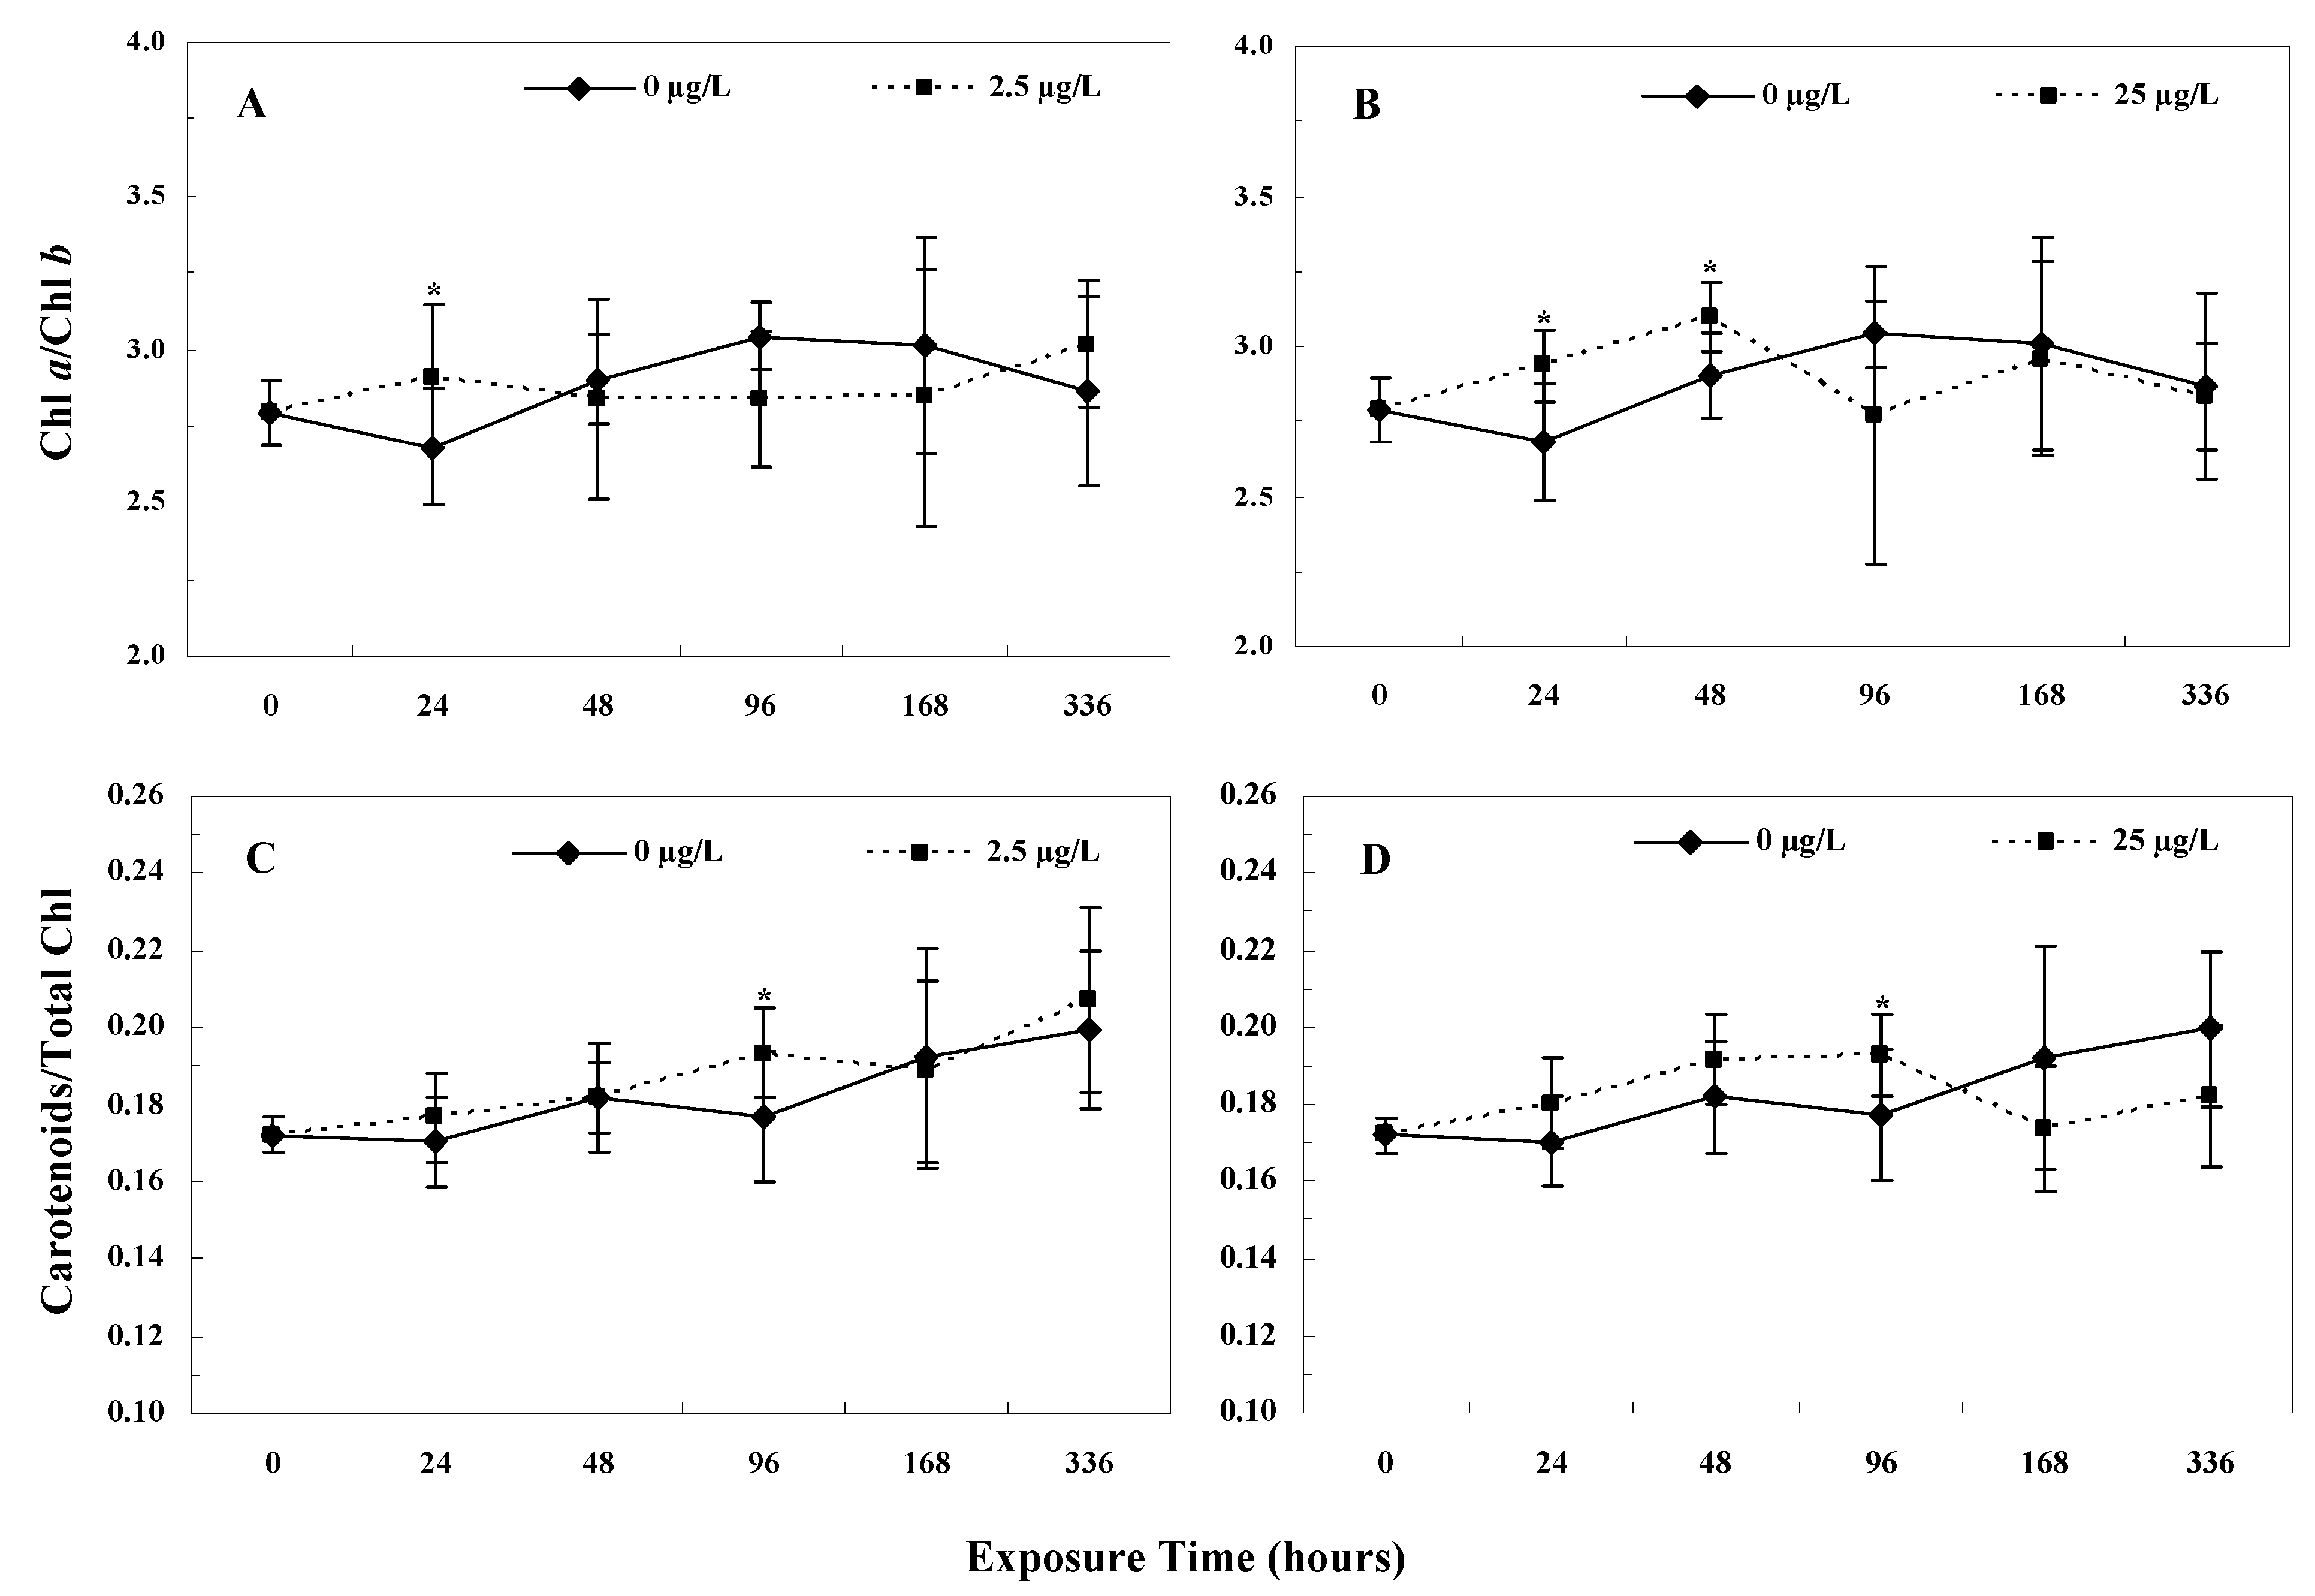
3.4. Photosynthetic Pigment Contents
3.5. Plant Growth
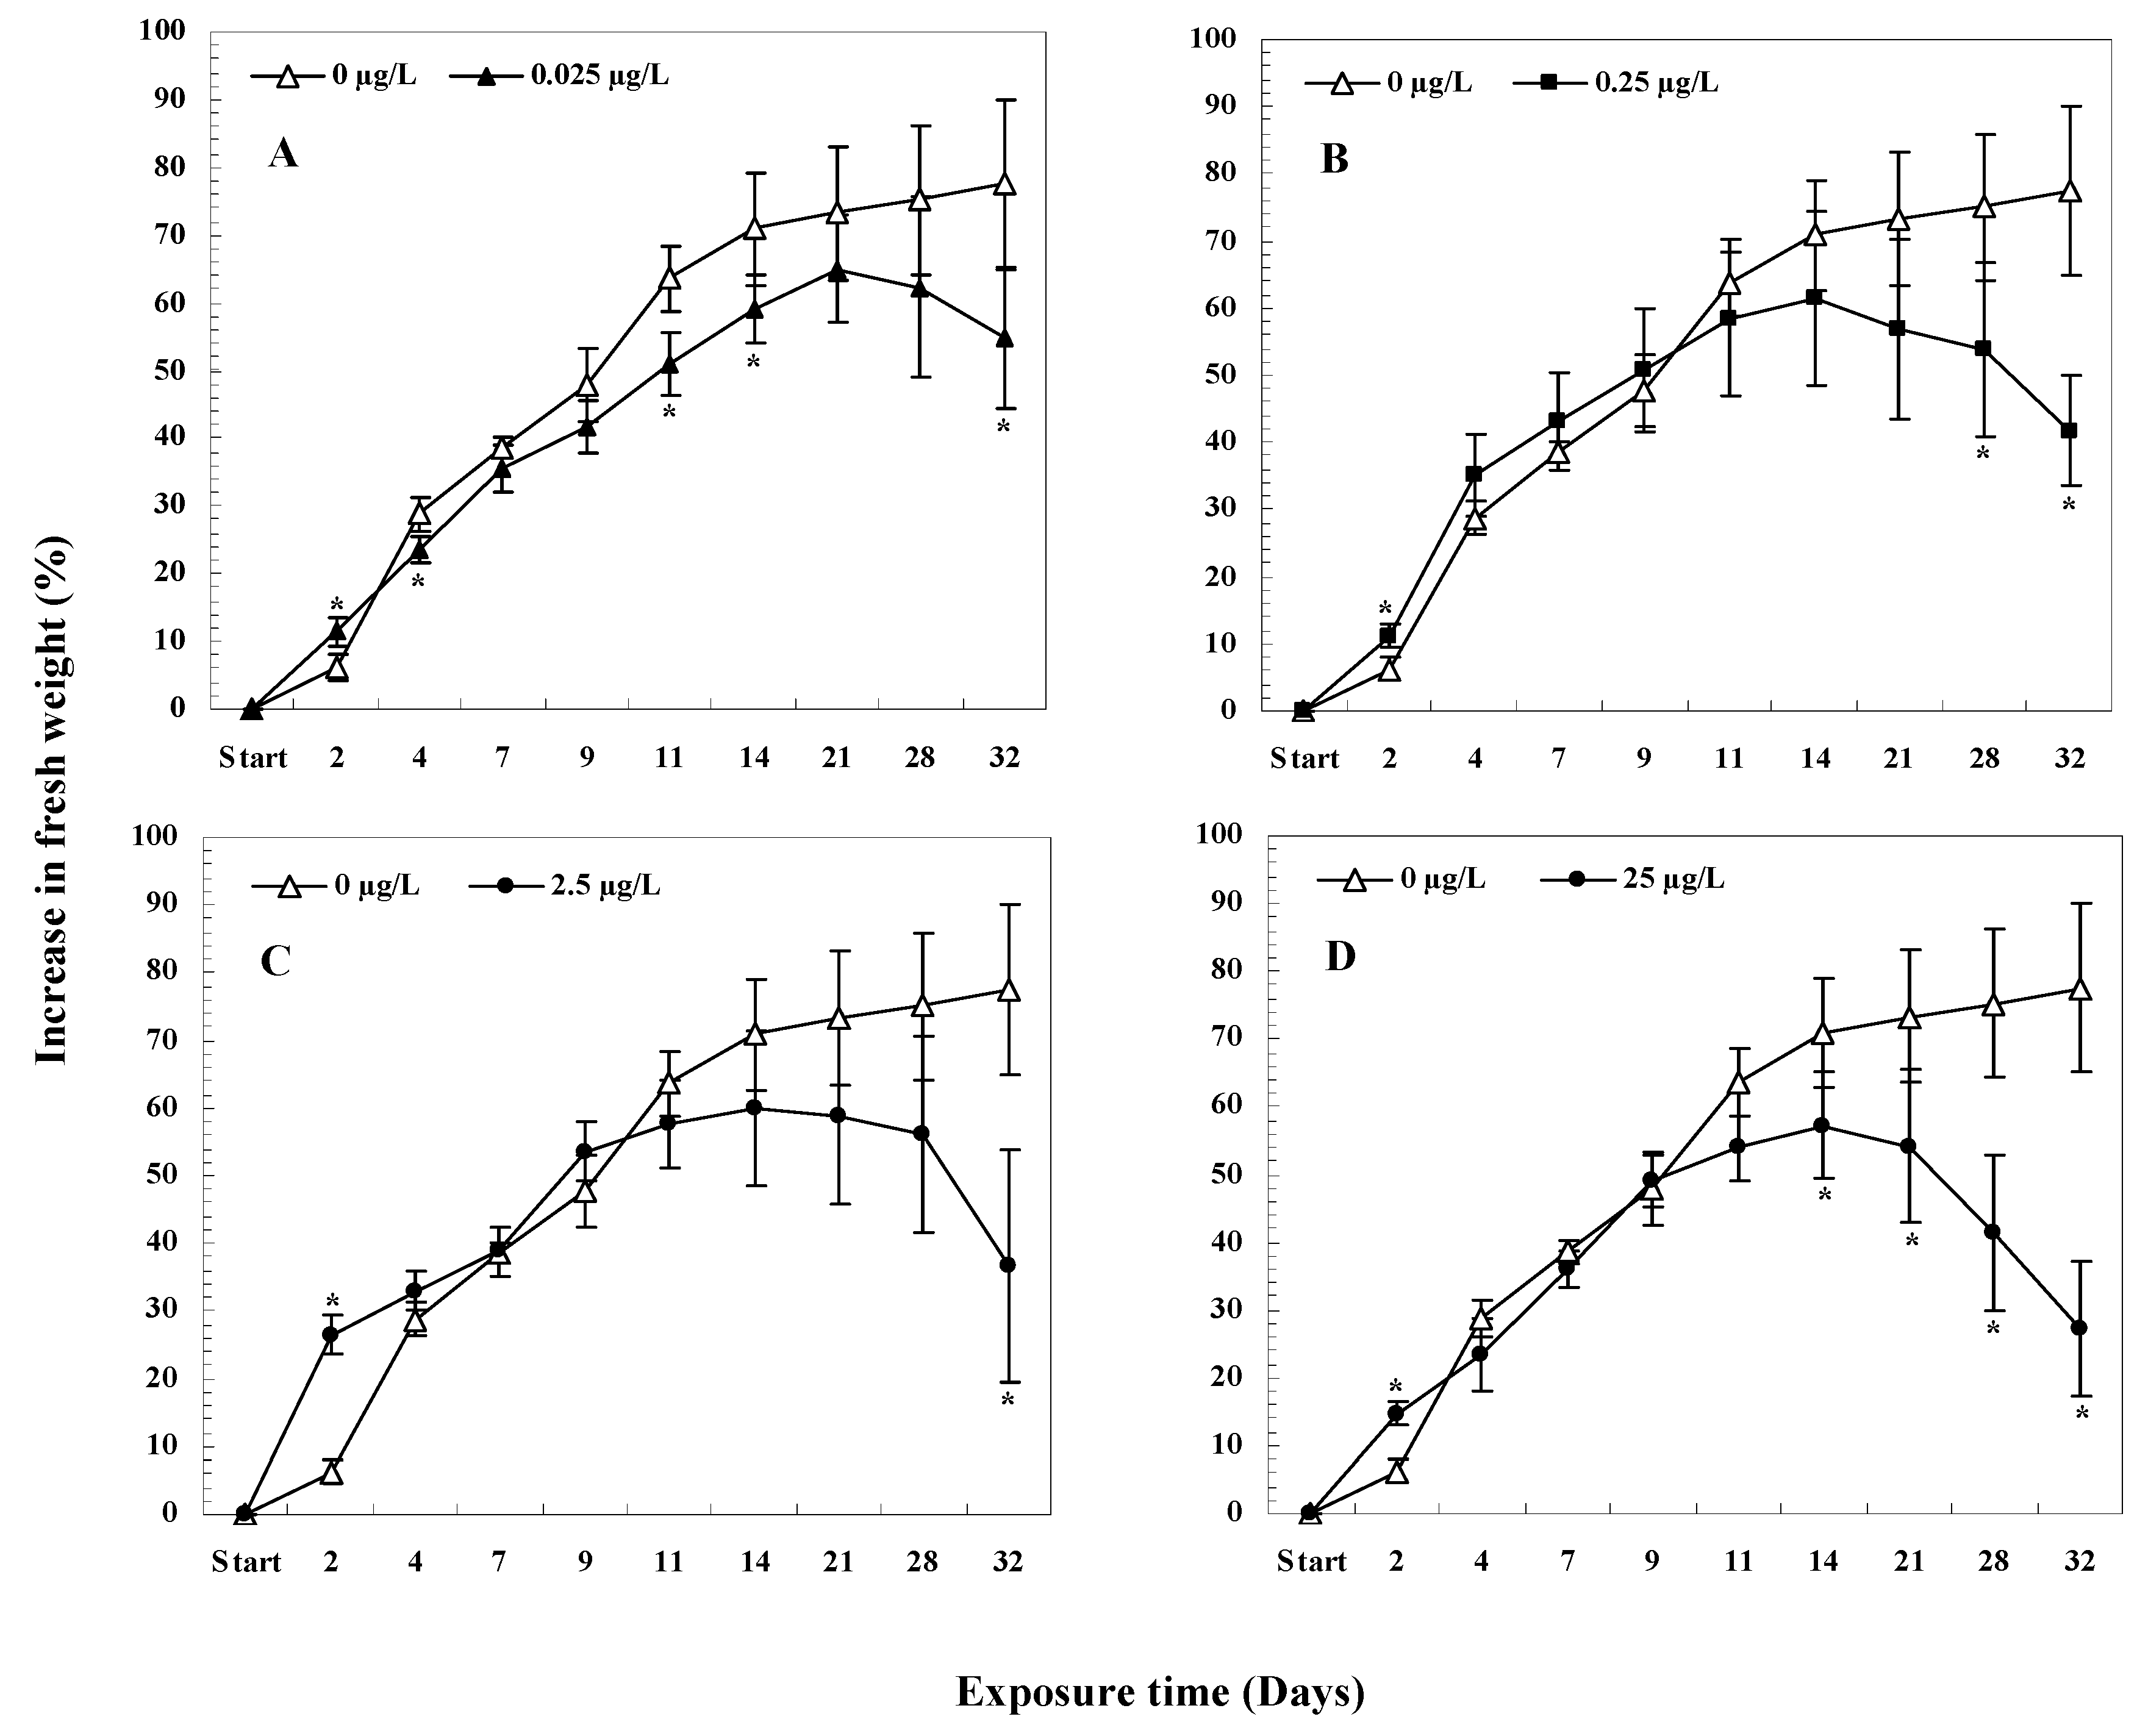
3.5.1. Changes in Fresh Weight
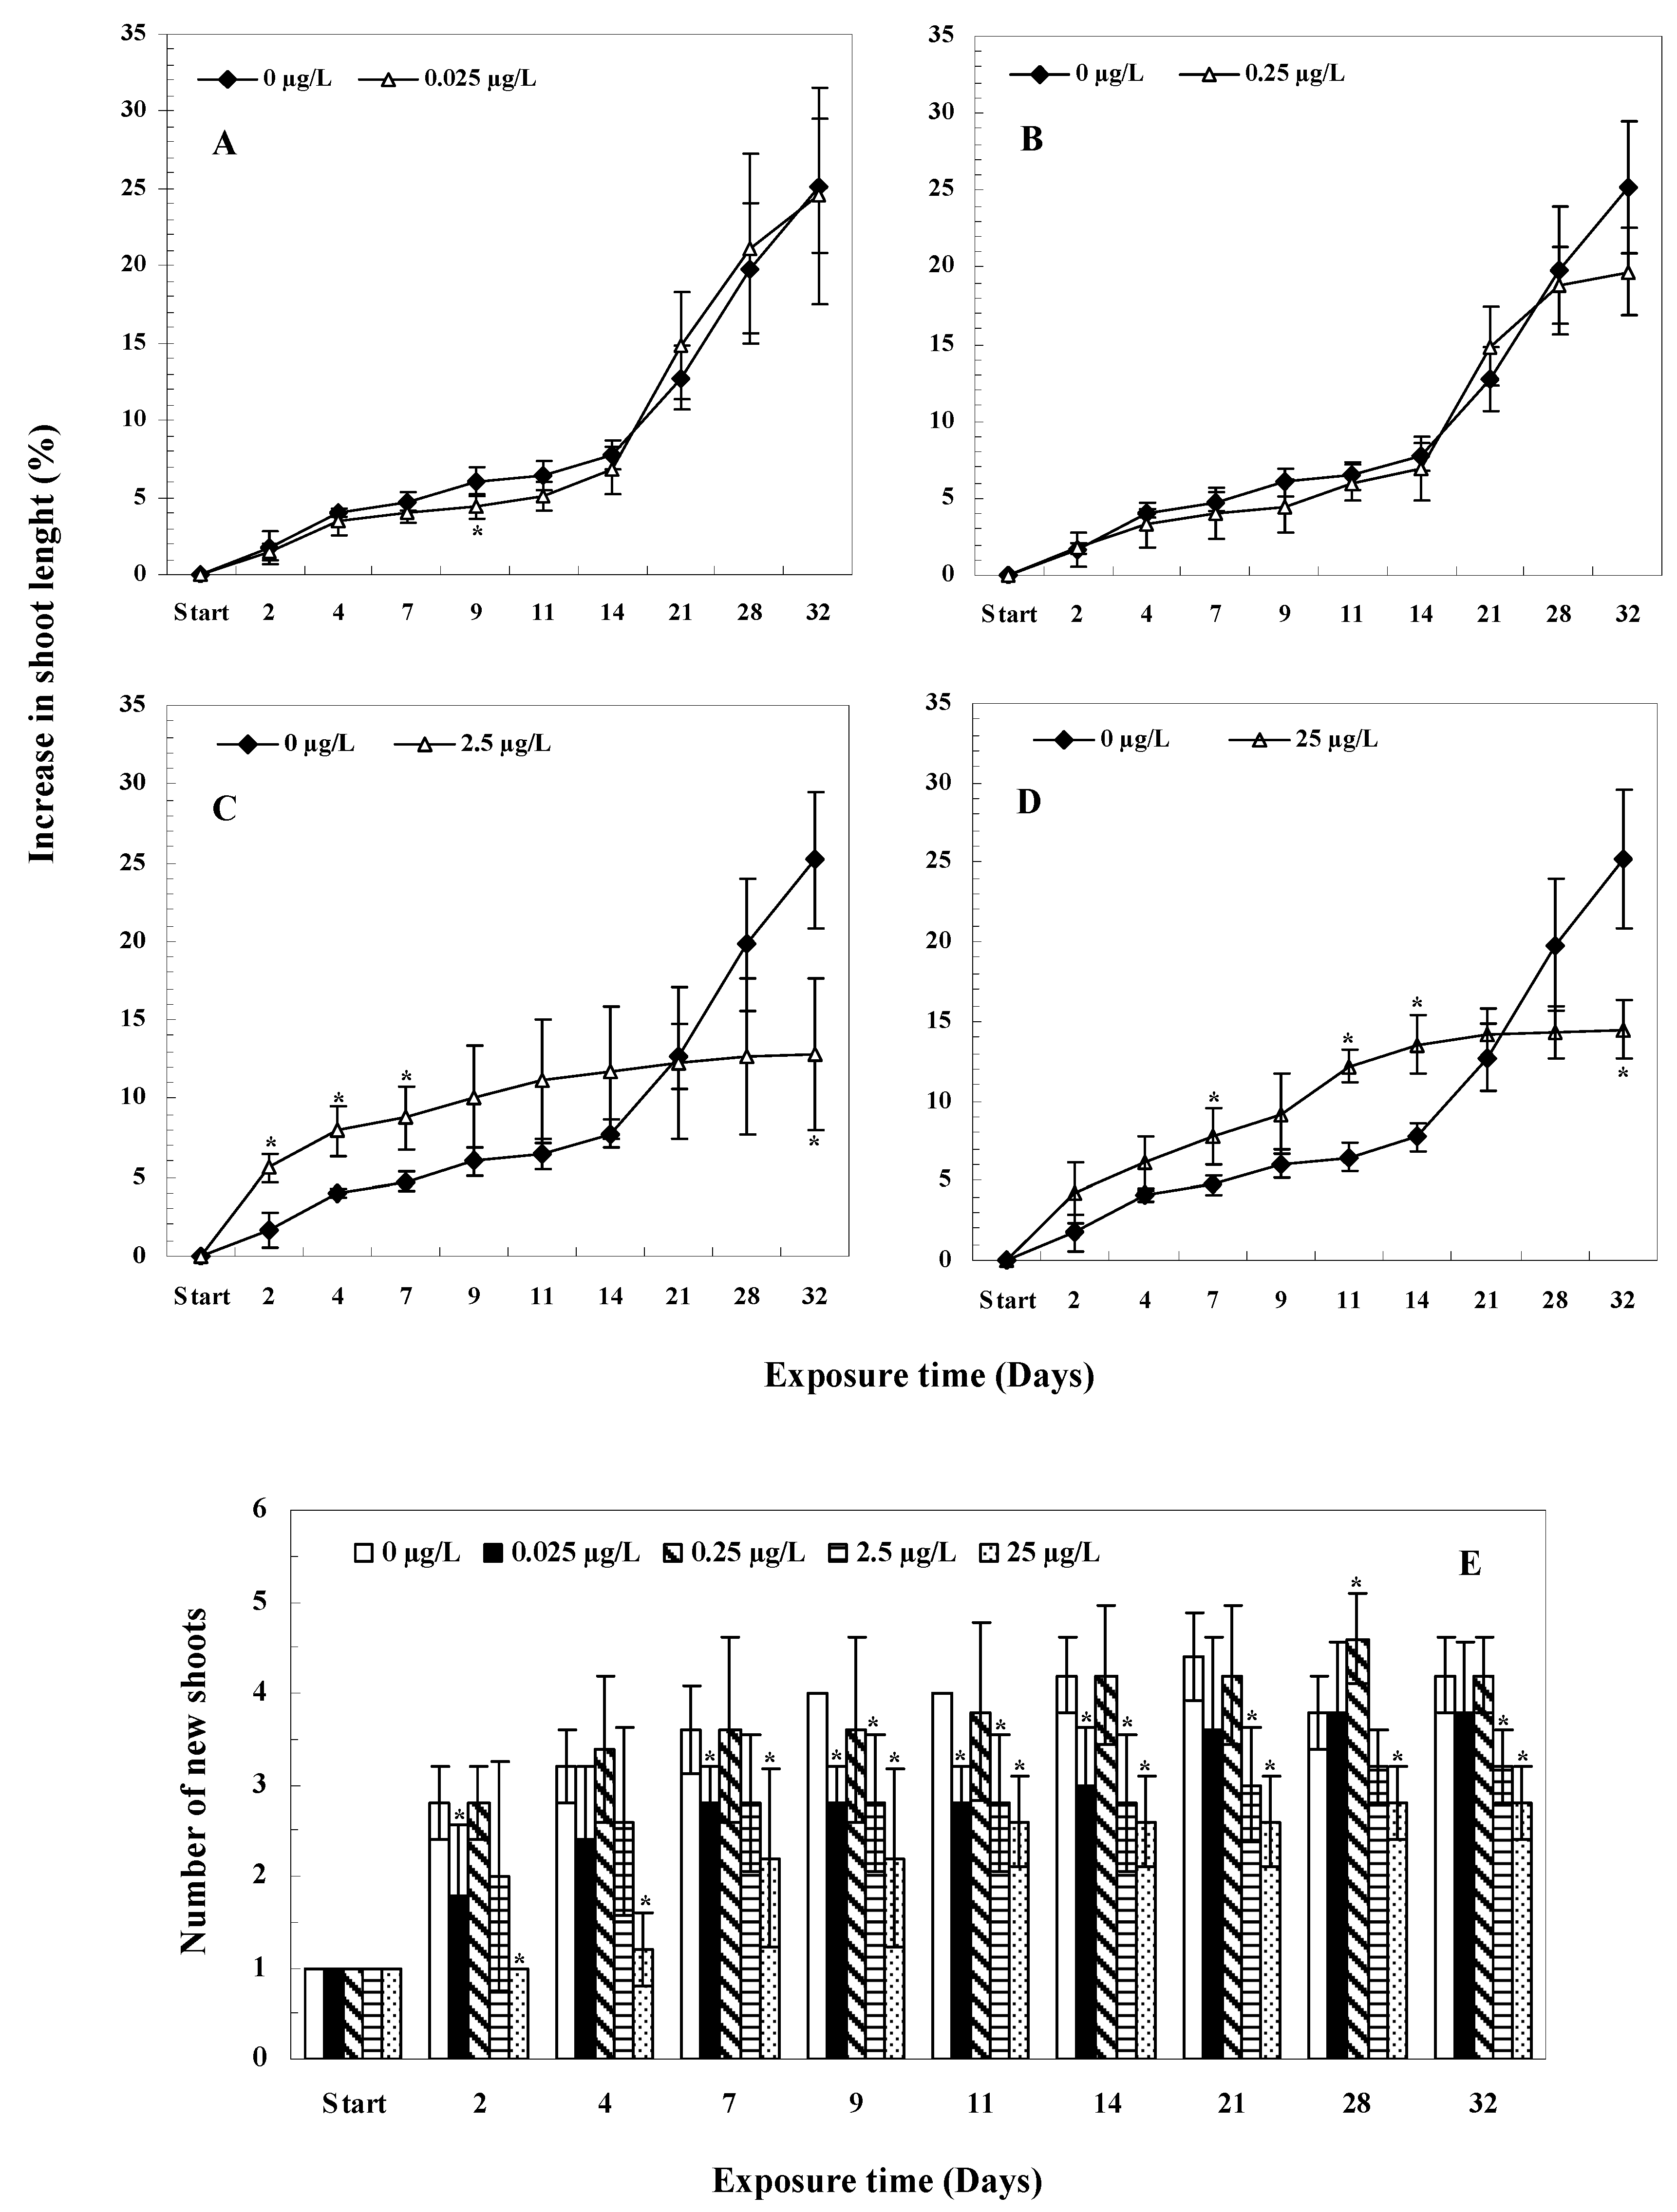
3.5.2. Changes in Plant Lengths and New Shoots
4. Discussion
5. Conclusions
Author Contributions
Funding
Acknowledgments
Conflicts of Interest
References
- De la Cruz, A.; Hiskia, A.; Kaulodis, T.; Chernoff, N.; Hill, D.; Antoniou, M.; He, X.; Loftin, K.; O’Shea, K.; Zhao, C.; et al. A review on cylindrospermopsin: The global occurrence, detection, toxicity and degradation of a potent cyanotoxin. Environ. Sci. Process. Impacts 2013, 15, 1979–2003. [Google Scholar] [CrossRef] [PubMed]
- B-Béres, V.; Vasas, G.; Dobronoki, D.; Gonda, S.; Nagy, S.A.; Bàcsi, I. Effects of Cylindrospermopsin Producing Cyanobacterium and Its Crude Extracts on a Benthic Green Alga-Compertition or Allelopathy? Mar. Drugs 2015, 13, 6703–6722. [Google Scholar] [CrossRef] [PubMed] [Green Version]
- Kinnear, S. Cylindrospermopsin: A decade of progress on bioaccumulation research. Mar. Drugs 2010, 8, 542–564. [Google Scholar] [CrossRef] [PubMed] [Green Version]
- Ohtani, I.; Moore, R.E.; Runnegar, M.T.C. Cylindrospermopsin: A potent hepatotoxin from the blue-green alga. J. Am. Chem. Soc. 1992, 114, 7941–7942. [Google Scholar] [CrossRef]
- Banker, R.; Carmeli, S.; Teltsch, B.; Sukenik, A. 7-Epicylindrospermopsin, a toxic minor metabolite of the cyanobacterium Aphanizomenon ovalisporum from Lake Kinneret, Israel. J. Nat. Prod. 2000, 63, 387–389. [Google Scholar] [CrossRef]
- Norris, R.L.; Eaglesham, G.; Pierens, G.; Shaw, G.; Smith, M.J.; Chiswell, R.K.; Seawright, A.A.; Moore, M.R. Deoxycylindrospermopsin, an analog of cylindrospermopsin from Cylindrospermopsis raciborskii. Environ. Toxicol. 1999, 14, 163–165. [Google Scholar] [CrossRef]
- Wörmer, L.; Huerta-Fontela, M.; Cirés, S.; Quesada, A. Natural photodegradation of the cyanobacterial toxins microcystin and cylindrospermopsin. Environ. Sci. Technol. 2010, 44, 3002–3007. [Google Scholar] [CrossRef]
- Chiswell, R.K.; Shaw, G.R.; Eaglesham, G.; Smith, M.J.; Norris, R.L.; Seawright, A.A.; Moore, M.R. Stability of cylindrospermopsin, the toxin from the cyanobacterium, Cylindrospermopsis raciborskii: Effect of pH, temperature, and sunlight on decomposition. Environ. Toxicol. 1999, 14, 155–161. [Google Scholar] [CrossRef]
- Guzmán-Guillén, R.; Prieto, A.I.; Vasconcelos, V.M.; Cameán, A.M. Cyanobacterium producing cylindrospermopsin cause oxidative stress at environmentally relevant concentrations in sub-chronically exposed tilapia (Oreochromis niloticus). Chemosphere 2013, 90, 1184–1194. [Google Scholar] [CrossRef]
- Moreira, C.; Azevedo, J.; Antunes, A.; Vasconcelos, V. Cylindrospermopsin: Occurrence, methods of detection and toxicology. J. Appl. Microbiol. 2012, 114, 605–620. [Google Scholar] [CrossRef]
- Thomaz, S.M.; da Cunha, E.R. The role of macrophytes in habitat structuring in aquatic ecosystems: Methods of measurement, causes and consequences on animal assemblages’ composition and biodiversity. Acta Limnol. Bras. 2010, 22, 218–236. [Google Scholar] [CrossRef]
- White, S.H.; Duivenvoorden, L.J.; Fabbro, L.D. Absence of free-cylindrospermopsin bioconcentration in Water Thyme (Hydrilla verticillata). Bull. Environ. Contam. Toxicol. 2005, 75, 574–583. [Google Scholar] [CrossRef]
- Kinnear, S.H.W.; Duivenvoorden, L.J.; Fabbro, L.D. Growth and bioconcentration in Spirodella oligorrhiza following exposure to Cylindrospermopsis raciborskii whole-cell extracts. Australas. J. Ecotoxicol. 2007, 13, 19–31. [Google Scholar]
- Santos, C.; Azevedo, J.; Campos, A.; Vasconcelos, V.; Pereira, A. Biochemical and growth performance of the aquatic macrophyte Azolla filiculoides to sub-chronic exposure to cylindrospermopsin. Ecotoxicology 2015, 24, 1848–1857. [Google Scholar] [CrossRef] [PubMed]
- Flores-Rojas, N.C.; Esterhuizen-Londt, M.; Plugmacher, S. Uptake, Growth, and Pigment Changes in Lemna minor L. exposed to Environmental Concentrations of Cylindrospermopsin. Toxins 2019, 11, 650. [Google Scholar] [CrossRef] [PubMed] [Green Version]
- Prieto, A.; Campos, A.; Camea, A.; Vasconcelos, V. Effects on growth and oxidative stress status of rice plants (Oryza sativa) exposed to two extracts of toxin-producing cyanobacteria (Aphanizomenon ovalisporum and Microcystis aeruginosa). Ecotoxicol. Environ. Saf. 2011, 74, 1973–1980. [Google Scholar] [CrossRef] [PubMed]
- Freitas, M.; Azevedo, J.; Pinto, E.; Neves, J.; Campos, A.; Vasconcelos, V. Effects of microcystin-LR, cylindrospermopsin and a microcystin-LR/cylindrospermopsin mixture on growth, oxidative stress and mineral content in lettuce plants (Lactuca sativa L.). Ecotoxicol. Environ. Saf. 2015, 116, 59–67. [Google Scholar] [CrossRef] [PubMed] [Green Version]
- Flores-Rojas, N.C.; Esterhuizen-Londt, M.; Pflugmacher, S. Antioxidative stress responses in the floating macrophyte Lemna minor L. with cylindrospermopsin exposure. Aquat. Toxicol. 2015, 169, 188–195. [Google Scholar] [CrossRef] [PubMed]
- Jámbrik, K.; Máthé, C.; Vasas, G.; Bácsi, I.; Surányi, G.; Gonda, S.; Borbély, G.; M-Hamvas, M. Cylindrospermopsin inhibits growth and modulates protease activity in the aquatic plants Lemna minor L. and Wolffia arrhiza (L.) Horkel. Acta Biol. Hung. 2010, 61, 77–94. [Google Scholar] [CrossRef]
- Kinnear, S.H.W.; Fabbro, L.D.; Duivenvoorden, L.J. Variable growth responses of water thyme (Hydrilla verticillata) to whole-cell extracts of Cylindrospermopsis raciborskii. Arch. Environ. Contam. Toxicol. 2008, 54, 187–194. [Google Scholar] [CrossRef]
- Pflugmacher, S.; Kühn, S.; Lee, S.-H.; Choi, J.-W.; Baik, S.; Kwon, K.-S.; Contardo-Jara, V. Green Liver Systems® for water purification: Using the phytoremediation potential of aquatic macrophytes for the removal of different cyanobacterial toxins from water. Am. J. Plant Sci. 2015, 6, 1607–1618. [Google Scholar] [CrossRef] [Green Version]
- Amorim, C.A.; Ulisses, C.; Moura, A.N. Biometric and physiological responses of Egeria densa Planch. cultivated with toxic and non-toxic strains of Microcystis. Aquat. Toxicol. 2017, 191, 201–208. [Google Scholar] [CrossRef] [PubMed]
- Romero-Oliva, C.S.; Contardo-Jara, V.; Pflugmacher, S. Antioxidative response of the three macrophytes Ceratophyllum demersum, Egeria densa, and Hydrilla verticillata to a time-dependent exposure of cell-free crude extracts containing three microcystins from cyanobacterial blooms of Lake Amatitlán, Guatemala. Aquat. Toxicol. 2015, 163, 130–139. [Google Scholar] [CrossRef]
- Rücker, J.; Stüken, A.; Nixdorf, B.; Fastner, J.; Chorus, I.; Wiedner, C. Concentrations of particulate and dissolved cylindrospermopsin in 21 Aphanizomenon-dominated temperate lakes. Toxicon 2007, 50, 800–809. [Google Scholar] [CrossRef]
- Corbel, S.; Mougin, C.; Bouaïcha, N. Cyanobacterial toxins: Modes of actions, fate in aquatic and soil ecosystems, phytotoxicity and bioaccumulation in agricultural crops. Chemosphere 2014, 96, 1–15. [Google Scholar] [CrossRef] [PubMed]
- Esterhuizen-Londt, M.; Kühn, S.; Pflugmacher, S. Development and validation of an in-house quantitative analysis method for cylindrospermopsin using hydrophilic interaction liquid chromatography-tandem mass spectrometry: Quantification demonstrated in 4 aquatic organisms. Environ. Toxicol. Chem. 2015, 34, 2878–2883. [Google Scholar] [CrossRef]
- Arnot, J.A.; Gobas, F.A.P.C. A review of bioconcentration factor (BCF) and bioaccumulation factor (BAF) assessments for organic chemicals in aquatics organisms. Environ. Rev. 2006, 14, 257–297. [Google Scholar] [CrossRef]
- Jana, S.; Choudhuri, M.A. Glycolate metabolism of three submerged aquatic angiosperms during aging. Aquat. Bot. 1982, 12, 345–354. [Google Scholar] [CrossRef]
- Pflugmacher, S. Promotion of oxidative stress in the aquatic macrophyte Ceratophyllum demersum during biotransformation of the cyanobacterial toxin microcystin-LR. Aquat. Toxicol. 2004, 70, 169–178. [Google Scholar] [CrossRef]
- Bradford, M. A rapid and sensitive method for the quantification of microgram quantities of protein utilizing the principle of protein-dye binding. Anal. Biochem. 1976, 72, 248–254. [Google Scholar] [CrossRef]
- Claiborne, A. Catalase activity. In CRC Handbook of Methods for Oxygen Radical Research; Greenwald, R.A., Ed.; CRC Press: Boca Raton, FL, USA, 1985; pp. 283–284. [Google Scholar]
- Pütter, J. Peroxidases. In Methods of Enzymatic Analysis; Bergmeyer, H.U., Ed.; Academic Press: New York, NY, USA, 1974; Volume 2, pp. 685–690. [Google Scholar]
- Habig, W.; Pabst, M.J.; Jacoby, W.B. Glutathione S-transferase: The first step in mercapturic acid formation. J. Biol. Chem. 1974, 249, 1730–1739. [Google Scholar]
- Carlberg, I.; Mannervik, B. Glutathione reductase. Methods Enzymol. 1985, 113, 484–490. [Google Scholar]
- Inskeep, W.P.; Bloom, P.R. Extinction coefficients of chlorophyll a and b in N, N-Dimethylformamide and 80% acetone. Plant Physiol. 1985, 77, 483–485. [Google Scholar] [CrossRef] [PubMed] [Green Version]
- Wellburn, A.R. The spectral determination of chlorophyll a and chlorophyll b, as well as total carotenoids, using various solvents with spectrophotometers of different resolution. J. Plant Physiol. 1994, 144, 307–313. [Google Scholar] [CrossRef]
- Ashraf, M.; Harris, P.J.C. Photosynthesis under stressful environments: An overview. Photosynthetica 2013, 51, 163–190. [Google Scholar] [CrossRef]
- Contardo-Jara, V.; Funke, M.S.; Peuthert, A.; Pflugmacher, S. β-N-Methylamino-L-alanine exposure alters defense against oxidative stress in aquatic plants Lomariopsis lineata, Fontinalis antipyretica, Riccia fluitans and Taxiphyllum barbieri. Ecotoxicol. Environ. Saf. 2013, 88, 72–78. [Google Scholar] [CrossRef]
- Nimptsch, J.; Wiegand, C.; Pflugmacher, S. Cyanobacterial toxin elimination via bioaccumulation of MC-LR in aquatic macrophytes: An application of the “Green Liver Concept”. Environ. Sci. Technol. 2008, 42, 8552–8557. [Google Scholar] [CrossRef]
- Esterhuizen-Londt, M.; Pflugmacher, S.; Downing, T. ß-N-Methylamino-l-alanine (BMAA) uptake by the aquatic macrophyte Ceratophyllum demersum. Ecotoxicol. Environ. Saf. 2011, 74, 74–77. [Google Scholar] [CrossRef]
- Ha, M.-H.; Contardo-Jara, V.; Pflugmacher, S. Uptake of the cyanobacterial neurotoxin, anatoxin-a, and alterations in oxidative stress in the submerged aquatic plant Ceratophyllum demersum. Ecotoxicol. Environ. Saf. 2014, 101, 205–212. [Google Scholar] [CrossRef]
- Esterhuizen-Londt, M.; Pflugmacher, S. Inability to detect free cylindrospermopsin in spiked aquatic organism extracts plausibly suggests protein binding. Toxicon 2016, 122, 89–93. [Google Scholar] [CrossRef]
- Cheeseman, J.M. Hydrogen Peroxide and Plant Stress: A Challenging Relationship. Plant Stress. 2007, 1, 4–15. [Google Scholar]
- Mittler, R. Oxidative stress, antioxidants and stress tolerance. Trends Plant Sci. 2002, 7, 405–410. [Google Scholar] [CrossRef]
- Malar, S.; Vikram, S.; Favas, P.; Perumal, V. Lead heavy metal toxicity induced changes on growth and antioxidative enzymes level in water hyacinths Eichhornia crassipes (Mart.). Bot. Stud. 2014, 55, 54. [Google Scholar] [CrossRef] [PubMed] [Green Version]
- Sharma, P.; Jha, A.B.; Dubey, R.S.; Pessarakli, M. Reactive Oxygen Species, Oxidative Damage, and Antioxidative Defense Mechanism in Plants under Stressful Conditions. J. Bot. 2012, 2012, 217037. [Google Scholar] [CrossRef] [Green Version]
- Zhang, H.; Zhang, L.L.; Li, J.; Chen, M.; An, R.D. Comparative study on the bioaccumulation of lead, cadmium and nickel and their toxic effects on the growth and enzyme defence strategies of a heavy metal accumulator, Hydrilla verticillata (L.f.) Royle. Environ. Sci. Pollut. Res. 2020, 27, 9853–9865. [Google Scholar] [CrossRef]
- Fang, Y.; Du, A.; Tan, L.; He., K.; Jin, Y.; Tian, X.; Xu, Y.; Zhao, H. Proteomics in Duckweeds. In the Compendium Duckweed Genomes. Compendium of Plant Genomes; Cao, X., Fourounjian, P., Wang, W., Eds.; Springer: Cham, Switzerl; Berlin/Heidelberg, Germany, 2020; pp. 137–141. [Google Scholar]
- Hardiningtyas, S.D.; Aziz, F.; Santoso, J.; Uju. Characterization of aquatic plant (Egeria densa) pre-treated by alkaline hydrogen peroxide. IOP Conf. Ser. Earth Environ. Sci. 2019, 404, 1. [Google Scholar] [CrossRef]
- Tausz, M.; Sircelj, H.; Grill, D. The glutathione system as a stress marker in plant ecophysiology: Is a stress-response concept valid? J. Exp. Bot. 2004, 55, 1955–1962. [Google Scholar] [CrossRef]
- Potters, G.; Pasternak, T.; Guisez, Y.; Palme, K.; Jansen, M. Stress-induced morphogenic responses: Growing out of trouble? Trends Plant Sci. 2007, 12, 98–105. [Google Scholar] [CrossRef]
- Zuluaga, M.; Gueguen, V.; Pavon-Djavid, G.; Letourneur, D. Carotenoids from microalgae to block oxidative stress. Bioimpacts 2017, 7, 1–3. [Google Scholar] [CrossRef]
- Ha, M.H.; Pflugmacher, S. Time-dependent alterations in growth, photosynthetic pigments and enzymatic defense systems of submerged Ceratophyllum demersum during exposure to the cyanobacterial neurotoxin anatoxin-a. Aquat. Toxicol. 2013, 138–139, 26–34. [Google Scholar] [CrossRef]


Publisher’s Note: MDPI stays neutral with regard to jurisdictional claims in published maps and institutional affiliations. |
© 2020 by the authors. Licensee MDPI, Basel, Switzerland. This article is an open access article distributed under the terms and conditions of the Creative Commons Attribution (CC BY) license (http://creativecommons.org/licenses/by/4.0/).
Share and Cite
Flores-Rojas, N.C.; Esterhuizen, M. Uptake and Effects of Cylindrospermopsin: Biochemical, Physiological and Biometric Responses in The Submerged Macrophyte Egeria densa Planch. Water 2020, 12, 2997. https://doi.org/10.3390/w12112997
Flores-Rojas NC, Esterhuizen M. Uptake and Effects of Cylindrospermopsin: Biochemical, Physiological and Biometric Responses in The Submerged Macrophyte Egeria densa Planch. Water. 2020; 12(11):2997. https://doi.org/10.3390/w12112997
Chicago/Turabian StyleFlores-Rojas, Nelida Cecilia, and Maranda Esterhuizen. 2020. "Uptake and Effects of Cylindrospermopsin: Biochemical, Physiological and Biometric Responses in The Submerged Macrophyte Egeria densa Planch" Water 12, no. 11: 2997. https://doi.org/10.3390/w12112997
APA StyleFlores-Rojas, N. C., & Esterhuizen, M. (2020). Uptake and Effects of Cylindrospermopsin: Biochemical, Physiological and Biometric Responses in The Submerged Macrophyte Egeria densa Planch. Water, 12(11), 2997. https://doi.org/10.3390/w12112997