Sustainable vs. Unsustainable Food Consumption Behaviour: A Study among Students from Romania, Bulgaria and Moldova

 ,
,  ,
,
Abstract
1. Introduction
2. Material and Method
3. Research Findings
3.1. Descriptive Statistics
3.2. Inferential Statistics
4. Discussions
5. Conclusions
Author Contributions
Funding
Acknowledgments
Conflicts of Interest
References
- Jacobs, C.; Berglund, M.; Kurnik, B.; Dworak, T.; Marras, S.; Mereu, V.; Michetti, M. Climate Change Adaptation in the Agriculture Sector in Europe; EEA Report: 4/2019; European Environment Agency (EEA): Luxembourg, 2019. [Google Scholar]
- Ritchie, H. Food Production Is Responsible for One-Quarter of the World’s Greenhouse Gas Emissions—Our World in Data. Available online: https://ourworldindata.org/food-ghg-emissions (accessed on 21 May 2020).
- Food and Agriculture Organization of the United Nations. Environment Statistics. The Contribution of Agriculture to Greenhouse Gas Emissions. Available online: http://www.fao.org/economic/ess/environment/data/emission-shares/en/ (accessed on 21 May 2020).
- Ritchie, H. Food Waste Is Responsible for 6% of Global Greenhouse Gas Emissions—Our World in Data. Available online: https://ourworldindata.org/food-waste-emissions (accessed on 21 May 2020).
- Sustainable Food-Environment-European Commission. Available online: https://ec.europa.eu/environment/archives/eussd/food.htm (accessed on 24 April 2020).
- Reisch, L.; Eberle, U.; Lorek, S. Sustainable food consumption: An overview of contemporary issues and policies. Sustain. Sci. Pr. Policy 2013, 9, 7–25. [Google Scholar] [CrossRef]
- United Nations. Sustainable Development Goals. Goal 12: Ensure Sustainable Consumption and Production Patterns. Available online: https://www.un.org/sustainabledevelopment/sustainable-consumption-production/ (accessed on 24 April 2020).
- Verain, M.; Sijtsema, S.; Dagevos, H.; Antonides, G. Attribute segmentation and communication effects on healthy and sustainable consumer diet intentions. Sustainability 2017, 9, 743. [Google Scholar] [CrossRef]
- Agrillo, C.; Milano, S.; Roveglia, P.; Scaffidi, C. Slow food’s contribution to the debate on the sustainability of the food system. In 148th Seminar of the EAAE “Does Europe Need a Food Policy?”; Slow Food International: Brussels, Belgium, 2015. [Google Scholar]
- Vermeir, I.; Verbeke, W. Sustainable food consumption: Exploring the consumer “attitude-behavioral intention” gap. J. Agric. Environ. Ethics 2006, 19, 169–194. [Google Scholar] [CrossRef]
- Xiao, J.J.; Li, H. Sustainable consumption and life satisfaction. Soc. Indic. Res. 2011, 104, 323–329. [Google Scholar] [CrossRef]
- Pingali, P. Policies for sustainable food systems. In Sustainable Food and Agriculture; Elsevier: Amsterdam, The Netherlands, 2019; pp. 509–521. [Google Scholar]
- Norwegian Ministry of the Environment. Oslo Roundtable on Sustainable Production and Consumption; Norwegian Ministry of the Environment: Oslo, Norway, 1994.
- Lim, E.; Arita, S.; Joung, S. Advancing sustainable consumption in Korea and Japan-from re-orientation of consumer behavior to civic actions. Sustainability 2019, 11, 6683. [Google Scholar] [CrossRef]
- Baudry, J.; Péneau, S.; Allès, B.; Touvier, M.; Hercberg, S.; Galan, P.; Amiot, M.-J.; Lairon, D.; Méjean, C.; Kesse-Guyot, E. Food choice motives when purchasing in organic and conventional consumer clusters: Focus on sustainable concerns (the NutriNet-Santé cohort study). Nutrients 2017, 9, 88. [Google Scholar] [CrossRef]
- FAO. Definition of “sustainable diets”. In Proceedings of the International Scientific Symposium “Biodiversity and Sustainable Diets: United against Hunger”, Rome, Italy, 3–5 November 2010; p. 10. [Google Scholar]
- Waxman, A. WHO global strategy on diet, physical activity and health. Food Nutr. Bull. 2004, 25, 292–302. [Google Scholar] [CrossRef]
- Mertens, E.; Van’T Veer, P.; Hiddink, G.J.; Steijns, J.M.; Kuijsten, A. Operationalising the health aspects of sustainable diets: A review. Public Health Nutr. 2017, 20, 739–757. [Google Scholar] [CrossRef]
- Antonides, G. Sustainable consumer behaviour: A collection of empirical studies. Sustainability 2017, 9, 1686. [Google Scholar] [CrossRef]
- Bollani, L.; Bonadonna, A.; Peira, G. The millennials’ concept of sustainability in the food sector. Sustainability 2019, 11, 2984. [Google Scholar] [CrossRef]
- Aschemann-Witzel, J. Consumer perception and trends about health and sustainability: Trade-offs and synergies of two pivotal issues. Curr. Opin. Food Sci. 2015, 3, 6–10. [Google Scholar] [CrossRef]
- Abraham, S.; Noriega, B.R.; Shin, J.Y. College students’ eating habits and knowledge of nutritional requirements. J. Nutr. Hum. Heal. 2018, 2, 13–17. [Google Scholar] [CrossRef]
- Carrigan, M.; Attalla, A. The myth of the ethical consumer-do ethics matter in purchase behaviour? J. Consum. Mark. 2001, 18, 560–578. [Google Scholar] [CrossRef]
- Von Meyer-Höfer, M.; von der Wense, V.; Spiller, A. Characterising convinced sustainable food consumers. Br. Food J. 2015, 117, 1082–1104. [Google Scholar] [CrossRef]
- Verain, M.C.D.; Dagevos, H.; Antonides, G. Sustainable food consumption. Product choice or curtailment? Appetite 2015, 91, 375–384. [Google Scholar] [CrossRef]
- Konttinen, H.; Sarlio-Lähteenkorva, S.; Silventoinen, K.; Männistö, S.; Haukkala, A. Socio-economic disparities in the consumption of vegetables, fruit and energy-dense foods: The role of motive priorities. Public Health Nutr. 2013, 16, 873–882. [Google Scholar] [CrossRef] [PubMed]
- Giskes, K.; Turrell, G.; Patterson, C.; Newman, B. Socio-economic differences in fruit and vegetable consumption among Australian adolescents and adults. Public Health Nutr. 2002, 5, 663–669. [Google Scholar] [CrossRef]
- Hupkens, C.L.H.; Knibbe, R.A.; Drop, M.J. Social class differences in food consumption. The explanatory value of permissiveness and health and cost considerations. Eur. J. Public Health 2000, 10, 108–113. [Google Scholar] [CrossRef]
- De Irala-Estévez, J.; Groth, M.; Johansson, L.; Oltersdorf, U.; Prättälä, R.; Martínez-González, M.A. A systematic review of socio-economic differences in food habits in Europe: Consumption of fruit and vegetables. Eur. J. Clin. Nutr. 2000, 54, 706–714. [Google Scholar] [CrossRef]
- Allès, B.; Péneau, S.; Kesse-Guyot, E.; Baudry, J.; Hercberg, S.; Méjean, C. Food choice motives including sustainability during purchasing are associated with a healthy dietary pattern in French adults. Nutr. J. 2017, 16, 58. [Google Scholar] [CrossRef]
- Bowman, S.A. A comparison of the socioeconomic characteristics, dietary practices, and health status of women food shoppers with different food price attitudes. Nutr. Res. 2006, 26, 318–324. [Google Scholar] [CrossRef]
- Guthrie, J.; Mancino, L.; Lin, C.-T.J. Nudging consumers toward better food choices: Policy approaches to changing food consumption behaviors. Psychol. Mark. 2015, 32, 501–511. [Google Scholar] [CrossRef]
- Andrews, J.C.; Netemeyer, R.G.; Burton, S. The nutrition elite: Do only the highest levels of caloric knowledge, obesity knowledge, and motivation matter in processing nutrition ad claims and disclosures? J. Public Policy Mark. 2009, 28, 41–55. [Google Scholar] [CrossRef]
- Brown, O.N.; O’Connor, L.E.; Savaiano, D. Mobile MyPlate: A pilot study using text messaging to provide nutrition education and promote better dietary choices in college students. J. Am. Coll. Heal. 2014, 62, 320–327. [Google Scholar] [CrossRef] [PubMed]
- Boucher, D.; Gagné, C.; Côté, F. Effect of an intervention mapping approach to promote the consumption of fruits and vegetables among young adults in junior college: A quasi-experimental study. Psychol. Heal. 2015, 30, 1306–1325. [Google Scholar] [CrossRef] [PubMed]
- Van Cauwenberghe, E.; Maes, L.; Spittaels, H.; Van Lenthe, F.J.; Brug, J.; Oppert, J.M.; De Bourdeaudhuij, I. Effectiveness of school-based interventions in Europe to promote healthy nutrition in children and adolescents: Systematic review of published and “grey” literature. Br. J. Nutr. 2010, 103, 781–797. [Google Scholar] [CrossRef]
- Bryła, P. The development of organic food market as an element of sustainable development concept implementation. Probl. Ekorozwoju Probl. Sustain. Dev. 2015, 10, 79–88. [Google Scholar]
- Vermeir, I.; Verbeke, W. Sustainable food consumption among young adults in Belgium: Theory of planned behaviour and the role of confidence and values. Ecol. Econ. 2008, 64, 542–553. [Google Scholar] [CrossRef]
- Robinson-O’Brien, R.; Larson, N.; Neumark-Sztainer, D.; Hannan, P.; Story, M. Characteristics and dietary patterns of adolescents who value eating locally grown, organic, nongenetically engineered, and nonprocessed food. J. Nutr. Educ. Behav. 2009, 41, 11–18. [Google Scholar] [CrossRef]
- Eisinger-Watzl, M.; Wittig, F.; Heuer, T.; Hoffmann, I. Customers purchasing organic food-do they live healthier? Results of the German national nutrition survey II. Eur. J. Nutr. Food Saf. 2015, 5, 59–71. [Google Scholar] [CrossRef]
- Annunziata, A.; Mariani, A. Consumer perception of sustainability attributes in organic and local food. Recent Pat. Food. Nutr. Agric. 2018, 9, 87–96. [Google Scholar] [CrossRef] [PubMed]
- Vecchio, R.; Annunziata, A. Consumers’ attitudes towards sustainable food: A cluster analysis of Italian university students. New Medit 2013, 12, 47–56. [Google Scholar]
- Savelli, E.; Murmura, F.; Liberatore, L.; Casolani, N.; Bravi, L. Consumer attitude and behaviour towards food quality among the young ones: Empirical evidences from a survey. Total Qual. Manag. Bus. Excel. 2019, 30, 169–183. [Google Scholar] [CrossRef]
- Kamenidou, I.C.; Mamalis, S.A.; Pavlidis, S.; Bara, E.-Z.G. Segmenting the generation Z cohort university students based on sustainable food consumption behavior: A preliminary study. Sustainability 2019, 11, 837. [Google Scholar] [CrossRef]
- Stok, F.; Renner, B.; Clarys, P.; Lien, N.; Lakerveld, J.; Deliens, T. Understanding eating behavior during the transition from adolescence to young adulthood: A literature review and perspective on future research directions. Nutrients 2018, 10, 667. [Google Scholar] [CrossRef]
- Bădescu, G.; Uslaner, E.M. Social Capital and the Transition to Democracy; Routledge: Abingdon, UK, 2003. [Google Scholar]
- El Ansari, W.; Stock, C.; Mikolajczyk, R.T. Relationships between food consumption and living arrangements among university students in four European countries—A cross-sectional study. Nutr. J. 2012, 11. [Google Scholar] [CrossRef]
- Pocol, C.B.; Bența, I.; Ciobanu, E.; Cozma-Petruț, A.; Crețu-Stuparu, M.; Croitoru, C.; Marinescu, V.; Mateva, N.; Moldavian-Teselios, C.; Stranț, M. Comportamentul de Consum Alimentar În Rândul Tinerilor, Raport de Cercetare, Project “Réseau Régional Francophone sur la Santé, la Nutrition et la Sécurité Alimentaire (SaIN)” Financed by AUF. 2018. Available online: https://www.auf.org/europe-centrale-orientale/ (accessed on 23 March 2020).
- Friel, S.; Barosh, L.J.; Lawrence, M. Towards healthy and sustainable food consumption: An Australian case study. Public Health Nutr. 2014, 17, 1156–1166. [Google Scholar] [CrossRef]
- Graur, M.; Mihai, B.; Botnariu, G.; Popescu, R.; Lăcătuşu, C.; Mihalache, L.; Răcaru, V.; Ciocan, M.; Colisnic, A.; Popa, A.; et al. Ghid Pentru Alimentaţia Sănătoasă; Performantica: Iași, Romania, 2006. [Google Scholar]
- Ministry of Health-National Center of Public Health Protection (NCPHP); WHO Regional Office for Europe. Food-Based Dietary Guidelines in for Adults in Bulgaria; FAO: Sofia, Bulgaria, 2006. [Google Scholar]
- Croitoru, C.; Ciobanu, E.; Bahnarel, I.; Burduniuc, O.; Cazacu-Stratu, A.; Cebanu, S.; Ciobanu, E.; Ferdohleb, A.; Fira-Mlădinescu, C.; Friptuleac, G.; et al. Ghid de Bune Practici: Alimentație Rațională, Siguranța Alimentelor Și Schimbarea Comportamentului Alimentar; USMF: Chișinău, Moldova, 2019. [Google Scholar]
- Vilija, M.; Romualdas, M. Unhealthy food in relation to posttraumatic stress symptoms among adolescents. Appetite 2014, 74, 86–91. [Google Scholar] [CrossRef]
- Bech-Larsen, T.; Kazbare, L. Spillover of diet changes on intentions to approach healthy food and avoid unhealthy food. Health Educ. 2014, 114, 367–377. [Google Scholar] [CrossRef]
- Visram, S.; Cheetham, M.; Riby, D.M.; Crossley, S.J.; Lake, A.A. Consumption of energy drinks by children and young people: A rapid review examining evidence of physical effects and consumer attitudes. BMJ Open 2016, 6, e010380. [Google Scholar] [CrossRef]
- Ehlers, A.; Marakis, G.; Lampen, A.; Hirsch-Ernst, K.I. Risk assessment of energy drinks with focus on cardiovascular parameters and energy drink consumption in Europe. Food Chem. Toxicol. 2019, 130, 109–121. [Google Scholar] [CrossRef] [PubMed]
- Lang, T.; Barling, D. Nutrition and sustainability: An emerging food policy discourse. Proc. Nutr. Soc. 2013, 72, 1–12. [Google Scholar] [CrossRef] [PubMed]
- Health Council of the Netherland. Guidelines for a Healthy Diet: The Ecological Perspective|Advisory Report|The Health Council of the Netherlands; Health Council of the Netherland: Hague, The Netherlands, 2011. [Google Scholar]
- Westhoek, H.; Lesschen, J.P.; Rood, T.; Wagner, S.; De Marco, A.; Murphy-Bokern, D.; Leip, A.; van Grinsven, H.; Sutton, M.A.; Oenema, O. Food choices, health and environment: Effects of cutting Europe’s meat and dairy intake. Glob. Environ. Chang. 2014, 26, 196–205. [Google Scholar] [CrossRef]
- Elmadfa, I.; Meyer, A.; Nowak, V.; Hasenegger, V.; Putz, P.; Verstraeten, R.; Remaut-DeWinter, A.A.M.; Kolsteren, P.; Dostálová, J. European Nutrition and Health Report 2009, 62nd ed.; Elmadfa, I., Ed.; Karger: Basel, Switzerland, 2009. [Google Scholar] [CrossRef]
- World Health Organization. Comparative Analysis of Nutrition Policies in the WHO European Region: A Comparative Analysis of Nutrition Policies and Plans of Action in WHO European Region; WHO: Copenhagen, Denmark, 2006. [Google Scholar]
- Dagevos, H.; Voordouw, J. Sustainability and meat consumption: Is reduction realistic? Sustain. Sci. Pr. Policy 2013, 9, 60–69. [Google Scholar] [CrossRef]
- Marsh, K.; Saunders, A.; Zeuschner, C. Chapter 8. red meat and health: Evidence regarding red meat, health, and chronic disease risk. In Impact of Meat Consumption on Health and Environmental Sustainability; Raphaely, A., Marinova, D., Eds.; IGI Global: Hershey, PA, USA, 2015; p. 131. [Google Scholar]
- World Health Organization. Diet, Nutrition, and the Prevention of Chronic Diseases: Report of a Joint WHO/FAO Expert Consultation; WHO Technical Report Series 916; WHO: Geneva, Switzerland, 2003. [Google Scholar]
- Perignon, M.; Vieux, F.; Soler, L.-G.; Masset, G.; Darmon, N. Improving diet sustainability through evolution of food choices: Review of epidemiological studies on the environmental impact of diets. Nutr. Rev. 2017, 75, 2–17. [Google Scholar] [CrossRef]
- Poobalan, A.S.; Aucott, L.S.; Clarke, A.; Smith, W.C.S. Diet behaviour among young people in transition to adulthood (18–25 year olds): A mixed method study. Heal. Psychol. Behav. Med. 2014, 2, 909–928. [Google Scholar] [CrossRef] [PubMed]
- Bernardo, G.L.; Jomori, M.M.; Fernandes, A.C.; da Proença, R.P.C. Food intake of university students. Rev. Nutr. 2017, 30, 847–865. [Google Scholar] [CrossRef]
- Birt, C.; Buzeti, T.; Grosso, G.; Justesen, L.; Lachat, C.; Lafranconi, A.; Mertanen, E.; Rangelov, N.; Sarlio-Lähteenkorva, S. Healthy and Sustainable Diets for European Countries; European Public Health Association: Utrecht, The Netherlands, 2017. [Google Scholar]
- MacDiarmid, J.I. Is a healthy diet an environmentally sustainable diet? Proc. Nutr. Soc. 2013, 72, 13–20. [Google Scholar] [CrossRef]
- Salameh, P.; Jomaa, L.; Issa, C.; Farhat, G.; Salamé, J.; Zeidan, N.; Baldi, I.; Barbour, B.; Waked, M.; Zeghondi, H.; et al. Assessment of dietary intake patterns and their correlates among university students in Lebanon. Front. Public Heal. 2014, 2, 185. [Google Scholar] [CrossRef]
- Williams, S.L.; Vandelanotte, C.; Irwin, C.; Bellissimo, N.; Heidke, P.; Saluja, S.; Saito, A.; Khalesi, S. Association between dietary patterns and sociodemographics: A cross-sectional study of Australian nursing students. Nurs. Health Sci. 2019, 22, 38–48. [Google Scholar] [CrossRef]
- Resano, H.; Perez-Cueto, F.J.A.; de Barcellos, M.D.; Veflen-Olsen, N.; Grunert, K.G.; Verbeke, W. Consumer satisfaction with pork meat and derived products in five European countries. Appetite 2011, 56, 167–170. [Google Scholar] [CrossRef] [PubMed]
- Stanford, L. Observations on alcohol beverage consumption. Aust. New Zeal. Wine Ind. J. 2000, 15, 14–27. [Google Scholar]
- Demura, S.; Aoki, H.; Mizusawa, T.; Soukura, K.; Noda, M.; Sato, T. Gender differences in coffee consumption and its effects in young people. Food Nutr. Sci. 2013, 4, 748–757. [Google Scholar] [CrossRef]
- Nelson, M.C.; Kocos, R.; Lytle, L.A.; Perry, C.L. Understanding the perceived determinants of weight-related behaviors in late adolescence: A qualitative analysis among college youth. J. Nutr. Educ. Behav. 2009, 41, 287–292. [Google Scholar] [CrossRef] [PubMed]
- Gunes, F.E.; Bekiroglu, N.; Imeryuz, N.; Agirbasli, M. Relation between eating habits and a high body mass index among freshman students: A cross-sectional study. J. Am. Coll. Nutr. 2012, 31, 167–174. [Google Scholar] [CrossRef]
- Musaiger, A.O.; Radwan, H.M. Social and dietary factors associated with obesity in university female students in United Arab Emirates. J. R. Soc. Health 1995, 115, 96–99. [Google Scholar] [CrossRef]
- Rodrigues, P.R.M.; Luiz, R.R.; Monteiro, L.S.; Ferreira, M.G.; Gonçalves-Silva, R.M.V.; Pereira, R.A. Adolescents’ unhealthy eating habits are associated with meal skipping. Nutrition 2017, 42, 114. [Google Scholar] [CrossRef]
- Striegel-Moore, R.H.; Franko, D.L.; Thompson, D.; Affenito, S.; Kraemer, H.C. Night eating: Prevalence and demographic correlates. Obesity 2006, 14, 139–147. [Google Scholar] [CrossRef]
- Kiefer, I.; Rathmanner, T.; Kunze, M. Eating and dieting differences in men and women. J. Men’s Heal. Gend. 2005, 2, 194–201. [Google Scholar] [CrossRef]
- Zellner, D.A.; Saito, S.; Gonzalez, J. The effect of stress on men’s food selection. Appetite 2007, 49, 696–699. [Google Scholar] [CrossRef]
- Górska-Warsewicz, H.; Rejman, K.; Laskowski, W.; Czeczotko, M. Butter, margarine, vegetable oils, and olive oil in the average polish diet. Nutrients 2019, 11, 2935. [Google Scholar] [CrossRef] [PubMed]
- Lipovetsky, G.; Ungurean, M. Fericirea Paradoxală: Eseu Asupra Societății de Hiperconsum; Polirom: Iași, Romania, 2007. [Google Scholar]


| Gender | Age | Total | ||||||||
|---|---|---|---|---|---|---|---|---|---|---|
| Male | Female | 18–19 Years Old | 20–21 Years Old | 22–23 Years Old | 24–25 Years Old | 26 Years Old+ | Don’t Know/ No Opinion | |||
| What kind of diet do you usually have? | Mixed | 93.2% | 87.5% | 92.7% | 89.3% | 90.3% | 83.6% | 82.9% | 86.2% | 89.3% |
| Semi-vegetarian | 2.7% | 7.1% | 4.5% | 5.2% | 5.6% | 8.6% | 10.3% | 0.0% | 5.7% | |
| Ovo-lacto-vegetarian | 1.4% | 3.5% | 1.2% | 2.9% | 2.1% | 5.6% | 4.3% | 13.8% | 2.9% | |
| Lacto-vegetarian | 0.3% | 0.6% | 0.2% | 0.7% | 0.0% | 1.5% | 0.0% | 0.0% | 0.4% | |
| Vegetarian | 0.3% | 0.3% | 0.0% | 0.4% | 0.4% | 0.0% | 0.8% | 0.0% | 0.3% | |
| Don’t know/ No opinion | 2.1% | 1.0% | 1.4% | 1.5% | 1.6% | 0.7% | 1.7% | 0.0% | 14% | |
| Total | 100% | 100% | 100% | 100% | 100% | 100% | 100% | 100% | 100% | |
| Model | Unstandardised Coefficients | Standardised Coefficients | t | Sig. | |
|---|---|---|---|---|---|
| Butter | 0.192 | 0.086 | 0.060 | 2.232 | 0.026 |
| Margarine | −0.169 | 0.075 | −0.060 | −2.248 | 0.025 |
| Pork meat | 0.237 | 0.093 | 0.073 | 2.564 | 0.010 |
| Canned meat | 0.291 | 0.095 | 0.087 | 3.055 | 0.002 |
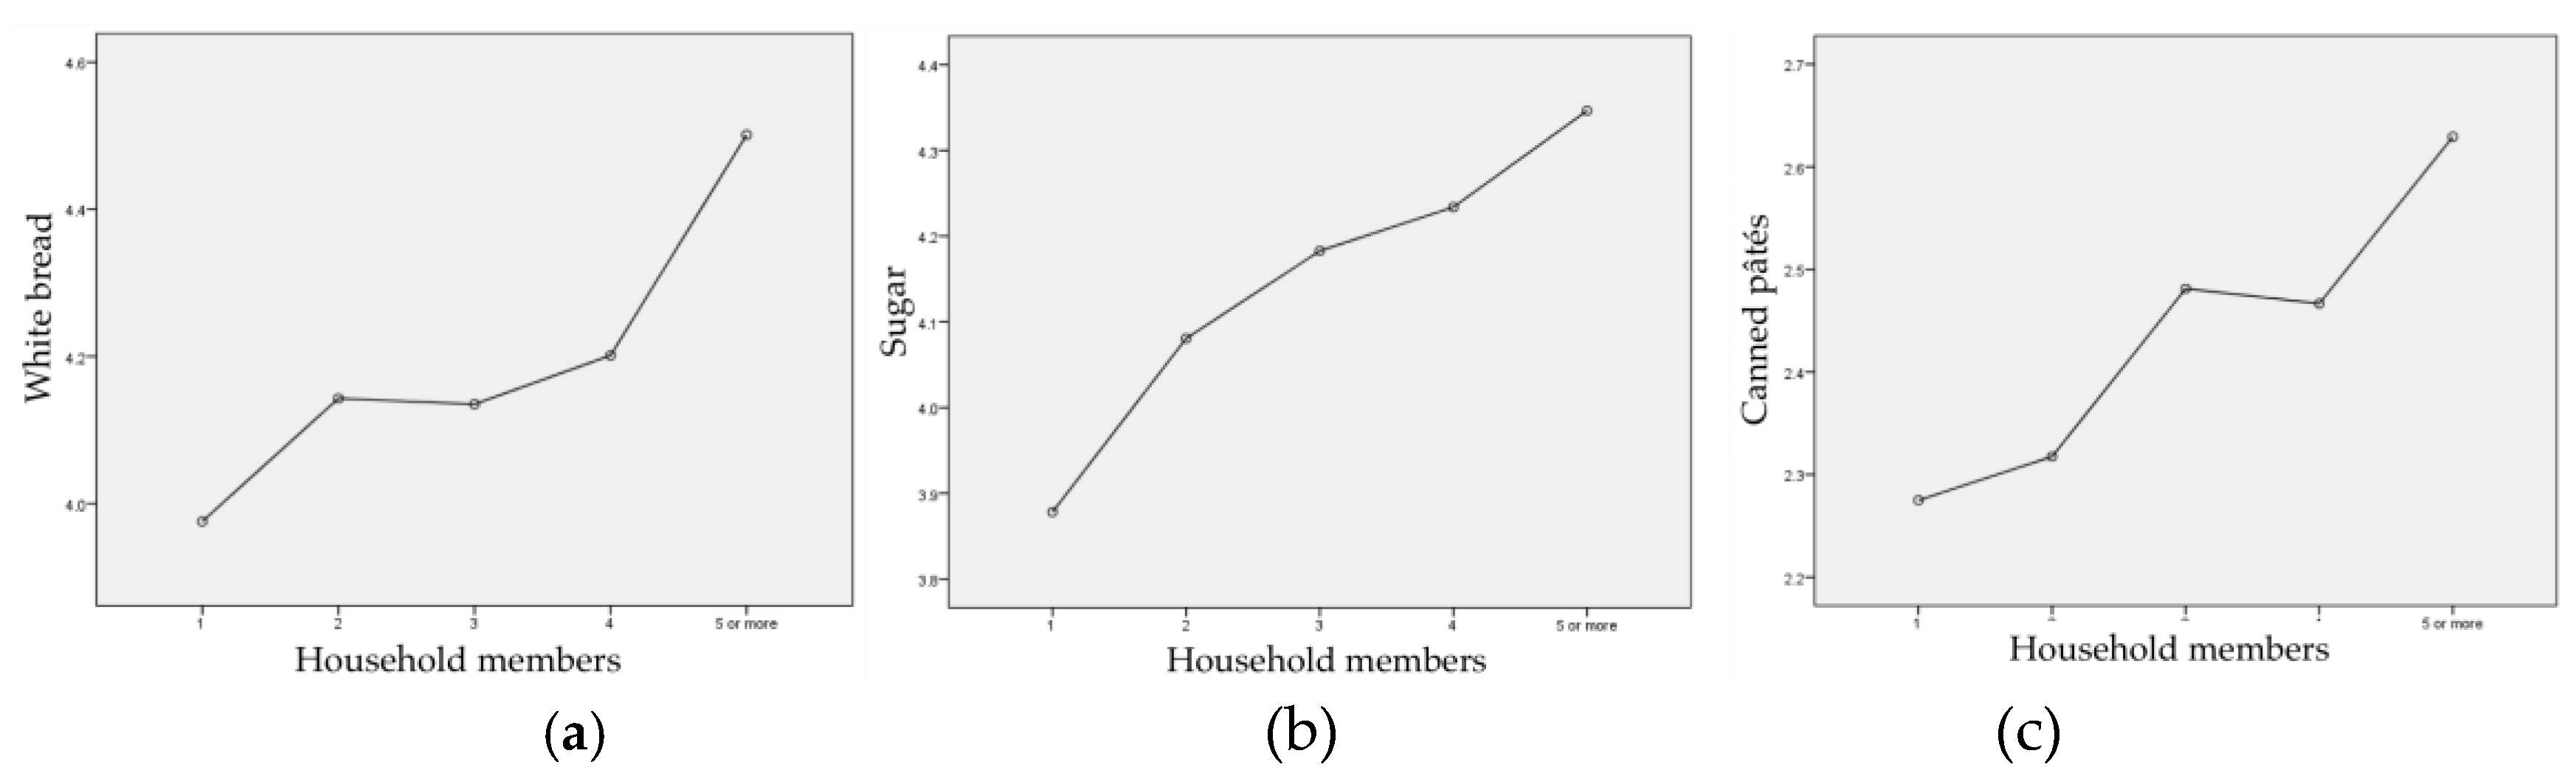
| Canned pâtés | −0.234 | 0.088 | −0.074 | −2.660 | 0.008 |
| Sunflower oil | 0.244 | 0.087 | 0.075 | 2.794 | 0.005 |
| Industrially obtained sweets | −0.232 | 0.110 | −0.063 | −2.111 | 0.035 |
| Semi−prepared foods | −0.215 | 0.095 | −0.066 | −2.266 | 0.024 |
| Wine | 0.324 | 0.095 | 0.107 | 3.420 | 0.001 |
| Energy drinks | −0.234 | 0.078 | −0.083 | −3.003 | 0.003 |
| Coffee | 0.208 | 0.054 | 0.096 | 3.879 | 0.000 |
| Model | Unstandardised Coefficients | Standardised Coefficients | t | Sig. | |
|---|---|---|---|---|---|
| I eat alone | −0.136 | 0.069 | −0.045 | −1.962 | 0.050 |
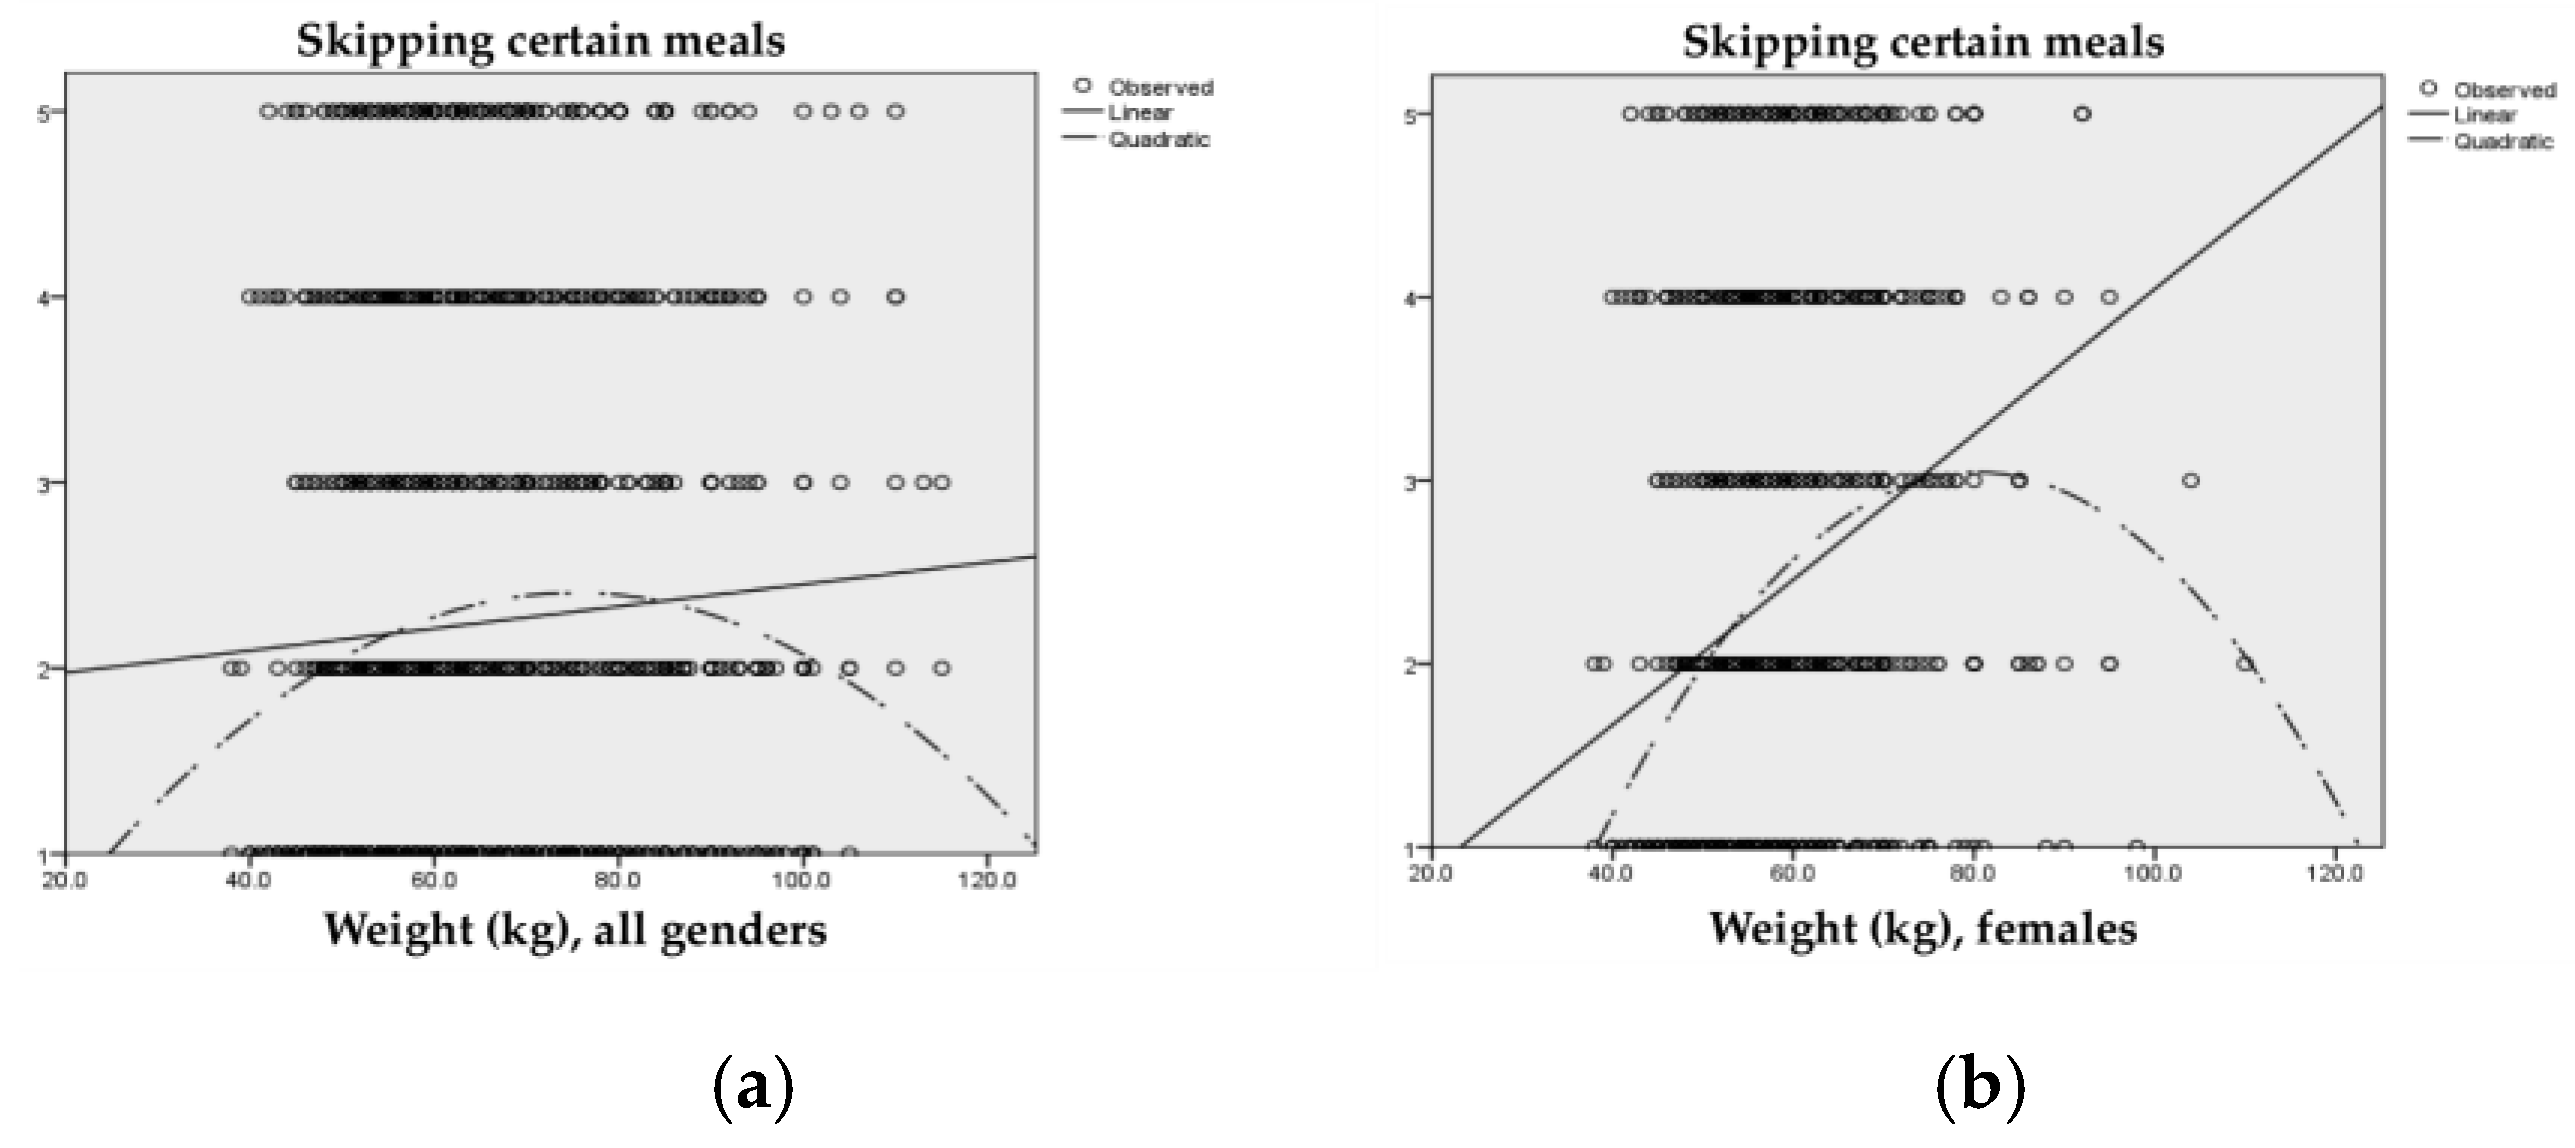
| I skip certain meals in order to prevent gaining weight | 0.116 | 0.059 | 0.050 | 1.972 | 0.049 |
| I eat while talking on the phone/sending SMS/emails | −0.201 | 0.055 | −0.088 | −3.664 | 0.000 |
| I do not eat in order to save money | −0.319 | 0.066 | −0.119 | −4.805 | 0.000 |
| I eat while standing | 0.282 | 0.062 | 0.110 | 4.534 | 0.000 |
| I have the last meal of the day after 23:00 | −0.225 | 0.062 | −0.089 | −3.599 | 0.000 |
| Model | Unstandardised Coefficients | Standardised Coefficients | t | Sig. | |
|---|---|---|---|---|---|
| I do not have breakfast | 0.909 | 0.240 | 0.095 | 3.784 | 0.000 |
| I do not eat because I feel stressed | −1.897 | 0.246 | −0.182 | −7.696 | 0.000 |
| I skip certain meals in order to prevent gaining weight | 0.998 | 0.244 | 0.103 | 4.082 | 0.000 |
| I eat while talking on the phone/sending SMS/emails | −1.406 | 0.226 | −0.149 | −6.218 | 0.000 |
| I eat while standing | 1.058 | 0.257 | 0.099 | 4.114 | 0.000 |
| I have snacks between meals | −0.868 | 0.316 | −0.068 | −2.746 | 0.006 |
| I have the last meal of the day after 23:00 | 0.715 | 0.258 | 0.068 | 2.768 | 0.006 |
| Levene’s Test for Equality of Variances | t-test for Equality of Means | |||||||||
|---|---|---|---|---|---|---|---|---|---|---|
| F | Sig. | t | df | Sig. (2-tailed) | Mean Difference | Std. Error Difference | 95% Confidence Interval of the Difference | |||
| Lower | Upper | |||||||||
| Industrially obtained sweets | Equal variances assumed | 0.388 | 0.533 | −2.609 | 2349 | 0.009 | −0.106 | 0.041 | −0.186 | −0.026 |
| Equal variances not assumed | −2.659 | 1478.000 | 0.008 | −0.106 | 0.040 | −0.185 | −0.028 | |||
| Semi−prepared foods | Equal variances assumed | 1.680 | 0.195 | 2.888 | 2341 | 0.004 | 0.133 | 0.046 | 0.043 | 0.223 |
| Equal variances not assumed | 2.965 | 1484.929 | 0.003 | 0.133 | 0.045 | 0.045 | 0.221 | |||
| Beer | Equal variances assumed | 0.359 | 0.549 | 19.936 | 2330 | 0.000 | 1.009 | 0.051 | 0.910 | 1.108 |
| Equal variances not assumed | 19.466 | 1320.280 | 0.000 | 1.009 | 0.052 | 0.907 | 1.111 | |||
| Frizzy drinks | Equal variances assumed | 0.981 | 0.322 | 10.047 | 2349 | 0.000 | 0.542 | 0.054 | 0.436 | 0.648 |
| Equal variances not assumed | 10.325 | 1511.803 | 0.000 | 0.542 | 0.053 | 0.439 | 0.645 | |||
| Coffee | Equal variances assumed | 1.188 | 0.276 | −2.691 | 2348 | 0.007 | −0.185 | 0.069 | −0.321 | −0.050 |
| Equal variances not assumed | −2.687 | 1397.216 | 0.007 | −0.185 | 0.069 | −0.321 | −0.050 | |||
| Levene’s Test for Equality of Variances | t-test for Equality of Means | |||||||||
|---|---|---|---|---|---|---|---|---|---|---|
| F | Sig. | t | df | Sig. (2-tailed) | Mean Difference | Std. Error Difference | 95% Confidence Interval of the Difference | |||
| Lower | Upper | |||||||||
| I do not eat because I feel stressed | Equal variances assumed | 0.708 | 0.400 | −4.891 | 2336 | 0.000 | −0.281 | 0.057 | −0.393 | −0.168 |
| Equal variances not assumed | −4.853 | 1354.720 | 0.000 | −0.281 | 0.058 | −0.394 | −0.167 | |||
| I eat while standing | Equal variances assumed | 1.042 | 0.307 | 2.050 | 2343 | 0.041 | 0.116 | 0.057 | 0.005 | 0.228 |
| Equal variances not assumed | 2.035 | 1372.007 | 0.042 | 0.116 | 0.057 | 0.004 | 0.229 | |||
| I have snacks between meals | Equal variances assumed | 0.963 | 0.327 | −3.457 | 2333 | 0.001 | −0.167 | 0.048 | −0.262 | −0.072 |
| Equal variances not assumed | −3.461 | 1396.776 | 0.001 | −0.167 | 0.048 | −0.261 | −0.072 | |||
| I have the last meal of the day after 11 pm | Equal variances assumed | 3.786 | 0.052 | 9.525 | 2354 | 0.000 | 0.532 | 0.056 | 0.423 | 0.642 |
| Equal variances not assumed | 9.625 | 1433.008 | 0.000 | 0.532 | 0.055 | 0.424 | 0.641 | |||
| I consume alcoholic beverages | Equal variances assumed | 2.874 | 0.090 | 12.612 | 2350 | 0.000 | 0.643 | 0.051 | 0.543 | 0.743 |
| Equal variances not assumed | 12.322 | 1324.868 | 0.000 | 0.643 | 0.052 | 0.541 | 0.745 | |||
| Levene’s Test for Equality of Variances | t-test for Equality of Means | |||||||||
|---|---|---|---|---|---|---|---|---|---|---|
| F | Sig. | t | df | Sig. (2-tailed) | Mean Difference | Std. Error Difference | 95% Confidence Interval of the Difference | |||
| Lower | Upper | |||||||||
| Butter | Equal variances assumed | 3.690 | 0.055 | 2.957 | 2331 | 0.003 | 0.139 | 0.047 | 0.047 | 0.230 |
| Equal variances not assumed | 2.994 | 1494.901 | 0.003 | 0.139 | 0.046 | 0.048 | 0.229 | |||
| Margarine | Equal variances assumed | 3.429 | 0.064 | −3.381 | 2301 | 0.001 | −0.177 | 0.052 | −0.280 | −0.074 |
| Equal variances not assumed | −3.363 | 1413.745 | 0.001 | −0.177 | 0.053 | −0.281 | −0.074 | |||
| Canned pâtés | Equal variances assumed | 1.693 | 0.193 | −4.937 | 2299 | 0.000 | −0.234 | 0.047 | −0.327 | −0.141 |
| Equal variances not assumed | −4.958 | 1448.441 | 0.000 | −0.234 | 0.047 | −0.327 | −0.142 | |||
© 2020 by the authors. Licensee MDPI, Basel, Switzerland. This article is an open access article distributed under the terms and conditions of the Creative Commons Attribution (CC BY) license (http://creativecommons.org/licenses/by/4.0/).
Share and Cite
Pocol, C.B.; Marinescu, V.; Amuza, A.; Cadar, R.-L.; Rodideal, A.A. Sustainable vs. Unsustainable Food Consumption Behaviour: A Study among Students from Romania, Bulgaria and Moldova. Sustainability 2020, 12, 4699. https://doi.org/10.3390/su12114699
Pocol CB, Marinescu V, Amuza A, Cadar R-L, Rodideal AA. Sustainable vs. Unsustainable Food Consumption Behaviour: A Study among Students from Romania, Bulgaria and Moldova. Sustainability. 2020; 12(11):4699. https://doi.org/10.3390/su12114699
Chicago/Turabian StylePocol, Cristina Bianca, Valentina Marinescu, Antonio Amuza, Roxana-Larisa Cadar, and Anda Anca Rodideal. 2020. "Sustainable vs. Unsustainable Food Consumption Behaviour: A Study among Students from Romania, Bulgaria and Moldova" Sustainability 12, no. 11: 4699. https://doi.org/10.3390/su12114699
APA StylePocol, C. B., Marinescu, V., Amuza, A., Cadar, R.-L., & Rodideal, A. A. (2020). Sustainable vs. Unsustainable Food Consumption Behaviour: A Study among Students from Romania, Bulgaria and Moldova. Sustainability, 12(11), 4699. https://doi.org/10.3390/su12114699