Germ-Free Swiss Webster Mice on a High-Fat Diet Develop Obesity, Hyperglycemia, and Dyslipidemia

 ,
,  ,
,  ,
,
Abstract
:
1. Introduction
2. Materials and Methods
2.1. Experimental Design
2.2. Diets
2.3. Measurement of Blood Metabolic Profiles
2.4. Glucose Tolerance Test
2.5. Lipidomics and Acylcarnitine Quantification
2.6. Statistical Analysis
3. Results
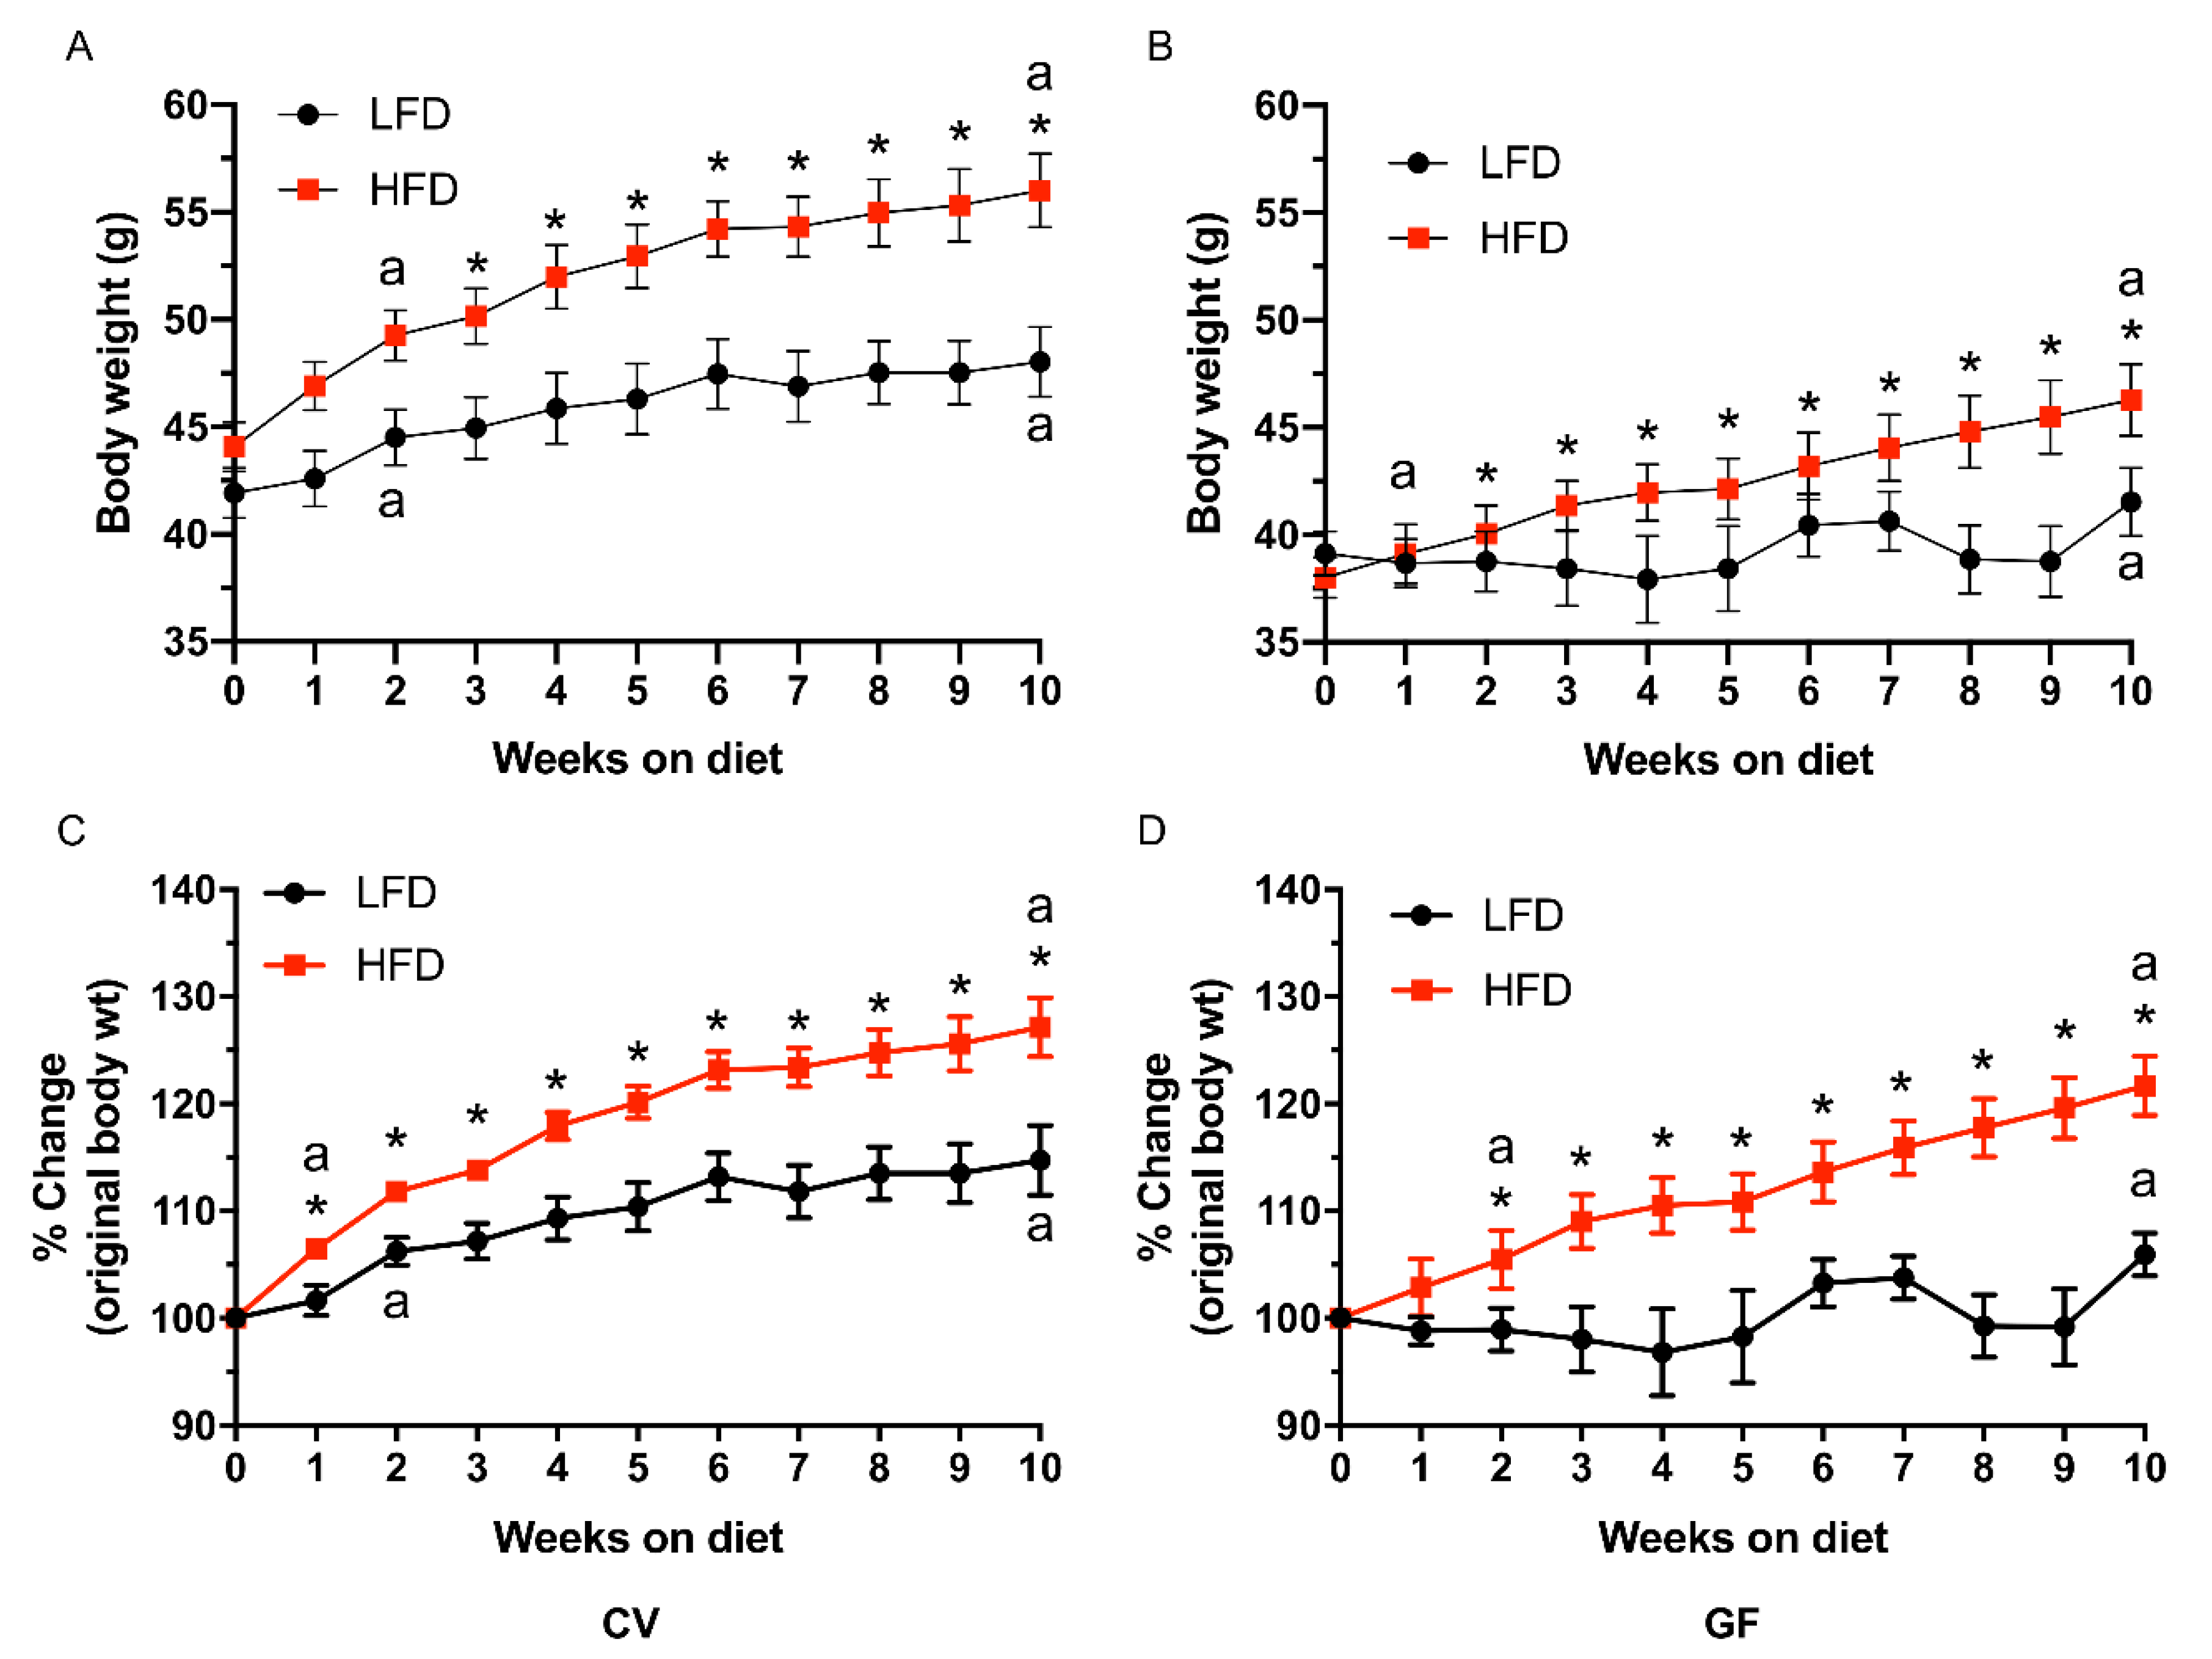
3.1. Conventional and Germ-Free Tac:SW Mice Develop Obesity on the High Fat Diet
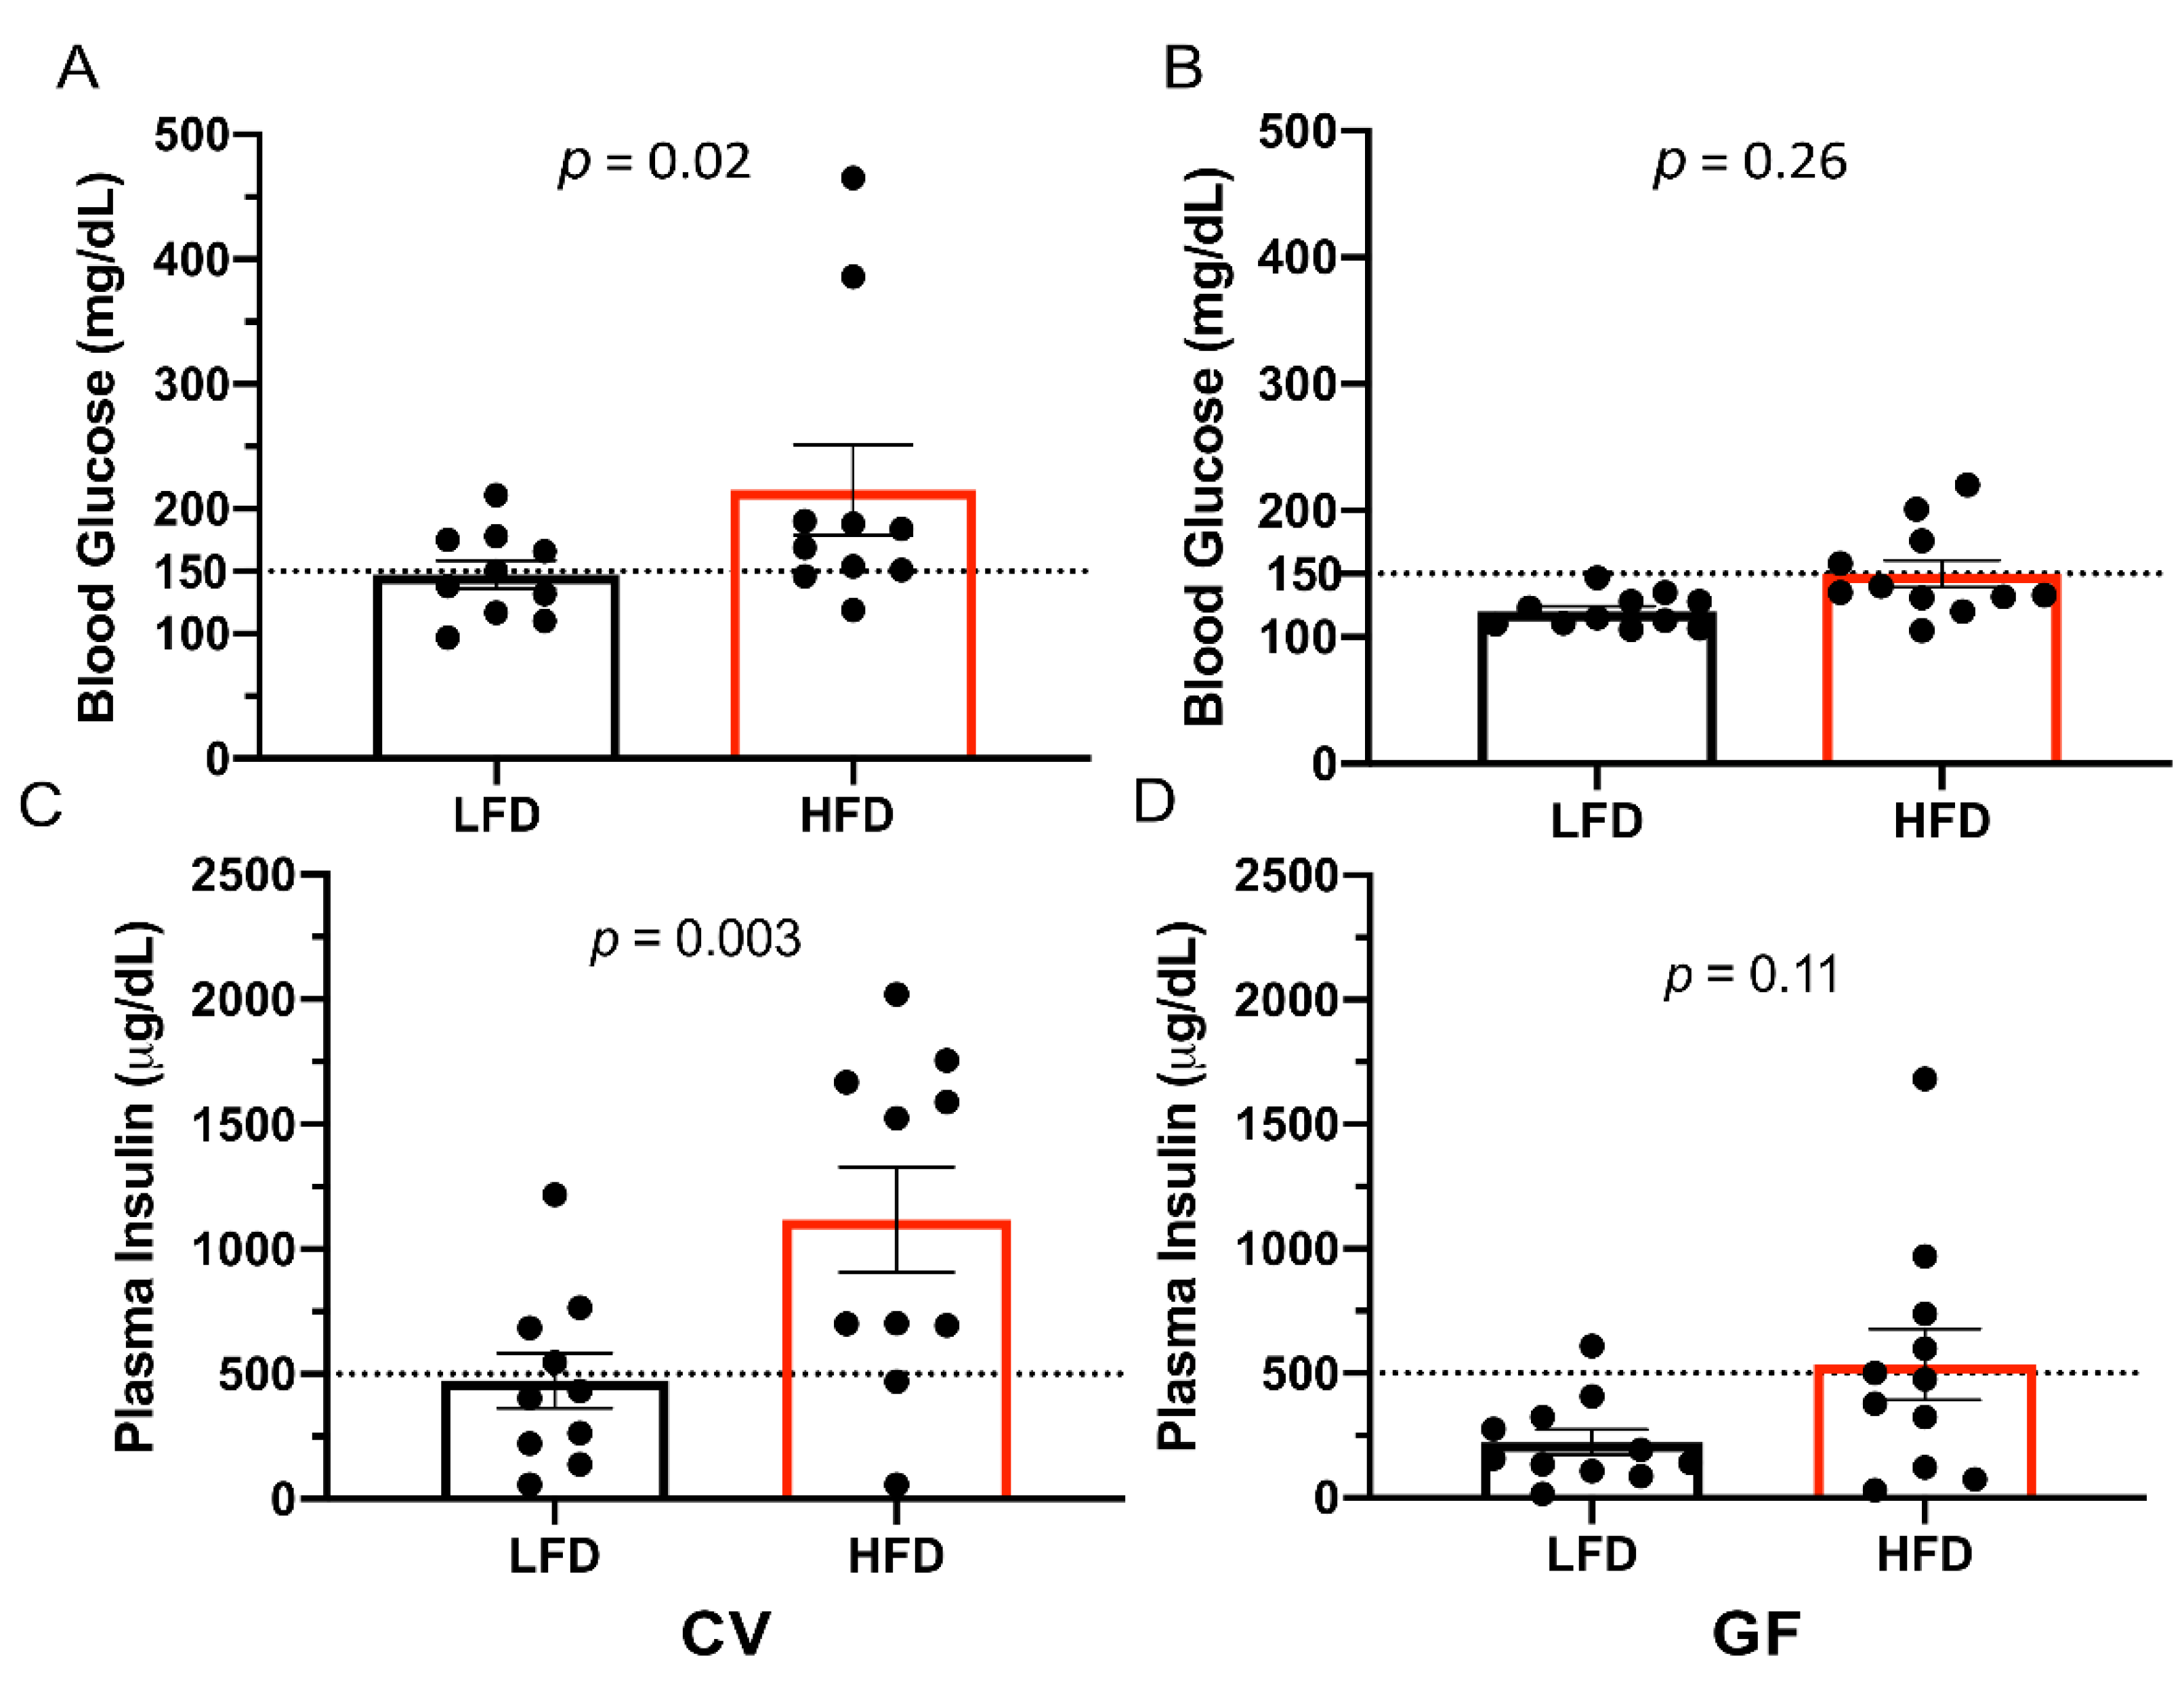
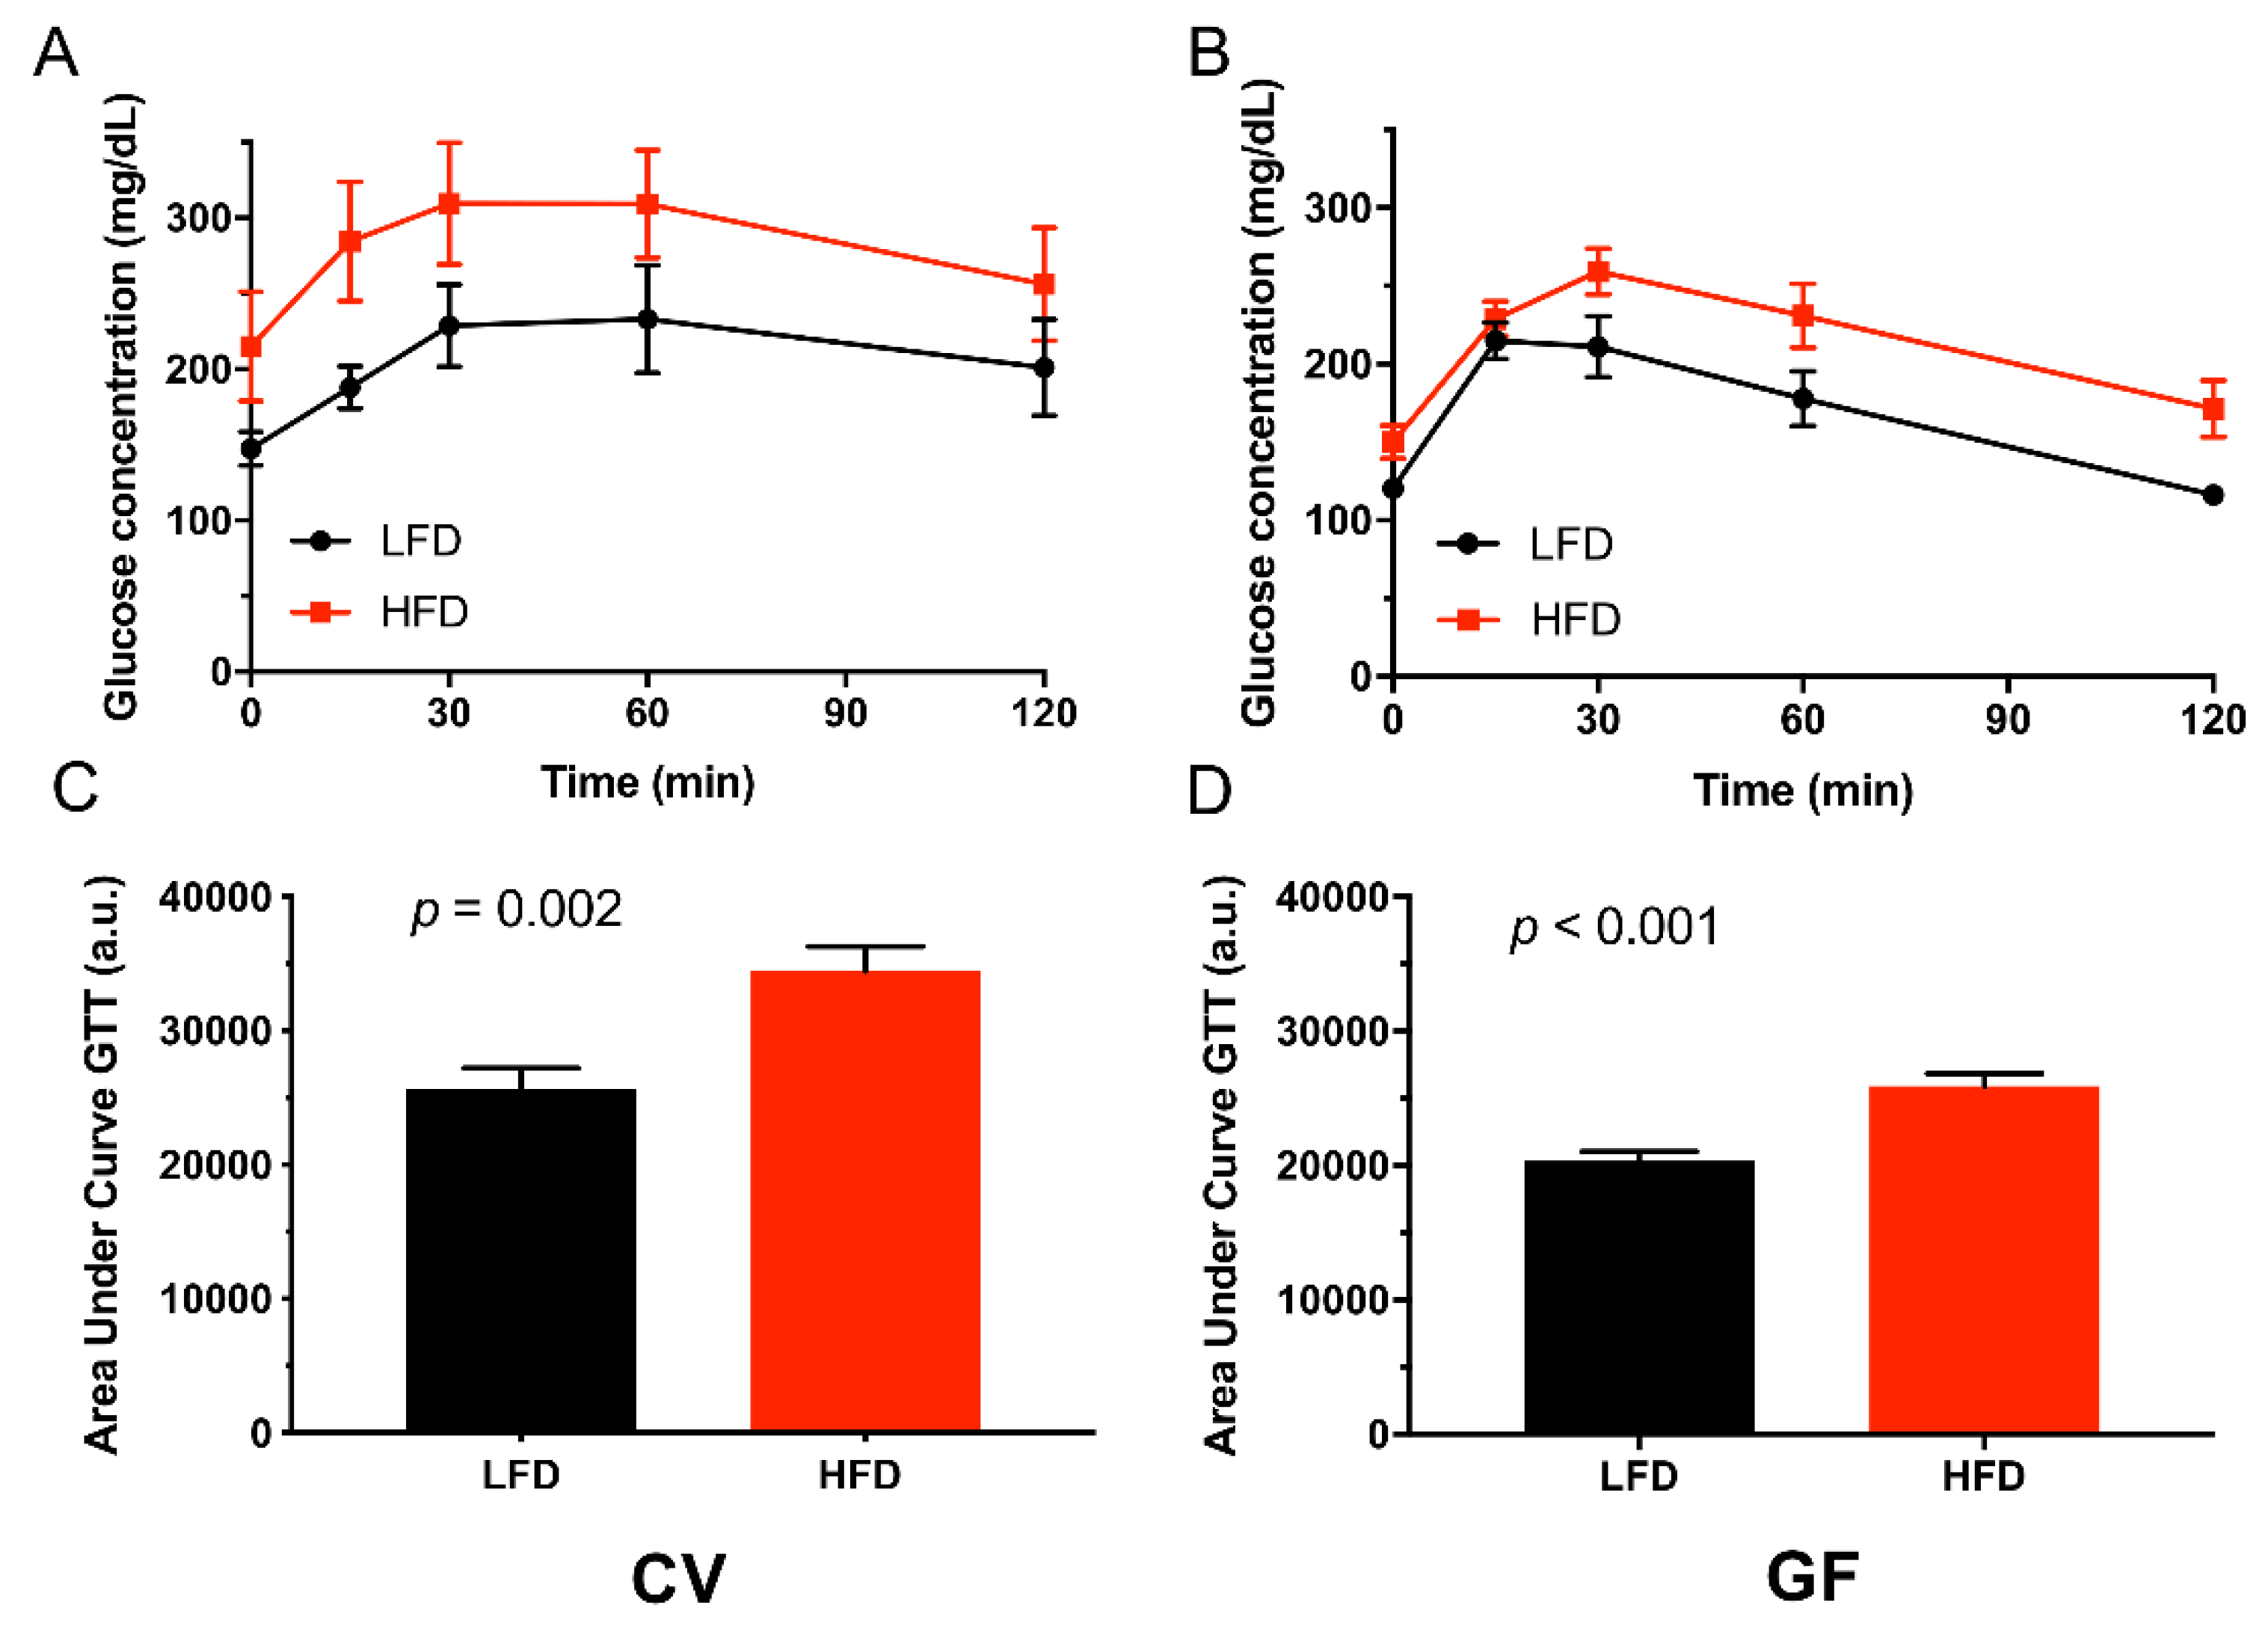
3.2. Conventional and Germ-Free Tac:SW Mice Develop Impaired Glucose Regulation on the High Fat Diet
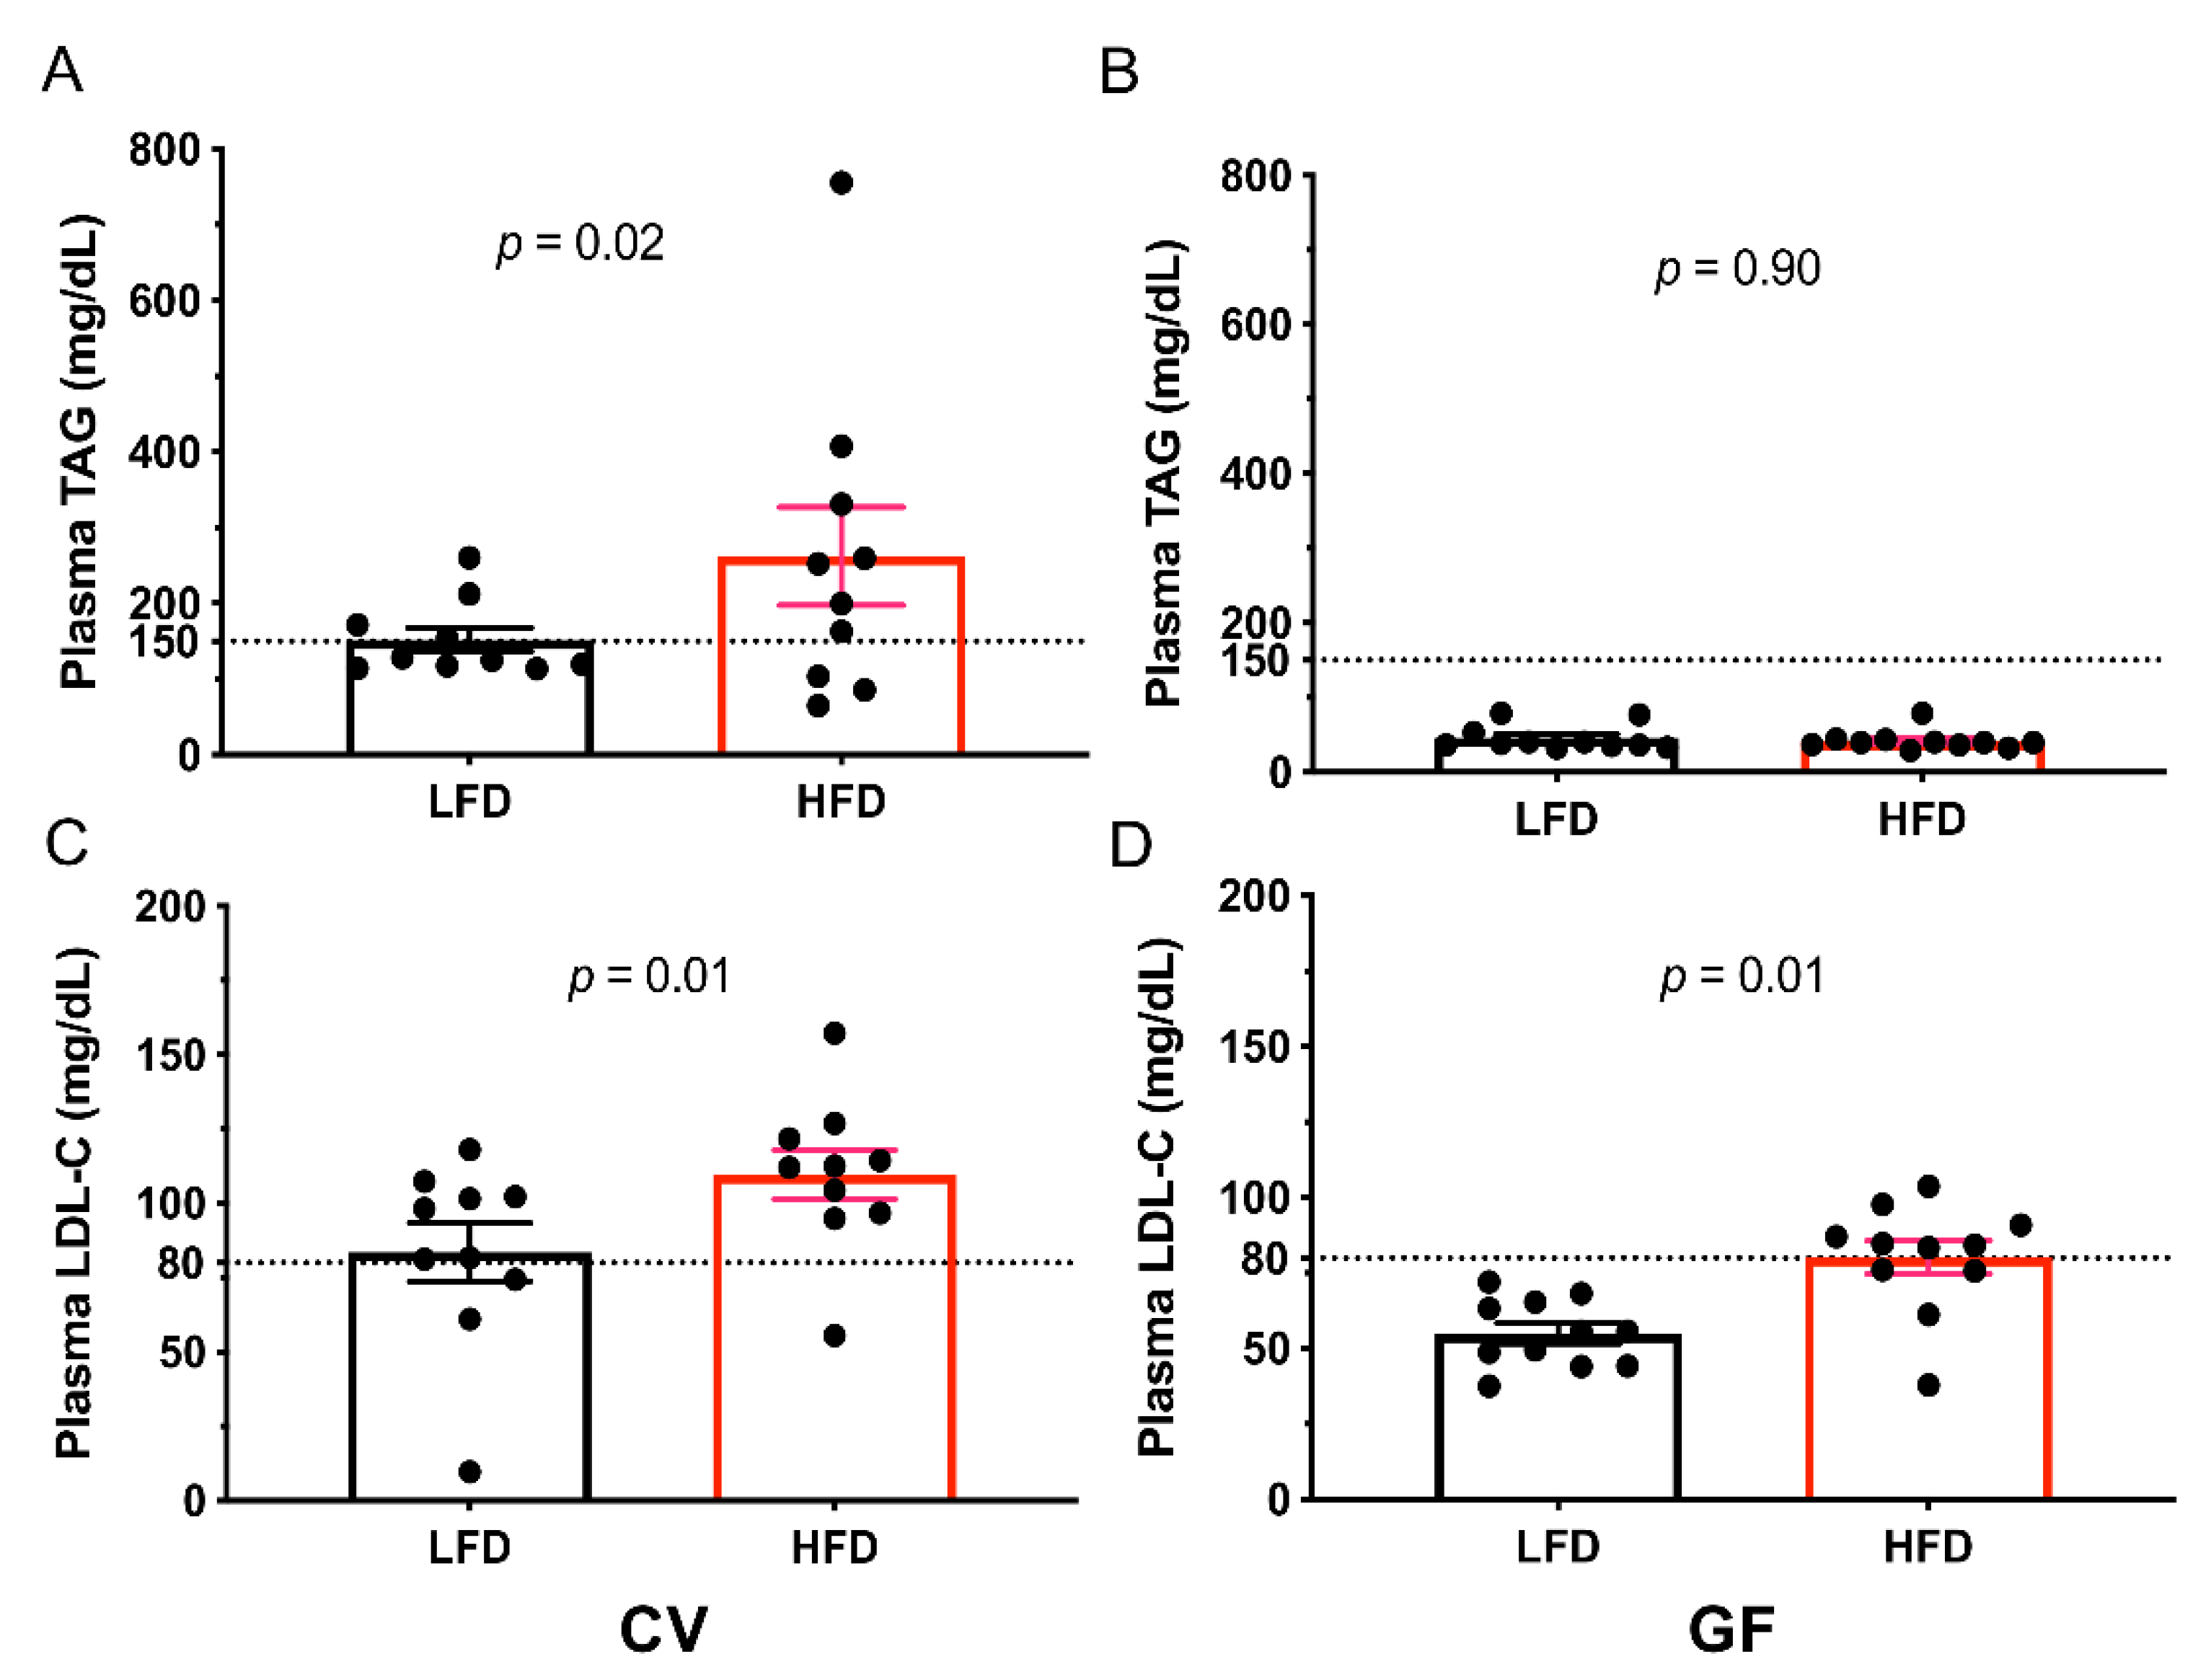
3.3. Conventional and Germ-Free Tac:SW Mice Develop Impaired Lipid Metabolism and Hepatic Lipid Accumulation on the High Fat Diet
4. Discussion
Author Contributions
Funding
Acknowledgments
Conflicts of Interest
Abbreviations
| AC | acylated |
| BW | body weight |
| CV | conventional |
| DAG | diacylglycerol |
| DWG | daily weight gain |
| FFA | free fatty acid |
| GF | germ-free |
| glycero PL | glycerophospholipids |
| GTT | glucose tolerance test |
| HDL-C | high density lipoprotein cholesterol |
| HFD | high-fat diet |
| IFM | inflammation |
| IMB | intestinal microbiota |
| LDL-C | low density lipoprotein cholesterol |
| LFD | low-fat diet |
| MetS | metabolic syndrome |
| PA | phosphatidic acid |
| PC | phosphatidylcholine |
| PE | phosphatidylethanolamine |
| PG | phosphatidylglycerol |
| PI | phosphatidylinositol |
| PS | phosphatidylserine |
| Tac:SW | Swiss Webster (Taconic) |
| TAG | triacylglycerol. |
Appendix A

| Conventional | Germ-Free | p-value | ||||||||
|---|---|---|---|---|---|---|---|---|---|---|
| Lipid Nr. | Lipid Group | Chain Length | Double Bond | Control | HFD | Control | HFD | IMB | Diet | IMB x Diet |
| 1 | Ceramide | 16 | 0 | 43 | 48 | 82 | 71 | <0.001 | 0.6 | 0.18 |
| 2 | Ceramide | 20 | 0 | 24 | 53 | 36 | 80 | <0.001 | <0.001 | 0.1 |
| 3 | Ceramide | 22 | 0 | 134 | 257 | 140 | 332 | 0.04 | <0.001 | 0.07 |
| 4 | Ceramide | 24 | 0 | 101 | 120 | 220 | 168 | <0.001 | 0.21 | 0.009 |
| 5 | Ceramide | 24 | 1 | 13 | 14 | 34 | 19 | <0.001 | 0.001 | 0.001 |
| 6 | SM | 16 | 0 | 142 | 186 | 256 | 246 | <0.001 | 0.17 | 0.03 |
| 7 | SM | 18 | 0 | 104 | 289 | 214 | 522 | <0.001 | <0.001 | 0.09 |
| 8 | SM | 28 | 0 | 268 | 775 | 272 | 603 | 0.11 | <0.001 | 0.1 |
| 9 | Cholesterol | . | . | 1995 | 1651 | 1533 | 1304 | 0.03 | 0.11 | 0.74 |
| 10 | FFA | 16 | 0 | 6 | 7 | 11 | 16 | 0.001 | 0.15 | 0.24 |
| 11 | FFA | 18 | 0 | 8 | 10 | 9 | 11 | 0.31 | 0.03 | 0.99 |
| 12 | FFA | 18 | 1 | 6 | 4 | 26 | 23 | <0.001 | 0.55 | 0.93 |
| 13 | FFA | 18 | 2 | 3 | 5 | 8 | 30 | 0.003 | 0.02 | 0.03 |
| 14 | FFA | 20 | 4 | 14 | 18 | 20 | 48 | 0.13 | 0.17 | 0.28 |
| 15 | FFA | 22 | 6 | 5 | 9 | 10 | 38 | 0.007 | 0.01 | 0.04 |
| 16 | MAG | 18 | 0 | 29 | 34 | 38 | 40 | <0.001 | 0.06 | 0.49 |
| 17 | MAG | 18 | 2 | 11 | 11 | 10 | 11 | 0.01 | 0.42 | 0.53 |
| 18 | DAG | 34 | 1 | 72 | 47 | 53 | 43 | 0.15 | 0.02 | 0.3 |
| 19 | DAG | 34 | 2 | 65 | 95 | 63 | 111 | 0.63 | 0.007 | 0.52 |
| 20 | DAG | 34 | 3 | 10 | 10 | 12 | 12 | 0.34 | 0.9 | 0.73 |
| 21 | DAG | 36 | 2 | 30 | 29 | 98 | 46 | 0.001 | 0.04 | 0.04 |
| 22 | DAG | 36 | 3 | 30 | 59 | 53 | 124 | 0.008 | 0.003 | 0.18 |
| 23 | DAG | 36 | 4 | 19 | 19 | 13 | 17 | 0.01 | 0.23 | 0.14 |
| 24 | DAG | 38 | 6 | 26 | 42 | 14 | 27 | 0.004 | 0.002 | 0.69 |
| 25 | DAG | 40 | 6 | 3 | 5 | 2 | 4 | 0.15 | <0.001 | 0.54 |
| 26 | DAG | 40 | 7 | 4 | 8 | 6 | 24 | 0.002 | <0.001 | 0.02 |
| 27 | TAG | 46 | 2 | 30 | 14 | 63 | 20 | 0.003 | <0.001 | 0.04 |
| 28 | TAG | 48 | 0 | 29 | 23 | 24 | 24 | 0.24 | 0.09 | 0.1 |
| 29 | TAG | 48 | 1 | 273 | 51 | 222 | 37 | 0.07 | <0.001 | 0.28 |
| 30 | TAG | 48 | 2 | 393 | 80 | 443 | 59 | 0.7 | <0.001 | 0.36 |
| 31 | TAG | 50 | 1 | 884 | 496 | 581 | 430 | 0.003 | <0.001 | 0.05 |
| 32 | TAG | 50 | 2 | 2161 | 716 | 1954 | 605 | 0.09 | <0.001 | 0.6 |
| 33 | TAG | 50 | 3 | 1307 | 589 | 1261 | 354 | 0.11 | <0.001 | 0.27 |
| 34 | TAG | 50 | 4 | 251 | 278 | 319 | 206 | 0.97 | 0.23 | 0.05 |
| 35 | TAG | 51 | 2 | 155 | 106 | 121 | 65 | <0.001 | <0.001 | 0.65 |
| 36 | TAG | 52 | 3 | 4599 | 5928 | 4072 | 5144 | 0.07 | 0.002 | 0.72 |
| 37 | TAG | 52 | 4 | 2149 | 4450 | 1662 | 4058 | 0.12 | <0.001 | 0.86 |
| 38 | TAG | 52 | 5 | 420 | 1215 | 419 | 964 | 0.12 | <0.001 | 0.12 |
| 39 | TAG | 52 | 6 | 51 | 201 | 91 | 184 | 0.64 | <0.001 | 0.24 |
| 40 | TAG | 54 | 2 | 600 | 537 | 380 | 329 | <0.001 | 0.17 | 0.88 |
| 41 | TAG | 54 | 3 | 1529 | 1677 | 2265 | 1322 | 0.19 | 0.008 | <0.001 |
| 42 | TAG | 54 | 4 | 1255 | 2259 | 1567 | 2044 | 0.75 | <0.001 | 0.09 |
| 43 | TAG | 54 | 5 | 765 | 2328 | 948 | 2433 | 0.32 | <0.001 | 0.79 |
| 44 | TAG | 54 | 6 | 252 | 1496 | 453 | 1814 | 0.007 | <0.001 | 0.53 |
| 45 | TAG | 56 | 2 | 88 | 41 | 20 | 26 | <0.001 | <0.001 | <0.001 |
| 46 | TAG | 56 | 3 | 229 | 211 | 233 | 128 | 0.12 | 0.02 | 0.09 |
| 47 | TAG | 56 | 4 | 154 | 305 | 213 | 251 | 0.9 | <0.001 | 0.006 |
| 48 | TAG | 56 | 5 | 129 | 529 | 374 | 580 | <0.001 | <0.001 | 0.002 |
| 49 | TAG | 56 | 6 | 123 | 812 | 514 | 1041 | <0.001 | <0.001 | 0.14 |
| 50 | TAG | 56 | 7 | 104 | 1038 | 539 | 1479 | <0.001 | <0.001 | 0.98 |
| 51 | TAG | 56 | 8 | 52 | 757 | 251 | 1234 | <0.001 | <0.001 | 0.06 |
| 52 | TAG | 56 | 9 | 8 | 123 | 43 | 182 | 0.003 | <0.001 | 0.42 |
| 53 | TAG | 58 | 2 | 9 | 4 | 2 | 2 | <0.001 | <0.001 | <0.001 |
| 54 | TAG | 58 | 3 | 31 | 13 | 9 | 8 | <0.001 | <0.001 | 0.004 |
| 55 | TAG | 58 | 4 | 21 | 31 | 20 | 20 | 0.11 | 0.2 | 0.19 |
| 56 | TAG | 58 | 5 | 15 | 39 | 39 | 36 | 0.04 | 0.04 | 0.01 |
| 57 | TAG | 58 | 6 | 22 | 84 | 78 | 110 | <0.001 | <0.001 | 0.11 |
| 58 | TAG | 58 | 7 | 27 | 162 | 129 | 254 | <0.001 | <0.001 | 0.77 |
| 59 | TAG | 58 | 8 | 26 | 226 | 167 | 369 | <0.001 | <0.001 | 0.98 |
| 60 | TAG | 58 | 9 | 18 | 235 | 99 | 455 | <0.001 | <0.001 | 0.01 |
| 61 | LPA | 18 | 0 | 4 | 6 | 7 | 10 | <0.001 | <0.001 | 0.13 |
| 62 | PA | 36 | 2 | 10 | 6 | 11 | 8 | 0.55 | 0.16 | 0.68 |
| 63 | PA | 36 | 3 | 20 | 22 | 23 | 27 | 0.12 | 0.25 | 0.52 |
| 64 | PA | 36 | 4 | 8 | 13 | 6 | 19 | 0.08 | <0.001 | 0.004 |
| 65 | PA | 38 | 4 | 89 | 111 | 142 | 236 | <0.001 | 0.001 | 0.04 |
| 66 | PA | 38 | 5 | 20 | 20 | 23 | 25 | 0.07 | 0.6 | 0.66 |
| 67 | PA | 38 | 6 | 8 | 9 | 12 | 16 | <0.001 | 0.07 | 0.3 |
| 68 | LPC | 16 | 0 | 1 | 2 | 2 | 2 | 0.68 | 0.09 | 0.4 |
| 69 | PC | 32 | 0 | 52 | 42 | 54 | 62 | 0.06 | 0.84 | 0.14 |
| 70 | PC | 34 | 1 | 574 | 315 | 990 | 435 | 0.003 | <0.001 | 0.08 |
| 71 | PC | 34 | 2 | 639 | 753 | 715 | 1018 | 0.08 | 0.03 | 0.33 |
| 72 | PC | 34 | 3 | 20 | 17 | 18 | 26 | 0.01 | 0.53 | 0.85 |
| 73 | PC | 36 | 2 | 433 | 586 | 382 | 519 | 0.32 | 0.02 | 0.89 |
| 74 | PC | 36 | 3 | 204 | 143 | 225 | 94 | 0.64 | 0.002 | 0.24 |
| 75 | PC | 36 | 4 | 548 | 561 | 645 | 713 | 0.09 | 0.58 | 0.71 |
| 76 | PC | 38 | 3 | 98 | 123 | 129 | 79 | 0.69 | 0.45 | 0.03 |
| 77 | PC | 38 | 4 | 368 | 534 | 325 | 657 | 0.55 | <0.001 | 0.22 |
| 78 | PC | 38 | 5 | 101 | 86 | 157 | 114 | 0.01 | 0.08 | 0.37 |
| 79 | PC | 38 | 6 | 236 | 338 | 279 | 496 | 0.05 | 0.003 | 0.26 |
| 80 | PC | 40 | 4 | 11 | 11 | 11 | 12 | 0.9 | 0.67 | 0.71 |
| 81 | PC | 40 | 6 | 86 | 144 | 87 | 200 | 0.19 | <0.001 | 0.21 |
| 82 | PC | 40 | 7 | 40 | 42 | 55 | 51 | 0.11 | 0.87 | 0.62 |
| 83 | PC | 40 | 8 | 11 | 12 | 17 | 13 | 0.12 | 0.58 | 0.37 |
| 84 | PC | 42 | 6 | 1 | 2 | 0 | 2 | 0.02 | <0.001 | 0.75 |
| 85 | LPE | 16 | 0 | 27 | 18 | 43 | 39 | 0.01 | 0.35 | 0.67 |
| 86 | LPE | 18 | 0 | 42 | 50 | 51 | 78 | 0.16 | 0.18 | 0.44 |
| 87 | LPE | 18 | 1 | 17 | 14 | 32 | 21 | 0.04 | 0.2 | 0.43 |
| 88 | LPE | 20 | 0 | 60 | 75 | 55 | 84 | 0.87 | 0.01 | 0.41 |
| 89 | LPE | 20 | 1 | 13 | 7 | 23 | 9 | 0.004 | <0.001 | 0.03 |
| 90 | LPE | 20 | 2 | 5 | 5 | 5 | 8 | 0.4 | 0.38 | 0.4 |
| 91 | PE | 34 | 1 | 133 | 63 | 283 | 102 | <0.001 | <0.001 | 0.04 |
| 92 | PE | 34 | 2 | 259 | 300 | 377 | 598 | 0.001 | 0.03 | 0.13 |
| 93 | PE | 36 | 1 | 389 | 210 | 664 | 289 | 0.005 | <0.001 | 0.1 |
| 94 | PE | 36 | 2 | 336 | 679 | 425 | 714 | 0.38 | <0.001 | 0.7 |
| 95 | PE | 36 | 3 | 313 | 439 | 510 | 492 | 0.05 | 0.39 | 0.25 |
| 96 | PE | 36 | 4 | 908 | 623 | 1563 | 1004 | 0.002 | 0.007 | 0.37 |
| 97 | PE | 38 | 1 | 88 | 74 | 129 | 74 | 0.1 | 0.008 | 0.1 |
| 98 | PE | 38 | 2 | 400 | 544 | 356 | 465 | 0.25 | 0.02 | 0.75 |
| 99 | PE | 38 | 3 | 295 | 281 | 379 | 288 | 0.32 | 0.26 | 0.41 |
| 100 | PE | 38 | 4 | 1737 | 2209 | 2108 | 2772 | 0.09 | 0.04 | 0.73 |
| 101 | PE | 38 | 5 | 687 | 771 | 1198 | 1046 | 0.003 | 0.79 | 0.36 |
| 102 | PE | 38 | 6 | 1068 | 1396 | 1693 | 2497 | 0.002 | 0.03 | 0.35 |
| 103 | PE | 40 | 4 | 352 | 478 | 284 | 538 | 0.94 | 0.003 | 0.29 |
| 104 | PE | 40 | 6 | 632 | 1059 | 799 | 1625 | 0.02 | <0.001 | 0.19 |
| 105 | PE | 40 | 7 | 291 | 346 | 548 | 657 | <0.001 | 0.25 | 0.7 |
| 106 | LPI | 18 | 0 | 26 | 31 | 52 | 78 | 0.001 | 0.15 | 0.32 |
| 107 | PI | 34 | 1 | 98 | 15406 | 136 | 220 | 0.06 | 0.01 | 0.59 |
| 108 | PI | 34 | 2 | 62 | 78 | 74 | 131 | 0.04 | 0.03 | 0.2 |
| 109 | PI | 36 | 2 | 102 | 120 | 64 | 152 | 0.84 | 0.003 | 0.04 |
| 110 | PI | 36 | 4 | 331 | 249 | 614 | 335 | 0.001 | 0.002 | 0.07 |
| 111 | PI | 38 | 3 | 529 | 810 | 718 | 511 | 0.53 | 0.68 | 0.008 |
| 112 | PI | 38 | 5 | 154 | 108 | 480 | 141 | <0.001 | <0.001 | <0.001 |
| 113 | PI | 38 | 6 | 19 | 16 | 21 | 22 | 0.24 | 0.77 | 0.55 |
| 114 | PI | 40 | 4 | 57 | 34 | 75 | 36 | 0.16 | <0.001 | 0.27 |
| 115 | PI | 40 | 5 | 94 | 29 | 122 | 39 | 0.12 | <0.001 | 0.48 |
| 116 | PI | 40 | 6 | 38 | 37 | 56 | 48 | 0.22 | 0.7 | 0.74 |
| 117 | LPS | 18 | 0 | 4 | 4 | 6 | 8 | 0.002 | 0.31 | 0.16 |
| 118 | PS | 36 | 4 | 70 | 43 | 103 | 59 | 0.006 | <0.001 | 0.35 |
| 119 | PS | 38 | 4 | 488 | 632 | 792 | 1299 | <0.001 | 0.001 | 0.06 |
| 120 | PS | 38 | 5 | 16 | 7 | 42 | 10 | <0.001 | <0.001 | <0.001 |
| 121 | PS | 38 | 6 | 48 | 57 | 71 | 78 | 0.02 | 0.39 | 0.94 |
| 122 | PS | 40 | 4 | 20 | 22 | 25 | 39 | 0.001 | 0.02 | 0.08 |
| 123 | PS | 40 | 6 | 196 | 326 | 277 | 442 | 0.05 | 0.005 | 0.72 |
| 124 | PG | 34 | 1 | 203 | 129 | 255 | 170 | 0.04 | <0.001 | 0.79 |
| 125 | PG | 34 | 2 | 79 | 35 | 20 | 30 | <0.001 | 0.001 | <0.001 |
| 126 | PG | 38 | 4 | 18 | 13 | 8 | 16 | 0.09 | 0.36 | 0.002 |
| 127 | PG | 38 | 6 | 5 | 9 | 4 | 12 | 0.61 | <0.001 | 0.04 |
| 128 | PG | 42 | 10 | 5 | 8 | 3 | 15 | 0.02 | <0.001 | <0.001 |
References
- Emerging Risk Factors, C.; Danesh, J.; Erqou, S.; Walker, M.; Thompson, S.G.; Tipping, R.; Ford, C.; Pressel, S.; Walldius, G.; Jungner, I.; et al. The Emerging Risk Factors Collaboration: Analysis of individual data on lipid, inflammatory and other markers in over 1.1 million participants in 104 prospective studies of cardiovascular diseases. Eur. J. Epidemiol. 2007, 22, 839–869. [Google Scholar] [CrossRef] [PubMed]
- Berrington de Gonzalez, A.; Hartge, P.; Cerhan, J.R.; Flint, A.J.; Hannan, L.; MacInnis, R.J.; Moore, S.C.; Tobias, G.S.; Anton-Culver, H.; Freeman, L.B.; et al. Body-mass index and mortality among 1.46 million white adults. N. Engl. J. Med. 2010, 363, 2211–2219. [Google Scholar] [CrossRef] [PubMed] [Green Version]
- Wens, I.; Dalgas, U.; Stenager, E.; Eijnde, B.O. Risk factors related to cardiovascular diseases and the metabolic syndrome in multiple sclerosis—A systematic review. Mult. Scler. 2013, 19, 1556–1564. [Google Scholar] [CrossRef] [Green Version]
- Collaboration, N.C.D.R.F. Trends in adult body-mass index in 200 countries from 1975 to 2014: A pooled analysis of 1698 population-based measurement studies with 19.2 million participants. Lancet 2016, 387, 1377–1396. [Google Scholar] [CrossRef] [Green Version]
- Yakoob, M.Y.; Micha, R.; Khatibzadeh, S.; Singh, G.M.; Shi, P.; Ahsan, H.; Balakrishna, N.; Brahmam, G.N.; Chen, Y.; Afshin, A.; et al. Impact of Dietary and Metabolic Risk Factors on Cardiovascular and Diabetes Mortality in South Asia: Analysis From the 2010 Global Burden of Disease Study. Am. J. Public Health 2016, 106, 2113–2125. [Google Scholar] [CrossRef] [PubMed]
- Grundy, S.M.; Cleeman, J.I.; Daniels, S.R.; Donato, K.A.; Eckel, R.H.; Franklin, B.A.; Gordon, D.J.; Krauss, R.M.; Savage, P.J.; Smith, S.C., Jr.; et al. Diagnosis and management of the metabolic syndrome: An American Heart Association/National Heart, Lung, and Blood Institute Scientific Statement. Circulation 2005, 112, 2735–2752. [Google Scholar] [CrossRef] [PubMed] [Green Version]
- Vanita, P.; Jhansi, K. Metabolic syndrome in endocrine system. J. Diabetes Metab. 2011, 2, 2. [Google Scholar]
- Huang, P.L. A comprehensive definition for metabolic syndrome. Dis. Model. Mech. 2009, 2, 231–237. [Google Scholar] [CrossRef] [Green Version]
- Poutahidis, T.; Kleinewietfeld, M.; Smillie, C.; Levkovich, T.; Perrotta, A.; Bhela, S.; Varian, B.J.; Ibrahim, Y.M.; Lakritz, J.R.; Kearney, S.M.; et al. Microbial reprogramming inhibits Western diet-associated obesity. PLoS ONE 2013, 8, e68596. [Google Scholar] [CrossRef] [Green Version]
- Backhed, F.; Manchester, J.K.; Semenkovich, C.F.; Gordon, J.I. Mechanisms underlying the resistance to diet-induced obesity in germ-free mice. Proc. Natl. Acad. Sci. USA 2007, 104, 979–984. [Google Scholar] [CrossRef] [Green Version]
- Backhed, F.; Ding, H.; Wang, T.; Hooper, L.V.; Koh, G.Y.; Nagy, A.; Semenkovich, C.F.; Gordon, J.I. The gut microbiota as an environmental factor that regulates fat storage. Proc. Natl. Acad. Sci. USA 2004, 101, 15718–15723. [Google Scholar] [CrossRef] [PubMed] [Green Version]
- Mozaffarian, D.; Hao, T.; Rimm, E.B.; Willett, W.C.; Hu, F.B. Changes in diet and lifestyle and long-term weight gain in women and men. N. Engl. J. Med. 2011, 364, 2392–2404. [Google Scholar] [CrossRef] [PubMed] [Green Version]
- Licholai, J.A.; Nguyen, K.P.; Fobbs, W.C.; Schuster, C.J.; Ali, M.A.; Kravitz, A.V. Why Do Mice Overeat High-Fat Diets? How High-Fat Diet Alters the Regulation of Daily Caloric Intake in Mice. Obesity 2018, 26, 1026–1033. [Google Scholar] [CrossRef] [PubMed] [Green Version]
- Van Heek, M.; Compton, D.S.; France, C.F.; Tedesco, R.P.; Fawzi, A.B.; Graziano, M.P.; Sybertz, E.J.; Strader, C.D.; Davis, H.R., Jr. Diet-induced obese mice develop peripheral, but not central, resistance to leptin. J. Clin. Investig. 1997, 99, 385–390. [Google Scholar] [CrossRef]
- Collins, S.; Martin, T.L.; Surwit, R.S.; Robidoux, J. Genetic vulnerability to diet-induced obesity in the C57BL/6J mouse: Physiological and molecular characteristics. Physiol. Behav. 2004, 81, 243–248. [Google Scholar] [CrossRef]
- Fraulob, J.C.; Ogg-Diamantino, R.; Fernandes-Santos, C.; Aguila, M.B.; Mandarim-de-Lacerda, C.A. A Mouse Model of Metabolic Syndrome: Insulin Resistance, Fatty Liver and Non-Alcoholic Fatty Pancreas Disease (NAFPD) in C57BL/6 Mice Fed a High Fat Diet. J. Clin. Biochem. Nutr. 2010, 46, 212–223. [Google Scholar] [CrossRef] [Green Version]
- Enck, P.; Mazurak, N. Dysbiosis in Functional Bowel Disorders. Ann. Nutr. Metab. 2018, 72, 296–306. [Google Scholar] [CrossRef]
- Turnbaugh, P.J.; Ley, R.E.; Mahowald, M.A.; Magrini, V.; Mardis, E.R.; Gordon, J.I. An obesity-associated gut microbiome with increased capacity for energy harvest. Nature 2006, 444, 1027–1031. [Google Scholar] [CrossRef]
- Ley, R.E.; Turnbaugh, P.J.; Klein, S.; Gordon, J.I. Microbial ecology: Human gut microbes associated with obesity. Nature 2006, 444, 1022–1023. [Google Scholar] [CrossRef]
- Ley, R.E.; Backhed, F.; Turnbaugh, P.; Lozupone, C.A.; Knight, R.D.; Gordon, J.I. Obesity alters gut microbial ecology. Proc. Natl. Acad. Sci. USA 2005, 102, 11070–11075. [Google Scholar] [CrossRef] [Green Version]
- Sanz, Y.; Moya-Perez, A. Microbiota, inflammation and obesity. Adv. Exp. Med. Biol. 2014, 817, 291–317. [Google Scholar] [CrossRef]
- Martinez, K.B.; Leone, V.; Chang, E.B. Western diets, gut dysbiosis, and metabolic diseases: Are they linked? Gut Microbes 2017, 8, 130–142. [Google Scholar] [CrossRef] [PubMed] [Green Version]
- Zinocker, M.K.; Lindseth, I.A. The Western Diet-Microbiome-Host Interaction and Its Role in Metabolic Disease. Nutrients 2018, 10, 365. [Google Scholar] [CrossRef] [PubMed] [Green Version]
- Diaz Heijtz, R.; Wang, S.; Anuar, F.; Qian, Y.; Bjorkholm, B.; Samuelsson, A.; Hibberd, M.L.; Forssberg, H.; Pettersson, S. Normal gut microbiota modulates brain development and behavior. Proc. Natl. Acad. Sci. USA 2011, 108, 3047–3052. [Google Scholar] [CrossRef] [PubMed] [Green Version]
- Lazar, V.; Ditu, L.M.; Pircalabioru, G.G.; Gheorghe, I.; Curutiu, C.; Holban, A.M.; Picu, A.; Petcu, L.; Chifiriuc, M.C. Aspects of Gut Microbiota and Immune System Interactions in Infectious Diseases, Immunopathology, and Cancer. Front. Immunol. 2018, 9, 1830. [Google Scholar] [CrossRef] [Green Version]
- Williams, S.C. Gnotobiotics. Proc. Natl. Acad. Sci. USA 2014, 111, 1661. [Google Scholar] [CrossRef] [Green Version]
- West, D.B.; Boozer, C.N.; Moody, D.L.; Atkinson, R.L. Dietary obesity in nine inbred mouse strains. Am. J. Physiol. 1992, 262, R1025–R1032. [Google Scholar] [CrossRef]
- Lin, S.; Thomas, T.C.; Storlien, L.H.; Huang, X.F. Development of high fat diet-induced obesity and leptin resistance in C57Bl/6J mice. Int. J. Obes. Relat. Metab. Disord. 2000, 24, 639–646. [Google Scholar] [CrossRef] [Green Version]
- Ding, S.; Chi, M.M.; Scull, B.P.; Rigby, R.; Schwerbrock, N.M.; Magness, S.; Jobin, C.; Lund, P.K. High-fat diet: Bacteria interactions promote intestinal inflammation which precedes and correlates with obesity and insulin resistance in mouse. PLoS ONE 2010, 5, e12191. [Google Scholar] [CrossRef] [Green Version]
- Caesar, R.; Reigstad, C.S.; Backhed, H.K.; Reinhardt, C.; Ketonen, M.; Lunden, G.O.; Cani, P.D.; Backhed, F. Gut-derived lipopolysaccharide augments adipose macrophage accumulation but is not essential for impaired glucose or insulin tolerance in mice. Gut 2012, 61, 1701–1707. [Google Scholar] [CrossRef] [Green Version]
- Rabot, S.; Membrez, M.; Bruneau, A.; Gerard, P.; Harach, T.; Moser, M.; Raymond, F.; Mansourian, R.; Chou, C.J. Germ-free C57BL/6J mice are resistant to high-fat-diet-induced insulin resistance and have altered cholesterol metabolism. FASEB J. 2010, 24, 4948–4959. [Google Scholar] [CrossRef] [PubMed] [Green Version]
- Fleissner, C.K.; Huebel, N.; Abd El-Bary, M.M.; Loh, G.; Klaus, S.; Blaut, M. Absence of intestinal microbiota does not protect mice from diet-induced obesity. Br. J. Nutr. 2010, 104, 919–929. [Google Scholar] [CrossRef] [PubMed] [Green Version]
- Caesar, R.; Tremaroli, V.; Kovatcheva-Datchary, P.; Cani, P.D.; Backhed, F. Crosstalk between Gut Microbiota and Dietary Lipids Aggravates WAT Inflammation through TLR Signaling. Cell Metab. 2015, 22, 658–668. [Google Scholar] [CrossRef] [PubMed] [Green Version]
- Kubeck, R.; Bonet-Ripoll, C.; Hoffmann, C.; Walker, A.; Muller, V.M.; Schuppel, V.L.; Lagkouvardos, I.; Scholz, B.; Engel, K.H.; Daniel, H.; et al. Dietary fat and gut microbiota interactions determine diet-induced obesity in mice. Mol. Metab. 2016, 5, 1162–1174. [Google Scholar] [CrossRef]
- Lynch, C.J. The so-called Swiss mouse. Lab. Anim. Care 1969, 19, 214–220. [Google Scholar]
- Chia, R.; Achilli, F.; Festing, M.F.; Fisher, E.M. The origins and uses of mouse outbred stocks. Nat. Genet. 2005, 37, 1181–1186. [Google Scholar] [CrossRef]
- Blake, J.A.; Richardson, J.E.; Davisson, M.T.; Eppig, J.T. The Mouse Genome Database (MGD). A comprehensive public resource of genetic, phenotypic and genomic data. The Mouse Genome Informatics Group. Nucleic Acids Res. 1997, 25, 85–91. [Google Scholar] [CrossRef] [Green Version]
- Nicholson, A.; Reifsnyder, P.C.; Malcolm, R.D.; Lucas, C.A.; MacGregor, G.R.; Zhang, W.; Leiter, E.H. Diet-induced obesity in two C57BL/6 substrains with intact or mutant nicotinamide nucleotide transhydrogenase (Nnt) gene. Obesity 2010, 18, 1902–1905. [Google Scholar] [CrossRef] [Green Version]
- Lemke, L.B.; Rogers, A.B.; Nambiar, P.R.; Fox, J.G. Obesity and non-insulin-dependent diabetes mellitus in Swiss-Webster mice associated with late-onset hepatocellular carcinoma. J. Endocrinol. 2008, 199, 21–32. [Google Scholar] [CrossRef]
- Kovatcheva-Datchary, P.; Shoaie, S.; Lee, S.; Wahlstrom, A.; Nookaew, I.; Hallen, A.; Perkins, R.; Nielsen, J.; Backhed, F. Simplified Intestinal Microbiota to Study Microbe-Diet-Host Interactions in a Mouse Model. Cell Rep. 2019, 26, 3772–3783 e3776. [Google Scholar] [CrossRef] [Green Version]
- Hryckowian, A.J.; Van Treuren, W.; Smits, S.A.; Davis, N.M.; Gardner, J.O.; Bouley, D.M.; Sonnenburg, J.L. Microbiota-accessible carbohydrates suppress Clostridium difficile infection in a murine model. Nat. Microbiol. 2018, 3, 662–669. [Google Scholar] [CrossRef]
- Morffy Smith, C.D.; Gong, M.; Andrew, A.K.; Russ, B.N.; Ge, Y.; Zadeh, M.; Cooper, C.A.; Mohamadzadeh, M.; Moore, J.M. Composition of the gut microbiota transcends genetic determinants of malaria infection severity and influences pregnancy outcome. EBioMedicine 2019, 44, 639–655. [Google Scholar] [CrossRef] [PubMed] [Green Version]
- Quach, D.; Collins, F.; Parameswaran, N.; McCabe, L.; Britton, R.A. Microbiota Reconstitution Does Not Cause Bone Loss in Germ-Free Mice. mSphere 2018, 3, e00545-17. [Google Scholar] [CrossRef] [PubMed] [Green Version]
- Glavas, M.M.; Hui, Q.; Tudurí, E.; Erener, S.; Kasteel, N.L.; Johnson, J.D.; Kieffer, T.J. Early overnutrition reduces Pdx1 expression and induces β cell failure in Swiss Webster mice. Sci. Rep. 2019, 9, 3619. [Google Scholar] [CrossRef] [PubMed] [Green Version]
- Neves, R.H.; Miranda de Barros Alencar, A.C.; Costa-Silva, M.; Aguila, M.B.; Mandarim-de-Lacerda, C.A.; Machado-Silva, J.R.; Gomes, D.C. Long-term feeding a high-fat diet causes histological and parasitological effects on murine schistosomiasis mansoni outcome. Exp. Parasitol. 2007, 115, 324–332. [Google Scholar] [CrossRef] [PubMed]
- De Oliveira, E.M.; Ascar, T.P.; Silva, J.C.; Sandri, S.; Migliorini, S.; Fock, R.A.; Campa, A. Serum amyloid A links endotoxaemia to weight gain and insulin resistance in mice. Diabetologia 2016, 59, 1760–1768. [Google Scholar] [CrossRef] [PubMed] [Green Version]
- Miller, A.W.; Orr, T.; Dearing, D.; Monga, M. Loss of function dysbiosis associated with antibiotics and high fat, high sugar diet. ISME J. 2019, 13, 1379–1390. [Google Scholar] [CrossRef]
- Pettersson, U.S.; Walden, T.B.; Carlsson, P.O.; Jansson, L.; Phillipson, M. Female mice are protected against high-fat diet induced metabolic syndrome and increase the regulatory T cell population in adipose tissue. PLoS ONE 2012, 7, e46057. [Google Scholar] [CrossRef]
- Hong, J.; Stubbins, R.E.; Smith, R.R.; Harvey, A.E.; Nunez, N.P. Differential susceptibility to obesity between male, female and ovariectomized female mice. Nutr. J. 2009, 8, 11. [Google Scholar] [CrossRef] [Green Version]
- Hwang, L.L.; Wang, C.H.; Li, T.L.; Chang, S.D.; Lin, L.C.; Chen, C.P.; Chen, C.T.; Liang, K.C.; Ho, I.K.; Yang, W.S.; et al. Sex differences in high-fat diet-induced obesity, metabolic alterations and learning, and synaptic plasticity deficits in mice. Obesity 2010, 18, 463–469. [Google Scholar] [CrossRef]
- Packey, C.D.; Shanahan, M.T.; Manick, S.; Bower, M.A.; Ellermann, M.; Tonkonogy, S.L.; Carroll, I.M.; Sartor, R.B. Molecular detection of bacterial contamination in gnotobiotic rodent units. Gut Microbes 2013, 4, 361–370. [Google Scholar] [CrossRef] [PubMed] [Green Version]
- Miranda, C.L.; Johnson, L.A.; de Montgolfier, O.; Elias, V.D.; Ullrich, L.S.; Hay, J.J.; Paraiso, I.L.; Choi, J.; Reed, R.L.; Revel, J.S.; et al. Non-estrogenic Xanthohumol Derivatives Mitigate Insulin Resistance and Cognitive Impairment in High-Fat Diet-induced Obese Mice. Sci. Rep. 2018, 8, 613. [Google Scholar] [CrossRef] [PubMed] [Green Version]
- Choi, J.; Leonard, S.W.; Kasper, K.; McDougall, M.; Stevens, J.F.; Tanguay, R.L.; Traber, M.G. Novel function of vitamin E in regulation of zebrafish (Danio rerio) brain lysophospholipids discovered using lipidomics. J. Lipid Res. 2015, 56, 1182–1190. [Google Scholar] [CrossRef] [PubMed] [Green Version]
- Chong, J.; Soufan, O.; Li, C.; Caraus, I.; Li, S.; Bourque, G.; Wishart, D.S.; Xia, J. MetaboAnalyst 4.0: Towards more transparent and integrative metabolomics analysis. Nucleic Acids Res. 2018, 46, W486–W494. [Google Scholar] [CrossRef] [Green Version]
- Mantzoros, C.S. The role of leptin in human obesity and disease: A review of current evidence. Ann. Intern. Med. 1999, 130, 671–680. [Google Scholar] [CrossRef]
- Sun, C.; Li, X.; Liu, L.; Conet, M.; Guan, Y.; Fan, Y.; Zhou, Y. Effect of fasting time on measuring mouse blood glucose level. Int. J. Clin. Exp. Med. 2016, 9, 4186–4189. [Google Scholar]
- Leiter, E.H. Selecting the “right” mouse model for metabolic syndrome and type 2 diabetes research. Methods Mol. Biol. 2009, 560, 1–17. [Google Scholar] [CrossRef]
- King, A.J. The use of animal models in diabetes research. Br. J. Pharmacol. 2012, 166, 877–894. [Google Scholar] [CrossRef] [Green Version]
- Berglund, L.; Brunzell, J.D.; Goldberg, A.C.; Goldberg, I.J.; Sacks, F.; Murad, M.H.; Stalenhoef, A.F.; Endocrine, society. Evaluation and treatment of hypertriglyceridemia: An Endocrine Society clinical practice guideline. J. Clin. Endocrinol. Metab. 2012, 97, 2969–2989. [Google Scholar] [CrossRef] [Green Version]
- Campos, H.; Blijlevens, E.; McNamara, J.R.; Ordovas, J.M.; Posner, B.M.; Wilson, P.W.; Castelli, W.P.; Schaefer, E.J. LDL particle size distribution. Results from the Framingham Offspring Study. Arterioscler. Thromb. 1992, 12, 1410–1419. [Google Scholar] [CrossRef] [Green Version]
- Bergman, E.N. Energy contributions of volatile fatty acids from the gastrointestinal tract in various species. Physiol. Rev. 1990, 70, 567–590. [Google Scholar] [CrossRef] [PubMed] [Green Version]
- Surwit, R.S.; Kuhn, C.M.; Cochrane, C.; McCubbin, J.A.; Feinglos, M.N. Diet-induced type II diabetes in C57BL/6J mice. Diabetes 1988, 37, 1163–1167. [Google Scholar] [CrossRef] [PubMed]
- Gallou-Kabani, C.; Vige, A.; Gross, M.S.; Rabes, J.P.; Boileau, C.; Larue-Achagiotis, C.; Tome, D.; Jais, J.P.; Junien, C. C57BL/6J and A/J mice fed a high-fat diet delineate components of metabolic syndrome. Obesity 2007, 15, 1996–2005. [Google Scholar] [CrossRef] [PubMed]
- Montgomery, M.K.; Hallahan, N.L.; Brown, S.H.; Liu, M.; Mitchell, T.W.; Cooney, G.J.; Turner, N. Mouse strain-dependent variation in obesity and glucose homeostasis in response to high-fat feeding. Diabetologia 2013, 56, 1129–1139. [Google Scholar] [CrossRef]
- Anderson, N.J.; King, M.R.; Delbruck, L.; Jolivalt, C.G. Role of insulin signaling impairment, adiponectin and dyslipidemia in peripheral and central neuropathy in mice. Dis. Model. Mech. 2014, 7, 625–633. [Google Scholar] [CrossRef] [Green Version]
- Jervis, H.R.; Biggers, D.C. Mucosal Enzymes in the Cecum of Conventional and Germfree Mice. Anat. Rec. 1964, 148, 591–597. [Google Scholar] [CrossRef]
- Grover, M.; Kashyap, P.C. Germ-free mice as a model to study effect of gut microbiota on host physiology. Neurogastroenterol. Motil. 2014, 26, 745–748. [Google Scholar] [CrossRef] [Green Version]
- Mickelsen, O.; Takahashi, S.; Craig, C. Experimental obesity. I. Production of obesity in rats by feeding high-fat diets. J. Nutr. 1955, 57, 541–554. [Google Scholar] [CrossRef]
- Thomson, A.B.; Keelan, M.; Garg, M.L.; Clandinin, M.T. Intestinal aspects of lipid absorption: In review. Can. J. Physiol. Pharmacol. 1989, 67, 179–191. [Google Scholar] [CrossRef]
- Gallagher, N.D.; Playoust, M.R. Absorption of saturated and unsaturated fatty acids by rat jejunum and ileum. Gastroenterology 1969, 57, 9–18. [Google Scholar] [CrossRef]
- El Kaoutari, A.; Armougom, F.; Gordon, J.I.; Raoult, D.; Henrissat, B. The abundance and variety of carbohydrate-active enzymes in the human gut microbiota. Nat. Rev. Microbiol. 2013, 11, 497–504. [Google Scholar] [CrossRef] [PubMed]
- Schwarzer, M.; Makki, K.; Storelli, G.; Machuca-Gayet, I.; Srutkova, D.; Hermanova, P.; Martino, M.E.; Balmand, S.; Hudcovic, T.; Heddi, A.; et al. Lactobacillus plantarum strain maintains growth of infant mice during chronic undernutrition. Science 2016, 351, 854–857. [Google Scholar] [CrossRef] [PubMed]
- Brennan, A.M.; Mantzoros, C.S. Drug Insight: The role of leptin in human physiology and pathophysiology--emerging clinical applications. Nat. Clin. Pract. Endocrinol. Metab. 2006, 2, 318–327. [Google Scholar] [CrossRef] [PubMed]
- Wang, Z.W.; Zhou, Y.T.; Kakuma, T.; Lee, Y.; Higa, M.; Kalra, S.P.; Dube, M.G.; Kalra, P.S.; Unger, R.H. Comparing the hypothalamic and extrahypothalamic actions of endogenous hyperleptinemia. Proc. Natl. Acad. Sci. USA 1999, 96, 10373–10378. [Google Scholar] [CrossRef] [Green Version]
- Hu, S.; Wang, L.; Yang, D.; Li, L.; Togo, J.; Wu, Y.; Liu, Q.; Li, B.; Li, M.; Wang, G.; et al. Dietary Fat, but Not Protein or Carbohydrate, Regulates Energy Intake and Causes Adiposity in Mice. Cell Metab. 2018, 28, 415–431 e414. [Google Scholar] [CrossRef] [Green Version]
- Barnes, A.S. The epidemic of obesity and diabetes: Trends and treatments. Tex. Heart Inst. J. 2011, 38, 142–144. [Google Scholar]
- Jauch-Chara, K.; Schmoller, A.; Oltmanns, K.M. Impaired glucose tolerance in healthy men with low body weight. Nutr. J. 2011, 10, 16. [Google Scholar] [CrossRef] [Green Version]
- Bortz, W.M.; Paul, P.; Haff, A.C.; Holmes, W.L. Glycerol turnover and oxidation in man. J. Clin. Investig. 1972, 51, 1537–1546. [Google Scholar] [CrossRef]
- Jitrapakdee, S.; Vidal-Puig, A.; Wallace, J.C. Anaplerotic roles of pyruvate carboxylase in mammalian tissues. Cell Mol. Life Sci. 2006, 63, 843–854. [Google Scholar] [CrossRef]
- Manninen, V.; Tenkanen, L.; Koskinen, P.; Huttunen, J.K.; Manttari, M.; Heinonen, O.P.; Frick, M.H. Joint effects of serum triglyceride and LDL cholesterol and HDL cholesterol concentrations on coronary heart disease risk in the Helsinki Heart Study. Implications for treatment. Circulation 1992, 85, 37–45. [Google Scholar] [CrossRef] [Green Version]
- Goldstein, J.L.; Brown, M.S. A century of cholesterol and coronaries: From plaques to genes to statins. Cell 2015, 161, 161–172. [Google Scholar] [CrossRef] [PubMed] [Green Version]
- Woting, A.; Blaut, M. The Intestinal Microbiota in Metabolic Disease. Nutrients 2016, 8, 202. [Google Scholar] [CrossRef] [PubMed]
- Kusminski, C.M.; Shetty, S.; Orci, L.; Unger, R.H.; Scherer, P.E. Diabetes and apoptosis: Lipotoxicity. Apoptosis 2009, 14, 1484–1495. [Google Scholar] [CrossRef] [PubMed]
- Bieber, L.L. Carnitine. Annu. Rev. Biochem. 1988, 57, 261–283. [Google Scholar] [CrossRef]
- Muoio, D.M.; Neufer, P.D. Lipid-induced mitochondrial stress and insulin action in muscle. Cell Metab. 2012, 15, 595–605. [Google Scholar] [CrossRef] [Green Version]
- Muoio, D.M.; Noland, R.C.; Kovalik, J.P.; Seiler, S.E.; Davies, M.N.; DeBalsi, K.L.; Ilkayeva, O.R.; Stevens, R.D.; Kheterpal, I.; Zhang, J.; et al. Muscle-specific deletion of carnitine acetyltransferase compromises glucose tolerance and metabolic flexibility. Cell Metab. 2012, 15, 764–777. [Google Scholar] [CrossRef] [Green Version]
- Reichard, G.A., Jr.; Owen, O.E.; Haff, A.C.; Paul, P.; Bortz, W.M. Ketone-body production and oxidation in fasting obese humans. J. Clin. Investig. 1974, 53, 508–515. [Google Scholar] [CrossRef]
- Velagapudi, V.R.; Hezaveh, R.; Reigstad, C.S.; Gopalacharyulu, P.; Yetukuri, L.; Islam, S.; Felin, J.; Perkins, R.; Boren, J.; Oresic, M.; et al. The gut microbiota modulates host energy and lipid metabolism in mice. J. Lipid Res. 2010, 51, 1101–1112. [Google Scholar] [CrossRef] [Green Version]
- Chambers, E.S.; Preston, T.; Frost, G.; Morrison, D.J. Role of Gut Microbiota-Generated Short-Chain Fatty Acids in Metabolic and Cardiovascular Health. Curr. Nutr. Rep. 2018, 7, 198–206. [Google Scholar] [CrossRef] [Green Version]
- Monteiro, R.; Azevedo, I. Chronic inflammation in obesity and the metabolic syndrome. Mediat. Inflamm. 2010, 2010, 289645. [Google Scholar] [CrossRef]
- Futerman, A.H.; Hannun, Y.A. The complex life of simple sphingolipids. EMBO Rep. 2004, 5, 777–782. [Google Scholar] [CrossRef] [PubMed] [Green Version]
- Petersen, M.C.; Shulman, G.I. Roles of Diacylglycerols and Ceramides in Hepatic Insulin Resistance. Trends Pharmacol. Sci. 2017, 38, 649–665. [Google Scholar] [CrossRef] [PubMed]
- Todoric, J.; Loffler, M.; Huber, J.; Bilban, M.; Reimers, M.; Kadl, A.; Zeyda, M.; Waldhausl, W.; Stulnig, T.M. Adipose tissue inflammation induced by high-fat diet in obese diabetic mice is prevented by n-3 polyunsaturated fatty acids. Diabetologia 2006, 49, 2109–2119. [Google Scholar] [CrossRef] [PubMed] [Green Version]


| Author/Year | Bäckhed et al. [10] | Fleissner et al. [33] | Rabot et al. [31] | Ding et al. [29] | Caesar et al. [34] | Kübeck et al. [35] |
| Mouse Strain | C57BL/6J | C3H | C57BL/6J | C57BL/6J | C57BL/6J | C57BL/6N |
| Diet Type | ||||||
| Fat (%) | 40.6% 50% lard + 50% hydrogen-ated vegetable shortening | Diet 1, 43% 90% coconut + 5% thistle + 5% linseed oil Diet 2, 40.6% 50% lard + 50% hydrogen-ated vegetable shortening | 60% 94% lard + 6% soybean oil | 45% 88% lard, 12% soybean oil | 45% Diet 1: 88% lard + 12% soybean oil Diet 2: 88% fish oil + 12% soybean oil | 48% Diet 1: 80% lard + 20% soybean oil Diet 2: 80% palm oil + 20% soybean oil |
| Carbohy-drate% Sucrose (g/kg) | 40.7 (183) | 41 (Diet 1: 50; Diet 2: 183) | 20 (73) | 35 (0) | 35 (173) | 34 (50) |
| Protein% | 18.7 | 16 | 20 | 20 | 20 | 18 |
| Suscepti-ble to DIO? | No | Diet 1: Yes Diet 2: No | No | No | Diet 1: Yes Diet 2: No | Diet 1: No Diet 2: Yes |
| Findings | GF mice protected from DIO by increased AMPK activity and FA oxidation in peripheral tissues and increased intestinal Fiaf expression. | Diet 1: gained significant weight. Diet 2: no weight gain as observed by Bäckhed et al.(10). Composition of lipid and CHO affects weight gain. No role for intestinal Fiaf or SCFA. | GF mice consume fewer calories and excrete more fecal lipids than CV mice, gain less weight on HFD. | HFD and gut bacteria interact to promote IFM that precedes develop-ment of obesity, adiposity and insulin resistance in CV mice. | Lard-based HFD activates TLR signaling, induces CCL2, subsequent macrophage recruitment to WAT and IFM. GF mice only partly protected from lard-induced WAT IFM indicating microbiota-independent mechanisms contribute to IFM. | Cholesterol affects the crosstalk between IMB and host metabolism. Diet composition matters, GF animals on lard-based HFD saw reduced intestinal fat absorption |
| Low-Fat Diet | High-Fat Diet | |||
|---|---|---|---|---|
| Ingredient | g/kg | kcal/kg | g/kg | kcal/kg |
| Lard | 19.0 | 171.0 | 316.6 | 2849.4 |
| Corn oil | 23.7 | 213.3 | 32.3 | 290.7 |
| Cornstarch | 411.9 | 1482.8 | 0.0 | 0.0 |
| Dyetrose 1 | 161.6 | 614.1 | 161.6 | 614.1 |
| Sucrose | 88.9 | 355.6 | 88.9 | 355.6 |
| Cellulose | 47.4 | 0 | 54.6 | 0 |
| Casein | 189.6 | 678.8 | 258.5 | 925.4 |
| Mineral mix #210088 1 | 10.0 | 16.0 | 12.9 | 20.6 |
| Vitamin mix #300050 1 | 10.0 | 39.2 | 12.9 | 50.6 |
| Dicalcium carbonate | 12.3 | 0 | 16.8 | 0 |
| Potassium citrate | 15.6 | 0 | 21.3 | 0 |
| Choline bitartrate | 2.0 | 0 | 2.6 | 0 |
| Total energy, kcal | 3571 | 5106 | ||
| Total fat, g | 43.0 | 349.0 | ||
| 14:0 Myristic acid | 0.3 | 7.8 | ||
| 16:0 Palmitic acid | 7.7 | 84.3 | ||
| 16:1 Palmitoleic acid | 0.7 | 10.8 | ||
| 18:0 Stearic acid | 3.7 | 42.9 | ||
| 18:1 Oleic acid | 14.5 | 147.0 | ||
| 18:2 Linoleic acid | 15.9 | 51.9 | ||
| 18:3 Linoleic acid | 2.3 | 7.3 | ||
| Total carbohydrate, g | 673 | 263 | ||
| Total fiber, g | 47.4 | 64.6 | ||
| Total protein, g | 192.0 | 262.0 | ||
| Total cholesterol, g | 0.014 | 0.28 | ||
| Conventional | Germ-Free | p-Values | ||||||
|---|---|---|---|---|---|---|---|---|
| Parameter | LFD | HFD | LFD | HFD | SEM | IMB | HFD | IMB × HFD |
| Body Weight | n = 10 | n = 10 | n = 11 | n = 11 | ||||
| Starting, g | 41.9 | 44.1 | 39.1 | 38.0 | 1.1 | <0.001 c | 0.64 | 0.13 |
| Final, g | 48.0 b | 56.0 a | 41.5 b | 46.3 a | 1.7 | <0.001 c | <0.001 c | 0.34 |
| DWG, mg/d | 88 b | 170 a | 36 b | 118 a | 16 | 0.002 c | <0.001 c | 0.99 |
| Fat pad, g | 1.86 | 1.77 | 0.77 b | 2.77 a | 0.28 | 0.86 | <0.001 c | <0.001 e |
| Fat pad, %BW | 3.81 | 3.13 | 1.87 b | 5.85 a | 0.46 | 0.35 | <0.001 c | <0.001 e |
| Feed | ||||||||
| Consumption g/d | 4.19 a | 3.44 b | 3.82 | 3.68 | 0.14 | 0.65 | 0.003 d | 0.03 e |
| Conversion, % | 2.09 b | 4.97 a | 0.94 b | 3.22 a | 0.43 | 0.001 c | <0.001 c | 0.48 |
| Plasma | ||||||||
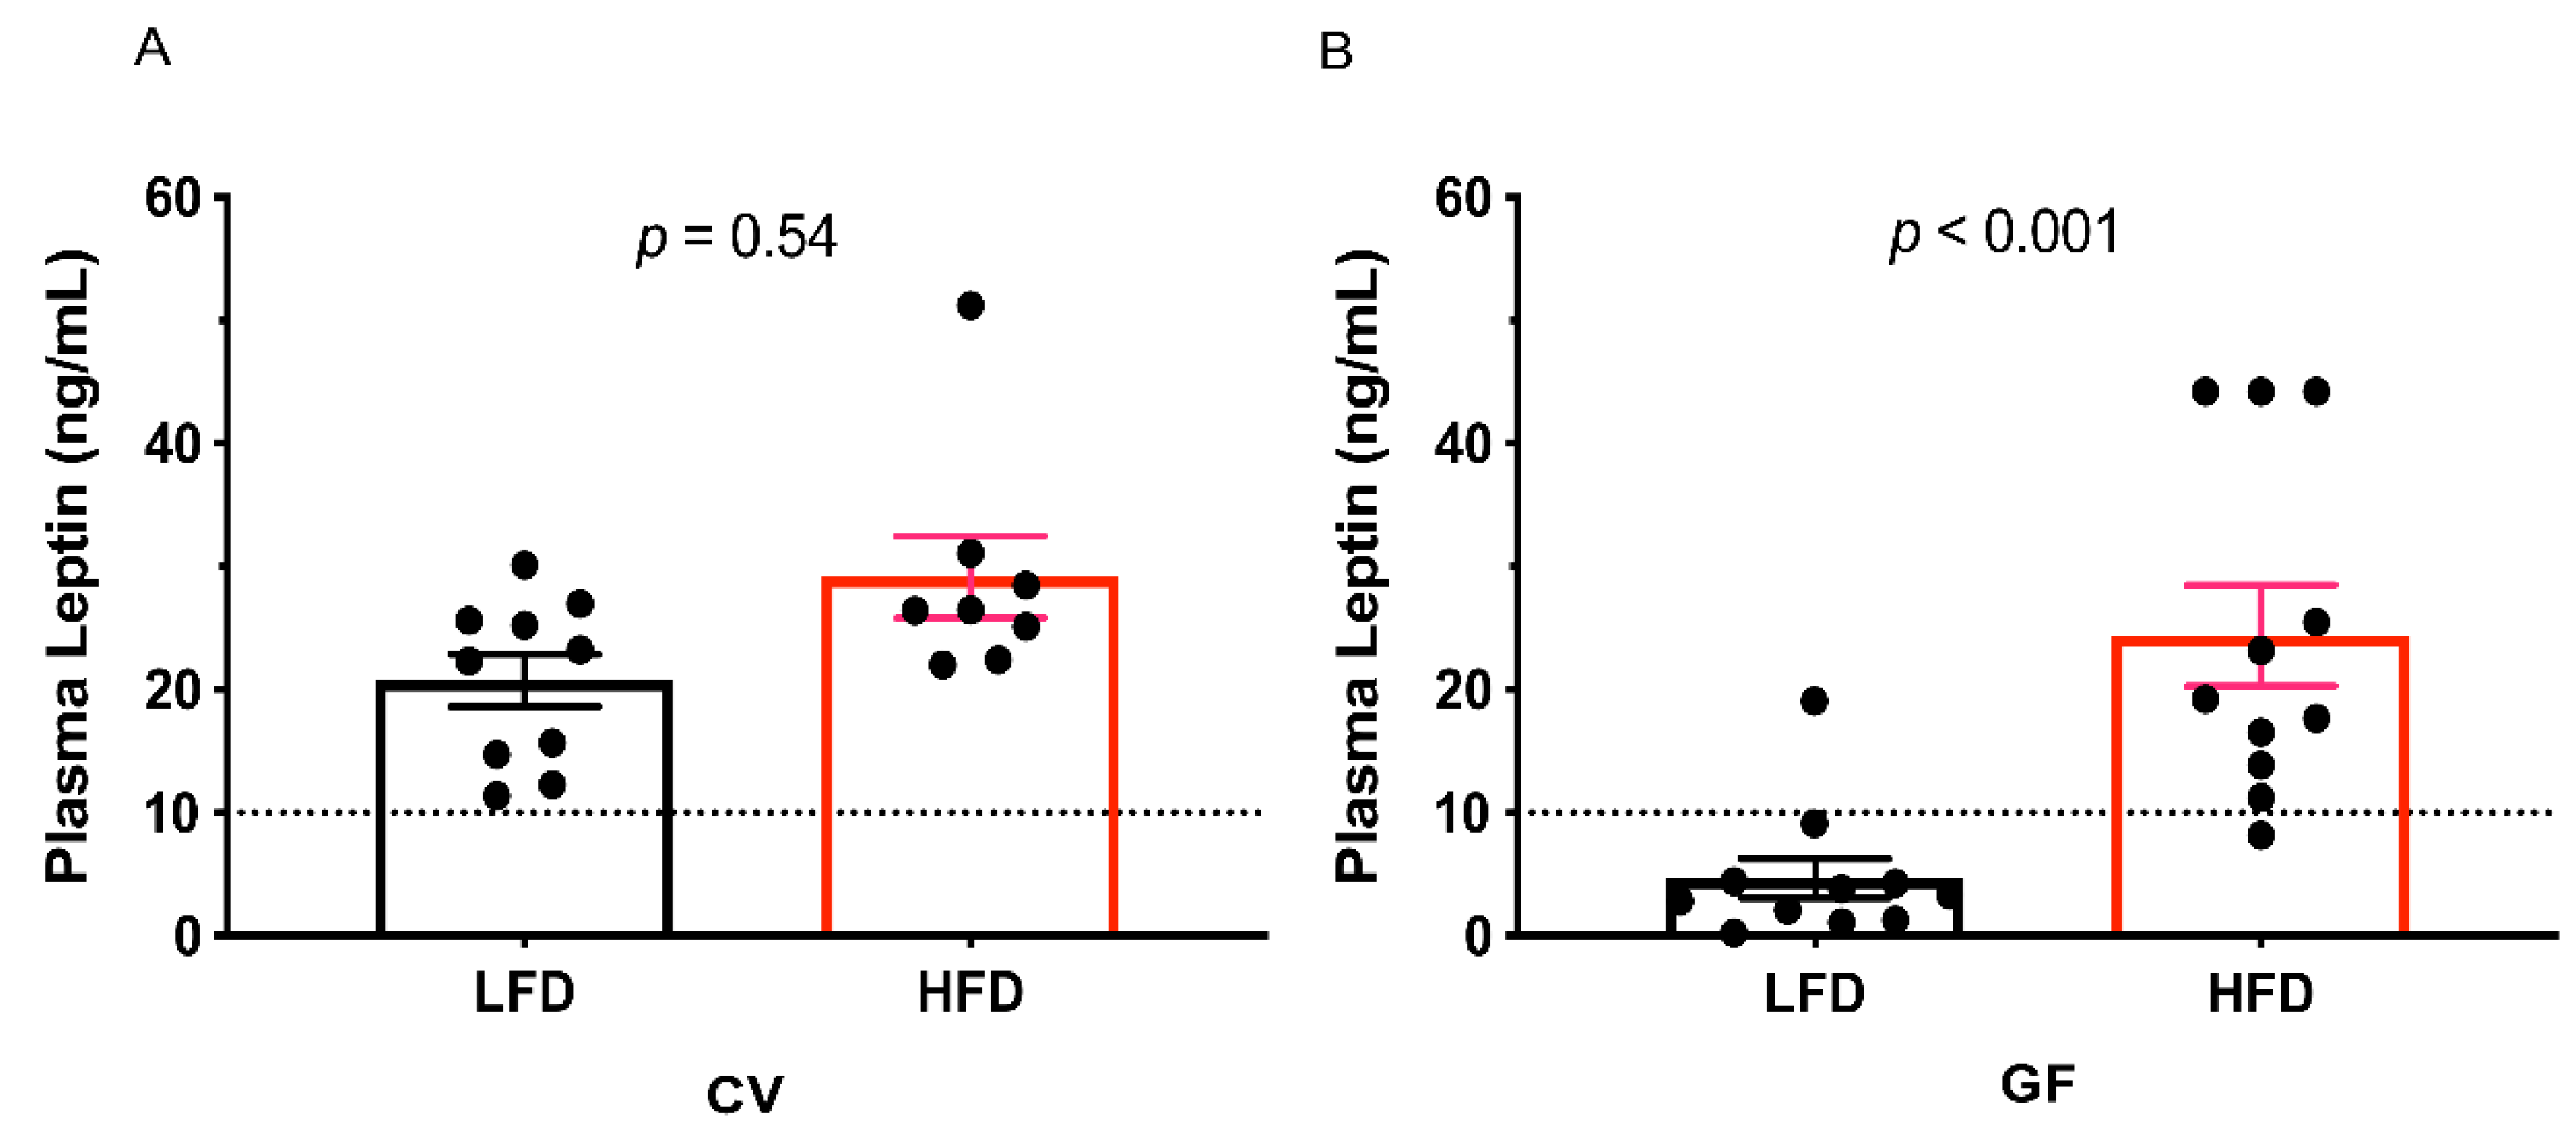
| Leptin, ng/mL | 20.75 | 23.40 | 4.69 b | 24.37 a | 2.75 | 0.01 c | <0.001 c | <0.001 e |
| High Leptin, n = | 10 | 10 | 1 b | 10 a | 0.002 c | 0.004 c | 0.004 e | |
| Conventional | Germ-Free | p-Values | ||||||
|---|---|---|---|---|---|---|---|---|
| LFD | HFD | LFD | HFD | SEM | IMB | HFD | IMB × HFD | |
| Fasting | n = 10 | n = 10 | n = 11 | n = 11 | ||||
| Glucose, mg/dL | 147 a | 215 a | 120 | 150 | 19 | 0.02 c | 0.01 c | 0.32 |
| Insulin, µg/dL | 473 b | 1118 a | 223 | 536 | 142 | 0.005 c | 0.001 c | 0.24 |
| High glucose, n = | 5 | 8 | 0 | 4 | 0.004 c | 0.06 | 1 | |
| High insulin, n = | 4 | 8 | 1 | 5 | 0.06 | 0.03 c | 1 | |
| Glucose tolerance test | 0.03 c | 0.01 c | 0.42 | |||||
| Baseline | 147 a | 215 a | 120 | 150 | 25 | 0.02 c | 0.01 c | 0.32 |
| 15 min | 188 a | 285 a | 215 | 229 | 25 | 0.51 | 0.01 c | 0.07 |
| 30 min | 229 a | 310 a | 211 | 259 | 25 | 0.21 | 0.02 c | 0.54 |
| 60 min | 233 | 309 | 178 | 231 | 25 | 0.02 c | 0.03 c | 0.68 |
| 120 min | 201 | 256 | 116 | 171 | 25 | 0.002 c | 0.04 c | 0.99 |
| Impaired GTT n = | 6 | 8 | 0 b | 5 a | 0.005 c | 0.06 | 0.54 | |
| Conventional | Germ-Free | p-Values | ||||||
|---|---|---|---|---|---|---|---|---|
| Parameter | LFD | HFD | LFD | HFD | SEM | IMB | HFD | IMB × HFD |
| Plasma (mg/dL) | n = 10 | n = 10 | n = 11 | n = 11 | ||||
| Triacylglycerol | 152 b | 237 a | 46 | 42 | 24 | <0.001 c | 0.09 | 0.06 |
| HDL-C | 74 b | 119 a | 53 | 62 | 12 | 0.002 c | 0.03 c | 0.14 |
| LDL-C | 92 b | 110 a | 55 b | 80 a | 6 | <0.001 c | <0.001 c | 0.49 |
| High-TAG, n = | 4 | 7 | 0 | 0 | <0.001 c | 0.48 | 0.48 | |
| High LDL-C, n = | 4 | 7 | 0 | 1 | <0.001 c | 0.18 | 0.73 | |
| LDL-C ≥ 80, n = | 8 | 9 | 0 b | 7 a | <0.001 c | 0.03 c | 0.06 | |
| Conventional | Germ-Free | p-Values | ||||||
|---|---|---|---|---|---|---|---|---|
| Peak Area × 103 | LFD | HFD | LFD | HFD | SEM | IMB | HFD | IMB × HFD |
| Carnitines | n = 10 | n = 10 | n = 11 | n = 11 | ||||
| Free | 71,457 | 67,040 | 69,794 | 69,217 | 3482 | 0.94 | 0.47 | 0.58 |
| acylated (AC) | ||||||||
| Total | 105,362 | 118,749 | 86,036 | 80,669 | 10,614 | 0.009 c | 0.70 | 0.37 |
| Short-Chain | 99,201 | 91,191 | 70,044 | 67,839 | 7905 | 0.002 c | 0.51 | 0.71 |
| AC 2:0 | 89,244 | 76,008 | 58,864 | 55,346 | 7182 | <0.001c | 0.24 | 0.49 |
| AC 4:1-OH | 9034 | 14,012 | 10,509 | 11,992 | 2631 | 0.92 | 0.22 | 0.50 |
| AC 5:0 | 923 | 1171 | 671 | 501 | 194 | 0.02 c | 0.84 | 0.28 |
| Medium-Chain | 296 b | 722 a | 307 | 308 | 72 | 0.007 d | 0.004 c | 0.004 e |
| AC 8:0 | 127 | 149 | 128 b | 639a | 20 | 0.04 d | 0.28 | 0.03 e |
| AC 10:0 | 119 b | 214 a | 118 | 119 | 279 | 0.08 | 0.08 | 0.09 |
| AC 14:2 | 49 b | 358 a | 61 | 125 | 37 | 0.004 d | <0.001c | 0.002 e |
| Long-Chain | 5865 b | 26,836a | 15,685 | 12,522 | 4218 | 0.59 | 0.04 c | 0.006 e |
| AC 16:0 | 995 b | 4458 a | 2562 | 2756 | 770 | 0.93 | 0.02 c | 0.04 e |
| AC 16:1 | 913 b | 2138 a | 2072 a | 726 b | 380 | 0.74 | 0.87 | 0.001 e |
| AC 18:0-OH | 52 b | 178 a | 108 b | 181 a | 24 | 0.22 | <0.001c | 0.26 |
| AC 18:1-OH | 159 b | 591 a | 480 | 382 | 87 | 0.52 | 0.06 | 0.004 e |
| AC 18:1 | 2542 b | 12,621a | 7591 | 4273 | 2284 | 0.46 | 0.14 | 0.005 e |
| AC 18:2 | 591 b | 3816 a | 965 | 2291 | 559 | 0.63 | <0.001c | 0.09 |
| AC 18:3 | 59 b | 291 a | 80 | 163 | 47 | 0.25 | 0.002 c | 0.12 |
| AC 20:1 | 295 b | 1475 a | 1170 a | 602 b | 192 | 0.99 | 0.11 | <0.001 e |
| AC 20:2 | 136 b | 833 a | 297 | 365 | 87 | 0.08 | <0.001c | 0.0007 e |
| AC 20:4 | 122 b | 435 a | 359 b | 782 a | 64 | <0.001d | <0.001c | 0.38 |
| Conventional | Germ-Free | p-Values | |||||||
|---|---|---|---|---|---|---|---|---|---|
| Parameter Species | LFD | HFD | LFD | HFD | SEM | IMB | HFD | IMB × HFD | |
| Liver | n = 10 | n = 10 | n = 11 | n = 11 | |||||
| Liver, g | 2.59 | 2.88 | 1.46 | 1.48 | 0.27 | <0.001 c | 0.52 | 0.58 | |
| Liver, %BW | 5.35 | 5.16 | 3.55 | 3.24 | 0.44 | <0.001 c | 0.53 | 0.88 | |
| Liver lipid extract (peak area × 103) | |||||||||
| Total lipids | 125 | 36,892 b | 49,017 a | 44,975 b | 54,577 a | 3025 | 0.03 d | <0.001 c | 0.67 |
| Acylglycerols | 45 | 18,455 b | 27,413 a | 19,936 b | 26,728 a | 1413 | 0.77 | <0.001 c | 0.44 |
| TAG | 34 | 18,156 b | 27,054 a | 19,575 b | 26,269 a | 1393 | 0.82 | <0.001 c | 0.42 |
| DAG | 9 | 258 | 314 | 314 | 409 | 51 | 0.14 | 0.14 | 0.70 |
| MAG | 2 | 40 | 45 | 48 | 50 | 18 | <0.001 d | 0.05 c | 0.57 |
| Glycero PL | 65 | 14,258 | 16,448 | 19,797 | 22,027 | 2211 | 0.01 d | 0.31 | 0.99 |
| PA | 6 | 155 | 181 | 216 b | 332 a | 237 | <0.001 d | 0.004 c | 0.06 |
| Lyso-PE | 6 | 165 | 170 | 209 | 239 | 35 | 0.10 | 0.61 | 0.72 |
| PE | 15 | 7888 | 9472 | 11,315 | 13,161 | 1329 | 0.009 d | 0.19 | 0.92 |
| PC | 16 | 3418 | 3711 | 4100 | 4489 | 454 | 0.13 | 0.47 | 0.92 |
| PI | 10 | 1484 | 1633 | 2357 a | 1634 b | 2272 | 0.06 | 0.20 | 0.06 |
| PS | 7 | 838 | 1087 | 1310 b | 1928 a | 147 | <0.001 d | 0.004 c | 0.20 |
| PG | 5 | 310 a | 194 b | 290 | 243 | 282 | 0.60 | 0.006 c | 0.23 |
| Sphingolipids | 9 | 2105 b | 3412 a | 3560 b | 4254 a | 184 | <0.001 d | <0.001 c | 0.10 |
| Ceramides | 5 | 315 b | 491 a | 513 b | 669 a | 33 | <0.001 d | <0.001 c | 0.77 |
| Sphingomyelin | 3 | 1790 b | 2920 a | 3047 b | 3585 a | 171 | <0.001 d | <0.001 c | 0.08 |
| FFA | 6 | 44 | 52 | 83 b | 166 a | 28 | 0.008 d | 0.10 | 0.18 |
© 2020 by the authors. Licensee MDPI, Basel, Switzerland. This article is an open access article distributed under the terms and conditions of the Creative Commons Attribution (CC BY) license (http://creativecommons.org/licenses/by/4.0/).
Share and Cite
Logan, I.E.; Bobe, G.; Miranda, C.L.; Vasquez-Perez, S.; Choi, J.; Lowry, M.B.; Sharpton, T.J.; Morgun, A.; Maier, C.S.; Stevens, J.F.; et al. Germ-Free Swiss Webster Mice on a High-Fat Diet Develop Obesity, Hyperglycemia, and Dyslipidemia. Microorganisms 2020, 8, 520. https://doi.org/10.3390/microorganisms8040520
Logan IE, Bobe G, Miranda CL, Vasquez-Perez S, Choi J, Lowry MB, Sharpton TJ, Morgun A, Maier CS, Stevens JF, et al. Germ-Free Swiss Webster Mice on a High-Fat Diet Develop Obesity, Hyperglycemia, and Dyslipidemia. Microorganisms. 2020; 8(4):520. https://doi.org/10.3390/microorganisms8040520
Chicago/Turabian StyleLogan, Isabelle E., Gerd Bobe, Cristobal L. Miranda, Stephany Vasquez-Perez, Jaewoo Choi, Malcolm B. Lowry, Thomas J. Sharpton, Andrey Morgun, Claudia S. Maier, Jan F. Stevens, and et al. 2020. "Germ-Free Swiss Webster Mice on a High-Fat Diet Develop Obesity, Hyperglycemia, and Dyslipidemia" Microorganisms 8, no. 4: 520. https://doi.org/10.3390/microorganisms8040520