Abstract
The presented study investigates the kinetic properties of catalase during hydrogen peroxide decomposition reaction. A novel and simple method is hereby proposed for the determination of the enzyme deactivation rate constant (kd) and the decomposition of H2O2 reaction rate constant (kr). Available methods allow the kd constant to be determined only based on previously experimentally determined kr. The presented method differs from the conventional procedure. Known initial and final concentrations of hydrogen peroxide enable determination of both constants at the same time based on data from only one experiment. The correctness of the new method proposed here in determining the reaction rate constant was checked by comparing the obtained constant values with the calculated values according to the commonly used Aebi method. The method was used to analyze in detail the effect of pH (3–10) and temperature (10–45 °C) of the reaction medium on kinetic constants. The value of the constant kd increases together with the value of pH and temperature. In addition, the activation energy for decomposition reaction and deactivation reaction was found to be Er = 14 kJ mol−1 and Ed = 56.8 kJ mol−1 respectively.
1. Introduction
Enzymes are highly efficient and selective biological catalysts under specific conditions, which makes their use extremely popular in various bioprocesses [1,2]. One of the common enzymes ubiquitously found in all living organisms is catalase [3,4]. Enzymes from various sources exhibit some differences in structure and properties [5,6,7]; nevertheless, all of them decompose hydrogen peroxide into molecular oxygen and water in the two-step process shown in Equation (1). In the first step, the heme-containing catalase bonds with and breaks up a molecule of hydrogen peroxide into harmless water and oxygen atom. This oxygen atom is joined to the iron atom present in the heme (Compound I). In the next step, a second hydrogen peroxide molecule binds and is also divided into two parts. After the second oxygen atom is attached to the iron atom the molecules of water and oxygen gas are released [8].
When H2O2 concentration is low, catalase can return to the native enzyme oxidizing secondary two-electron donors, e.g., low molecular alcohols (peroxidatic activity). A secondary two-electron donor participates in the second step of Equation (1) [9]. However, under certain conditions, Compound II can be created, but it cannot be effectively reduced to the native enzyme and therefore its accumulation leads to the catalase deactivation. Catalases may also form another intermediate product known as Compound III and are generally inactive towards most electron donors. Compound III structurally resembles oxy forms of mioglobin and hemoglobin. It can be generated in the reactions of Compound II with hydrogen peroxide, or ferric catalases with superoxide [9].
Catalase has a number of uses including food processing, the pharmaceutical and cosmetics industry, textiles, paper production, medical fields and also the bioremediation field [10,11]. Application of catalase in industrial processes is limited by the inability to withstand harsh operating conditions, e.g., high temperatures, extreme pH values, high detergent concentrations and high organic solvent concentrations [12]. The activity of the enzyme is lost due to changes in its spatial structure or polypeptide chain ruptures. Many operations have been applied in order to improve the use of enzymes in industry processes. The most popular of these is immobilization [13,14,15,16], which not only improves the catalytic stability of the enzyme but also allows its repeated use. There are also many reports on the improvement of enzyme activity using molecular biology methods [17,18]. Each technique is based on knowledge of the catalytic reaction mechanisms and the accompanying deactivation processes. Therefore, it is so important to look for new methods for determining the kinetic parameters of reactions that give us better understanding of the phenomena occurring during the reaction.
Decomposition of hydrogen peroxide using enzymes and deactivation of catalase follow first order kinetics with respect to the enzyme and substrate [19]. It has been shown that bovine liver catalase is both reversibly inhibited and irreversibly deactivated at high hydrogen peroxide concentration. Kinetic modeling has highlighted the role of Compound III in both types of activity loss [20]. Due to the phenomenon of substrate catalase deactivation, the use of this first order kinetics equation is only valid for low concentrations of hydrogen peroxide [21]. Information regarding the deactivation of catalase during the decomposition of hydrogen peroxide available in the literature refers mainly to deactivation using the substrate. There is no research concerning the effect of pH and temperature of the reaction mixture on bovine liver catalase deactivation rate.
Deactivation of catalase using substrate can be caused by the creation of inactive Compound II. Compound I from Equation (1) is an enzyme from an oxyferryl group with a π-cationic porphyrin radical. Forming of Compound II can result from the reduction of Compound I using a single electron (Equation (2) [22]).
The possibility of creating a hydroxyferryl form of Compound II was also demonstrated [23]:
Based on the above equations, the catalase deactivation is described using first order kinetics, and the dependence of the reaction rate, vd, on H2O2 concentration assumes the following form:
where CS and CE represent the hydrogen peroxide concentration and active enzyme concentration respectively and kd is the enzyme deactivation rate constant.
This article provides a general mathematical procedure for the simulation of biochemical reactors operated batchwise when both the enzyme catalyzed reaction and the enzyme deactivation reaction take place. A novel method is proposed in order to calculate the kinetic parameters of enzyme reaction and deactivation. The effect of pH and temperature on the reaction rate constant of H2O2 decomposition and the rate constant of deactivation during the enzymatic process were analyzed in detail. Unlike the ordinary kinetic assays performed in a short time, the presented method requires determination of the final substrate concentration when the enzyme is completely deactivated. The method is based on experimental data from the decomposition of hydrogen peroxidase using bovine liver catalase.
Catalase is one of the first enzymes obtained in crystalline form and a series of studies have been carried out on its activity, applications and methods of immobilization. However, the mechanism of action on H2O2 and the effects of environmental factors is still unclear. Catalase activity is significantly affected by the pH values of the aqueous medium and temperature [24]. So far, no one has studied the impact of these two factors on the kinetic parameters for hydrogen peroxide decomposition reaction using bovine liver catalase in wide range. Literature data is fragmentary and inconsistent [21,25,26,27,28]. Therefore, this study analyzed in detail the effect of pH and temperature on the reaction rate constant of H2O2 decomposition and the rate constant of deactivation during the enzymatic process.
2. Results and Discussion
A new element in the presented study is the method of determining kd. In other works [21,25,26], the algorithm of operation assumes determining first the value k based on the known initial concentration of the enzyme and on the initial linear slope of a first-order plot. Then, the value of kd was calculated. In this work there is no need to know the reaction rate constant of H2O2 decomposition, but one has to be sure that all the used enzyme is engaged and the final concentration of H2O2 is achieved.
2.1. Effect of pH
To determine the kinetic parameters of the decomposition of H2O2, the reaction has to run with the excess substrate (Figure 1). The presented method also requires that the reaction has to last long enough to find a final concentration (CSF) of H2O2 after total deactivation of the enzyme (Table 1).
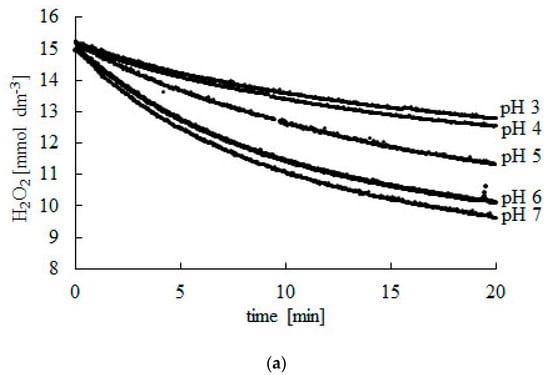
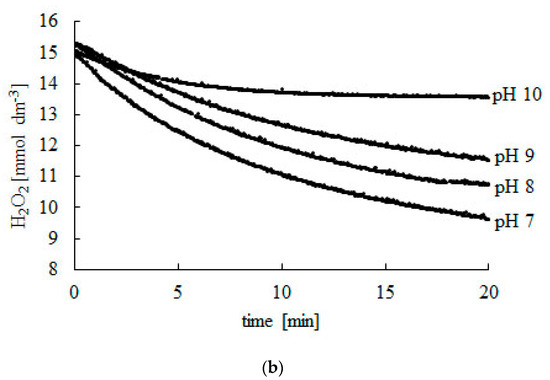
Figure 1.
Change in H2O2 concentration during the decomposition reaction catalyzed using bovine liver catalase. (a) pH 3–7, (b) pH 7–10. Experiments were carried out at 25 °C. Readings were taken at 2-s intervals during 20 min. Afterwards, readings were taken every 10 min until a constant CSF concentration was reached.

Table 1.
Initial (CS0) and final (CSF) concentration of hydrogen peroxide at different pH.
For known values of CS0 and ΔCS, based on Equation (14) the plots of f(CS) vs. time for each pH were created (Figure 2). Afterwards, linear regressions were performed and the values of kd were determined from the slope of the solid line. The R2 coefficients were determined, and their values were higher than 0.98 for each case. These results demonstrate that the regressions are highly significant. The closer the R2 is to 1, the stronger the model is and the better it predicts the response.
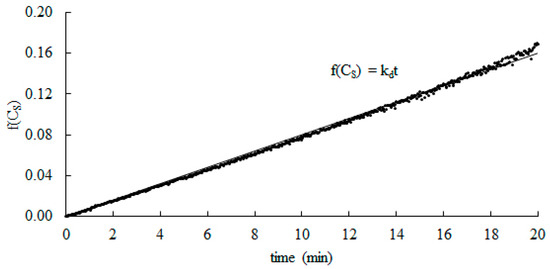
Figure 2.
Typical plot of integrated rate equation for catalytic activity of catalase. Experiments were carried out at 25 °C and pH = 7.
Figure 3 shows the effect of the pH of the reaction medium on the rate constant of the deactivation process. Changing the buffer used to ensure an adequate pH value may affect catalase activity [29]. To ensure the reliability of the results, experiments were performed using two different buffers on the border of their operation. Values of kd were very similar. In accordance to the line of the graph, the value of the constant kd increases together with pH.
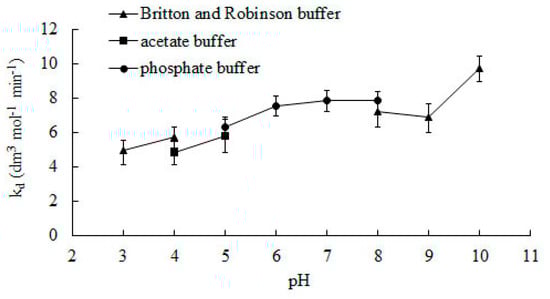
Figure 3.
The effect of the pH of the reaction medium on the rate constant of deactivation during the enzymatic process. Error bars represent standard deviation mean of three replicates whilst means with the same letters in the same observation are not significantly different at 0.05 level of the LSD test.
So far, no one has presented research on the effect of pH on deactivating bovine liver catalase for the H2O2 decomposition reaction. In the literature, the deactivation constant can only be found for pH 7. The value of the constant kd determined by the presented method for this pH is 7.85 dm3 mol−1 min−1 and is ca. 13% and 6% lower than those determined by Deluca et al. [26] and Feuers et al. [25].
For known values of the enzyme deactivation rate constant (kd) and ΔCS, based on Equation (12) the reaction rate constants k were determined. The reaction rate constant was also calculated using the Aebi method [30], based on the results of the decrease in the substrate concentration during the first minute of the experiment. The calculation results for both methods are presented in Figure 4.
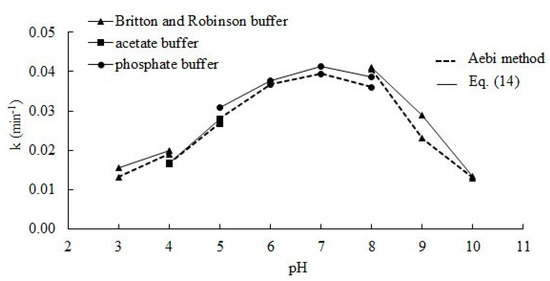
Figure 4.
The effect of the pH of the reaction medium on the hydrogen peroxide decomposition rate constant.
Figure 4 shows changes in the hydrogen peroxide decomposition rate constant value, which depends on the pH ranging from 3 to 10. The results obtained for the constant k using the presented method, based on Equation (12), are in all cases slightly higher and do not differ much from those calculated according to the Aebi method [30]; this result proves the correctness of the presented method. The Aebi method assumes that deactivation can be omitted because the measurement time is very short. In fact, with about a one-minute measurement time, slight deactivation should occur, and a lower reaction rate constant (97% to 99%) can be explained in this way. From the plot we can observe a high k value within the range of 6–8, while below and above this range, a significant decrease of rate constant is noticed. The curve shape from Figure 4 will be identical for the relation kr to pH, therefore it can be compared with the results presenting activity. Similar results were obtained by Kaushal et al. [11]. Activity of catalase decreased by 50% at pH 9, but in the acid region it decreased by ca. 80%. The acid segment of the curve also differs from what was obtained by Chance [27]; this result can be caused by usage of different buffer in this range of pH. Most studies on catalase activity at various pH were conducted in a narrow pH range. The curve (Figure 4) is also consistent with the Góth’s [28] results, however a comparison is only possible in the range of 6–8.
2.2. Effect of Temperature
Among the parameters affecting enzyme activity, temperature is the most important because it can be easily manipulated, and it affects not only the catalytic reaction rate but also the rate of deactivation of the enzyme [24]. The effect of temperature on the kinetic parameters of decomposition of H2O2 was studied in this work by carrying out the reaction at different temperatures of reaction medium, in the range of 10–45 °C. The rate constant of deactivation during the enzymatic process and reaction rate constant of H2O2 decomposition were determined in the same way as for pH effect analysis. The rate constants kd were calculated as the slope of the line from Figure 2. The results, with their standard deviations SD and determination coefficients R2, are presented in Table 2.
Table 2.
Effect of the temperature of the reaction medium on the rate constant of deactivation during the enzymatic process, pH = 7. Data for which R2 values are not reported are from the literature cited.
From the data shown in Table 2, it was observed that the constant kd increases together with temperature. It was detected that kd increased ca. 14 times whilst temperature increased from 10 °C to 45 °C. It is clear that in the conditions adopted in these tests, 45 °C is not a convenient temperature for the process and a lower value should be adopted.
The rate constant of deactivation kd values for catalase from bovine liver are much higher than those obtained by Miłek [31] for fungal catalase. Comparing the results (Figure 5) confirms that catalase from animal tissues more easily tends to convert into a catalytically inactive form than those obtained from microorganisms.
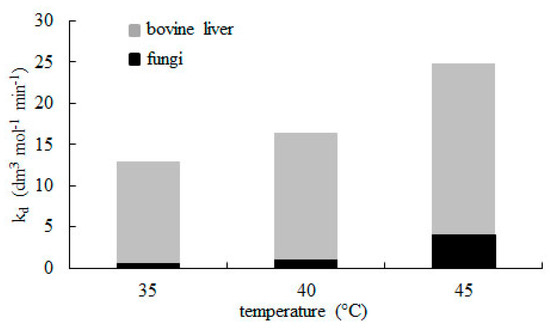
Figure 5.
Comparision between rate constant of catalase deactivation (kd) for enzyme from bovine liver and fungi [31]. Decomposition was conducted using 15 mmol dm−3 hydrogen peroxide at pH = 7.
Rate constants of catalase deactivation were presented as an Arrhenius plot (Figure 6), and the activation energy for catalase deactivation was estimated (Ed = 56.8 kJ mol−1).
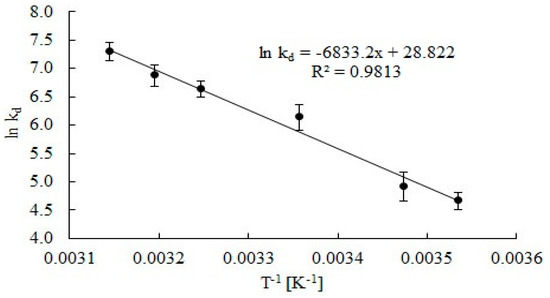
Figure 6.
Arrhenius plots to calculate activation energy Ed catalase deactivation during the decomposition of H2O2. Error bars represents the standard deviation mean of three replicates, while means with the same letters in the same observation are not significantly different at 0.05 level of the LSD test.
Values of the determination coefficient (R2 = 0.9813) points out goodness of regression, which can be used to explain 98.13% of total variation in the response. The activation energy of catalase deactivation is three times lower than the activation energy for catalase deactivation in water in the presence of substrate estimated by Cantemir et al. [29].
Based on known values of kd, ΔCS and Equation (12) reaction rate constants k were determined. The obtained results were compared with those calculated according to the Aebi method [30]. The results obtained with both methods do not differ significantly from each other. Effect of the temperature of the reaction medium on the hydrogen peroxide decomposition rate constant is presented in Figure 7 for temperatures of 10–45 °C. Together with temperature increase, a large increase of the reaction rate constant value is observed, but after exceeding 25 °C, constant k does not change significantly.
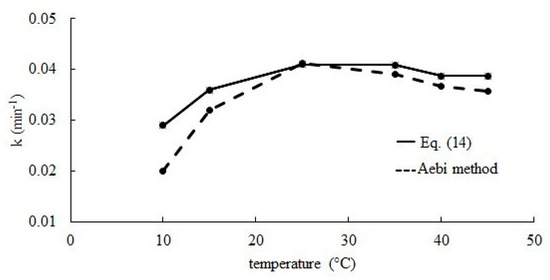
Figure 7.
The effect of temperature on the hydrogen peroxide decomposition rate constant.
Figure 8, the Arrhenius activation energy for decomposition of H2O2 was determined. Value of Er was calculated to be 14 kJ mol−1 and is slightly higher than estimated by Góth [28]. For an enzyme from the same supplier (Sigma), the activation energy is reduced by 5.8 kJ mol−1. However, catalase activity was measured using a different method. Moreover, activation energy was calculated according to the Arrhenius plot, based on determination of enzyme activities at four temperatures in a narrow range between 20 and 33 °C. The value of calculated activation energy for decomposition of H2O2 is four times lower than the catalase deactivation energy. The energy necessary to start the deactivation reaction is much higher than the energy needed to initiate the catalytic reaction. This result confirms other authors’ findings [31,32,33].
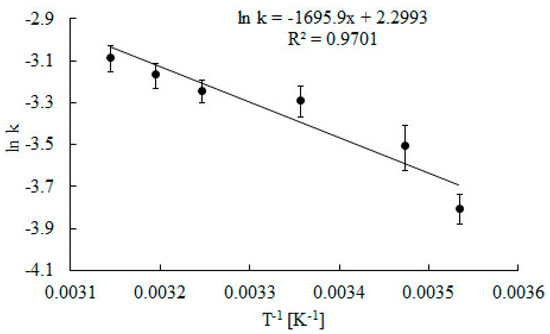
Figure 8.
Arrhenius plots to calculate activation energy for Er decomposition of H2O2 reaction. Error bars represent the standard deviation mean of three replicates, while means with the same letters in the same observation are not significantly different at 0.05 level of the LSD test.
3. Materials and Methods
3.1. Materials
For all experiments, bovine liver catalase (EC 1.11.1.6) was purchased from Sigma Aldrich (Poznań, Poland). Hydrogen peroxide (H2O2, 30%), monosodium phosphate (NaH2PO4), sodium phosphate dibasic heptahydrate (Na2HPO4∙7H2O), acetic acid (CH3COOH, 99%), sodium acetate (CH3COONa), phosphoric acid (H3PO4, 85%), boric acid (H3BO3, 99%) were purchased from Avantor Performance Materials Poland S.A. (Gliwice, Poland).
3.2. Decomposition of Hydrogen Peroxide
Decomposition of hydrogen peroxide was measured using the method of Beers and Sizer [34]. Spectrophotometer Helios was used to measure the decrease in the absorbance (at 240 nm) during the decomposition of H2O2. The system allows for continuous reading of absorbance. Reaction was carried out within the isothermal batch reactor with mixing. Decomposition of hydrogen peroxide was started by adding a buffered catalase solution (pH 7, 17.5 U mL−1). Initial concentration of H2O2 in the reaction mixture was chosen to be 15 mmol dm−3. The substrate concentrations were calculated using the Lambert-Beer law, with extinction coefficient 39.4 M−1 cm−1. A number of preliminary tests were performed to ensure that observed effects were caused by enzyme deactivation and not due to exhaustion of substrate, inhibition by reaction byproducts or slow heating of samples.
3.3. Determination of Kinetic Parameters
Consideration of an isothermal reactor with perfect mixing gives a system of two ordinary differential equations
where CS and CE represent the hydrogen peroxide concentration and active enzyme concentration respectively. The initial conditions are CS (t = 0) = CS0 and CE (t = 0) = CE0. First one kinetic model (Equation (5)) describes decomposition of hydrogen peroxide reaction with kr as a rate constant. The second model (Equation (6)) defines deactivation of catalase with kd as a rate constant. Measurement of active enzyme concentration during the experiment is not possible. It is convenient to introduce the fraction of catalase activity
where k = krCE0, and the initial conditions are CS (t = 0) = CS0 and A (t = 0) = 1 for Equations (5) and (6) are as follows:
Integration of differential Equations (5) and (6) for k ≠ kdCS0 gives
In a certain case where k = kdCS0 hydrogen peroxide concentration is given by
The determination of the k and kd constants can easily be carried out when the amount of used catalase is not sufficient to decompose the total amount of H2O2 because the enzyme will be completely deactivated. In such a case, the difference in substrate concentrations for the final activity of catalase A = 0 is described based on Equation (10) in the following way:
Based on Equations (10) and (12) and after rearranging (supplement material) we obtain
From Equation (13), the enzyme deactivation rate constant kd can be taken from linear regression on Equation (14).
where the slope is equal to the enzyme deactivation rate constant. Using the known values of kd and ΔCS, reaction rate constant k can be calculated.
3.4. Effect of pH and Temperature
The effect of pH on the kinetic parameters was analyzed by carrying out the decomposition reaction of buffered hydrogen peroxide solution 15 mmol dm−3 at 25 °C over the pH range 3–10 using the following buffers: 0.05 M Britton and Robinson (pH 3–4, pH 8–10), 0.05 M acetate (pH 4–6) and 0.05 M phosphate (pH 6–8).
Further insight into details of the decomposition of hydrogen peroxide and deactivation of catalase was gained from the temperature dependence of rate constants. The effect of temperature was tested performing decomposition reactions in various temperatures ranging from 10 to 45 °C. The experimental data analysis was based on the Arrhenius relationship
where kd0 is specific constant for the deactivation, ED is an activation energy for enzyme deactivation, R is the universal gas constant and T is the absolute temperature. The ED was evaluated from the linear regression ln(kd) vs. T−1. Catalase activation energy Er for H2O2 decomposition was also determined using the Arrhenius equation
where k0 is specific constant for the reaction of H2O2 decomposition. After plotting ln(k) vs. T−1, the activation energy was estimated from the slope of the linear portion of the plot.
3.5. Statistical Analysis
Calculations for rate constants and activation energy were performed using Microsoft Excel 2016 and StatSoft Statistica (Krakow, Poland). The value of rate constants for deactivation of catalase were determined using linear regression using the least squares method (Levenberg-Marquardt). Basic descriptive statistics have been used, such as mean standard deviations and determination coefficient R2. Fisher’s least significant difference (LSD) was carried out at a 95% confidence interval to check the significance difference among the means—the mean square due to regression and the mean square due to error.
4. Conclusions
This study presents a new method to establish the kinetic parameters for hydrogen peroxide decomposition reaction using catalase from bovine liver. It has been shown that it is possible to determine the kd constant only using data of H2O2 concentration changes. In addition, this method allows the determination of both kd and kr constants at the same time based on one experiment. The results of the constant reaction rate of H2O2 decomposition obtained using the presented method are very close to the results calculated using the popular Aebi method [30]. Research confirms the range of pH to achieve the high values of the rate constant, i.e., 6–8. Studies have also shown the degree of deactivation of the enzyme which occurs in parallel with the reaction of hydrogen peroxide decomposition. The method might be applicable to enzymes in general and can be used to determine if the enzyme exposed to external factors undergoes mechanisms of deactivation.
Supplementary Materials
The following are available online at https://www.mdpi.com/2073-4344/10/3/323/s1.
Funding
This research received no external funding.
Acknowledgments
The author is thankful to Marek Wójcik for providing valuable comments and feedback at various stages of this research.
Conflicts of Interest
The authors declare no conflict of interest.
References
- Zhang, Y.; Shudong, H.; Simpson, B.K. Enzymes in food bioprocessing—Novel food enzymes, applications, and related techniques. Curr. Opin. Food Sci. 2018, 19, 30–35. [Google Scholar] [CrossRef]
- Madhu, A.; Chakraborty, J.N. Developments in application of enzymes for textile processing. J. Clean Prod. 2017, 145, 114–133. [Google Scholar] [CrossRef]
- Zamocky, M.; Koller, F. Understanding the structure and function of catalases: Clues from molecular evolution and in vitro mutagenesis. Prog. Biophys. Mol. Biol. 1999, 72, 19–66. [Google Scholar] [CrossRef]
- Peter, C.L.; Martin, G.K.; Daniel, J.H. Catalase-an “old” enzyme that continues to surprise us. ASM News 2000, 66, 76–78. [Google Scholar]
- Melik-Adamyan, W.R.; Barynin, V.V.; Vagin, A.A.; Borisov, V.V.; Vainshtein, B.K.; Fita, I.; Murthy, M.R.; Rossmann, M.G. Comparison of beef liver and Penicillium vitale catalases. J. Mol. Biol. 1986, 188, 63–72. [Google Scholar] [CrossRef]
- Sharma, K.D.; Andersson, L.A.; Loehr, T.M.; Terner, J.; Goff, H.M. Comparative spectral analysis of mammalian, fungal, and bacterial catalases. Resonance Raman evidence for iron-tyrosinate coordination. J. Biol. Chem. 1989, 264, 12772–12779. [Google Scholar]
- Chelikani, P.; Fita, I.; Loewena, P.C. Diversity of structures and properties among catalases. Cell. Mol. Life Sci. 2004, 61, 192–208. [Google Scholar] [CrossRef]
- Fita, I.; Rossmann, M.G. The active center of catalase. J. Mol. Biol. 1985, 185, 21–37. [Google Scholar] [CrossRef]
- Gebicka, L.; Krych-Madej, J. The role of catalases in the prevention/promotion of oxidative stress. J. Inorg. Biochem. 2019, 197, 110699. [Google Scholar] [CrossRef]
- Loncar, N.; Fraaije, M.W. Catalases as biocatalysts in technical applications: Current state and perspectives. Appl. Microbiol. Biotechnol. 2015, 99, 3351–3357. [Google Scholar] [CrossRef]
- Kaushal, J.; Mehandia, S.; Singh, G.; Raina, A.; Arya, S.K. Catalase enzyme: Application in bioremediation and food industry. Biocatal. Agric. Biotechnol. 2018, 16, 192–199. [Google Scholar] [CrossRef]
- Raducan, A.; Cantemir, A.R.; Puiu, M.; Oancea, D. Kinetics of hydrogen peroxide decomposition by catalase: Hydroxylic solvent effects. Bioprocess Biosyst. Eng. 2012, 35, 1523–1530. [Google Scholar] [CrossRef] [PubMed]
- Katzbauer, B.; Narodoslawsky, M.; Moser, A. Classification system for immobilization techniques. Bioprocess Eng. 1995, 12, 173–179. [Google Scholar] [CrossRef]
- Grigoras, A.G. Catalase immobilization—A review. Biochem. Eng. J. 2017, 117, 1–20. [Google Scholar] [CrossRef]
- Chapman, J.; Ismail, A.; Dinu, C. IndustriaApplications of Enzymes: Recent Advances, Techniques, and Outlooks. Catalysts 2018, 8, 238. [Google Scholar] [CrossRef]
- Wang, Q.; Lian, X.; Fang, Y.; Zhou, H.C. Applications of immobilized biocatalyst in metal–organic frameworks. Catalysts 2018, 8, 166. [Google Scholar] [CrossRef]
- Ronai, I. How the techniques of molecular biology are developed from natural systems. SocArXiv 2017. [Google Scholar] [CrossRef]
- Sooch, B.S.; Kauldhar, B.S.; Puri, M. Isolation and polyphasic characterization of a novel hyper catalase producing thermophilic bacterium for the degradation of hydrogen peroxide. Bioproc. Biosyst. Eng. 2016, 39, 1759–1773. [Google Scholar] [CrossRef]
- Sadana, A. Enzyme deactivation. Biotechnol. Adv. 1988, 6, 349–446. [Google Scholar] [CrossRef]
- Lardinois, O.M.; Mestdagh, M.M.; Rouxhet, P.G. Reversible inhibition and irreversible inactivation of catalase in the presence of hydrogen peroxide. Biochim. Biophys. Acta 1996, 1295, 222–238. [Google Scholar] [CrossRef]
- Ghadermarzi, M.; Moosavi-Movahedi, A. Determination of the kinetic parameters for the “suicide substrate” inactivation of bovine liver catalase by hydrogen peroxide. J. Enzym. Inhib. 1996, 10, 167–175. [Google Scholar] [CrossRef] [PubMed]
- Kirkman, H.N.; Gaetani, G.F. Mammalian catalase: A venerable enzyme with new mysteries. Trends Biochem. Sci. 2007, 32, 44–50. [Google Scholar] [CrossRef] [PubMed]
- Rovira, C. Structure, protonation state and dynamics of catalase compound II. ChemPhysChem 2005, 6, 1–8. [Google Scholar] [CrossRef] [PubMed]
- Ghadermarzi, M.; Moosavi-Movahedi, A.A. The effects of temperature and pH on the kinetics of reactions between catalase and its suicide substrate hydrogen peroxide. Ital. J. Biochem. 1997, 46, 197–205. [Google Scholar] [PubMed]
- Feuers, R.J.; Pattillo, F.M.; Osborn, C.K.; Adams, K.L.; DeLuca, D.; Smith, W.G. Application of an integrated rate equation to the inactivation of catalase. Free Radic. Biol. Med. 1993, 15, 223–226. [Google Scholar] [CrossRef]
- DeLuca, D.C.; Dennis, R.; Smith, W.G. Inactivation of an animal and a fungal catalase by hydrogen peroxide. Arch. Biochem. Biophys. 1995, 320, 129–134. [Google Scholar] [CrossRef]
- Chance, B. Effect of pH upon the reaction kinetics of the enzyme-substrate compounds of catalase. J. Biol. Chem. 1952, 194, 471–481. [Google Scholar]
- Góth, L. Heat and pH dependence of catalase. A comparative study. Acta Biol. Hung. 1987, 38, 279–285. [Google Scholar]
- Cantemir, A.R.; Raducan, A.; Puiu, M.; Oancea, D. Kinetics of thermal inactivation of catalase in the presence of additives. Process Biochem. 2013, 48, 471–477. [Google Scholar] [CrossRef]
- Aebi, H. Catalase in vitro. Methods Enzymol. 1984, 105, 121–126. [Google Scholar]
- Miłek, J. Estimation of the kinetic parameters for H2O2 enzymatic decomposition and for catalase deactivation. Braz. J. Chem. Eng. 2018, 35, 995–1004. [Google Scholar] [CrossRef]
- Santos, A.M.P.; Oliveira, M.G.; Maugeri, F. Modelling thermal stability and activity of free and immobilized enzymes as a novel tool for enzyme reactor design. Bioresour. Technol. 2007, 98, 3142–3148. [Google Scholar] [CrossRef] [PubMed]
- Castro, R.J.S.; Ohara, A.; Nishide, T.G.; Albernaz, J.R.M.; Soares, M.H.; Sato, H.H. A new approach for proteases production by Aspergillus niger based on the kinetic and thermodynamic parameters of the enzymes obtained. Biocatal. Agric. Biotechnol. 2015, 4, 199–207. [Google Scholar] [CrossRef]
- Beers, R.F.; Sizer, I.W. A spectrophotometric method for measuring the breakdown of hydrogen peroxide by catalase. J. Biol. Chem. 1952, 195, 133–140. [Google Scholar] [PubMed]


© 2020 by the author. Licensee MDPI, Basel, Switzerland. This article is an open access article distributed under the terms and conditions of the Creative Commons Attribution (CC BY) license (http://creativecommons.org/licenses/by/4.0/).