Article

Spatiotemporal Variation of Cold Eddies in the Upwelling Zone off Northeastern Taiwan Revealed by the Geostationary Satellite Imagery of Ocean Color and Sea Surface Temperature

by
Hsiao-Wei Chung
1 and
Cheng-Chien Liu
1,2,*
1
Global Earth Observation and Data Analysis Center, National Cheng-Kung University, Tainan 701, Taiwan
2
Department of Earth Sciences, National Cheng-Kung University, Tainan 701, Taiwan
*
Author to whom correspondence should be addressed.
Sustainability 2019, 11(24), 6979; https://doi.org/10.3390/su11246979
Submission received: 1 October 2019 / Revised: 28 November 2019 / Accepted: 2 December 2019 / Published: 6 December 2019

Abstract

:
The upwelling zone off northeastern Taiwan (UZONT) is one of the hot spots with mesoscale ocean eddies (MOEs) and eddy-induced transports in the north Pacific Ocean. We start from the temporal and spatial variations in MOEs in the UZONT, based on the Himawari-8 SST product and the GOCI chlorophyll-a product time series, respectively. Their relationship with three major factors, including the Kuroshio, typhoon, and El Niño/La Niña events, are then investigated. The spatiotemporal variations in MOEs serve as ideal indicators by which to understand the influences on the UZONT due to interannual environmental factors and climate change.

1. Introduction

Mesoscale ocean eddies (MOEs) range in diameter from 10 to 500 km and can persist for periods of days to months [1]. They are characterized by currents that flow in a roughly circular motion and transport anomalously warm or cold water as they move. The emergence of MOEs modifies the direction of sea surface transportation in their vicinity, such as the dynamic distribution of organic, inorganic, and pollutent materials originating from terrestrial materials [2,3]. They are also one of the mechanisms leading to vertical movement in the ocean. Many studies have been conducted in the past demonstrating the important influences of MOEs on marine biology [4], physics [5], chemistry [6], and geology [7]. For example, MOEs change the sea surface temperature (SST) [8], modulate the amount of air-sea flux [9,10], and play a significant role in local [11] or even regional [12] precipitation. Consequently, spatiotemporal variations in MOEs provide useful information for regional weather forecasting [13]. Also, cold MOEs typically pump up the nutrient-rich water from the subsurface of the ocean to the sea surface, nourish phytoplankton, reduce the amount of carbon dioxide in the atmosphere [14], and increase primary productivity [15,16]. Therefore, the frequency and distribution of cold MOEs is also an ideal, important index by which to search for fishery locations [17].
Traditional approaches used to track MOEs rely on point measurements collected from the buoy array, research vessels, or autonomous underwater vehicles. Such measurements include sea water temperature, chlorophyll-a, and currents, etc. However, these approaches are intrinsically limited in terms of both spatial and temporal resolutions. Spaceborne observations, by contrast, can provide two-dimensional synoptic viewing, high spatial resolution, and low-frequency time series over long periods, even in very isolated ocean locations. Since the successful mission of the Coastal Zone Color Scanner that took place from 1978 to 1986, spectral reflectances detected in the visible and near-infrared portion of the electromagnetic spectrum have been employed to provide the products of chlorophyll-a [18], total suspended sediment [19], color dissolved organic matter (CDOM), [20] and particle size distribution [21]. Together with the other sensors used to measure SST [22], sea surface wind [23], sea suface salinity [24], and sea current flow [25], remote sensing imagery acquired from space indeed makes it possible to study the ocean with a greatly enhanced spatiotemoporal resolution. The Geostationary Ocean Color Imager (GOCI), in operation since 2011 on board the Communication, Ocean, and Meteorological Satellite (COMS), and the Advanced Himawari Imager (AHI) onboard the Himawari-8 since 2015 achieved milestones that have advanced the quality of temporal resolution. The GOCI acquires eight images per day in eight spectral bands (six visible, two NIR), with a spatial resolution of approximately 500 m covering 2500 km × 2500 km of the Northwestern Pacific Ocean [26]. The AHI provides full disk observations every 10 min and images of Japan every 2.5 min in 16 spectral bands (six visible, two NIR), with spatial resolutions ranging from 500 m to 2 km covering the Asia-Pacific region. These two unpresedented datasets with high temporal resolutions have been applied to monitor temporal variability in coastal water turbidity [27,28], to study diurnal changes in harmful algal bloom [29,30], estimate ocean surface currents [31,32], and to evaluate the spatial scale of MOEs [33]. It should be noted that all GOCI and AHI data are made freely available for use. They make it possible to gain a better understanding of some long-term, large-scale, dynamic features of the Earth, and more particularly, spatiotemporal variations in MOEs.
The mechanism for and hot spots of MOEs have been attracting a lot of research interest for decades, such as works focused on the north Atlantic Ocean [34], the northwestern subtropical Pacific Ocean [35], the eastern South Pacific Ocean [36], the northern South China Sea [37], the western Mediterranean [38], the Arabian Sea [39], and the Luzon Strait [40], among others. Among all of the reported regions, the upwelling zone off northeastern Taiwan (UZONT) is one of the hot spots with eddy-induced transports in the north Pacific Ocean. With the amount of MOEs modulating on the interannual and decadal time scales, eddy-induced zonal transport is likely to fluctuate as well [41]. Because the MOEs in the UZONT originate from the Kuroshio impinging on the continental shelf [42], the intrusion and meandering of the Kuroshio also fluctuate due to typhoons and El Niño/La Niña events, so spatiotemporal variations in MOEs serve as ideal indicators by which to understand the influences on the UZONT from interannual environmental factors and climate change. In this research, more than 24,000 GOCI images from 2011 to 2019 are collected and processed. All images are compiled in a web-based portal powered by the Open Access Satellite Image Service (OASIS, http://oasis.ncku.edu.tw/goci/), which facilitates the screening of the study area and identification of the MOEs in the UZONT. The standard product of chlorophyll-a consentrations is produced and analyzed using the GOCI Data Processing System (GDPS) released by the Korea Ocean Satellite Center (KOSC). Together with the SST Himawari-8 imagery time series with a high temporal resolution (10 min) collected from 2015 to 2019, we investigate the influences of the Kuroshio, typhoons, and El Niño/La Niña events on spatiotemporal variations of MOEs in the UZONT.
The results indicate that MOEs are frequently found in the UZONT during the summer and autumn, rather than in the winter and spring. The general size of the patches with higher chlorophyll-a concentrations in the UZONT is around 50 km, yet a large bloom with an extraordinarily size of 100 km can be found in some exceptional cases. In the case of MOEs found after the pass of a major tyhoon, the typhoon-triggered phytoplankton bloom in the river plume gradually expands and merges with the cold dome. This is therefore posited to be the main influence of a typhoon on MOEs in the UZONT. Although only one El Niño and one La Niña event have been observed by Himawari-8 thus far, the results suggest that the La Niña event provides favorable conditions for the Kuroshio current to flow along the edge of the China Continental Shelf and the development of an eddy structure. More observations are required to clarify the detailed relationship between El Niño and La Niña events and the MOEs in the UZONT. Spatiotemporal variations in MOEs serve as ideal indicators by which to understand the influences on the UZONT due to interannual environmental factors and climate change.

2. Materials and Methods

2.1. Study Area: The Upwelling Zone off Northeastern Taiwan

Taiwan is located in the center of the East-Asian island arc formed by the slow collision of the Asian continental plate and the Philippine plate. The basin topography of the UZONT is therefore rather complicated and comprises the China Continental Shelf, the Okinawa Trough [43], the Ryukyu Arc, and the Volcanic Islands. As illustrated in Figure 1a, three major current systems, including the Kuroshio Current, the China Coastal Current and the Taiwan Strait Warm Current [44], all flow through this region and interact with the complicated basin topography. As a result, a few branches of the current have developed and have induced upwelling currents. In some cases, the MOEs may be found and persist for a long period of time. Taking the geostrophic, tidal, and seasonal effects into consideration, the spatiotemporal variations in MOEs are even more complicated.
The mechanism by which MOEs form in the UZONT was described in the pioneering work of Tang et al. [42] using hydrographic observations and current measurements taken with a shipboard acoustic doppler current profiler. The mechanism is mainly related to the seasonal oscillation of the Kuroshio axis and its impingement on the continental shelf. The Kuroshio axis is drawn away from Taiwan in the summer. After flowing across the Ilan ridge, the northward current turns northeast and impinges on the China Continental Shelf near the Diaoyu Islands. As a result, three branches of the currents are divided from the main Kuroshio current, as illustrated in Figure 1b. The first branch continues to flow northeast toward Japan along the edge of the China Continental Shelf. The second branch moves to the north and enters the shelf where the water is shallower. It gradually turns toward the east and eventually rejoins the first branch to go to Japan. The third branch flows along the edge of the China Continental Shelf in a southwestern direction. This counterclockwise flow becomes an eddy structure, pumps up the cold, nutrient-rich water from the subsurface to the sea surface, and triggers the regional bloom of phytoplankton. This shed eddy spreads across the UZONT and exhibits a clear ocean color signature with a diameter that ranges from tens to a hundred kilometers that can be detected from space. In winter, by contrast, the Kuroshio axis moves much closer to Taiwan. After flowing across the Ilan Ridge, the northward current soon enters a small basin off of northeastern Taiwan. Under this circumstance, it seldom develops into an eddy structure in the winter. The spatiotemporal characteristics of remote sensing imagery, particularly the abundant GOCI and Himawari-8 images in their datasets, are ideal to gain a better understanding of some of the long-term, large-scale, dynamic features of MOEs in the UZONT.

2.2. Satellite Observations

To observe MOEs from space, the hot/cold patch of SST and the high/low core of the sea surface height (SSH) are two apparent features that can be measured remotely. Among various SST sensors, such as its former version: the Multifunction Transport Satellite (MTSAT) [45], the AHI onboard Himawari-8 is superior as compared to other sensors in terms of both spectral and spatial resolution. Table 1 lists the wavelength, spatial resolution [46], and primary use of longwave AHI channels (Band 7–16).
Note that another unprecedented advantage of AHI/Himawari-8 is its temporal resolution and the fact that a full disk of observations at the center of the Pacific Ocean (0° N, 140.7° E) can be made every ten minutes. Apart from the standard products, including clouds, the atmosphere, and the SST, tracking features/objects from the Himawari-8 imagery time series provides other crucial information related to dynamic changes. In this work, the SST products from Himawari-8 imagery are employed to track MOEs in the UZONT. As for the SSH, even though the measurements made from satellite altimetry can achieve accuracy within a few centimeters or less, the narrow swath of the satellites (e.g., 5.1 km for Jason-3) and long revisit period (e.g., 10 day for Jason-3) limit their ability to track and study applications related to MOEs in the UZONT. Note that the MOEs in the UZONT are patches with cold SST and high SSH that usually come with nutrient-rich waters from the subsurface of the ocean. After a short lag, the regional blooms of phytoplankton can be clearly observed from the satellite ocean color imagery of such patches. Therefore, detecting these patches of phytoplankton provides an indirect way to identify MOEs in the UZONT.
Lifting up from a Sun-synchronous orbit (several hundred kilometers) to a geosynchronous orbit (35,786 km), the successful launch in 2010 and continued operation of GOCI has not only increased the temporal resolution from a few days to every hour, eight hours per day, but the spatial resolution has been enhanced to 500 m [33], compared to the widely used SeaWiFS, MODIS, or MERIS data. A map of the GOCI coverage is shown in Figure 1 [49], which covers an area of 2500 km × 2500 km centered at 36° N/130° E that includes the Bohai Sea, Yellow Sea, East China Sea, Japan/East Sea, and part of the South China Sea. With a clear mission statement for detecting, monitoring, and predicting short-term biophysical phenomena as well as noxious/toxic and extensive algal blooms, GOCI provides an unprecedented set of ocean color observations that makes it possible to provide improved marine fishery information to fishing communities and benefits related to coastal zone and resource management. The spectral characteristics of GOCI are listed in Table 2. The real-time GOCI Data Processing System (GDPS) was developed by the Korea Ocean Satellite Centre (KOSC) with the primary mission of calculating the Level-1B total radiance product at the top of the atmosphere on an hourly basis by applying standard radiometric and geometric corrections to every compressed GOCI raw file. The Level-1B product results are used as input data for the interactive GDPS that allows users to generate higher level products, such as the normalized water-leaving radiance Lw, chlorophyll-a, colored dissolved organic matter, total suspended sediments, and the Rayleigh corrected reflectance [33]. In this research, the standard product of chlorophyll-a is used to identify the MOEs in the UZONT.

2.3. Data Processing

The standard Himawari-8 SST products are downloaded from the JAXA Himawari Monitor P-Tree system (https://www.eorc.jaxa.jp/ptree/index.html) at its highest temporal resolution (every ten minutes), while the standard GOCI products of chlorophyll-a are downloaded from KOSC (http://kosc.kiost.ac.kr/eng/) at its highest temporal resolution (every hour, eight hours per day). A rectangular region of interest (ROI) (24° N–27.5° N, 119° E–124° E) is specified to cover UZONT, the China coastal current, the Taiwan coastal current, and the Kuroshio current, as shown as the white box in Figure 1a. To investigate the relationship between spatiotemporal variations in the MOEs in the UZONT and other various factors, the Himawari-8 SST data is averaged at intervals of 10 min, as well as for the hour, day, month, and season. It should be noted that only those pixels with valid values are taken into consideration when averaging.

3. Results and Discussion

We start from the temporal and spatial variations in MOEs in the UZONT, revealed from the Himawari-8 SST product and the GOCI chlorophyll-a product, respectively. Their relationship with three major factors (the Kuroshio, typhoon, and El Niño/La Niña events) are then investigated.

3.1. Temporal Variation

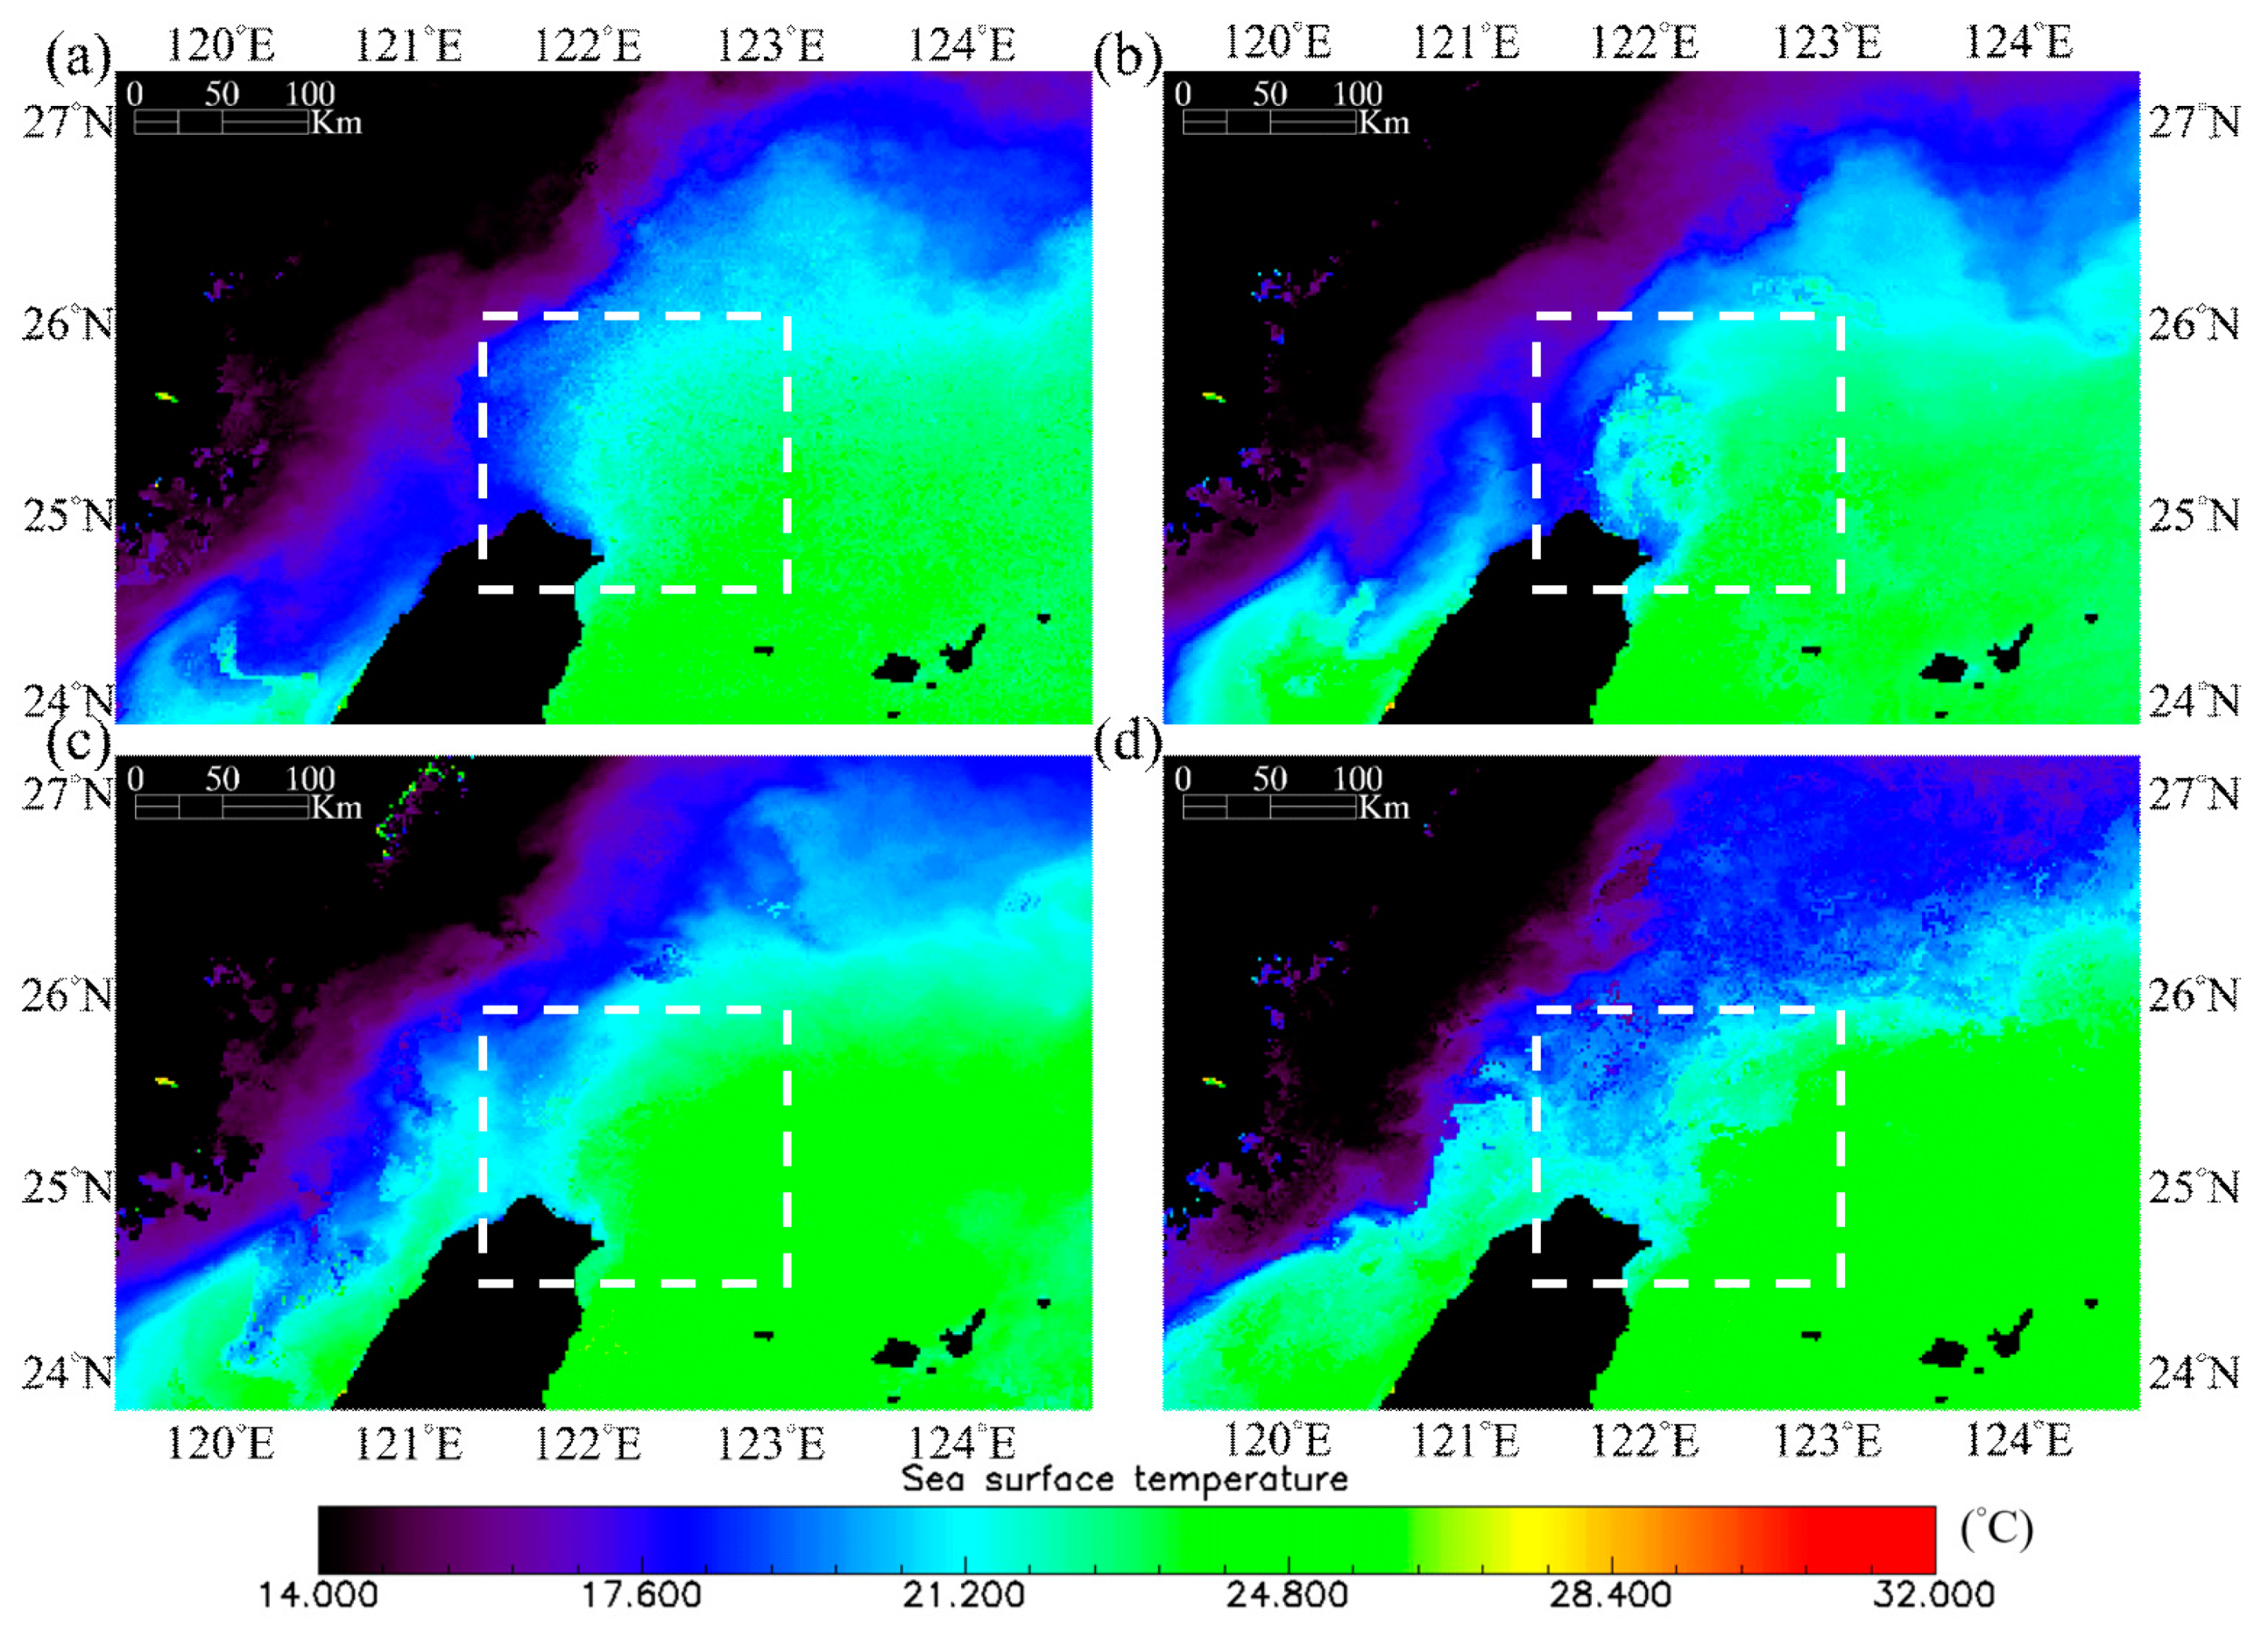
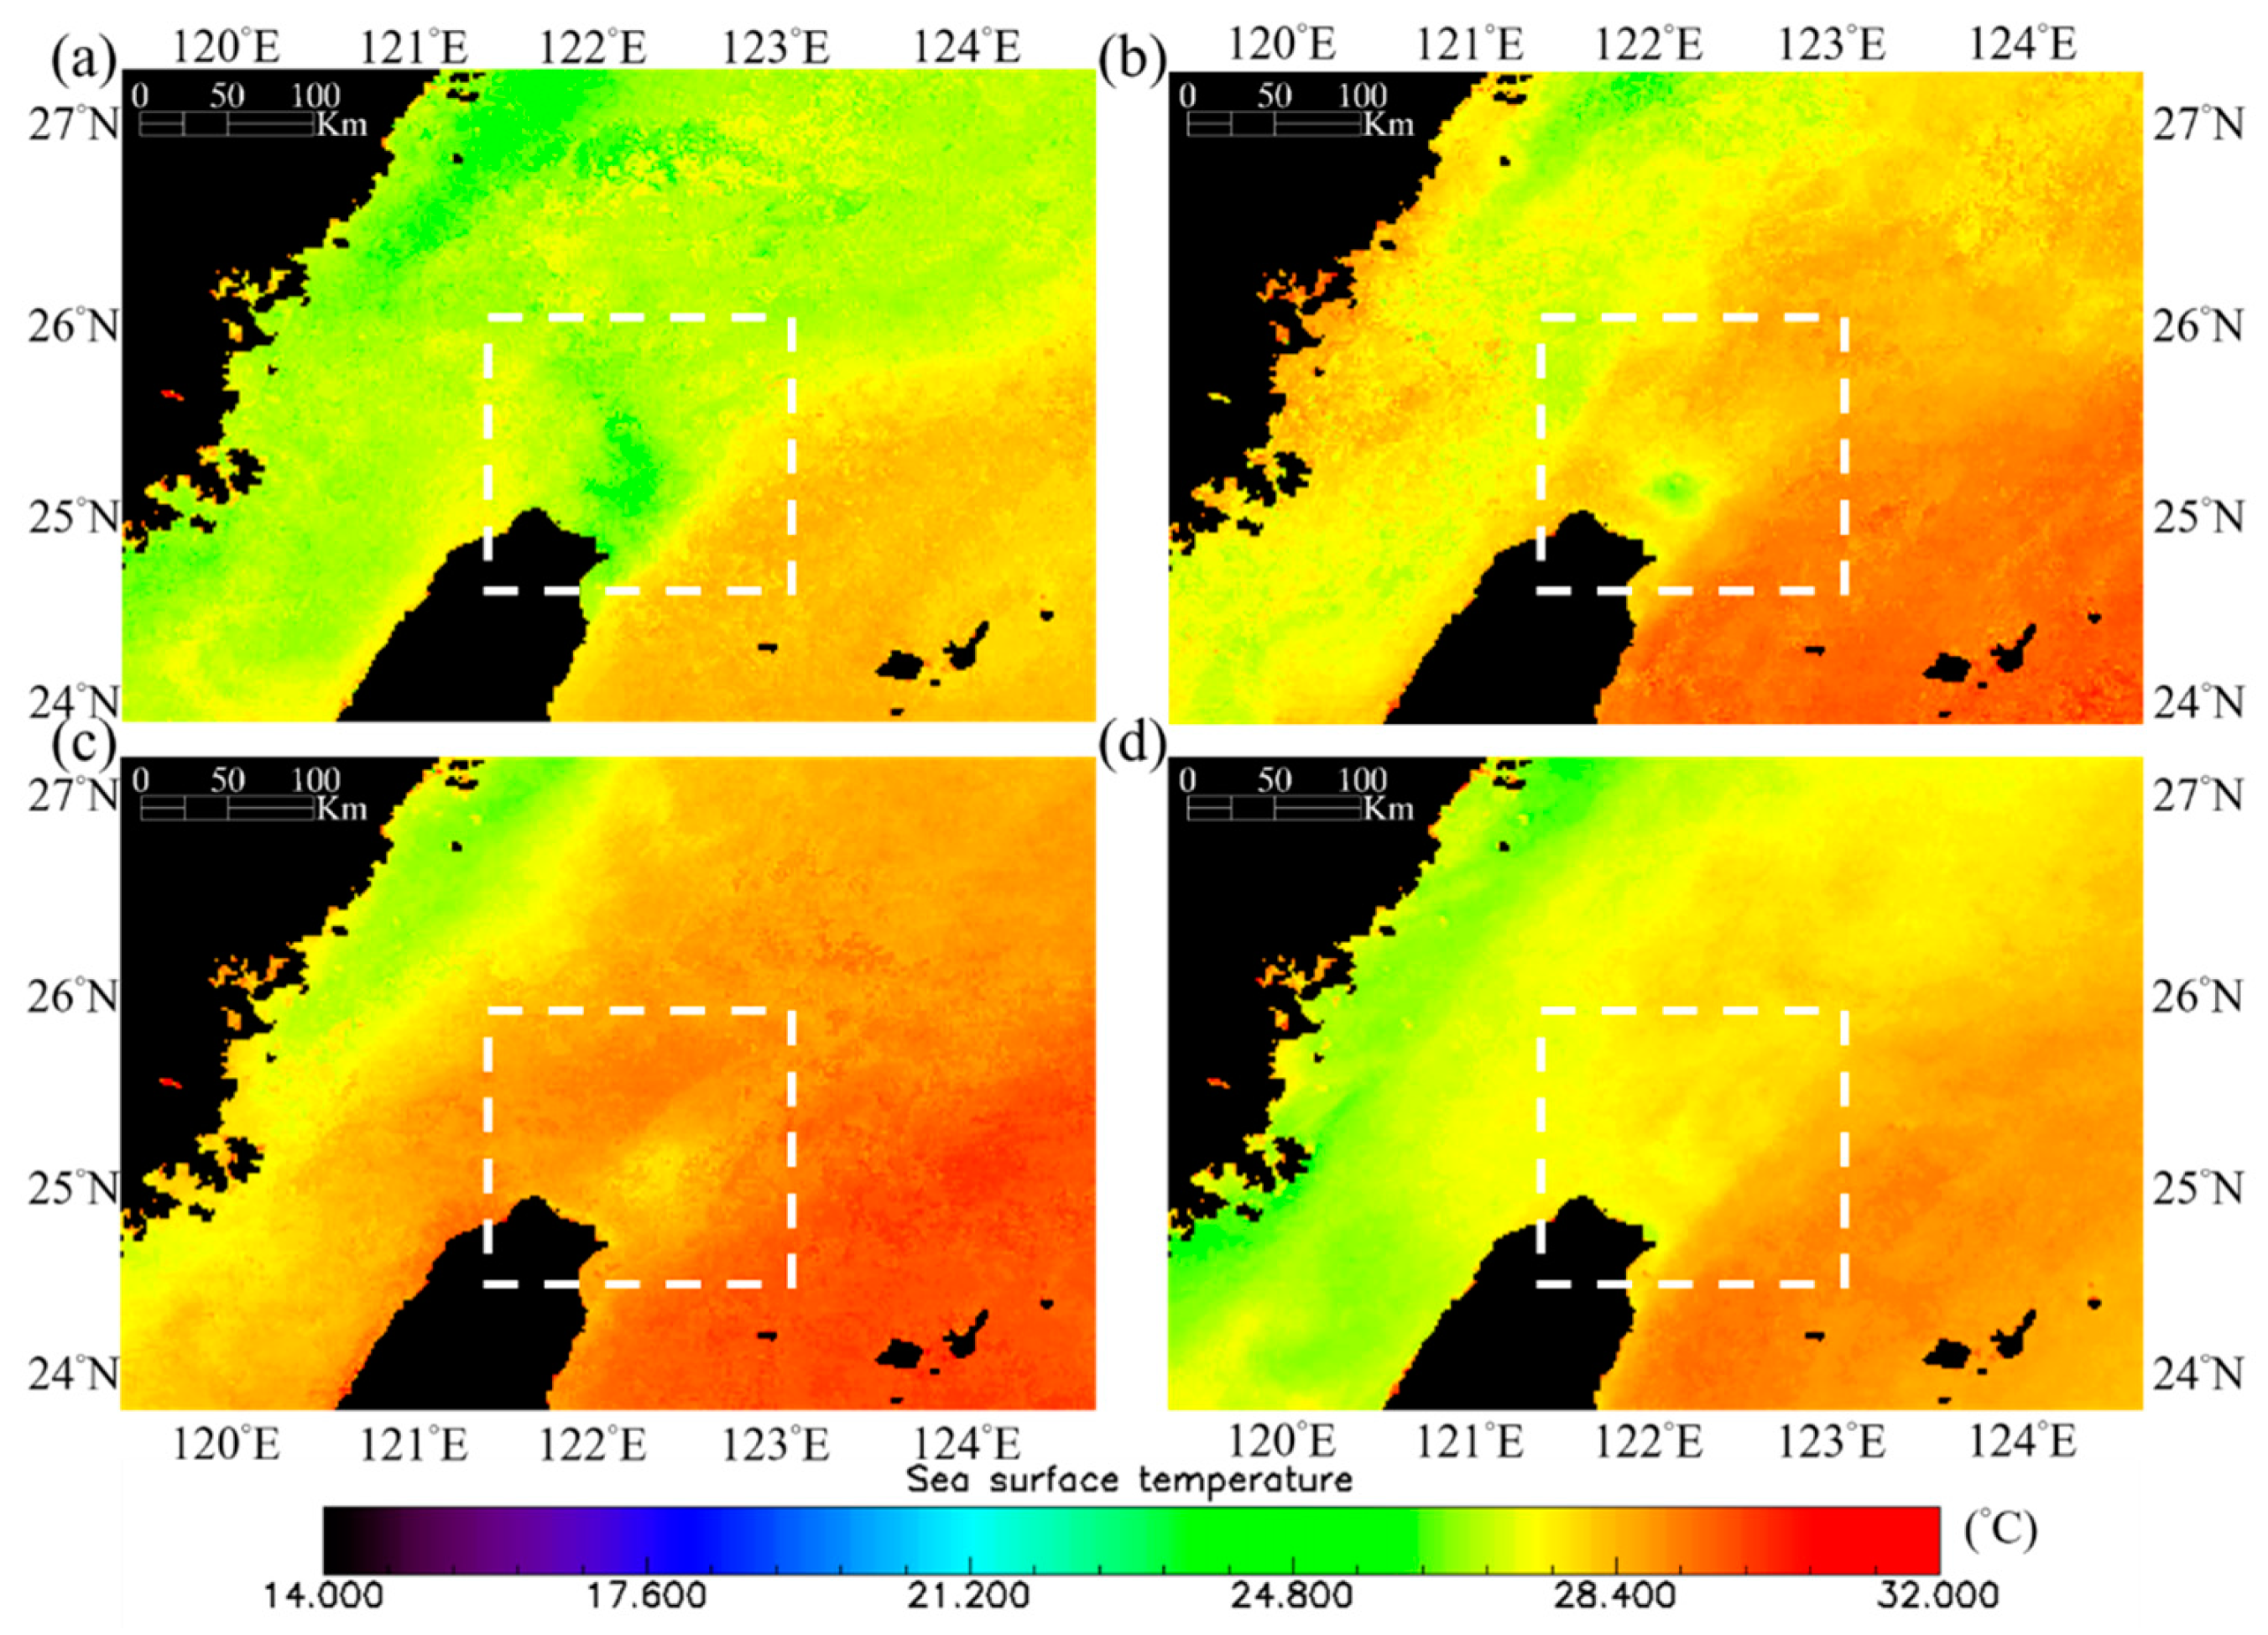
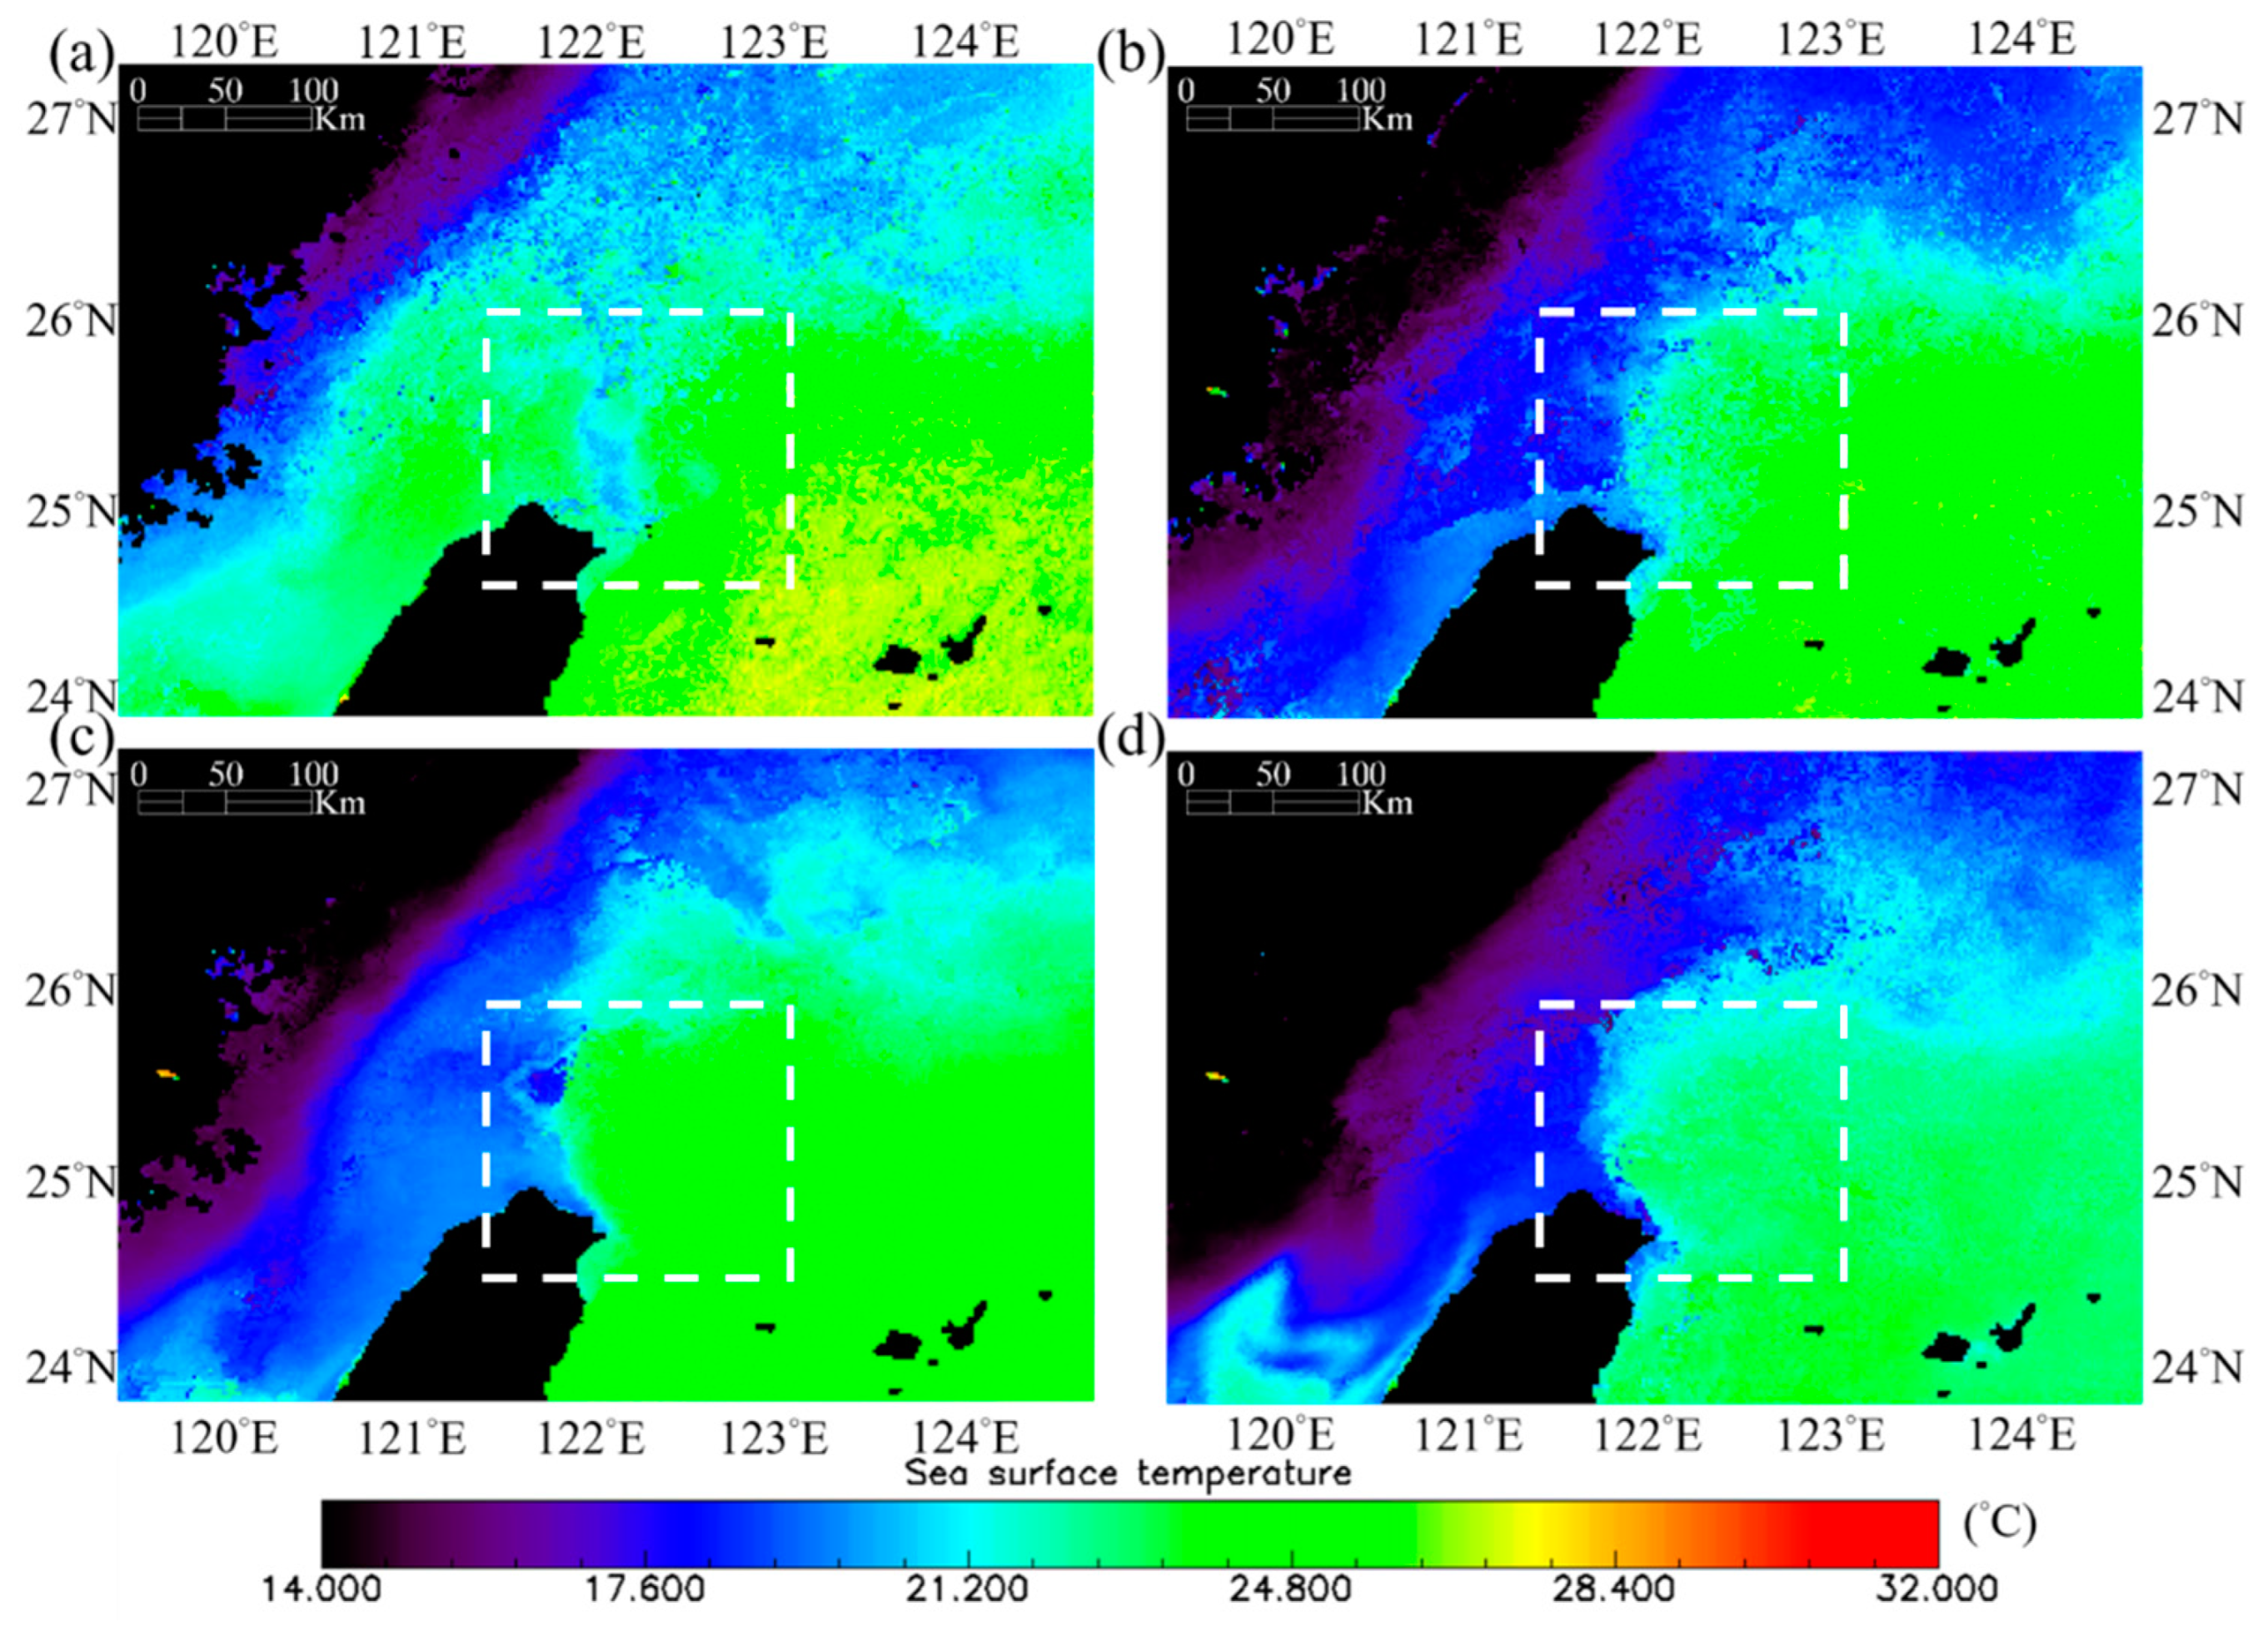
All Himawari-8 SST imagery taken from July 2015 to August 2019 are processed, and their seasonal averages in the UZONT are shown in Figure 2 (spring: March to May), Figure 3 (summer: June to August), Figure 4 (autumn: September to November) and Figure 5 (winter: December to February).
A patch of cold water is indeed found in the UZONT during summer and autumn. Note that the boundary of the cold-water patch is clear in 2015, 2016, and 2017, yet weak in 2018 and 2019, suggesting that another factor might cause the annual variations. The location of cold-water patch matches well with the hydrographic observations and current measurements made by Tang et al. [50]. They proposed that cold, nutrient-rich water is pumped up from the subsurface of the ocean to the sea surface by an eddy structure evolved from a counterclockwise flow of one Kuroshio branch, the cold dome. If the Kuroshio axis moves too close to Taiwan, the northward current will enter a small basin in the UZONT and will not develop into an eddy structure. The distance of the Kuroshio axis to Taiwan, therefore, plays a crucial role in the shedding of cold domes in the UZONT.
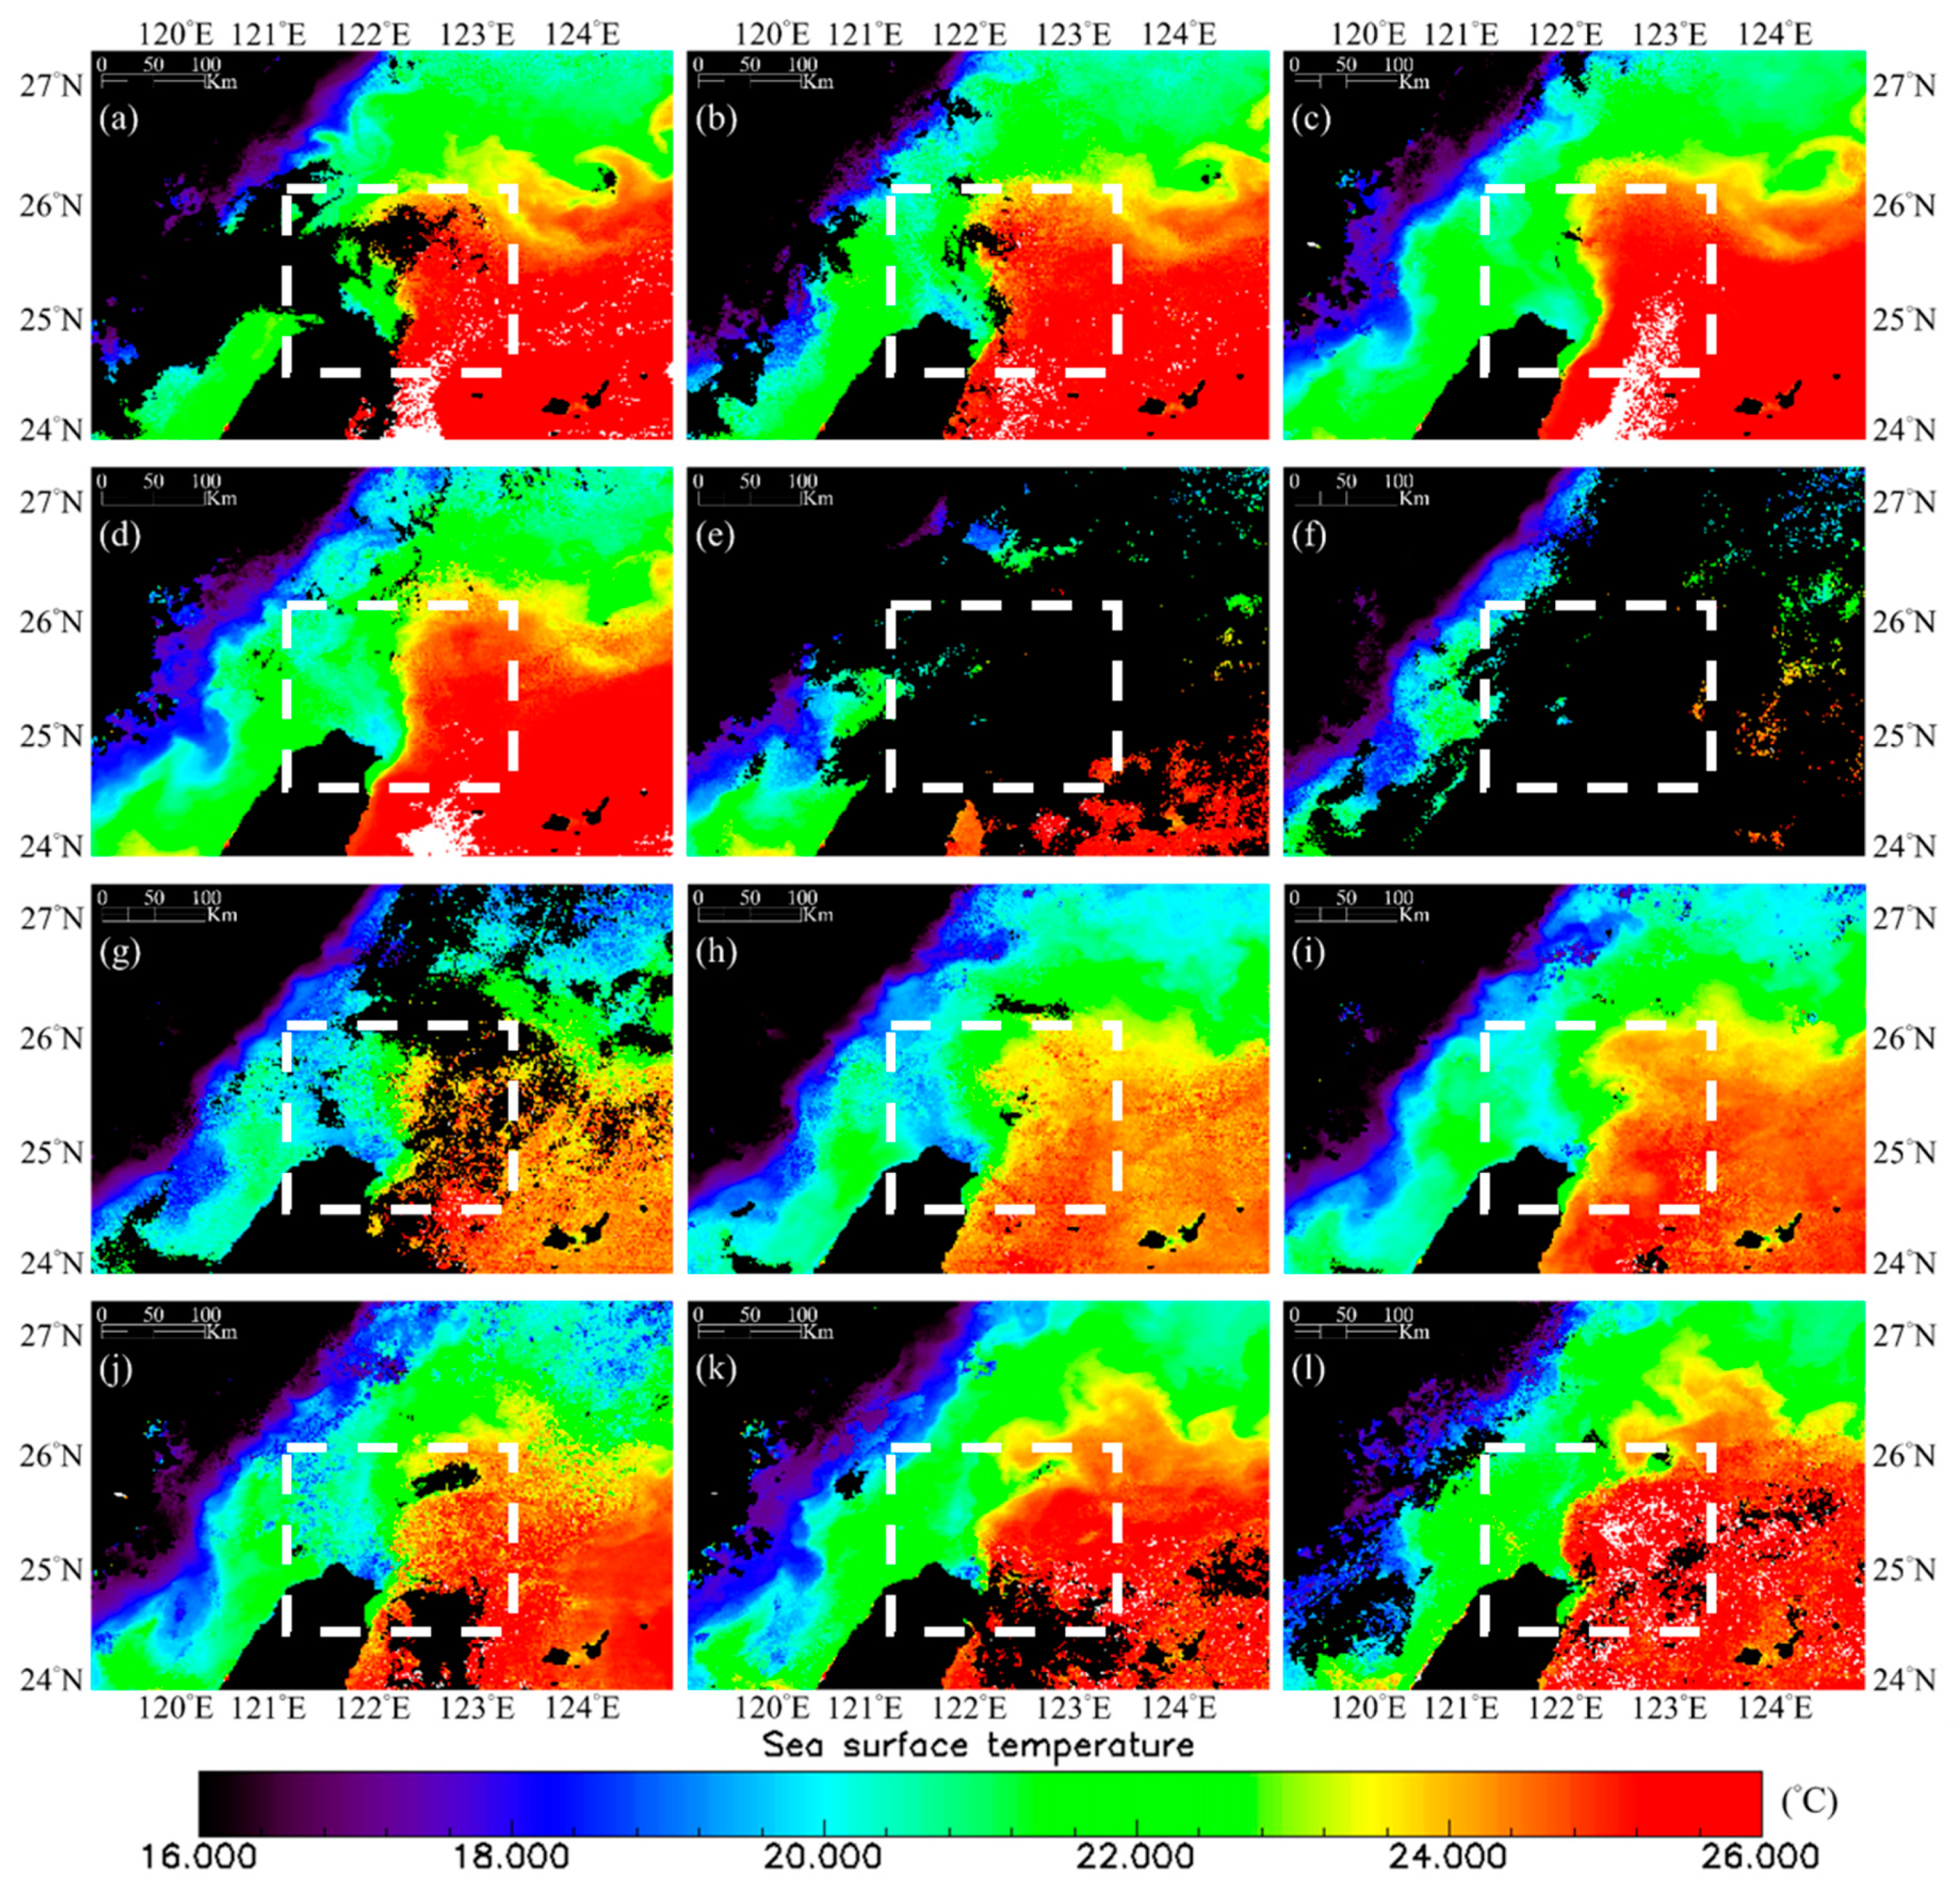
According to the numerical simulations made by Wu et al. [51], upwelling in the UZONT lasts approximately 12 days in the summer and 6 days in the winter. Therefore, the actual date when the cold dome emerges and the period during which the cold dome lasts cannot be seen or identified from the seasonal composites. The daily averages of Himawari-8 SST data in the UZONT, by contrast, provide more detailed information related to cold domes, such as the example given in Figure 6. From the 10th to the 21th of December 2016, one large cold dome persisted at least ten days in the UZONT, even though there was no observation made on the 14th and the 15th of December when the sky was overcast with clouds. This set of SST images indicates that the cold dome still can be found in the UZONT when the warmer Kuroshio current dominates in this region in winter [52].
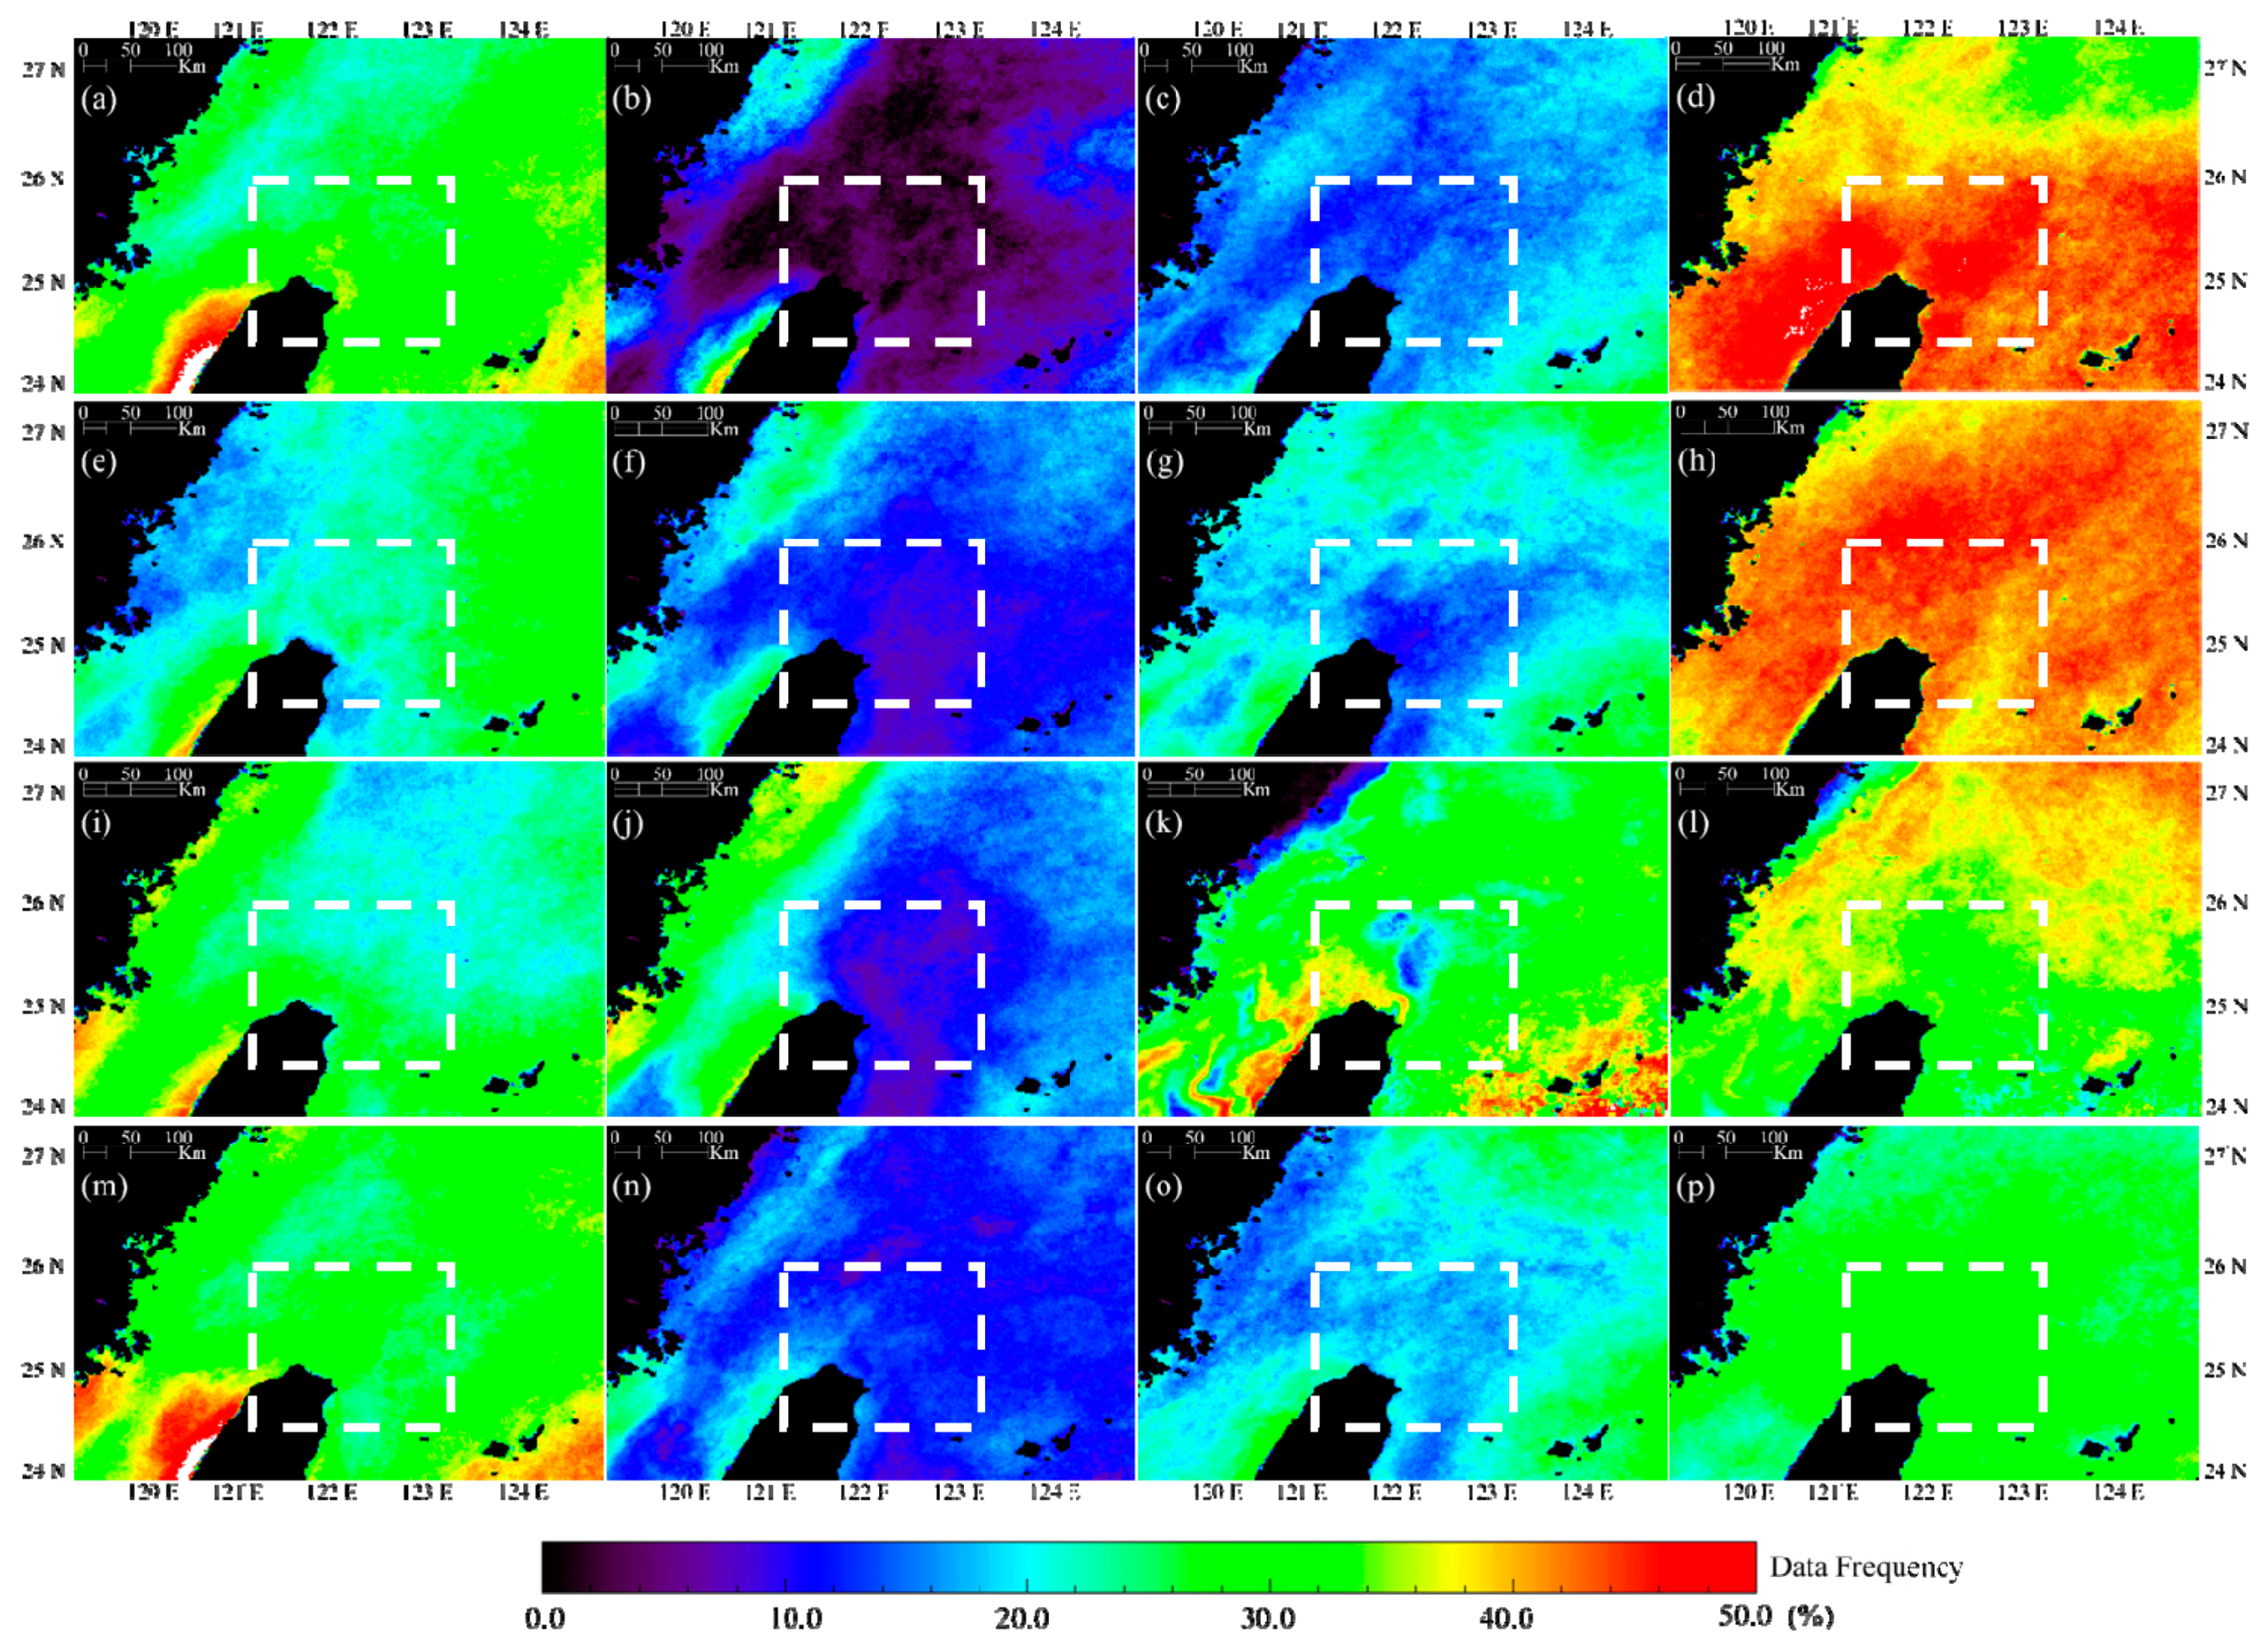
Note that the available Himawari-8 SST data were acquired from July 2015 to August 2019, the seasonal averages for spring (March to May) and summer (June to August) were calculated from 2016 to 2019; while autumn (September to November) and winter (December to February) were calculated from 2015 to 2018. Another issue is that the observation frequency varies in different seasons. To clarify this influence, the maps of observation frequency of Himawari-8 SST data in the UZONT are calculated at each pixel as the percentage of cloudless days and observed days during each season from autumn 2015 to summer 2019, as shown in Figure 7. The results show that the percentage of cloudless days and observed days in the region of interest are generally higher during the summer and autumn, yet lower during the winter and spring. Nevertheless, our results indicating more upwelling are found during the summer and autumn rather than during the winter and spring, which concurs with the results reported in all earlier studies on this topic.

3.2. Spatial Variations

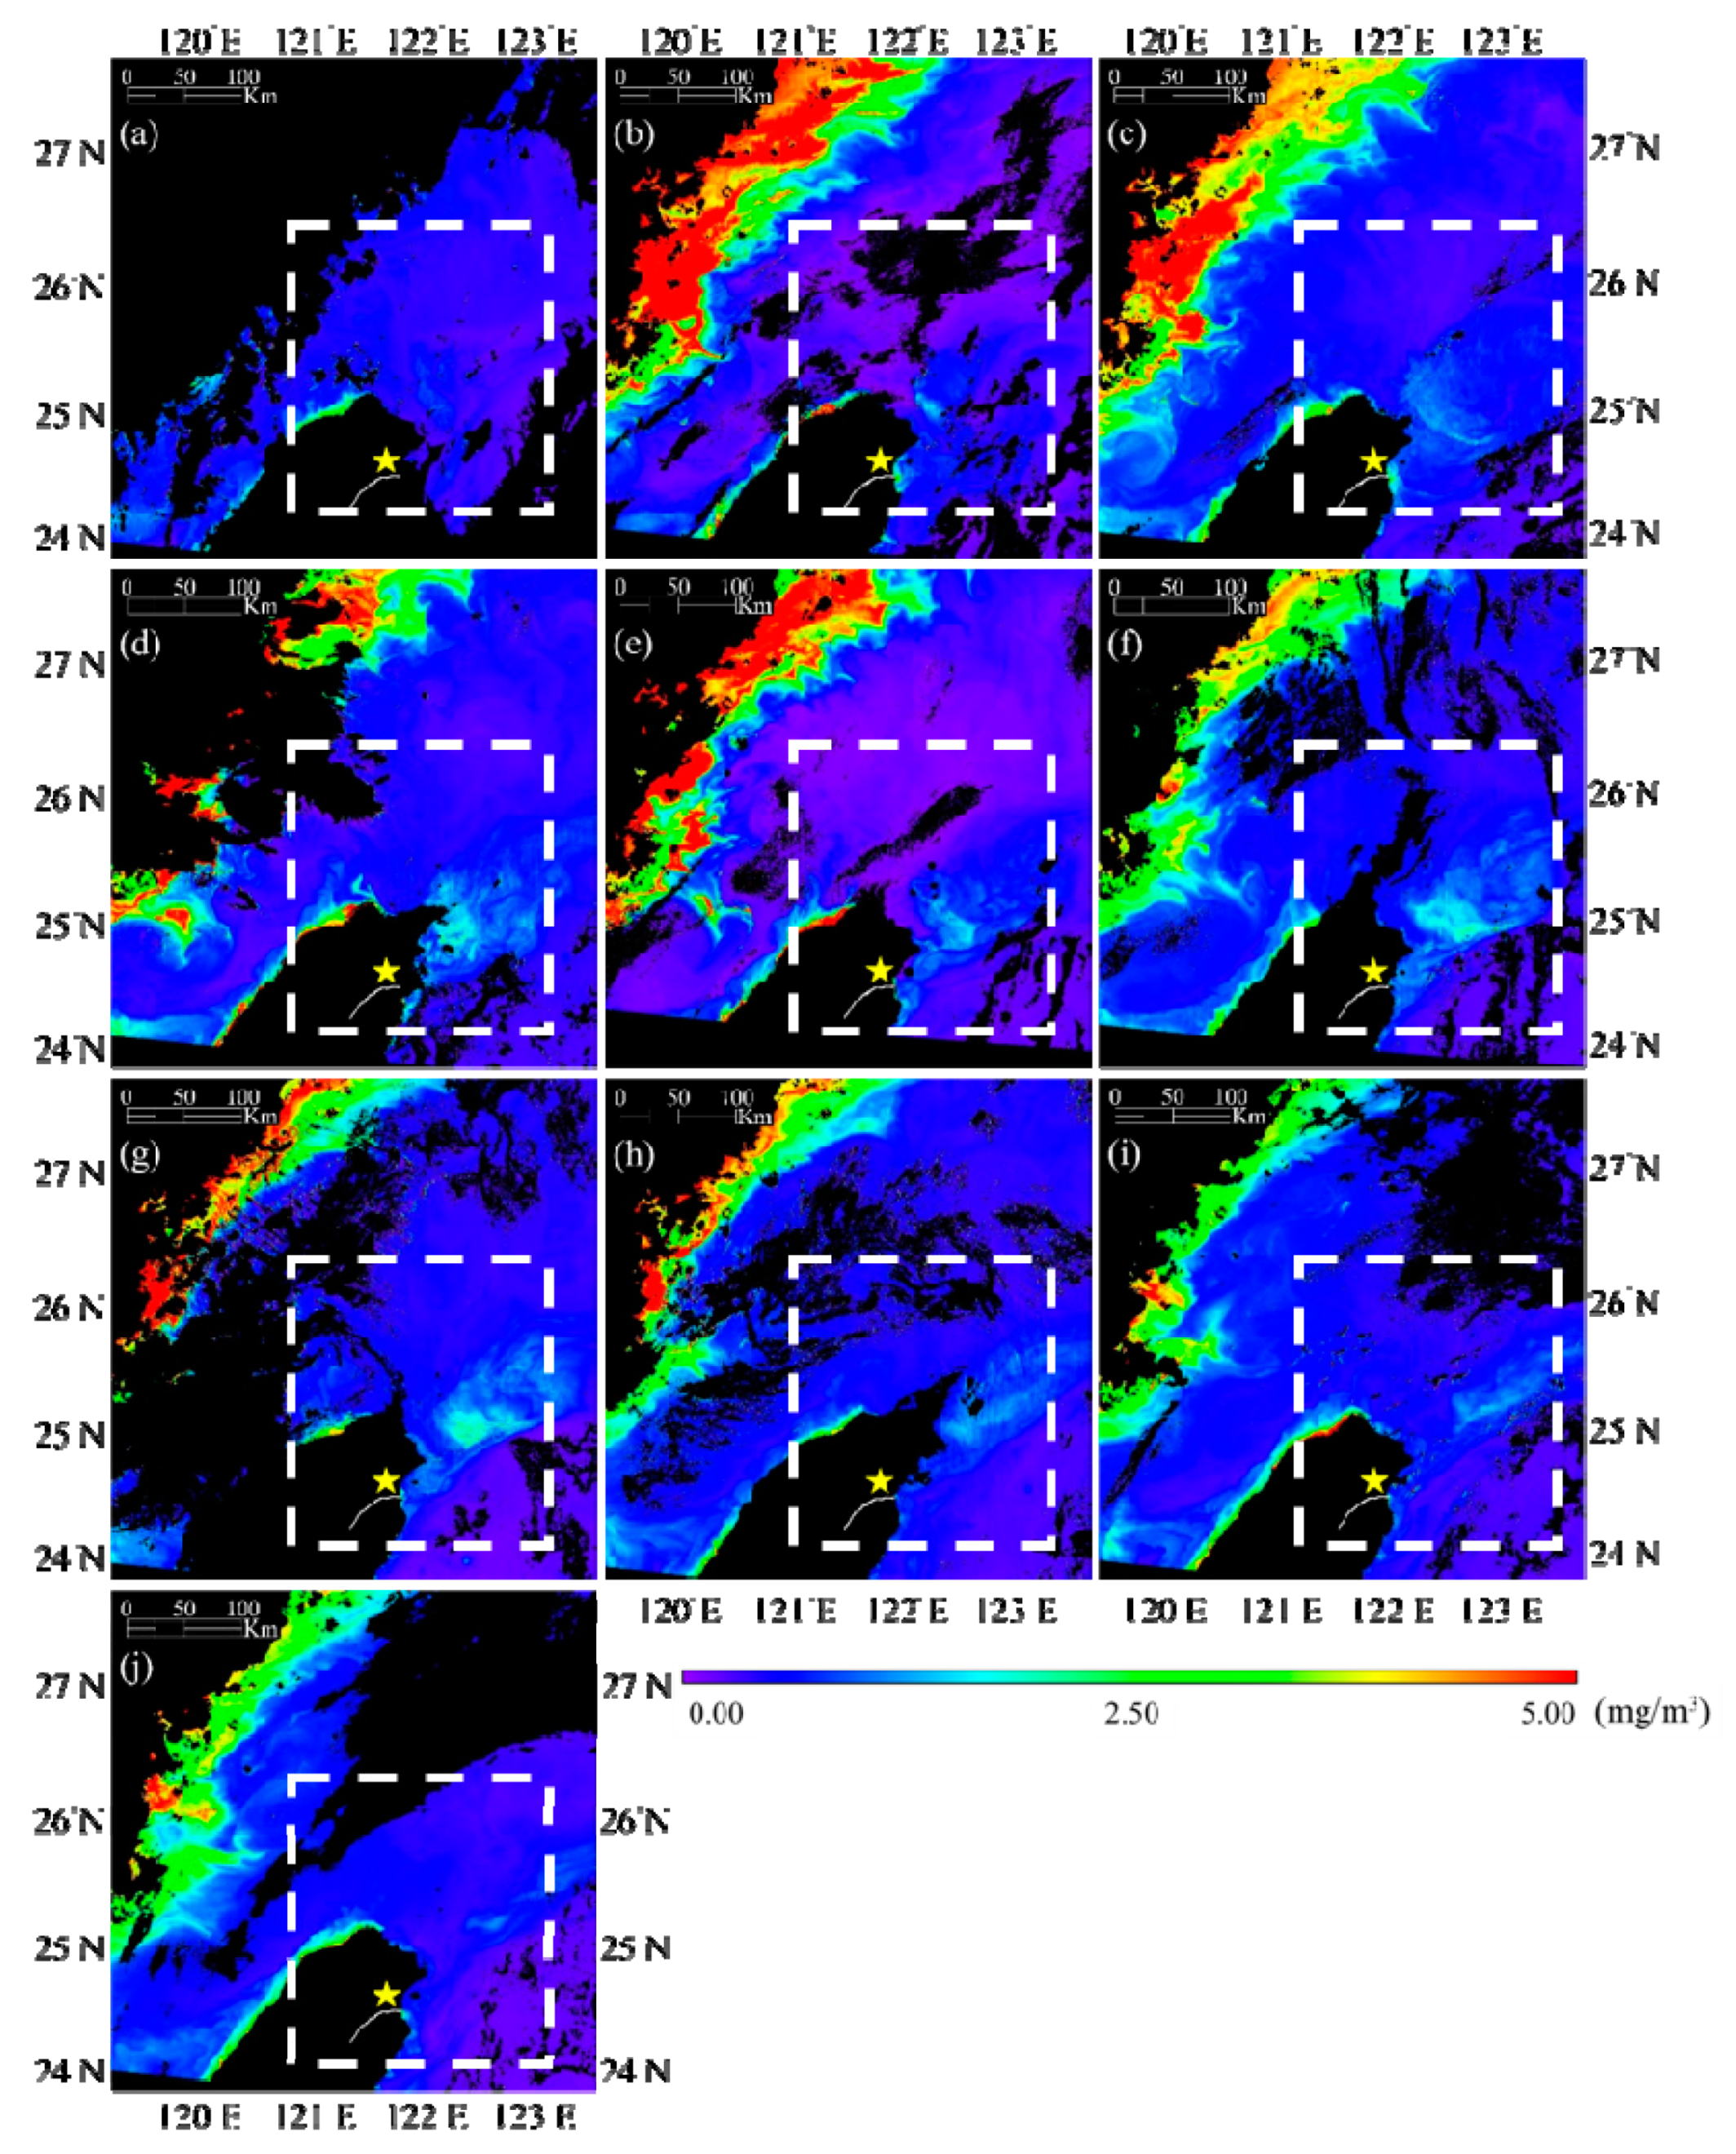
The cold dome in the UZONT is a patch of cold, nutrient-rich water pumped up from the subsurface of the ocean, which usually triggers a regional bloom of phytoplankton. Therefore, satellite ocean color imagery provides an indirect way to map the coverage of cold domes. From the full archive of GOCI imagery collected from 2011 to 2019, the general size of the patches with higher chlorophyll-a concentrations in the UZONT was around 50 km. In some cases, an extraordinarily large bloom can be found in this region as well, such as the case of a large ellipsoid with a long axis of 100 km detected from the GOCI image taken at 8:16 on 3 August 2015 (Figure 8a). After carefully examining the coverage of the bloom, the water with higher chlorophyll-a was found to be extended to the Lanyang River mouth. Thanks to the high temporal resolution of the GOCI imagery, the series of images taken from 8:16 (Figure 8a) to 15:16 (Figure 8h) confirms that the bloom is indeed mixed with the Lanyang River plume. This suggests that the terrestrial materials transported to the Lanyang River plume can be enhanced and diverted by the emergence of cold domes. In this case, the movement of the Lanyang River plume turns from the north-west to the north-east and eventually merges into the Kuroshio current.
Yin and Huang [53] have also pointed out the difficulty associated with using only a few observations to identify whether the cold dome in the UZONT is formed purely by the local upwelling flow or is a mixture of China and/or Taiwan coastal currents. They suggested that, judging from the time series of observations of the cold domes formed purely by the local upwelling flow, they exhibit an enhancing stage followed by a decaying stage. Cold domes mixed with China’s and/or Taiwan’s coastal currents exhibit only the decaying stage. We examined and plotted the time series for the GOCI chlorophyll-a data collected at the same time (Figure 9) as the Himawari-8 SST data (18–28 July 2016) time series presented in Figure 2 from Yin and Huang [53] and compared them. Although optical observation from space is typically blocked by clouds, the GOCI operating in a geostationary orbit can make eight observations every day and collect more valid images. The results show that the cold dome in the UZONT indeed exhibited an enhancing stage followed by a decaying stage from the 18th of July to the 3rd of August 2016. However, this cold dome was not formed purely by the local upwelling flow. According to the map of the GOCI chlorophyll-a collected from the 22nd of July to the 25th of July 2016 (Figure 9d–g), this cold dome was indeed mixed with the Lanyang River plume.

3.3. Influence from Kuroshio

As mentioned earlier, the mechanism of the MOEs in the UZONT were first described by the pioneering work of Tang et al. [42]. They attributed the shedding of cold domes to the seasonal oscillation of the Kuroshio axis and its impingement on the continental shelf. Analogous to the Gulf Stream in the North Atlantic, the Kuroshio Current is part of the North Pacific Ocean gyre that begins off the east coast of Luzon, Philippines and Taiwan and flows in a north-eastward direction past Japan [54,55]. It is a north-flowing ocean current that transports heat and organic matter on the west side of the North Pacific Ocean and eventually merges with the easterly drift of the North Pacific Current. Therefore, the Kuroshio current plays a significant role in transporting and exchanging of heat and organic matter in the East China Sea and the northern part of the South China Sea [56,57,58]. For example, a strong mixing of the Kuroshio current and coastal waters has been reported in the China Continental Shelf of the East China Sea where the water is deeper than 50 m [59].
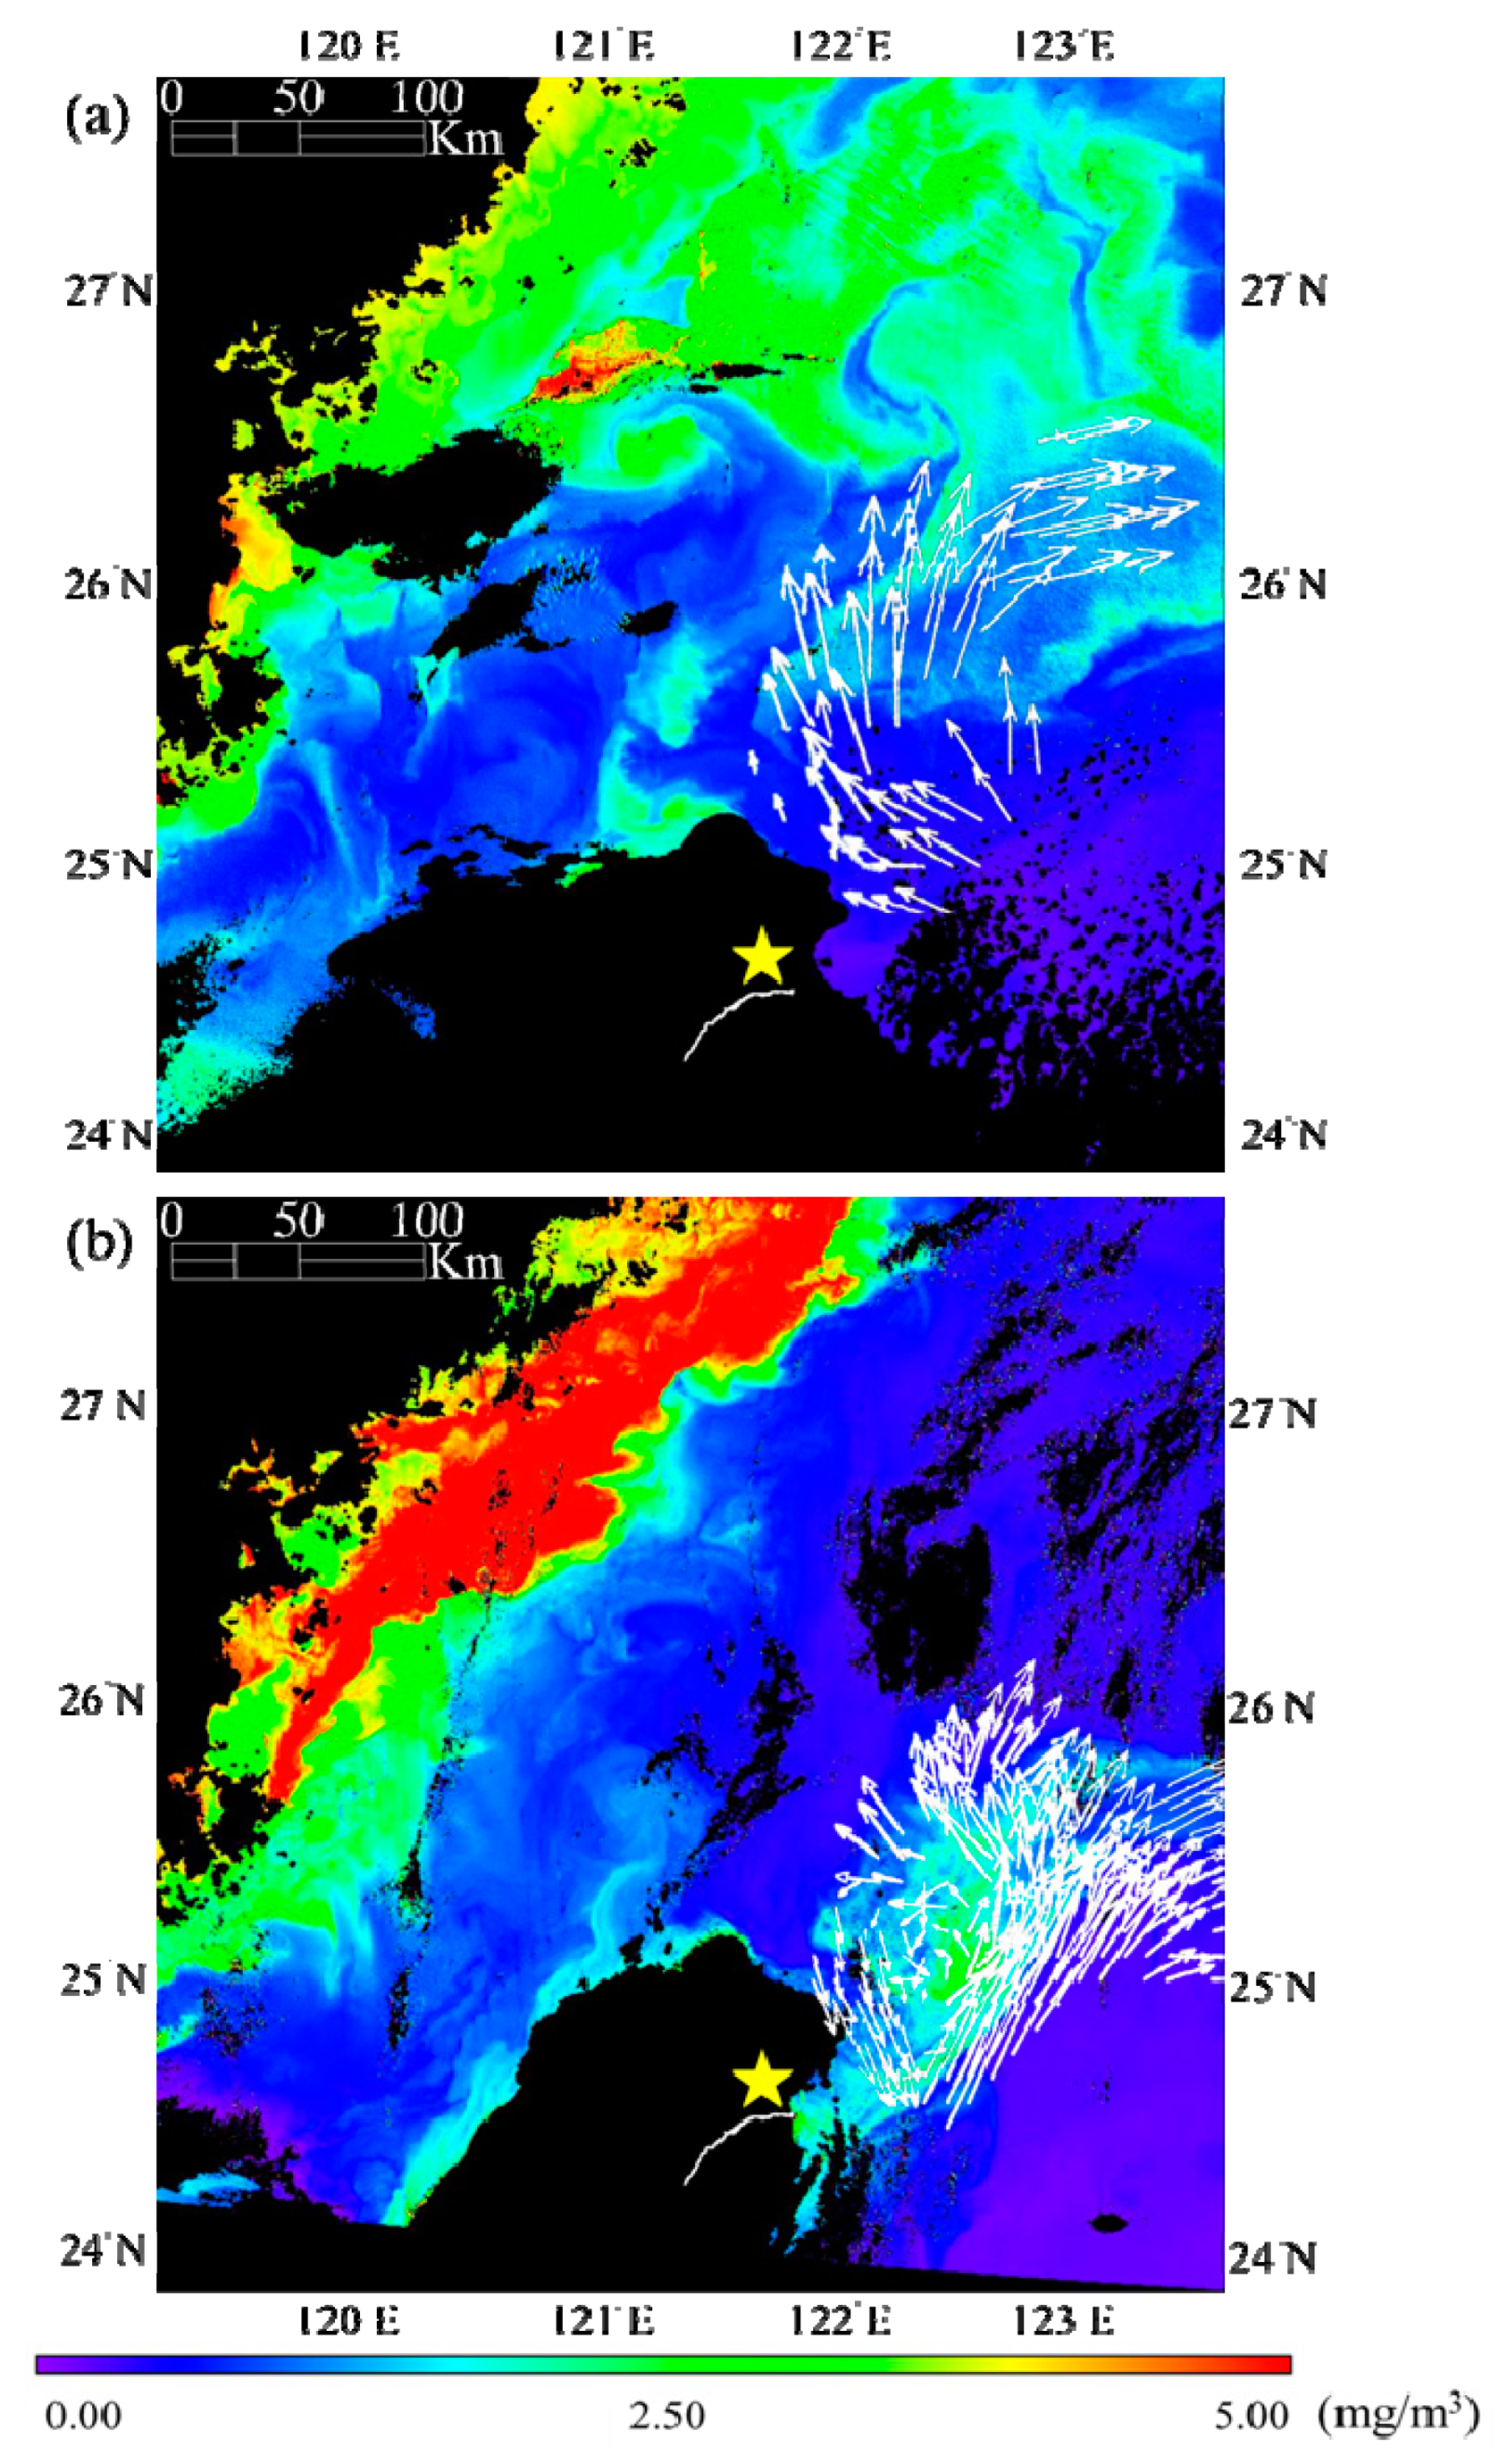
To verify the relationship between the seasonal oscillation of the Kuroshio axis and the MOEs in the UZONT, we overlay the in situ velocity measurements made by Tang, Tai, and Yang [50] with the satellite observations in the winter and summer, respectively. Figure 10a shows the map of chlorophyll-a derived from the GOCI image taken at 10:16 on 25th March 2012 overlaid with the Sb-ADCP velocity measurements at a depth of 16m in the winter (white arrows) [42]. This is exactly the case of the second branch illustrated in Figure 1b, which moves in a northerly direction, enters the shelf where the water is shallower, and gradually turns toward the east. It is difficult for it to develop into an eddy structure in the winter, and there is no sign of phytoplankton bloom on the GOCI chlorophyll-a map either. Figure 10b shows the map of chlorophyll-a derived from the GOCI image taken at 13:16 on 26 July 2014 overlaid with the Sb-ADCP measurements of velocity at a depth of 16m in the summer (white arrows) [42]. This is the case of the third branch illustrated in Figure 1b, which flows along the edge of the China Continental Shelf but in a southwesterly direction. It does develop into an eddy structure, and there is clear signal of bloom that can be seen on the GOCI chlorophyll-a map.
The dynamics of the MOEs in the UZONT are revealed by the GOCI chlorophyll-a map time series collected from 8:16 on 26 July 2014 to 15:16 on 28 July 2014, as shown in Figure 11. Since most of the optical imagery acquired from space is typically contaminated by clouds, this is indeed a rare case of continuous observation for three days. Tracking this cold dome provides new insight into the evolution of the MOEs in the UZONT. Starting from 8:16 on 26 July 2014 (Figure 11a), a significant amount of chlorophyll-a was found to have originated from the Lanyang River mouth (Figure 11b–d), which gradually expanded to the northeast (Figure 11e,f), merged with the cold dome (Figure 11g,h), and covered the largest area during the three day observation period (Figure 11g). Later, starting at 8:16 on 27 July 2014 (Figure 11i), the source of chlorophyll-a from the Lanyang River mouth was gradually cut (Figure 11i–p), resulting in an isolated cold dome spinning alone in the UZONT on 28 July 2014 (Figure 11q–x).
To summarize, the relationship between the seasonal oscillation of the Kuroshio axis and the MOEs in the UZONT is verified by overlaying the in situ velocity measurements made by Tang, Tai, and Yang [50] with the GOCI chlorophyll-a maps in the winter and summer, respectively. The evolution of the MOEs in the UZONT is clarified using the GOCI chlorophyll-a map time series, which clearly shows the expansion and transportation of the Lanyang River plume to merge with the cold dome. This indicates a strong interaction and close correlation between the river plume and the cold dome in the UZONT, which has not been observed or discussed previously.

3.4. Influence of Typhoons

A typhoon is a tropical cyclone with a low-pressure center that pumps up the nutrient-rich water from the subsurface of the ocean to the sea surface along its passage. Depending on its intensity and duration, as well as the depth of the mixing layer it overpasses, a typhoon is also an important mechanism for boosting the short-term productivity of a river–sea system, such as the case reported in the Gaoping River, shelf, and canyon system off southwestern Taiwan [60]. Since the UZONT is also a region with frequent passage of typhoons, it is worthwhile to investigate the influence of typhoons on MOEs. Unfortunately, most typhoons are accompanied by rains and clouds that block satellite observations and limit the number of useful images. We searched the full archive of the GOCI imagery collected from 2011 to 2019 and compared the images with the time and paths of all typhoons in the UZONT. The chlorophyll-a map time series derived from the GOCI images taken on 16 July 2013 is another rare case of continuous observation that leads to an understanding the influence of typhoons on MOEs, as shown in Figure 12.
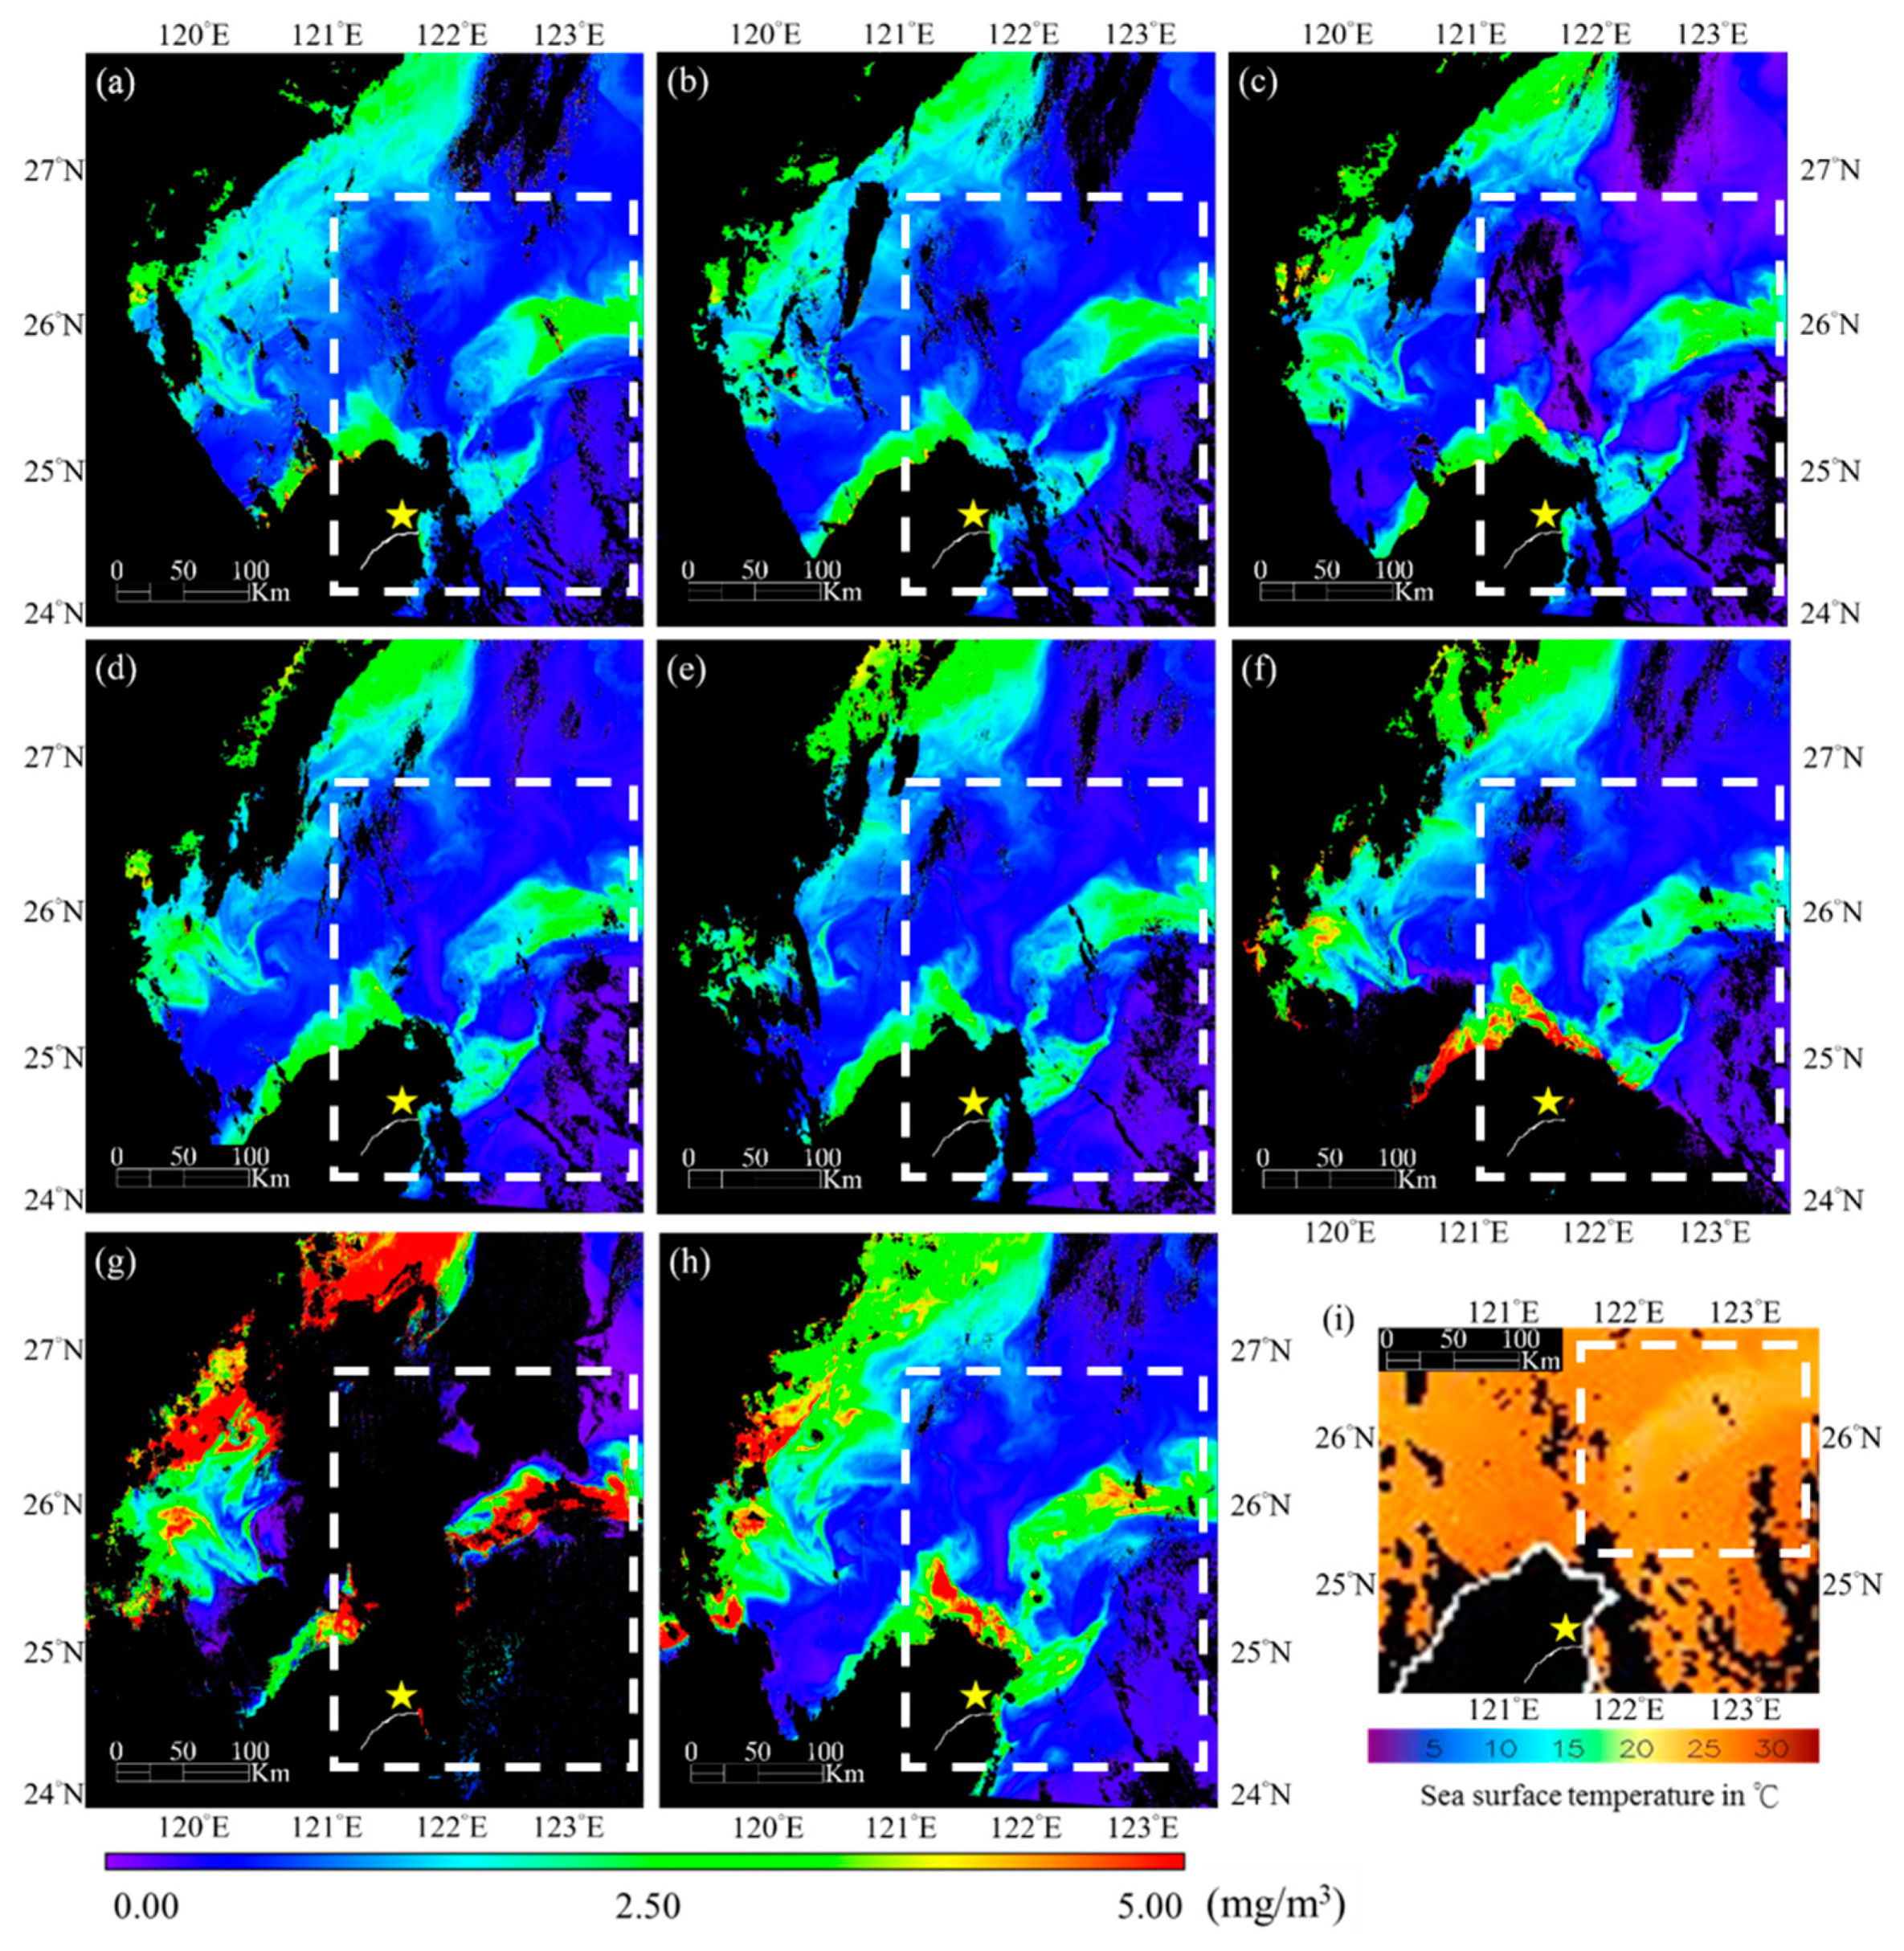
Typhoon Soulik originated northeast of Guam on 6 July 2013 and reached its peak strength four days later. It passed over the warm waters of the Kuroshio Current the following day and later made landfall on 12 July 2013 in northern Taiwan with torrential rains of 900 mm (35 in) in Bailan, destructive winds of 190 km/h (120 mph), and gusts as high as 220 km/h (140 mph). As a result, the low-lying areas of Ilan City were seriously flooded [61], and a significant amount of terrestrial materials were flushed from the watersheds of mountainous areas through the Lanyang River to the Lanyang River plume. Since this is one of the major agriculture areas of Taiwan, a lot of fertilizer with ingredients such as nitrogen and phosphorous was also exported to the coast off northeastern Taiwan. This free fast food provided enough fuel to trigger a large scale, yet short-term bloom of phytoplankton, which can be clearly seen from the chlorophyll-a map time series derived from the GOCI images taken four days later (Figure 12).
Remember that the UZONT in the summer is a cold dome nursery that is also a result of cold, nutrient-rich waters upwelled from the subsurface of the ocean. It is reasonable to expect that the overpass of Typhoon Soulik would amplify the pumping effect and reinforce the development of the cold dome. Based on its path and duration in the UZONT, however, the direct contribution to the cold dome from Typhoon Soulik was found to be minimal. This was confirmed by the SST map from GOES (Geostationary Operational Environmental Satellites) taken at 8:42 on 16 July 2013, four days after Typhoon Soulik made landfall. The patch of cold water in the UZONT shown in Figure 12i indicates that the pumping of cold water from beneath was rather steady even four days after Typhoon Soulik had passed. The chlorophyll-a map time series derived from the GOCI images (Figure 12a–h) suggests that the typhoon-triggered phytoplankton bloom in the river plume gradually expanded and merged with the cold dome. This is therefore posited to be the main influence of Typhoon Soulik on the MOEs in the UZONT.
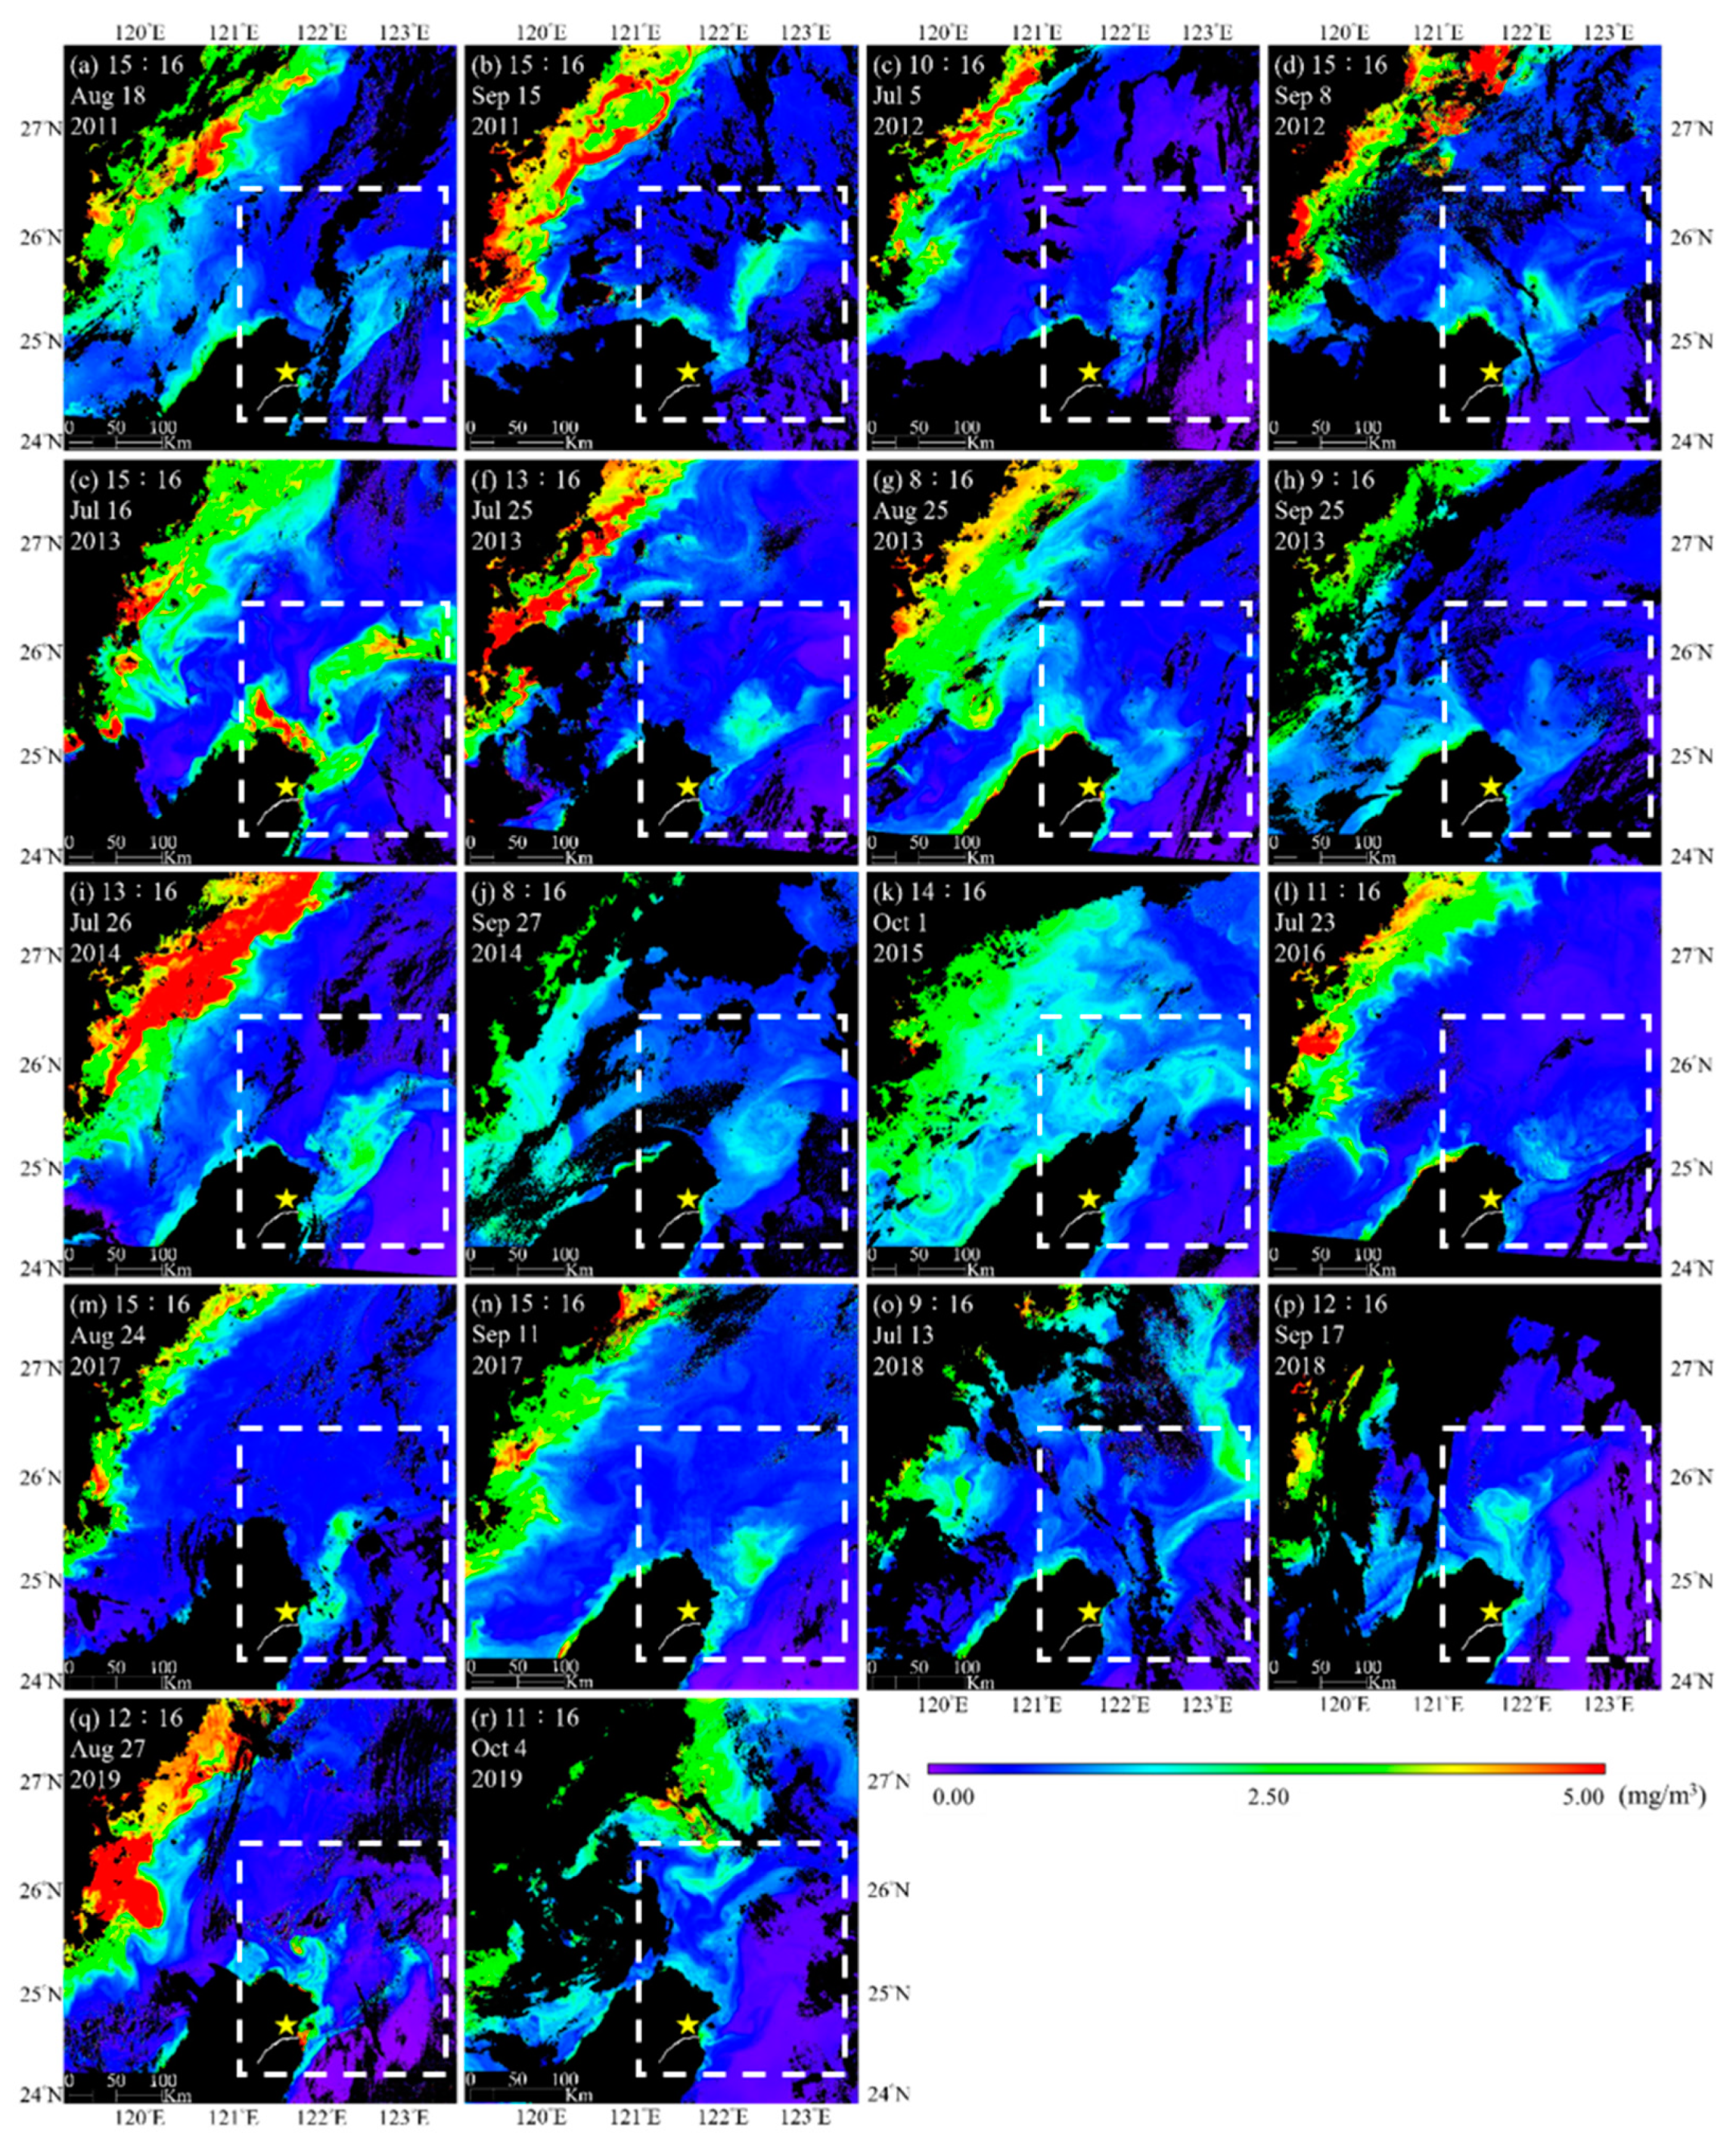
One difficulty related to studying the sea surface after the passage of a major typhoon is that the regions of interest are often covered by clouds. Apart from the case of the river plume and cold dome interaction with the discussion and conclusions from one event of Typhoon Soulik (Figure 12), the first cloudless GOCI images taken within two weeks of all 18 typhoon events between 2011 to 2019 are shown in Figure 13, with the intention of providing stronger support using more cases and examples. Table 3 lists the date and warning of every first cloudless GOCI image for all 18 typhoon events between 2011 to 2019. For those MOEs found after the passage of a major tyhoon, the typhoon-triggered phytoplankton bloom in the river plume all gradually expanded and merged with the cold dome.

3.5. Suggestions for Future Work: Influence from El Niño and La Niña Events

El Niño and La Niña events have occurred at two-to seven-year intervals for at least the past 300 years [62,63]. They affect the global climate and disrupt normal weather patterns. Consequently, they might have some influence on the MOEs in the UZONT as well. Since the operation of Himawari-8 began in 2015, there has been only one El Niño event (February 2015 to June 2016) and one La Niña event (July 2016 to January 2017). The autumn averages of Himawari-8 SST data in the UZONT in the year of the La Niña event (2016) and in normal years (2017 and 2018) are shown in Figure 14. A clear cold dome signal was found in the autumn of 2016 during the La Niña event, while no sign of a cold dome at all can be seen in the autumn of the normal years (2017 and 2018). Since the main mechanism of the MOEs in the UZONT is the oscillation of the Kuroshio axis, Figure 14 suggests that a La Niña event provides favorable conditions for the Kuroshio current to flow along the edge of the China Continental Shelf and the development of an eddy structure. More observations are required to clarify the detailed relationship between El Niño and La Niña events and the MOEs in the UZONT.

4. Conclusions

The UZONT is one of the hot spots with MOEs and eddy-induced transports in the north Pacific Ocean. We started from the temporal and spatial variations in MOEs in the UZONT revealed from the Himawari-8 SST product and the GOCI chlorophyll-a product, respectively. Their relationship with three major factors, the Kuroshio, typhoon, and El Niño/La Niña events, were then investigated.
Seasonal averages of Himawari-8 SST data in the UZONT in 2016, 2017, 2018, and 2019 confirmed that the distance from the Kuroshio axis to Taiwan plays a crucial role in the shedding of cold domes in the UZONT. The daily averages of Himawari-8 SST data acquired from the 10th to the 21th of December 2016 show that a large cold dome could persist at least ten days in the UZONT, even when the warmer Kuroshio current dominates in this region in the winter.
An extraordinarily large bloom ellipsoid mixed with the Lanyang River plume with a long axis of 100 km was detected from the GOCI hourly chlorophyll-a map time series taken on 3 August 2015. This suggests that the terrestrial materials transported to the Lanyang River plume can be enhanced and diverted by the emergence of cold domes. In this case, the Lanyang River plume turns from a northwestern direction to a northeastern direction and eventually merges into the Kuroshio current.
A rare case of continuous observation of a GOCI chlorophyll-a map made from 8:16 on 26 July 2014 to 15:16 on 28 July 2014 provides new insight into the evolution of the MOEs in the UZONT. The results showed that the cold dome in the UZONT indeed exhibited an enhancing stage followed by a decaying stage from the 18th of July to the 3rd of August 2016. However, this cold dome was not formed purely by the local upwelling flow. According to the GOCI map of chlorophyll-a collected from the 22nd of July to the 25th of July 2016, this cold dome was indeed mixed with the Lanyang River plume. This indicates a strong interaction and close correlation between the river plume and the cold dome in the UZONT, which has not been observed or discussed previously.
The overpassing of a typhoon in the UZONT is expected to amplify the pumping effect and reinforce the cold dome. However, the contribution depends on the intensity and duration of the typhoon, as well as the depth of the mixing layer it overpasses. For a typical case of Typhoon Soulik, the GOCI hourly chlorophyll-a map time series taken on 16 July 2013 shows that the main influence of Typhoon Soulik on the MOEs in the UZONT was a result of the expansion and merging of the typhoon-triggered phytoplankton bloom in the river plume with the cold dome.
Averages of Himawari-8 SST data in the UZONT in the autumn of 2016 suggest that a La Niña event provides a preferable condition for the Kuroshio current flows along the edge of the China Continental Shelf that leads to the development of an eddy structure. More observations are required to clarify the detailed relationship between El Niño and La Niña events and the MOEs in the UZONT.
Because the MOEs in the UZONT originate from the Kuroshio impinging on the continental shelf, while the intrusion and meandering of the Kuroshio also fluctuate due to typhoons and El Niño/La Niña events, the spatiotemporal variations in the MOEs serve as ideal indicators by which to understand these influences on the UZONT based on interannual environmental factors and climate change. The high temporal resolution of the Himawari-8 SST product and the GOCI chlorophyll-a product acquired from geostationary satellites makes it possible to gain a better understanding of some long-term, large-scale, dynamic features of the MOEs in the UZONT.

Author Contributions

Conceptualization, H.-W.C. and C.-C.L.; Data curation, H.-W.C.; Formal analysis, H.-W.C.; Funding acquisition, C.-C.L.; Investigation, H.-W.C. and C.-C.L.; Methodology, H.-W.C. and C.-C.L.; Project administration, C.-C.L.; Resources, C.-C.L.; Software, H.-W.C. and C.-C.L.; Supervision, C.-C.L.; Validation, H.-W.C.; Visualization, H.-W.C. and C.-C.L.; Writing—original draft, C.-C.L.; Writing—review & editing, C.-C.L.

Funding

This research was funded by the Ministry of Science and Technology of Taiwan ROC, under Contract Nos. MoST 108-2611-M-006-003.

Acknowledgments

The authors acknowledge support from the KORC in providing the GOCI imagery and the JAXA Himawari Monitor P-Tree system in providing Himawari-8 SST data.

Conflicts of Interest

The authors declare no conflict of interest.

References

  1. Tansley, C.E.; Marshall, D.P. Flow past a cylinder on a β plane, with application to gulf stream separation and the antarctic circumpolar current. J. Phys. Oceanogr. 2001, 31, 3274–3283. [Google Scholar] [CrossRef]
  2. Toda, T. Movement of the surface front induced by kuroshio frontal eddy. J. Geophys. Res. Oceans 1993, 98, 16331–16339. [Google Scholar] [CrossRef]
  3. Hsu, S.C.; Lin, F.J.; Jeng, W.L.; Tang, T.Y. The effect of a cyclonic eddy on the distribution of lithogenic particles in the southern east china sea. J. Mar. Res. 1998, 56, 813–832. [Google Scholar] [CrossRef]
  4. Chen, Y.L.L.; Chen, H.Y.; Jan, S.; Lin, Y.H.; Kuo, T.H.; Hung, J.J. Biologically active warm-core anticyclonic eddies in the marginal seas of the western pacific ocean. Deep Sea Res. Part I Oceanogr. Res. Pap. 2015, 106, 68–84. [Google Scholar] [CrossRef]
  5. Wada, A. Reexamination of tropical cyclone heat potential in the western north pacific. J. Geophys. Res. Atmos. 2016, 121, 6723–6744. [Google Scholar] [CrossRef] [Green Version]
  6. Sukigara, C.; Suga, T.; Toyama, K.; Oka, E. Biogeochemical responses associated with the passage of a cyclonic eddy based on shipboard observations in the western north pacific. J. Oceanogr. 2014, 70, 435–445. [Google Scholar] [CrossRef]
  7. Liu, C.-C.; Shieh, C.-L.; Lin, J.-C.; Wu, A.-M. Classification of non-vegetated areas using formosat-2 high spatiotemporal imagery: The case of tseng-wen reservoir catchment area (taiwan). Int. J. Remote Sens. 2011, 32, 8519–8540. [Google Scholar] [CrossRef]
  8. Hosoda, S.; Nonaka, M.; Sasai, Y.; Sasaki, H. Early summertime interannual variability in surface and subsurface temperature in the north pacific. J. Oceanogr. 2015, 71, 557–573. [Google Scholar] [CrossRef]
  9. Smirnov, D.; Newman, M.; Alexander, M.A.; Kwon, Y.O.; Frankignoul, C. Investigating the local atmospheric response to a realistic shift in the oyashio sea surface temperature front. J. Clim. 2015, 28, 1126–1147. [Google Scholar] [CrossRef] [Green Version]
  10. Hsu, S.C.; Lin, F.J.; Jeng, W.L.; Tang, T.Y. Spatial distribution of cadmium over a cyclonic eddy in the southern east china sea. J. Mar. Syst. 2003, 39, 153–166. [Google Scholar] [CrossRef]
  11. Frenger, I.; Gruber, N.; Knutti, R.; Munnich, M. Imprint of southern ocean eddies on winds, clouds and rainfall. Nat. Geosci. 2013, 6, 608–612. [Google Scholar] [CrossRef]
  12. Sasaki, Y.N.; Minobe, S. Climatological mean features and interannual to decadal variability of ring formations in the kuroshio extension region. J. Oceanogr. 2015, 71, 499–509. [Google Scholar] [CrossRef] [Green Version]
  13. Revelard, A.; Frankignoul, C.; Sennechael, N.; Kwon, Y.O.; Qiu, B. Influence of the decadal variability of the kuroshio extension on the atmospheric circulation in the cold season. J. Clim. 2016, 29, 2123–2144. [Google Scholar] [CrossRef]
  14. Shih, Y.Y.; Hung, C.C.; Gong, G.C.; Chung, W.C.; Wang, Y.H.; Lee, I.H.; Chen, K.S.; Ho, C.Y. Enhanced particulate organic carbon export at eddy edges in the oligotrophic western north pacific ocean. PLoS ONE 2015, 10, e0131538. [Google Scholar] [CrossRef] [PubMed] [Green Version]
  15. Lu, W.F.; Yan, X.H.; Jiang, Y.W. Winter bloom and associated upwelling northwest of the luzon island: A coupled physical-biological modeling approach. J. Geophys. Res. Ocean. 2015, 120, 533–546. [Google Scholar] [CrossRef]
  16. Cabrera, O.C.; Villanoy, C.L.; Alabia, I.D.; Gordon, A.L. Shifts in chlorophyll a off eastern luzon, philippines, associated with the north equatorial current bifurcation latitude. Oceanography 2015, 28, 46–53. [Google Scholar] [CrossRef] [Green Version]
  17. Zainuddin, M.; Kiyofuji, H.; Saitoh, K.; Saitoh, S.I. Using multi-sensor satellite remote Sens. and catch data to detect ocean hot spots for albacore (thunnus alalunga) in the northwestern north pacific. Deep Sea Res. Part II Top. Stud. Oceanogr. 2006, 53, 419–431. [Google Scholar] [CrossRef]
  18. Dupouy, C.; Neveux, J.; Ouillon, S.; Frouin, R.; Murakami, H.; Hochard, S.; Dirberg, G. Inherent optical properties and satellite retrieval of chlorophyll concentration in the lagoon and open ocean waters of new caledonia. Mar. Pollut. Bull. 2010, 61, 503–518. [Google Scholar] [CrossRef]
  19. Miller, R.L.; Liu, C.-C.; Buonassissi, C.J.; Wu, A.-M. A multi-sensor approach to examining the distribution of total suspended matter (tsm) in the albemarle-pamlico estuarine system, nc, USA. Remote Sens. 2011, 3, 962–974. [Google Scholar] [CrossRef] [Green Version]
  20. Shanmugam, P. New models for retrieving and partitioning the colored dissolved organic matter in the global ocean: Implications for remote Sensing. Remote Sens. Environ. 2011, 115, 1501–1521. [Google Scholar] [CrossRef]
  21. Wozniak, S.B.; Stramski, D.; Stramska, M.; Reynolds, R.A.; Wright, V.M.; Miksic, E.Y.; Cichocka, M.; Cieplak, A.M. Optical variability of seawater in relation to particle concentration, composition, and size distribution in the nearshore marine environment at imperial beach, california. J. Geophys. Res. Oceans 2010, 115. [Google Scholar] [CrossRef] [Green Version]
  22. Hu, C.; Muller-Karger, F.; Murch, B.; Myhre, D.; Taylor, J.; Luerssen, R.; Moses, C.; Zhang, C.; Gramer, L.; Hendee, J. Building an automated integrated observing system to detect sea surface temperature anomaly events in the florida keys. IEEE Trans. Geosci. Remote Sens. 2009, 47, 2071–2084. [Google Scholar] [CrossRef]
  23. Yueh, S.H.; Chaubell, J. Sea surface salinity and wind retrieval using combined passive and active l-band microwave observations. IEEE Trans. Geosci. Remote Sens. 2012, 50, 1022–1032. [Google Scholar] [CrossRef]
  24. Burrage, D.; Wesson, J.; Martinez, C.; Pérez, T.; Möller, O.; Piola, A. Patos lagoon outflow within the río de la plata plume using an airborne salinity mapper: Observing an embedded plume. Cont. Shelf Res. 2008, 28, 1625–1638. [Google Scholar] [CrossRef]
  25. Lipa, B.; Barrick, D.; Saitoh, S.-I.; Ishikawa, Y.; Awaji, T.; Largier, J.; Garfield, N. Japan tsunami current flows observed by hf radars on two continents. Remote Sens. 2011, 3, 1663–1679. [Google Scholar] [CrossRef] [Green Version]
  26. IOCCG. Intional Ocean-Colour Coordinating Group. 2016. Available online: http://www.Ioccg.Org/ (accessed on 15 October 2016).
  27. Choi, J.K.; Park, Y.J.; Ahn, J.H.; Lim, H.S.; Eom, J.; Ryu, J.H. Goci, the world’s first geostationary ocean color observation satellite, for the monitoring of temporal variability in coastal water turbidity. J. Geophys. Res. Oceans 2012, 117, C09004. [Google Scholar] [CrossRef]
  28. Choi, J.-K.; Park, Y.J.; Lee, B.R.; Eom, J.; Moon, J.-E.; Ryu, J.-H. Application of the geostationary ocean color imager (goci) to mapping the temporal dynamics of coastal water turbidity. Remote Sens. Environ. 2014, 146, 24–35. [Google Scholar] [CrossRef]
  29. Lou, X.; Hu, C. Diurnal changes of a harmful algal bloom in the east china sea: Observations from goci. Remote Sens. Environ. 2014, 140, 562–572. [Google Scholar] [CrossRef]
  30. Huang, C.; Shi, K.; Yang, H.; Li, Y.; Zhu, A.-X.; Sun, D.; Xu, L.; Zou, J.; Chen, X. Satellite observation of hourly dynamic characteristics of algae with geostationary ocean color imager (goci) data in lake taihu. Remote Sens. Environ. 2015, 159, 278–287. [Google Scholar] [CrossRef]
  31. Yang, H.; Choi, J.K.; Park, Y.J.; Han, H.J.; Ryu, J.H. Application of the geostationary ocean color imager (goci) to estimates of ocean surface currents. J. Geophys. Res. Oceans 2014, 119, 3988–4000. [Google Scholar] [CrossRef]
  32. Warren, M.; Quartly, G.D.; Shutler, J.; Miller, P.I.; Yoshikawa, Y. Estimation of ocean surface currents from maximum cross correlation applied to goci geostationary satellite remote Sens. data over the tsushima (korea) straits. J. Geophys. Res. Oceans 2016, 121, 6993–7009. [Google Scholar] [CrossRef] [Green Version]
  33. Park, K.-A.; Woo, H.-J.; Ryu, J.-H. Spatial scales of mesoscale eddies from goci chlorophyll-a concentration images in the east/japan sea. Ocean Sci. J. 2012, 47, 347–358. [Google Scholar] [CrossRef]
  34. Oschlies, A.; Garcon, V. Eddy-induced enhancement of primary production in a model of the north atlantic ocean. Nature 1998, 394, 266. [Google Scholar] [CrossRef]
  35. Yang, G.; Wang, F.; Li, Y.; Lin, P. Mesoscale eddies in the northwestern subtropical pacific ocean: Statistical characteristics and three-dimensional structures. J. Geophys. Res. Oceans 2013, 118, 1906–1925. [Google Scholar] [CrossRef]
  36. Chaigneau, A.; Le Texier, M.; Eldin, G.; Grados, C.; Pizarro, O. Vertical structure of mesoscale eddies in the eastern south pacific ocean: A composite analysis from altimetry and argo profiling floats. J. Geophys. Res. Oceans 2011, 116, C11025. [Google Scholar] [CrossRef]
  37. Wu, C.-R.; Chiang, T.-L. Mesoscale eddies in the northern south china sea. Deep Sea Res. Part II Top. Stud. Oceanogr. 2007, 54, 1575–1588. [Google Scholar] [CrossRef]
  38. Millot, C. Mesoscale and seasonal variabilities of the circulation in the western mediterranean. Dyn. Atmos. Oceans 1991, 15, 179–214. [Google Scholar] [CrossRef]
  39. Resplandy, L.; Lévy, M.; Madec, G.; Pous, S.; Aumont, O.; Kumar, D. Contribution of mesoscale processes to nutrient budgets in the arabian sea. J. Geophys. Res. Oceans 2011, 116, C11007. [Google Scholar] [CrossRef] [Green Version]
  40. Jia, Y.; Liu, Q. Eddy shedding from the kuroshio bend at luzon strait. J. Oceanogr. 2004, 60, 1063–1069. [Google Scholar] [CrossRef]
  41. Zhang, Z.; Wang, W.; Qiu, B. Oceanic mass transport by mesoscale eddies. Science 2014, 345, 322–324. [Google Scholar] [CrossRef]
  42. Tang, T.; Hsueh, Y.; Yang, Y.; Ma, J. Continental slope flow northeast of taiwan. J. Phys. Oceanogr. 1999, 29, 1353–1362. [Google Scholar] [CrossRef]
  43. Nishizawa, A.; Kaneda, K.; Oikawa, M.; Horiuchi, D.; Fujioka, Y.; Okada, C. Seismic structure of rifting in the okinawa trough, an active backarc basin of the ryukyu (nansei-shoto) island arc-trench system. Earth Planets Space 2019, 71, 21. [Google Scholar] [CrossRef] [Green Version]
  44. Shen, J.; Zhang, J.; Qiu, Y.; Li, L.; Zhang, S.; Pan, A.; Huang, J.; Guo, X.; Jing, C. Winter counter-wind current in western taiwan strait: Characteristics and mechanisms. Cont. Shelf Res. 2019, 172, 1–11. [Google Scholar] [CrossRef]
  45. Ham, S.H.; Sohn, B.J. Assessment of the calibration performance of satellite visible channels using cloud targets: Application to meteosat-8/9 and mtsat-1r. Atmos. Chem. Phys. 2010, 10, 11131–11149. [Google Scholar] [CrossRef] [Green Version]
  46. Bessho, K.; Date, K.; Hayashi, M.; Ikeda, A.; Imai, T.; Inoue, H.; Kumagai, Y.; Miyakawa, T.; Murata, H.; Ohno, T.; et al. An introduction to himawari-8/9-japan’s new-generation geostationary meteorological satellites. J. Meteorol. Soc. Jpn. 2016, 94, 151–183. [Google Scholar] [CrossRef] [Green Version]
  47. Kim, B.-Y.; Lee, K.-T. Using the himawari-8 ahi multi-channel to improve the calculation accuracy of outgoing longwave radiation at the top of the atmosphere. Remote Sens. 2019, 11, 589. [Google Scholar] [CrossRef] [Green Version]
  48. Satellites, S. Himawari-8 & 9. Available online: http://spaceflight101.com/spacecraft/himawari-8-and-9/ (accessed on 23 September 2019).
  49. Wang, M.; Ahn, J.-H.; Jiang, L.; Shi, W.; Son, S.; Park, Y.-J.; Ryu, J.-H. Ocean color products from the korean geostationary ocean color imager (goci). Opt. Express 2013, 21, 3835–3849. [Google Scholar] [CrossRef]
  50. Tang, T.Y.; Tai, J.H.; Yang, Y.J. The flow pattern north of taiwan and the migration of the kuroshio. Cont. Shelf Res. 2000, 20, 349–371. [Google Scholar] [CrossRef]
  51. Wu, C.R.; Lu, H.F.; Chao, S.Y. A numerical study on the formation of upwelling off northeast taiwan. J. Geophys. Res.Oceans 2008, 113, C08025. [Google Scholar] [CrossRef] [Green Version]
  52. Jan, S.; Chen, C.C.; Tsai, Y.L.; Yang, Y.J.; Wang, J.; Chern, C.S.; Gawarkiewicz, G.; Lien, R.C.; Centurioni, L.; Kuo, J.Y. Mean structure and variability of the cold dome northeast of taiwan. Oceanography 2011, 24, 100–109. [Google Scholar] [CrossRef] [Green Version]
  53. Yin, W.B.; Huang, D.J. Short-term variations in the surface upwelling off northeastern taiwan observed via satellite data. J. Geophys. Res.Oceans 2019, 124, 939–954. [Google Scholar] [CrossRef]
  54. Gallagher, S.J.; Kitamura, A.; Iryu, Y.; Itaki, T.; Koizumi, I.; Hoiles, P.W. The pliocene to recent history of the kuroshio and tsushima currents: A multi-proxy approach. Prog. Earth Planet. Sci. 2015, 2, 17. [Google Scholar] [CrossRef] [Green Version]
  55. Zheng, P.-N.; Wu, D.-X.; Lin, X.-P.; Li, X.-T. Interannual variability of kuroshio current and its effect on the nearshore branch in japan/east sea. J. Hydrodyn. 2010, 22, 305–311. [Google Scholar] [CrossRef]
  56. Ichikawa, H.; Beardsley, R.C. Temporal and spatial variability of volume transport of the kuroshio in the east china sea. Deep Sea Res. Part I Oceanogr. Res. Pap. 1993, 40, 583–605. [Google Scholar] [CrossRef]
  57. Chern, C.-S.; Wang, J.; Wang, D.-P. The exchange of kuroshio and east China sea shelf waters. J. Geophys. Res. Oceans 1990, 95, 16017–16024. [Google Scholar] [CrossRef]
  58. Ya, M.; Wang, X.; Wu, Y.; Li, Y.; Yan, J.; Fang, C.; Zhao, Y.; Qian, R.; Lin, X. Seasonal variation of terrigenous polycyclic aromatic hydrocarbons along the marginal seas of china: Input, phase partitioning, and ocean-current transport. Environ. Sci. Technol. 2017, 51, 9072–9079. [Google Scholar] [CrossRef]
  59. Liu, Z.; Hou, Y.J. Kuroshio front in the east china sea from satellite sst and remote Sens. data. IEEE Geosci. Remote Sens. Lett. 2012, 9, 517–520. [Google Scholar] [CrossRef]
  60. Liu, C.-C.; Chang, C.-H.; Wen, C.-G.; Huang, C.-H.; Hung, J.-J.; Liu, J.T. Using satellite observations of ocean color to categorize the dispersal patterns of river-borne substances in the gaoping (kaoping) river, shelf and canyon system. J. Mar. Syst. 2009, 76, 496–510. [Google Scholar] [CrossRef]
  61. Chung, H.W.; Liu, C.C.; Cheng, I.F.; Lee, Y.R.; Shieh, M.C. Rapid response to a typhoon-induced flood with an sar- derived map of inundated areas: Case study and validation. Remote Sens. 2015, 7, 11954–11973. [Google Scholar] [CrossRef] [Green Version]
  62. Gergis, J.L.; Fowler, A.M. A history of ENSO events since AD 1525: Implications for future climate change. Clim. Chang. 2009, 92, 343–387. [Google Scholar] [CrossRef]
  63. McGregor, S.; Timmermann, A.; Timm, O. A unified proxy for ENSO and PDO variability since 1650. Clim. Past 2010, 6, 1–17. [Google Scholar] [CrossRef] [Green Version]
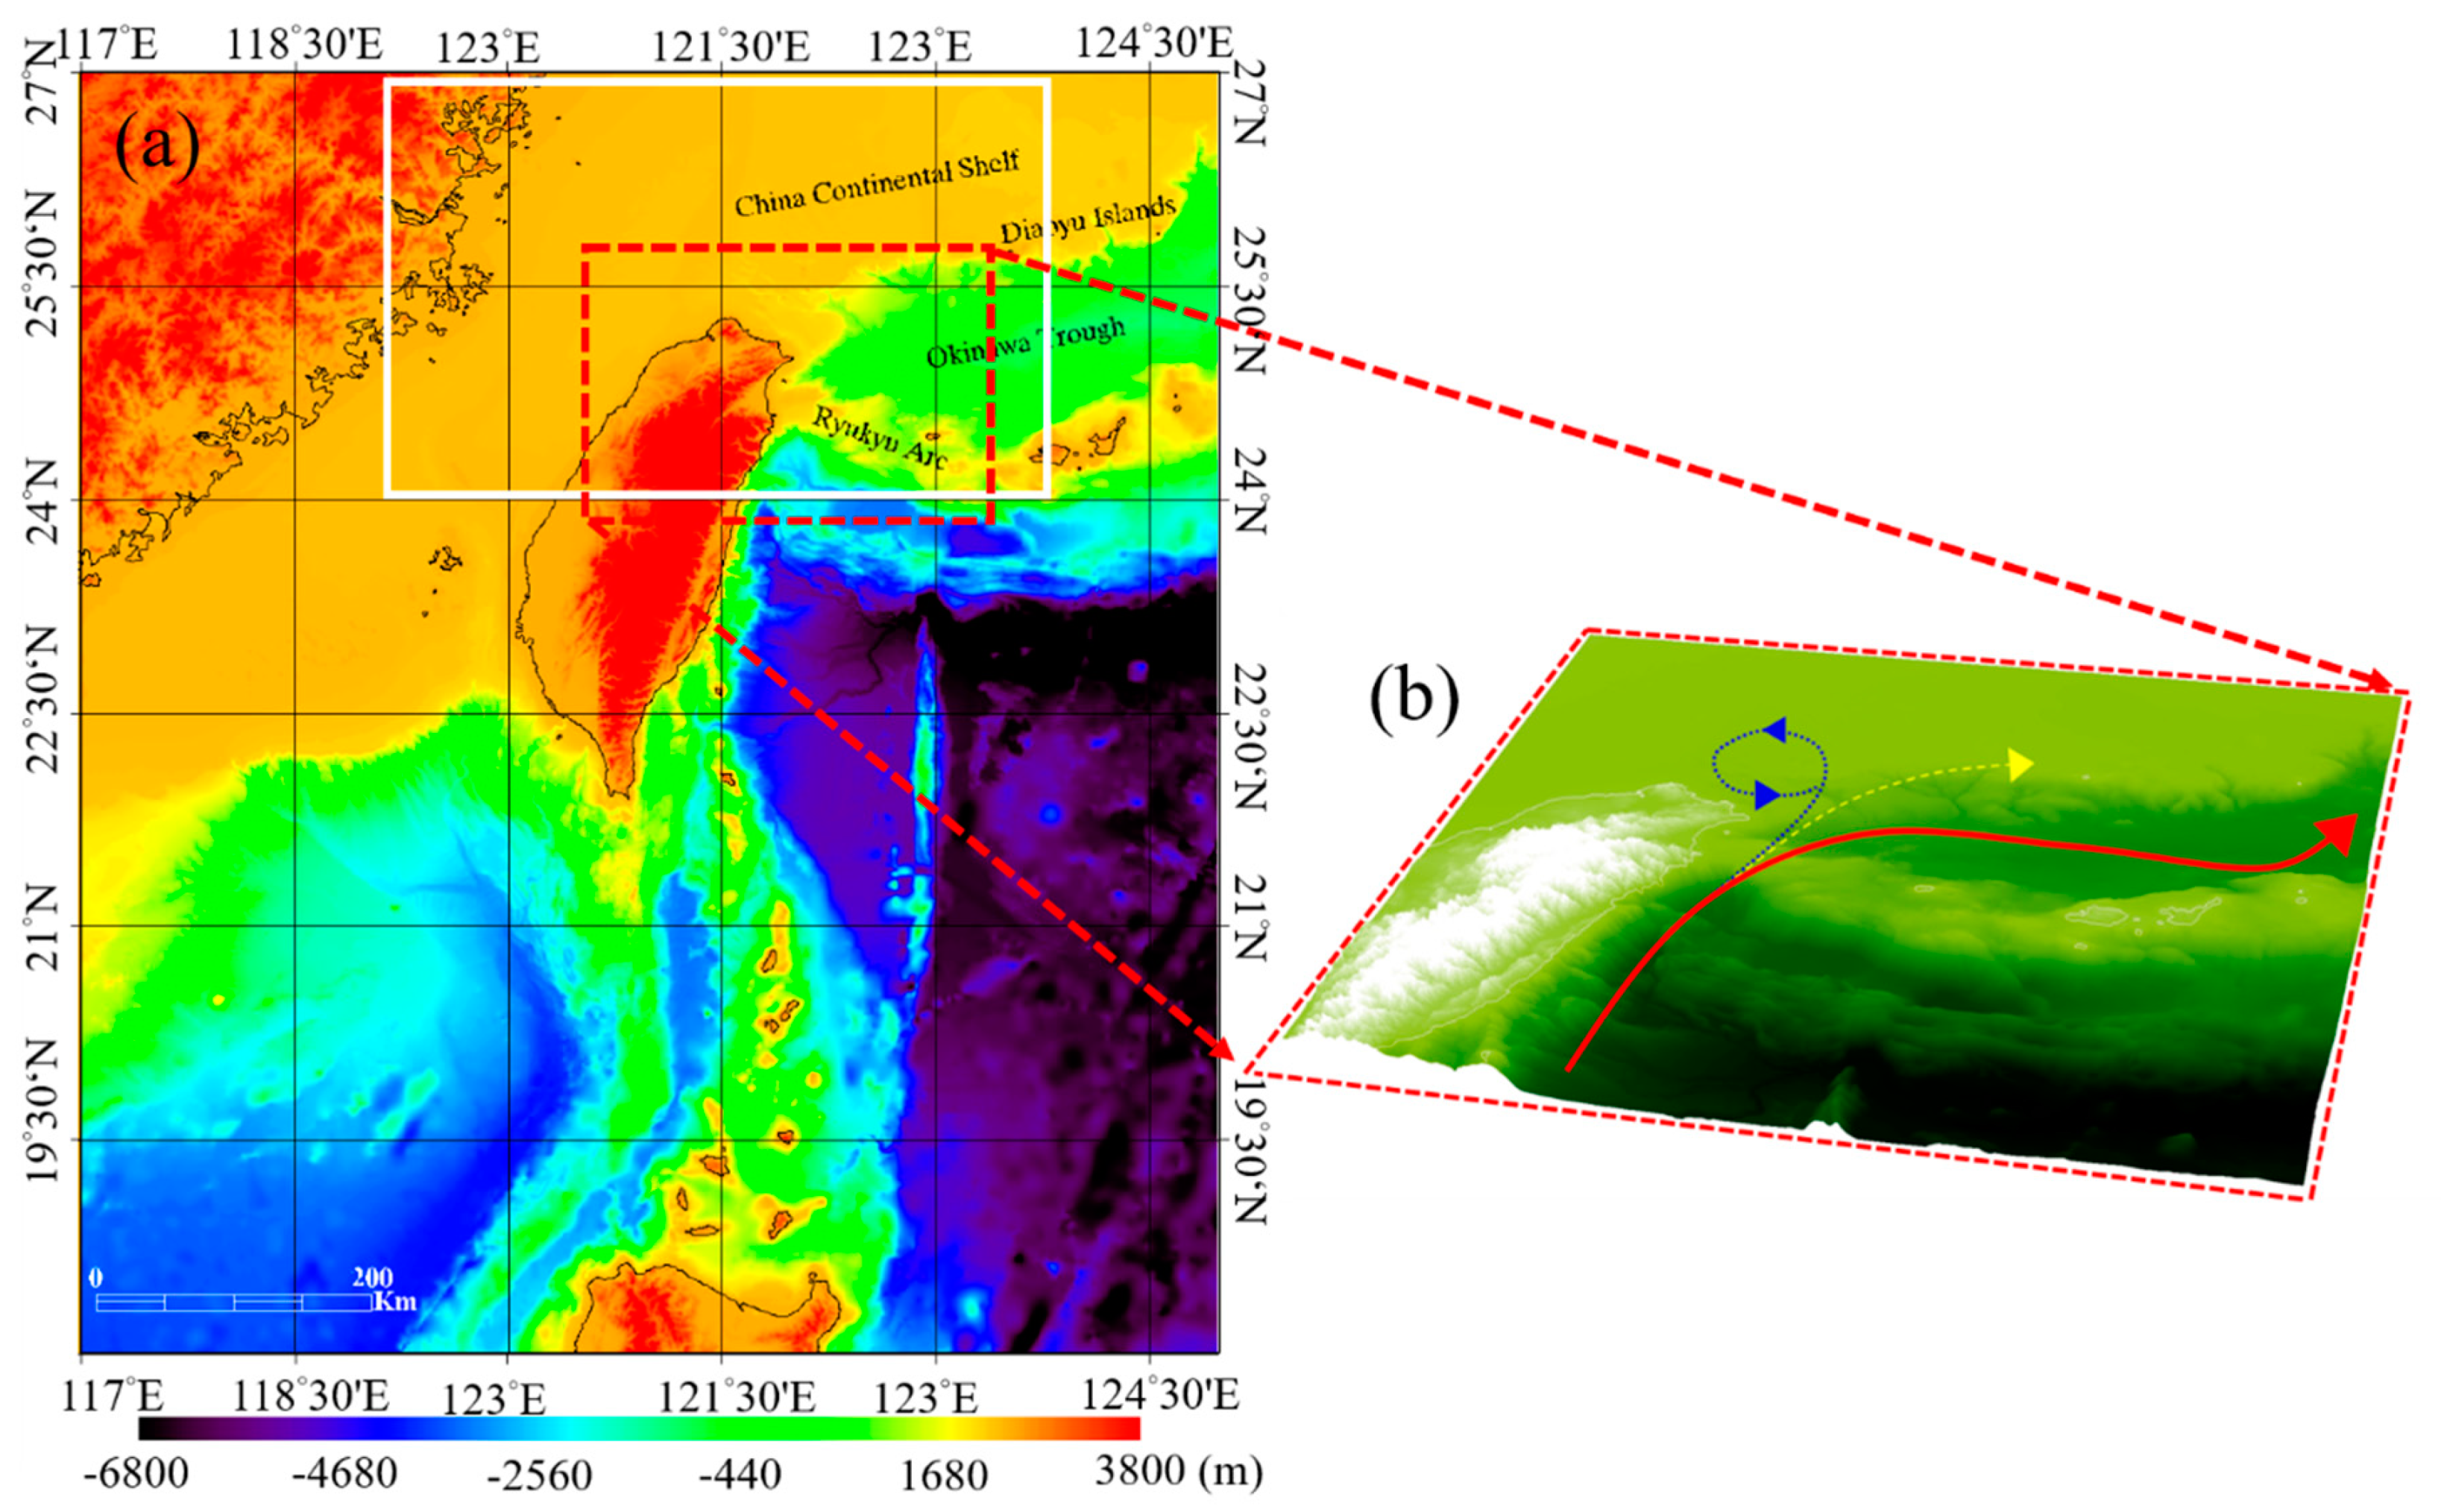
Figure 1. (a) The basin topography of the upwelling zone off northeastern Taiwan overlaid with three major current systems. (b) Illustration of the mechanism by which MOEs are formed in the UZONT. Three branches of the Kuroshio after passing the Ryukyu Arc. The first branch continues to flow northeastwardly towards Japan along the edge of the China Continental Shelf (red line). The second branch moves in a northly direction and enters the shelf where the water is shallower. It gradually turns toward the east and eventually rejoins the first branch to go to Japan (yellow line). The third branch flows along the edge of the China Continental Shelf but in a southwesterly direction. This counterclockwise flow turns into an eddy structure, pumps up the cold, nutrient-rich water from the subsurface to the sea surface, and triggers the regional bloom of phytoplankton (blue line).
Sustainability 11 06979 g001
Figure 2. Averages of Himawari-8 SST data in the UZONT in the spring (March to May) of (a) 2016, (b) 2017, (c) 2018, and (d) 2019. The region of interest is denoted by the white box.
Sustainability 11 06979 g002
Figure 3. Seasonal averages of Himawari-8 SST data in the UZONT in the summer (June to August) of (a) 2016, (b) 2017, (c) 2018, and (d) 2019. The region of interest is denoted by the white box.
Sustainability 11 06979 g003
Figure 4. Seasonal averages of Himawari-8 SST data in the UZONT in the autumn (September to November) of (a) 2015, (b) 2016, (c) 2017, and (d) 2018. The region of interest is denoted by the white box.
Sustainability 11 06979 g004
Figure 5. Seasonal averages of Himawari-8 SST data in the UZONT in the winter (December to February) of (a) 2015, (b) 2016, (c) 2017, and (d) 2018. The region of interest is denoted by the white box.
Sustainability 11 06979 g005
Figure 6. One large cold dome persisted at least ten days in the UZONT, as revealed by the daily averages of Himawari-8 SST data in the UZONT on (a) 10, (b) 11, (c) 12, (d) 13, (e) 14, (f) 15, (g) 16, (h) 17, (i) 18, (j) 19, (k) 20, and (l) 21 December 2016. The region of interest is denoted by the white box.
Sustainability 11 06979 g006
Figure 7. Maps of observation frequency of Himawari-8 SST data in the UZONT calculated at each pixel as the percentage of cloudless days and observed days during (a) autumn 2015, (b) winter 2015, (c) spring 2016, (d) summer 2016, (e) autumn 2016, (f) winter 2016, (g) spring 2017, (h) summer 2017, (i) autumn 2017, (j) winter 2017, (k) spring 2018, (l) summer 2018, (m) autumn 2018, (n) winter 2018, (o) spring 2019, and (p) summer 2019. The region of interest is denoted by the white box.
Sustainability 11 06979 g007
Figure 8. An extraordinarily large ellipsoid of bloom with a long axis of 100 km detected from the GOCI imagery taken at (a) 8:16, (b) 9:16, (c) 10:16, (d) 11:16, (e) 12:16, (f) 13:16, (g) 14:16 and (h) 15:16 on 3 August 2015. The location of Lanyang River mouth is denoted as a yellow star. The region of interest is denoted by the white box.
Sustainability 11 06979 g008
Figure 9. Time series of the GOCI chlorophyll-a map collected at (a) 9:16 a.m. on 18 July, (b) 10:16 a.m. on 20 July, (c) 11:16 a.m. on 21 July, (d) 3:16 p.m. on 22 July, (e) 10:16 a.m. on 23 July, (f) 11:16 a.m. on 24 July, (g) 12:16 p.m. on 25 July, (h) 10:16 a.m. on 26 July, (i) 10:16 a.m. on 27 July, (j) 10:16 a.m. on 28 July 2016. The region of interest is denoted by the white box.
Sustainability 11 06979 g009
Figure 10. Maps of chlorophyll-a derived from the GOCI images taken at (a) 10:16 on 25 March 2012, overlaid with the Sb-ADCP measurements of velocity at a depth of 16m in the winter, and (b) at 13:16 on 26 July 2014, overlaid with the Sb-ADCP measurements of velocity at a depth of 16 m in the summer [42].
Sustainability 11 06979 g010
Figure 11. Dynamics of the MOEs in the UZONT revealed by the GOCI chlorophyll-a map time series collected from 8:16 on 26 July 2014 to 15:16 on 28 July 2014. The region of interest is denoted by the white box.
Sustainability 11 06979 g011
Figure 12. The chlorophyll-a map time series derived from the GOCI images taken at (a) 8:16, (b) 9:16, (c) 10:16, (d) 11:16, (e) 12:16, (f) 13:16, (g) 14:16, and (h) 15:16 on 16 July 2013, after the passage of Typhoon Soulik. (i) The SST from GOES (Geostationary Operational Environmental Satellites) taken at 8:42 on the same day. The region of interest is denoted by the white box.
Sustainability 11 06979 g012
Figure 13. The first cloudless GOCI image taken within two weeks of all 18 typhoon events between 2011 to 2019 (a) 2011 Muifa, (b) 2011 Nanmadol, (c) 2012 Doksuri, (d) 2012 Tembin, (e) 2013 Soulik, (f) 2013 Cimaron, (g) 2013 Trami, (h) 2013 Usagi, (i) 2014 Matmo, (j) 2014 Fung-Wong, (k) 2015 Dujuan, (l) 2016 Nepartak, (m) 2017 Hato, (n) 2017 Guchol, (o) 2018 Maria, (p) 2018 Mangkhut, (q) 2019 Bailu, (r) 2019 Mitag. The region of interest is denoted by the white box.
Sustainability 11 06979 g013
Figure 14. Averages of Himawari-8 SST data in the UZONT in the autumn of (a) the 2016 La Niña event, and in normal years (b) 2017 and (c) 2018. The region of interest is denoted by the white box.
Sustainability 11 06979 g014
Table 1. The longwave channel of Himawari-8 [47,48].
BandCenterResolutionPrimary Use
B10.47 μm1 kmAerosol over land, coastal water, composite imaging
B20.51 μm1 kmComposite imaging
B30.64 μm0.5 kmVegetation, burn scars, aerosol over water, winds, composite imaging
B40.86 μm1 kmDaytime cirrus clouds
B51.61 μm2 kmDaytime cloud-top phase & particle size, snow
B62.25 μm2 kmDaytime land/cloud properties, particle size, vegetation, snow
B73.89 μm2 kmSurface and cloud, fog at night, fire, and winds
B86.24 μm2 kmHigh-level atmospheric water vapor, winds, and rainfall
B96.94 μm2 kmMid-level atmospheric water vapor, winds, and rainfall
B107.35 μm2 kmLower-level atmospheric water vapor, winds, and SO2
B118.59 μm2 kmTotal water for stability, cloud phase, dust, SO2, and rainfall
B129.64 μm2 kmTotal ozone, turbulence, and winds
B1310.41 μm2 kmSurface and cloud
B1411.24 μm2 kmImagery, sea surface temperature, clouds, and rainfall
B1512.38 μm2 kmTotal water, ash, and sea surface temperature
B1613.28 μm2 kmAir temperature, cloud heights and amounts
Table 2. The spectral characteristics of GOCI [27].
BandCenterWidthSNRPrimary Use
B1412 nm20 nm1077Yellow substance and turbidity
B2443 nm20 nm1199Chlorophyll absorption maximum
B3490 nm20 nm1316Chlorophyll and other pigments
B4555 nm20 nm1223Turbidity, suspended sediment
B5660 nm20 nm1192Baseline of fluorescence signal, chlorophyll, suspended sediment
B6680 nm10 nm1093Atmospheric correction and fluorescence signal
B7745 nm20 nm1107Atmospheric correction and baseline of fluorescence signal
B8865 nm40 nm1009Aerosol optical thickness, vegetation, water vapor reference over the ocean
Table 3. List of the date and warning for every first cloudless GOCI image for all 18 typhoon events between 2011 to 2019.
TyphoonWarningsImage DateCorresponding Figure Number in Figure 13
2011 Muifa4 to 6 August15:16 on 18 August 2011(a)
2011 Nanmadol27 to 31 August15:16 on 15 September 2011(b)
2012 Doksuri28 to 29 June12:16 on 7 July 2012(c)
2012 Tembin21 to 28 August15:16 on 8 September 2012(d)
2013 Soulik11 to 13 July15:16 on 16 July 2013(e)
2013 Cimaron17 to 18 July13:16 on 25 July 2013(f)
2013 Trami20 to 22 August8:16 on 25 August 2013(g)
2013 Usagi19 to 22 September9:16 on 25 September 2013(h)
2014 Matmo21 to 23 July13: 16 on 26 July 2014(i)
2014 Fung-Wong19 to 22 September8:16 on 27 September 2014(j)
2015 Dujuan27 to 29 September14:16 on 1 October 2015(k)
2016 Nepartak6 to 9 July11:16 on 23 July 2016(l)
2017 Hato20 to 22 August15:16 on 24 August 2017(m)
2017 Guchol6 to 7 September15:16 on 11 September 2017(n)
2018 Maria9 to 11 July9:16 on 13 July 2018(o)
2018 Mangkhut14 to 15 September12:16 on 17 September 2018(p)
2019 Bailu23 to 25 August12:16 on 27 August 2019(q)
2019 Mitag29 September to 1 October 11:16 on 4 October 2019(r)