Exploring Renewable Energy Resources Using Remote Sensing and GIS—A Review

 , ,
, ,  ,
, 

 and
and 
Abstract
:1. Introduction
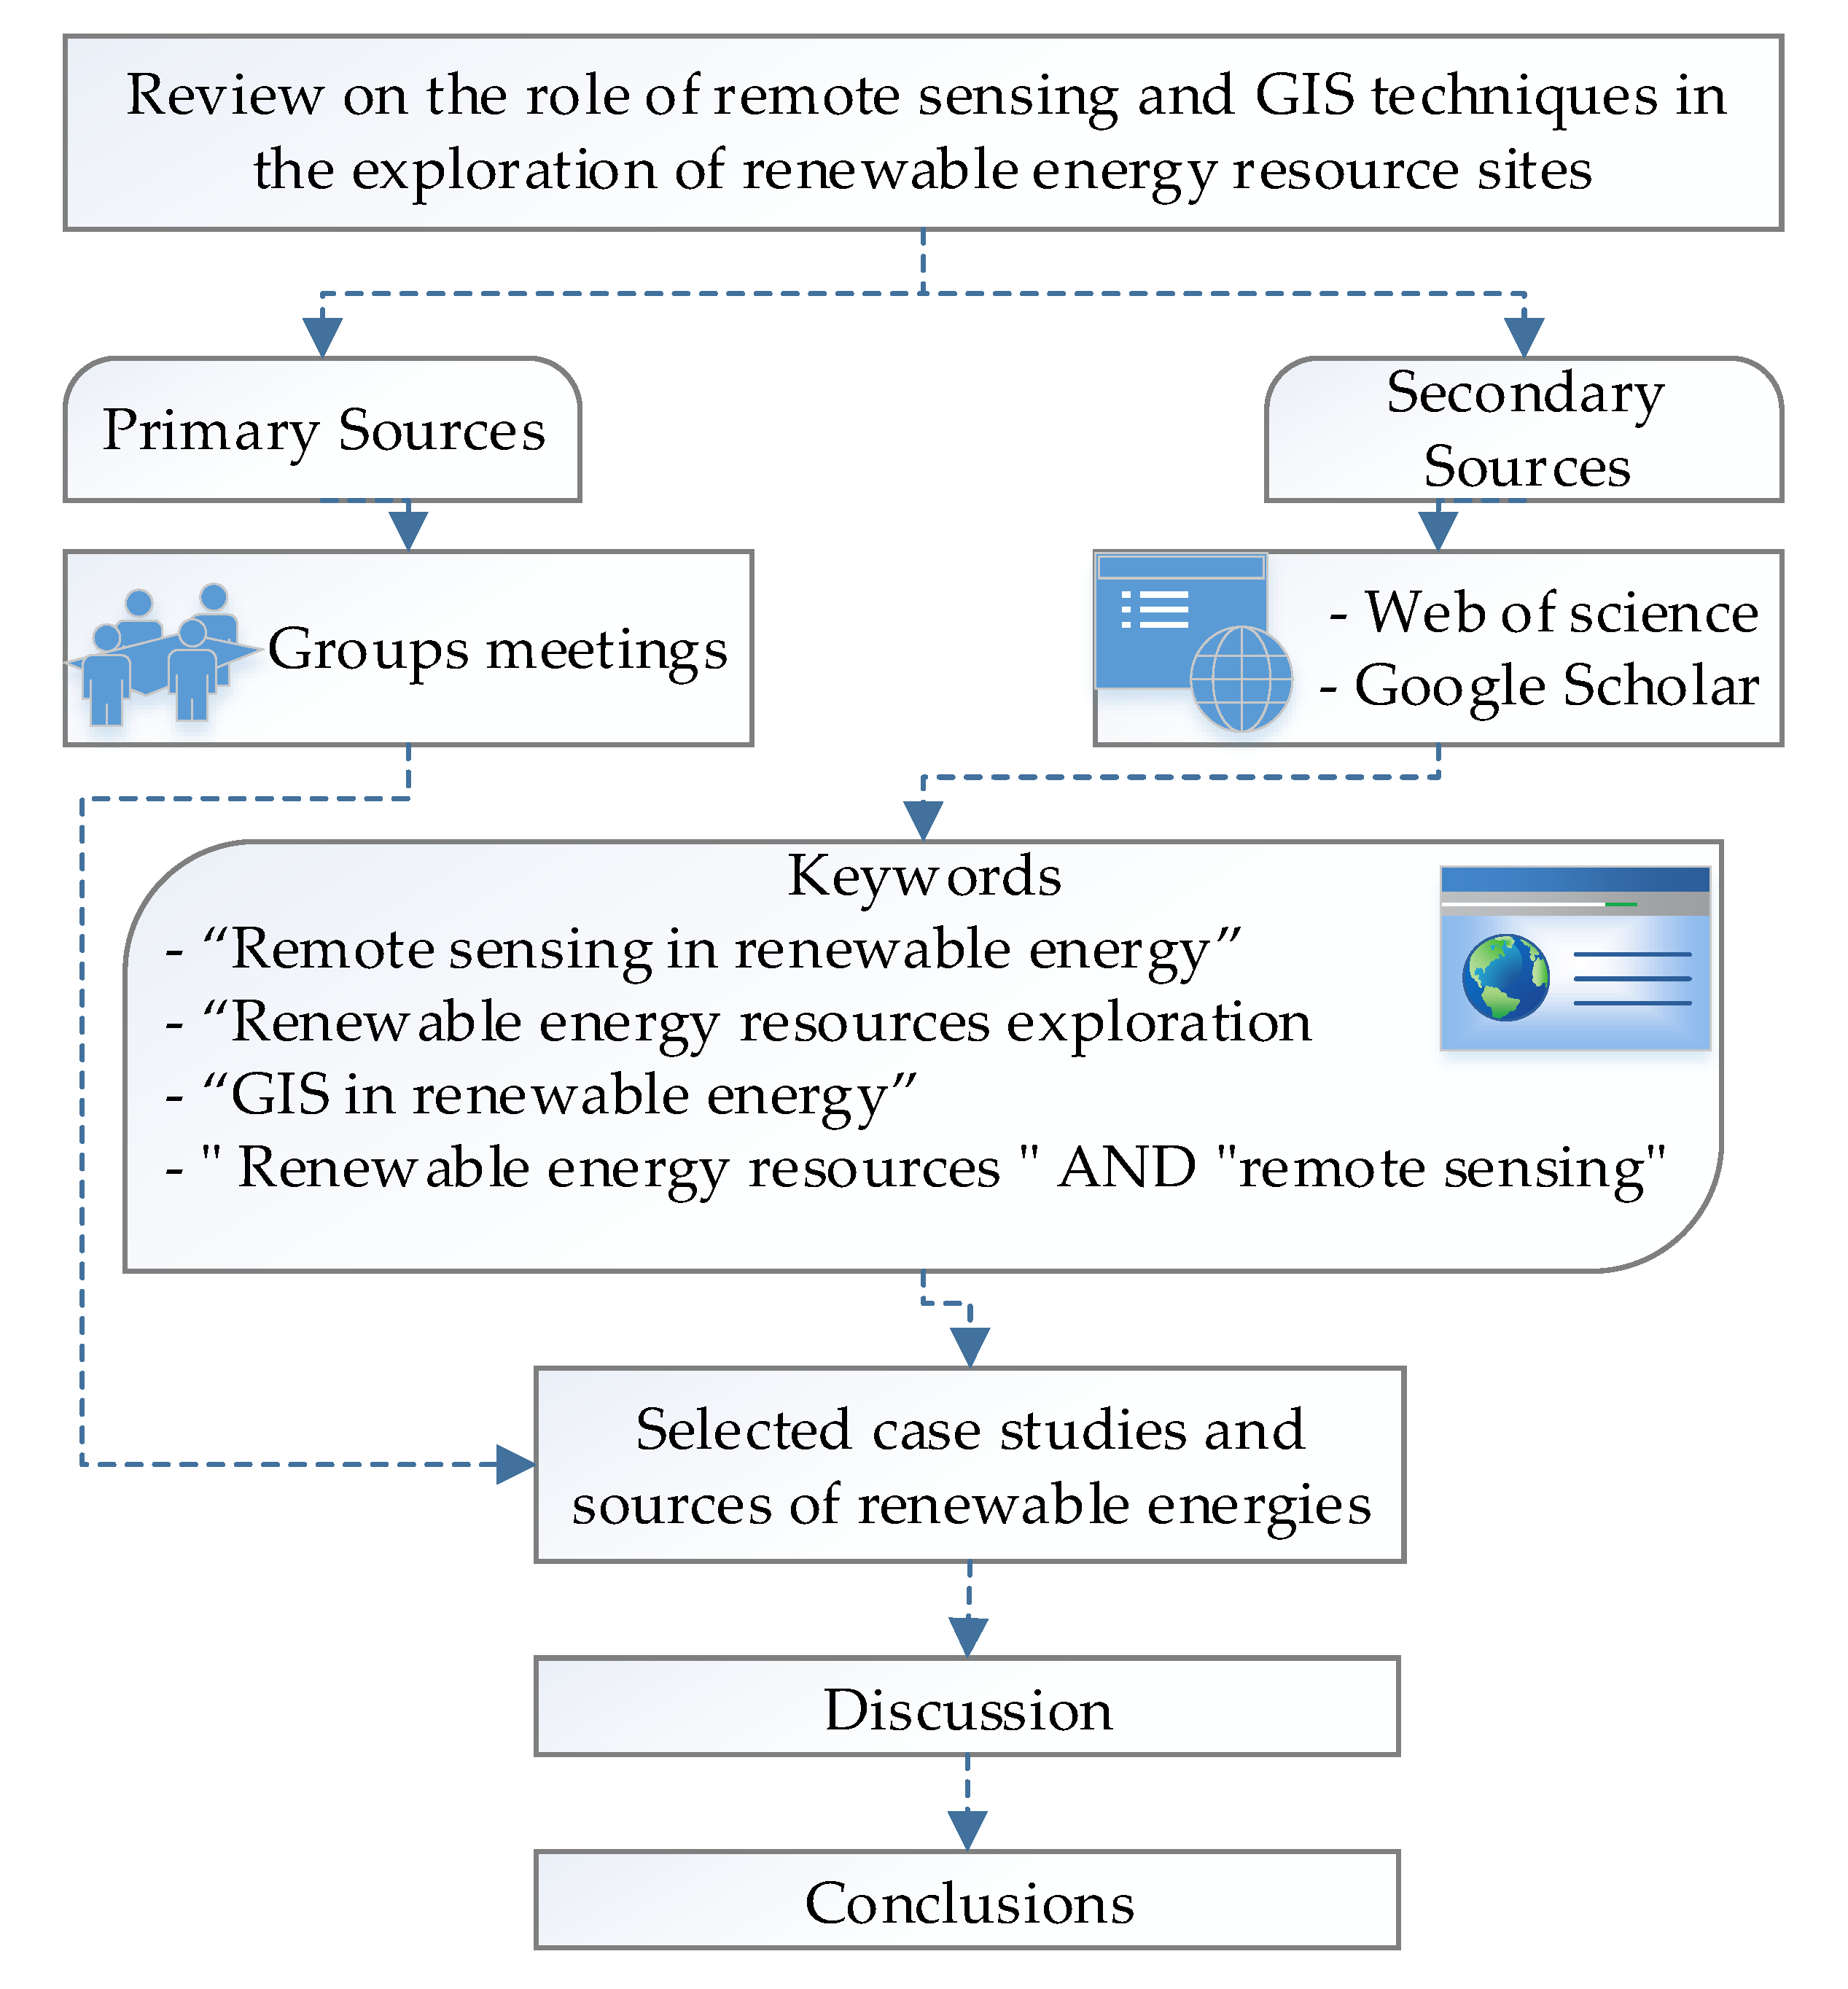
2. Methodology
3. Conventional Methods Used for the Development of Renewable Energy Resources
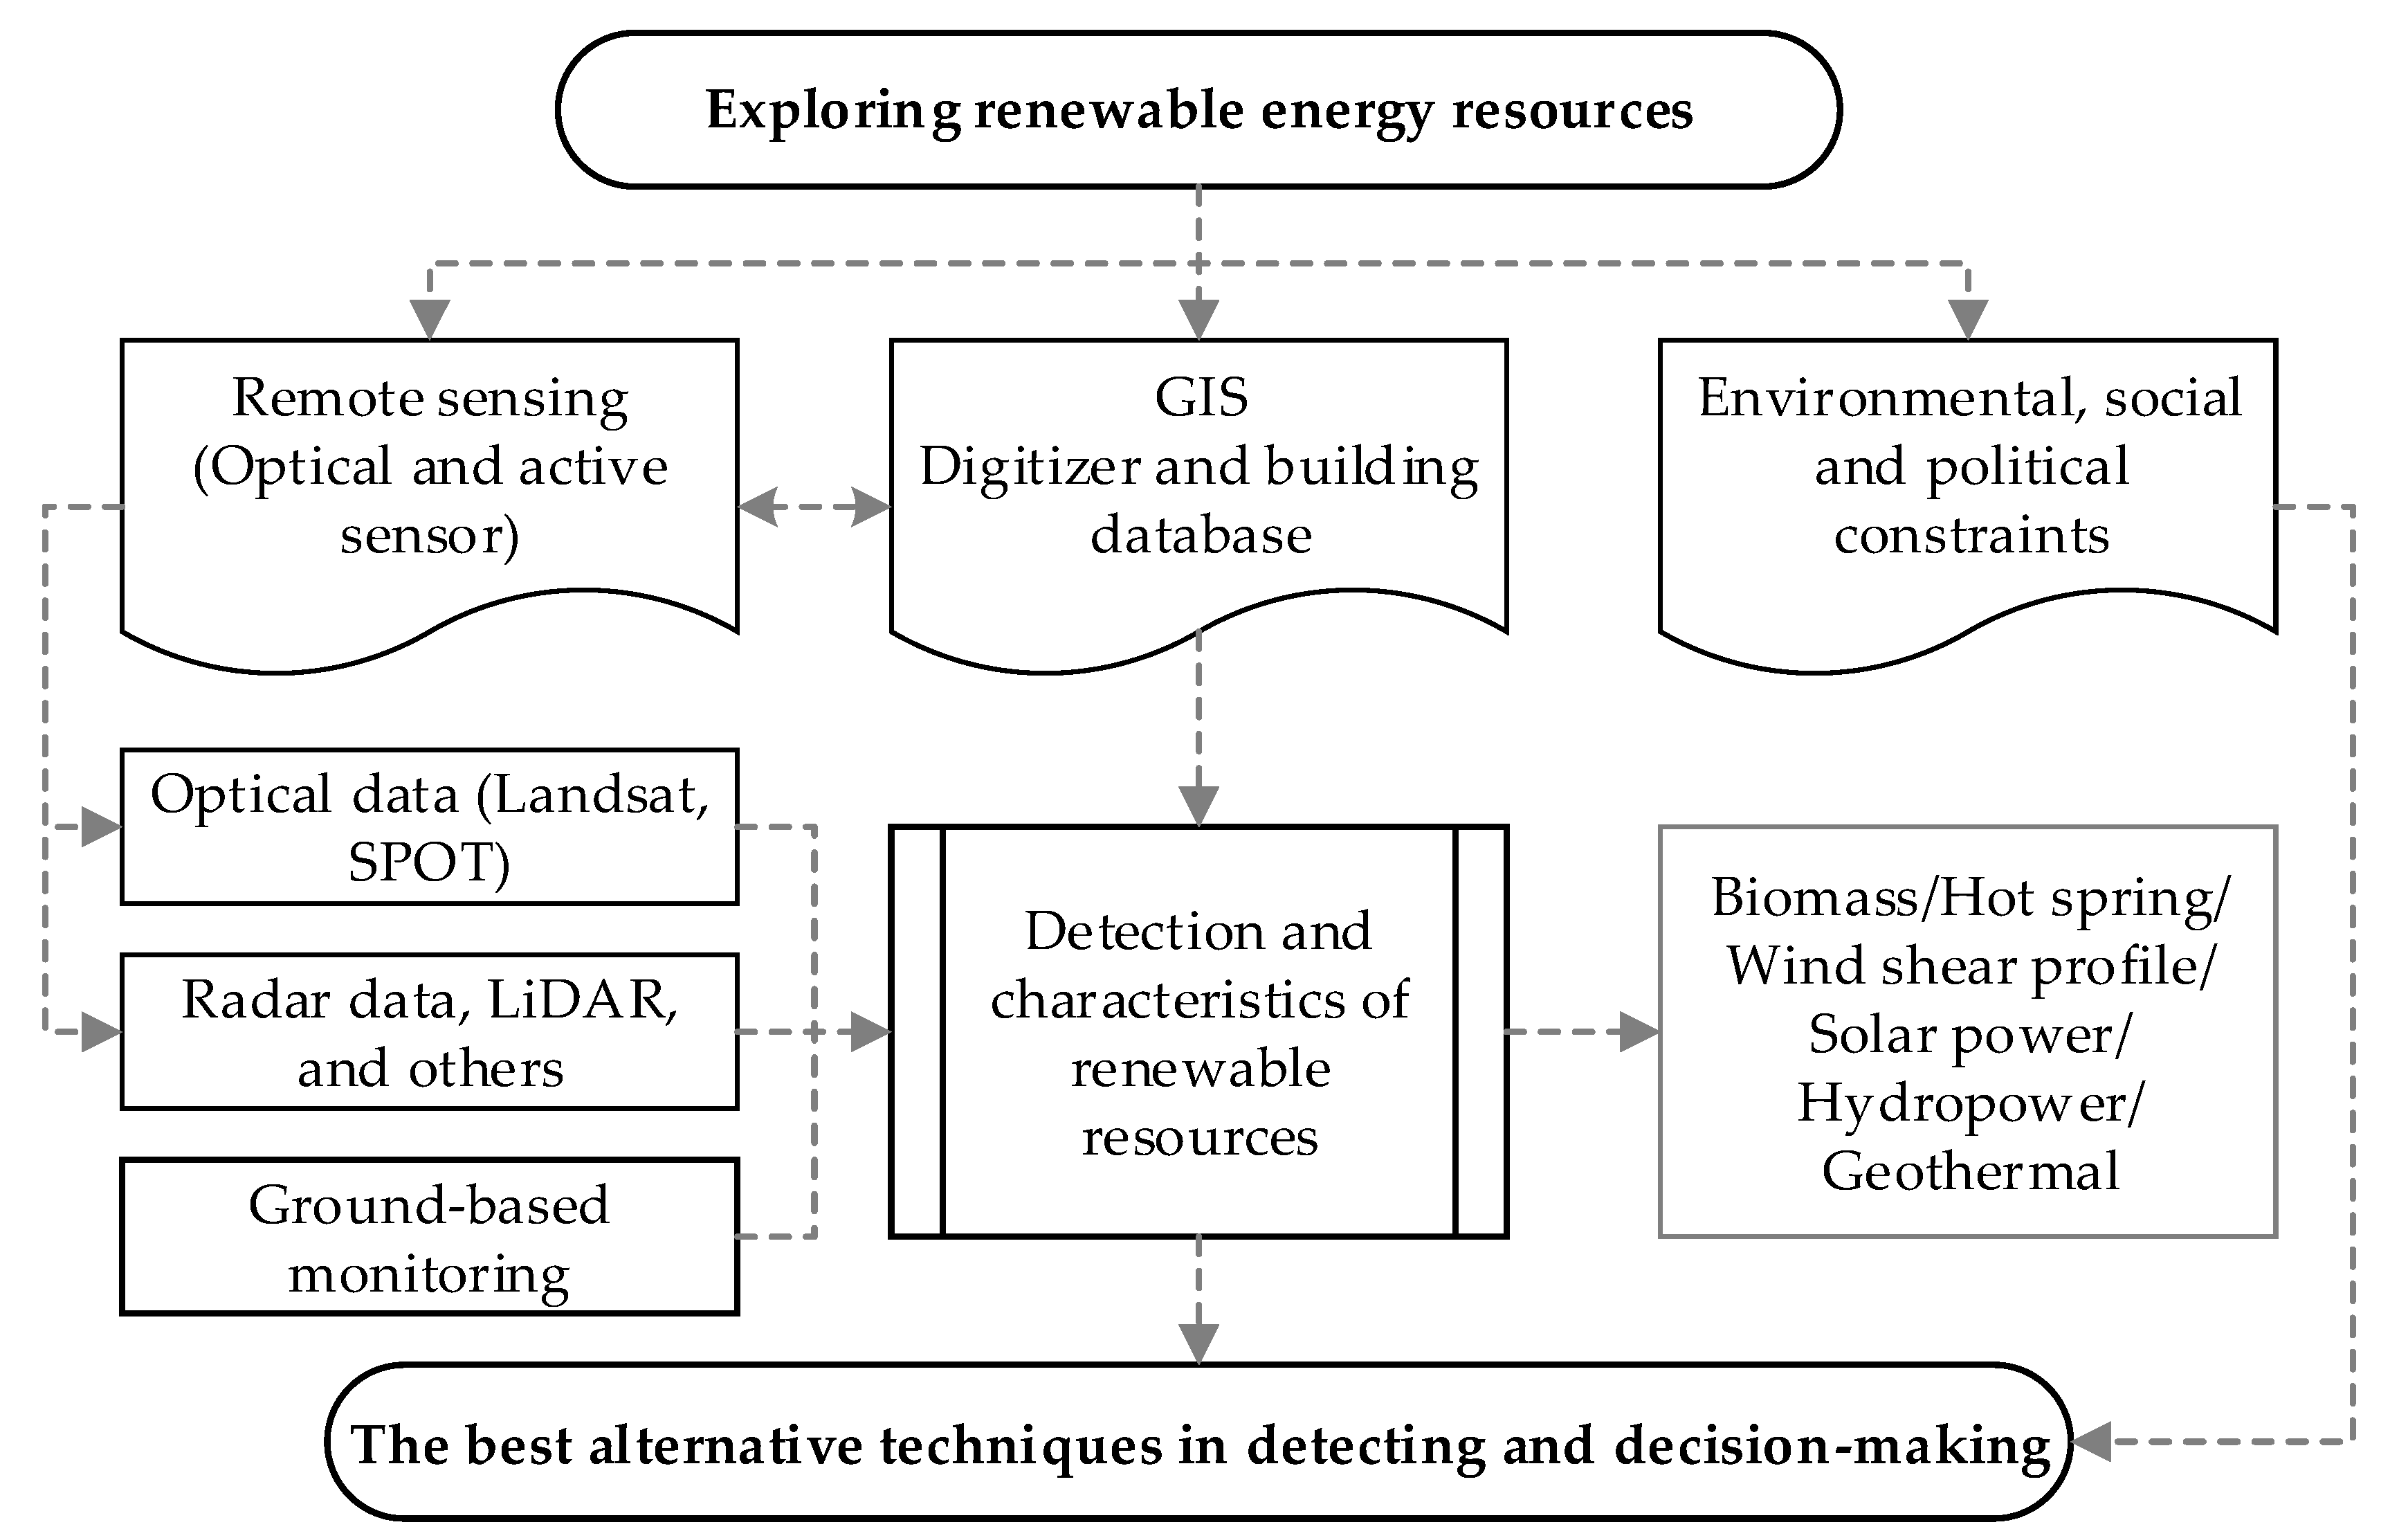
4. Role of Remote Sensing and GIS in Exploring Renewable Energy Resources
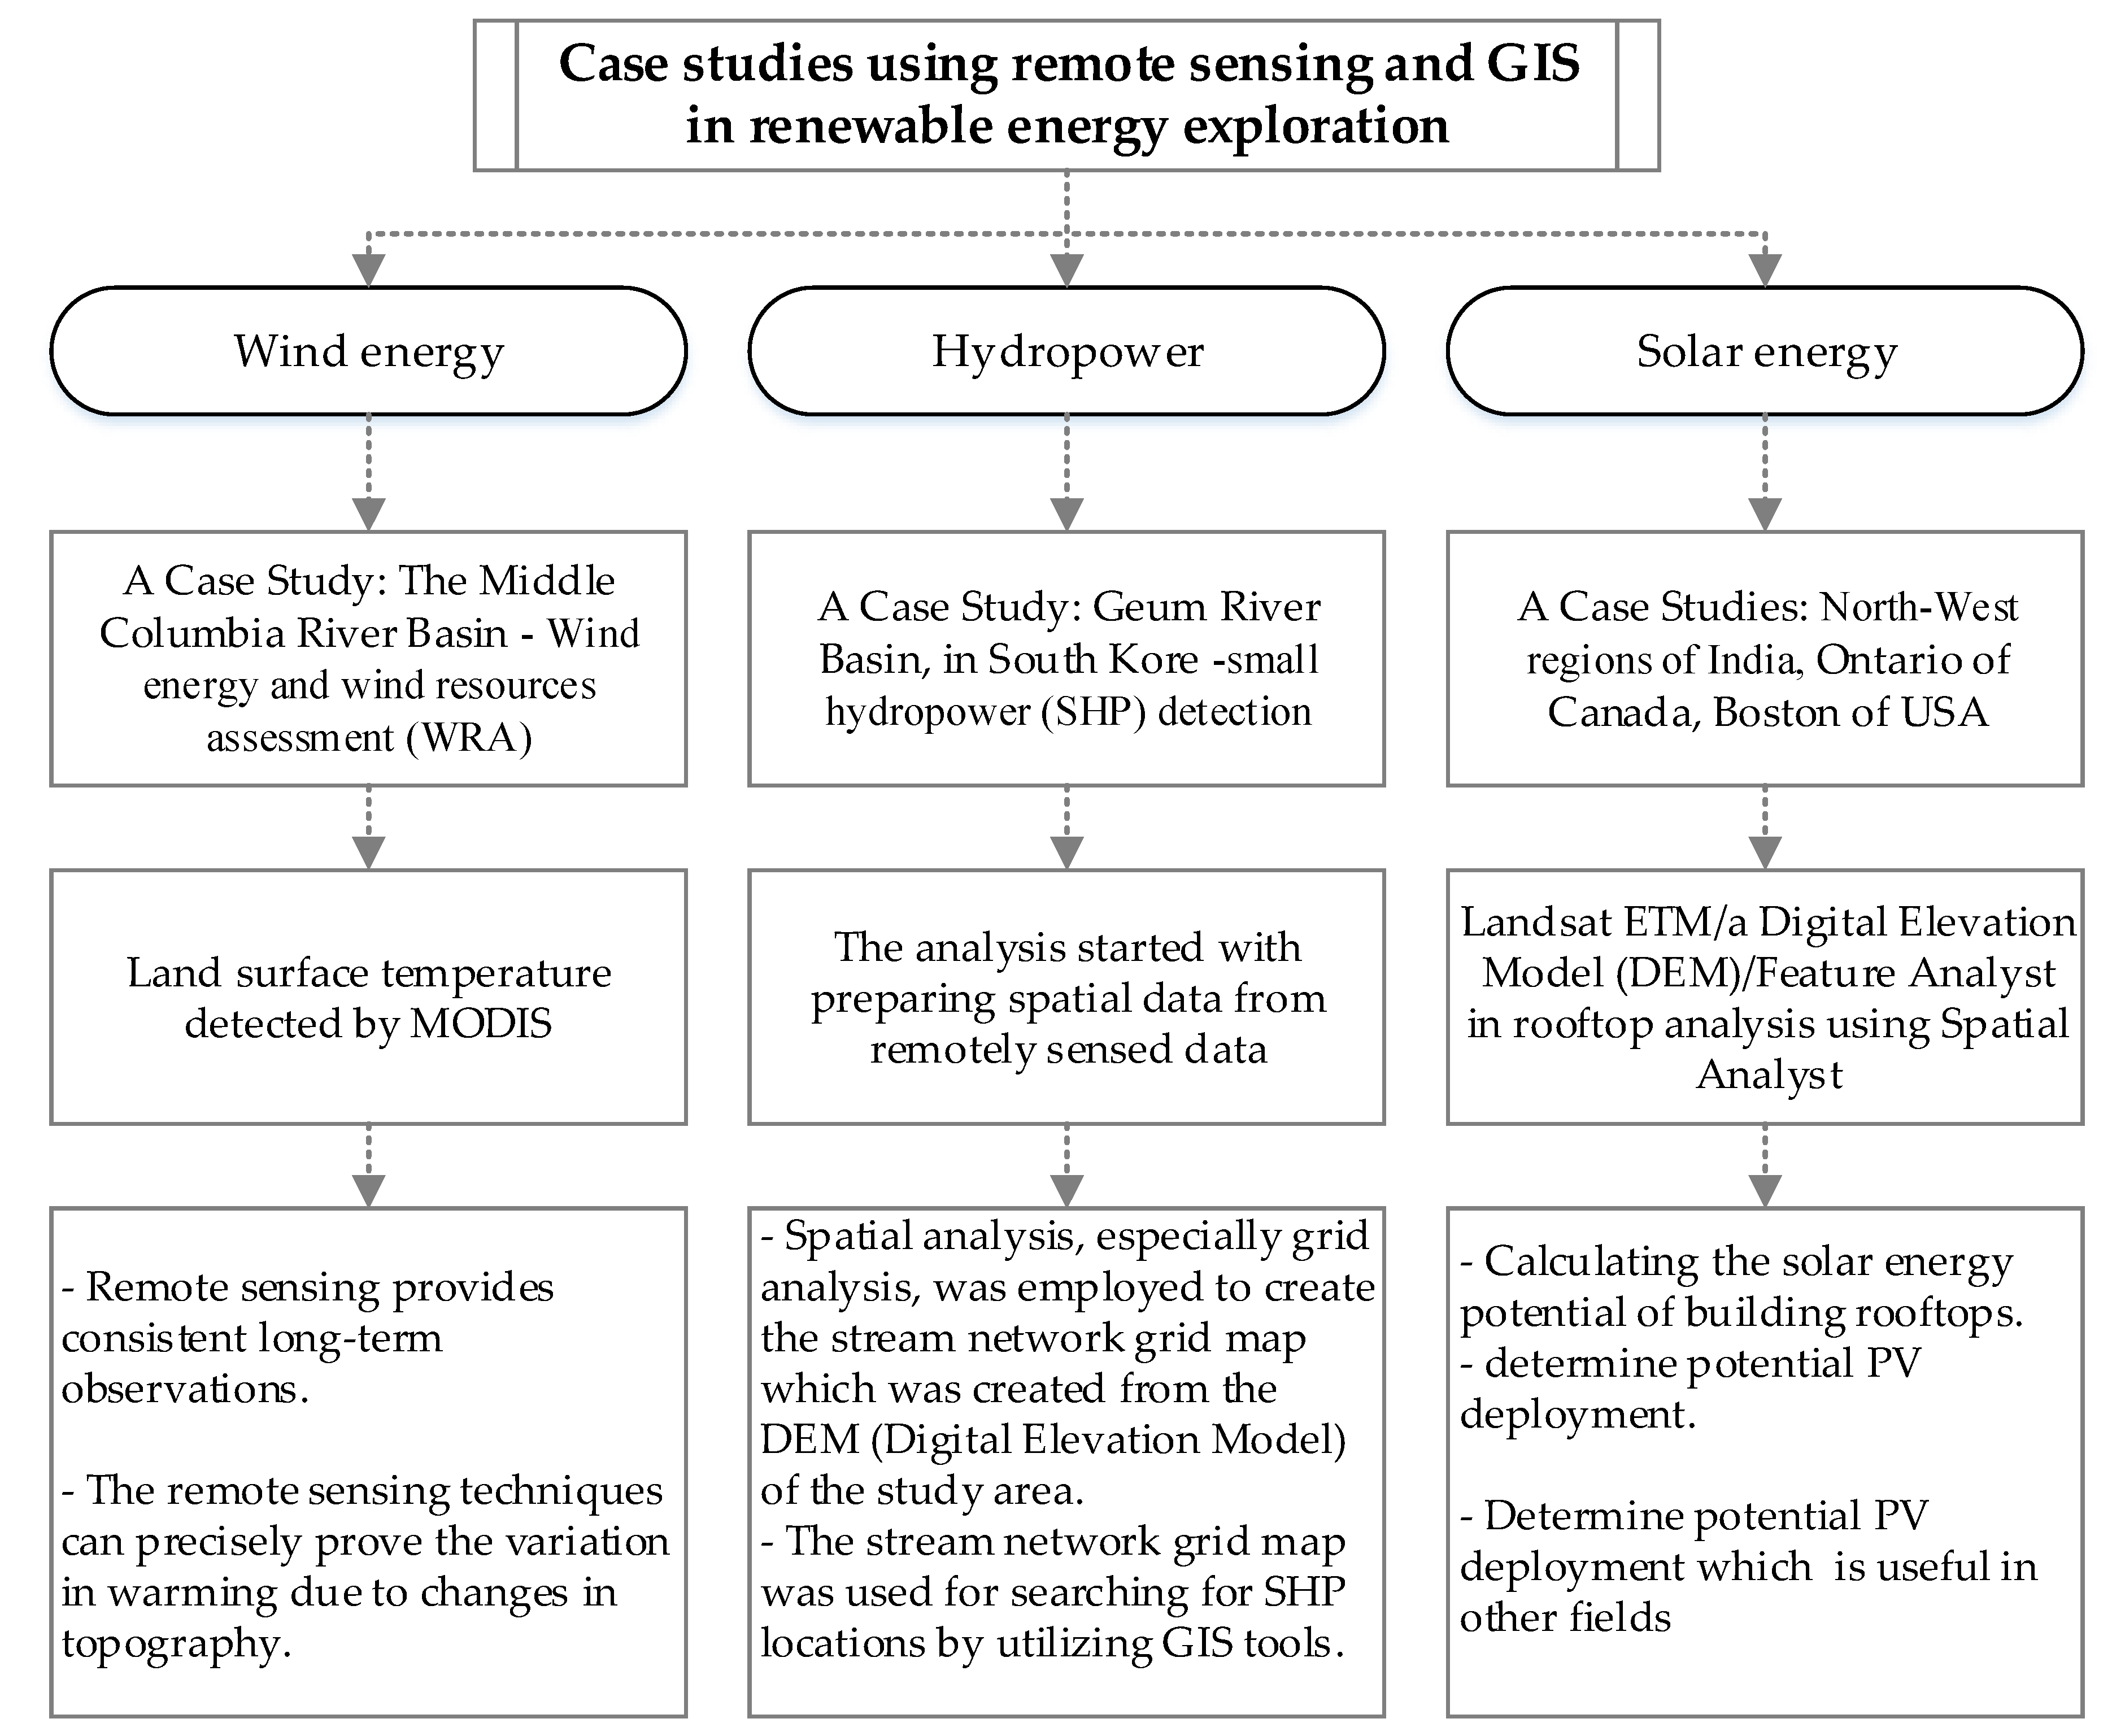
5. Cases Studies
5.1. Wind Energy Case Studies
- Stage 1: The rasters were manually converted to a binary scale using the reclassify tool. The buffer zone was segregated. The output was then combined into a single layer.
- Stage 2: All the layers obtained were re-classified to a scale which were compatible with weighted overlay.
5.2. The Series Small Hydropower (SHP) Detection Case Studies
5.3. The Solar Energy Case Studies
6. Discussion
7. Conclusions
Author Contributions
Funding
Acknowledgments
Conflicts of Interest
References
- Ellabban, O.; Abu-Rub, H.; Blaabjerg, F. Renewable energy resources: Current status, future prospects and their enabling technology. Renew. Sustain. Energy Rev. 2014, 39, 748–764. [Google Scholar] [CrossRef]
- Avtar, R.; Tripathi, S.; Aggarwal, A.K.; Kumar, P. Assessment of Energy-Population-Urbanization Nexus with Changing Energy Industry Scenario in India. Land 2019, 8, 124. [Google Scholar] [CrossRef]
- Avtar, R.; Tripathi, S.; Aggarwal, A.K.; Kumar, P. Population-Urbanization-Energy Nexus: A Review. Resources 2019, 8, 136. [Google Scholar] [CrossRef]
- Akhtar, F.; Rehmani, M.H. Energy replenishment using renewable and traditional energy resources for sustainable wireless sensor networks: A review. Renew. Sustain. Energy Rev. 2015, 45, 769–784. [Google Scholar] [CrossRef]
- Bhattacharya, M.; Paramati, S.R.; Ozturk, I.; Bhattacharya, S. The effect of renewable energy consumption on economic growth: Evidence from top 38 countries. Appl. Energy 2016, 162, 733–741. [Google Scholar] [CrossRef]
- van der Meer, F.; Hecker, C.; van Ruitenbeek, F.; van der Werff, H.; de Wijkerslooth, C.; Wechsler, C. Geologic remote sensing for geothermal exploration: A review. Int. J. Appl. Earth Obs. Geoinf. 2014, 33, 255–269. [Google Scholar] [CrossRef]
- Forsberg, C.W. Sustainability by combining nuclear, fossil, and renewable energy sources. Prog. Nucl. Energy 2009, 51, 192–200. [Google Scholar] [CrossRef]
- Lund, J.W.; Bjelm, L.; Bloomquist, G.; Mortensen, A.K. Characteristics, development, and utilization of geothermal resources. In Geo-Heat Center Bulletin; Oregon Institute of Technology: Klamath Falls, OR, USA, 2007. [Google Scholar]
- Pruess, K. Enhanced geothermal systems (EGS) using CO2 as working fluid—A novel approach for generating renewable energy with simultaneous sequestration of carbon. Geothermics 2006, 35, 351–367. [Google Scholar] [CrossRef]
- Martini, B.; Silver, E.; Pickles, W.; Cocks, P. Hyperspectral Mineral Mapping in Support of Geothermal Exploration: Examples from Long Valley Caldera, CA and Dixie Valley, NV, USA; Lawrence Livermore National Lab. (LLNL): Livermore, CA, USA, 2003; Volume 27. [Google Scholar]
- Karthikeya, B.R.; Negi, P.S.; Srikanth, N. Wind resource assessment for urban renewable energy application in Singapore. Renew. Energy 2016, 87, 403–414. [Google Scholar] [CrossRef]
- Lukač, N.; Žlaus, D.; Seme, S.; Žalik, B.; Štumberger, G. Rating of roofs’ surfaces regarding their solar potential and suitability for PV systems, based on LiDAR data. Appl. Energy 2013, 102, 803–812. [Google Scholar] [CrossRef]
- Kilic, G.; Unluturk, M.S. Testing of wind turbine towers using wireless sensor network and accelerometer. Renew. Energy 2015, 75, 318–325. [Google Scholar] [CrossRef]
- Johannessen, O.; Korsbakken, E. Determination of wind energy from SAR images for siting windmill locations. Earth Obs. Q. 1998, 59, 2–4. [Google Scholar]
- Zhang, H.; Wang, J.; Xie, Y.; Yao, G.; Yan, Z.; Huang, L.; Chen, S.; Pan, T.; Wang, L.; Su, Y.; et al. Self-Powered, Wireless, Remote Meteorologic Monitoring Based on Triboelectric Nanogenerator Operated by Scavenging Wind Energy. ACS Appl. Mater. Interfaces 2016, 8, 32649–32654. [Google Scholar] [CrossRef] [PubMed]
- Harris, R.; Zhou, L.; Xia, G. Satellite observations of wind farm impacts on nocturnal land surface temperature in iowa. Remote Sens. 2014, 6, 12234–12246. [Google Scholar] [CrossRef]
- Kim, D.; Kim, T.; Oh, G.; Huh, J.; Ko, K. A comparison of ground-based LiDAR and met mast wind measurements for wind resource assessment over various terrain conditions. J. Wind Eng. Ind. Aerodyn. 2016, 158, 109–121. [Google Scholar] [CrossRef]
- Mikkelsen, T.; Angelou, N.; Hansen, K.; Sjöholm, M.; Harris, M.; Slinger, C.; Hadley, P.; Scullion, R.; Ellis, G.; Vives, G. A spinner-integrated wind lidar for enhanced wind turbine control: Spinner-integrated wind lidar for enhanced steering and control. Wind Energy 2013, 16, 625–643. [Google Scholar] [CrossRef]
- Shen, G.; Xu, B.; Jin, Y.; Chen, S.; Zhang, W.; Guo, J.; Liu, H.; Zhang, Y.; Yang, X. Monitoring wind farms occupying grasslands based on remote-sensing data from China’s GF-2 HD satellite—A case study of Jiuquan city, Gansu province, China. Resour. Conserv. Recycl. 2017, 121, 128–136. [Google Scholar] [CrossRef]
- Lovett, A.A.; Sünnenberg, G.M.; Richter, G.M.; Dailey, A.G.; Riche, A.B.; Karp, A. Land Use Implications of Increased Biomass Production Identified by GIS-Based Suitability and Yield Mapping for Miscanthus in England. BioEnergy Res. 2009, 2, 17–28. [Google Scholar] [CrossRef]
- Lefsky, M.A.; Cohen, W.B.; Harding, D.J.; Parker, G.G.; Acker, S.A.; Gower, S.T. Lidar remote sensing of above-ground biomass in three biomes. Glob. Ecol. Biogeogr. 2002, 11, 393–399. [Google Scholar] [CrossRef] [Green Version]
- Kumar, L.; Mutanga, O. Remote Sensing of Above-Ground Biomass. Remote Sens. 2017, 9, 935. [Google Scholar] [CrossRef]
- Voivontas, D.; Assimacopoulos, D.; Koukios, E. Aessessment of biomass potential for power production: A GIS based method. Biomass Bioenergy 2001, 20, 101–112. [Google Scholar] [CrossRef]
- Le Toan, T.; Beaudoin, A.; Riom, J.; Guyon, D. Relating forest biomass to SAR data. IEEE Trans. Geosci. Remote Sens. 1992, 30, 403–411. [Google Scholar] [CrossRef]
- Roy, P.S.; Ravan, S.A. Biomass estimation using satellite remote sensing data—An investigation on possible approaches for natural forest. J. Biosci. 1996, 21, 535–561. [Google Scholar] [CrossRef]
- Shi, X.; Elmore, A.; Li, X.; Gorence, N.J.; Jin, H.; Zhang, X.; Wang, F. Using spatial information technologies to select sites for biomass power plants: A case study in Guangdong Province, China. Biomass Bioenergy 2008, 32, 35–43. [Google Scholar] [CrossRef]
- Evans, A.M.; Finkral, A.J. From renewable energy to fire risk reduction: A synthesis of biomass harvesting and utilization case studies in US forests. GCB Bioenergy 2009, 1, 211–219. [Google Scholar] [CrossRef]
- Juwarkar, A.A.; Varghese, A.O.; Singh, S.K.; Aher, V.V.; Thawale, P.R. Carbon sequestration potential in above ground biomass of natural reserve forest of Central India. Int. J. Agric. Res. Rev. 2011, 1, 80–86. [Google Scholar]
- Avtar, R.; Suzuki, R.; Takeuchi, W.; Sawada, H. PALSAR 50 m Mosaic Data Based National Level Biomass Estimation in Cambodia for Implementation of REDD+ Mechanism. PLoS ONE 2013, 8, e74807. [Google Scholar] [CrossRef] [PubMed]
- Kusre, B.; Baruah, D.; Bordoloi, P.; Patra, S. Assessment of hydropower potential using GIS and hydrological modeling technique in Kopili River basin in Assam (India). Appl. Energy 2010, 87, 298–309. [Google Scholar] [CrossRef]
- Biggs, D.; Miller, F.; Hoanh, C.T.; Molle, F. The delta machine: Water management in the Vietnamese Mekong Delta in historical and contemporary perspectives. In Contested Waterscapes in the Mekong Region; Hydropower, Livelihoods and Governance; Routledge: Abingdon-on-Thames, UK, 2009; pp. 203–225. [Google Scholar]
- Kratt, C.; Calvin, W.M.; Coolbaugh, M.F. Mineral mapping in the Pyramid Lake basin: Hydrothermal alteration, chemical precipitates and geothermal energy potential. Remote Sens. Environ. 2010, 114, 2297–2304. [Google Scholar] [CrossRef]
- Vaughan, R.G.; Keszthelyi, L.P.; Lowenstern, J.B.; Jaworowski, C.; Heasler, H. Use of ASTER and MODIS thermal infrared data to quantify heat flow and hydrothermal change at Yellowstone National Park. J. Volcanol. Geotherm. Res. 2012, 233, 72–89. [Google Scholar] [CrossRef]
- Al-Mukhtar, M.; Al-Yaseen, F. Modeling Water Quality Parameters Using Data-Driven Models, a Case Study Abu-Ziriq Marsh in South of Iraq. Hydrology 2019, 6, 24. [Google Scholar] [CrossRef]
- Datta, A.; Karakoti, I. Solar resource assessment using GIS & remote Sensing techniques. ESRI India 2010, 9560272741, 1–20. [Google Scholar]
- Wiginton, L.K.; Nguyen, H.T.; Pearce, J.M. Quantifying rooftop solar photovoltaic potential for regional renewable energy policy. Comput. Environ. Urban Syst. 2010, 34, 345–357. [Google Scholar] [CrossRef] [Green Version]
- Wan, C.; Zhao, J.; Song, Y.; Xu, Z.; Lin, J.; Hu, Z. Photovoltaic and solar power forecasting for smart grid energy management. CSEE Power Energy Syst. 2015, 1, 38–46. [Google Scholar] [CrossRef]
- Kazem, H.A.; Yousif, J.H.; Chaichan, M.T. Modelling of Daily Solar Energy System Prediction using Support Vector Machine for Oman. Int. J. Appl. Eng. Res. 2016, 11, 10166–10172. [Google Scholar]
- Cano, D.; Monget, J.M.; Albuisson, M.; Guillard, H.; Regas, N.; Wald, L. A method for the determination of the global solar radiation from meteorological satellite data. Sol. Energy 1986, 37, 31–39. [Google Scholar] [CrossRef] [Green Version]
- Szabó, S.; Enyedi, P.; Horváth, M.; Kovács, Z.; Burai, P.; Csoknyai, T.; Szabó, G. Automated registration of potential locations for solar energy production with Light Detection And Ranging (LiDAR) and small format photogrammetry. J. Clean. Prod. 2016, 112, 3820–3829. [Google Scholar] [CrossRef]
- Dolor, F.M. Phases of geothermal development in the Philippines. In Workshop for Decision Makers on Geothermal Projects and their Management; UNU-GTP: Reykjavík, Iceland, 2005; pp. 14–18. [Google Scholar]
- Baniyounes, A.M. Renewable Energy Potential in Jordan. Int. J. Appl. Eng. Res. 2017, 12, 8323–8331. [Google Scholar]
- Basaran, S.T.; Dogru, A.O.; Balcik, F.B.; Ulugtekin, N.N.; Goksel, C.; Sozen, S. Assessment of renewable energy potential and policy in Turkey–Toward the acquisition period in European Union. Environ. Sci. Policy 2015, 46, 82–94. [Google Scholar] [CrossRef]
- Barbier, E. Geothermal energy technology and current status: An overview. Renew. Sustain. Energy Rev. 2002, 6, 3–65. [Google Scholar] [CrossRef]
- Kana, J.D.; Djongyang, N.; Raïdandi, D.; Nouck, P.N.; Dadjé, A. A review of geophysical methods for geothermal exploration. Renew. Sustain. Energy Rev. 2015, 44, 87–95. [Google Scholar] [CrossRef]
- üyüközkan, G.; Feyzioğlu, O.; Nebol, E. Selection of the strategic alliance partner in logistics value chain. Int. J. Prod. Econ. 2008, 113, 148–158. [Google Scholar] [CrossRef]
- Mongillo, M.; Cochrane, G.; Browne, P.; Deroin, J. Application of satellite imagery to explore and monitor geothermal systems. In Proceedings of the World Geothermal Congress, Florence, Italy, 18–31 May 1995; Volume 1, pp. 951–956. [Google Scholar]
- Vasco, D.W.; Johnson, L.R.; Goldstein, N.E. Using surface displacement and strain observations to determine deformation at depth, with an application to Long Valley Caldera, California. J. Geophys. Res. 1988, 93, 3232. [Google Scholar] [CrossRef]
- Mia, B.; Fujimitsu, Y. Mapping hydrothermal altered mineral deposits using Landsat 7 ETM+ image in and around Kuju volcano, Kyushu, Japan. J. Earth Syst. Sci 2012, 121, 1049–1057. [Google Scholar] [CrossRef] [Green Version]
- Reath, K.A.; Ramsey, M.S. Exploration of geothermal systems using hyperspectral thermal infrared remote sensing. J. Volcanol. Geotherm. Res. 2013, 265, 27–38. [Google Scholar] [CrossRef]
- Kruse, F.A. Mapping surface mineralogy using imaging spectrometry. Geomorphology 2012, 137, 41–56. [Google Scholar] [CrossRef]
- Lin, H.; Xu, Q.; Zheng, Q. An overview on SAR measurements of sea surface wind. Prog. Nat. Sci. 2008, 18, 913–919. [Google Scholar] [CrossRef]
- Calaudi, R.; Arena, F.; Badger, M.; Sempreviva, A.M. Offshore wind mapping mediterranean area using SAR. Energy Procedia 2013, 40, 38–47. [Google Scholar] [CrossRef]
- Millward-Hopkins, J.T.; Tomlin, A.S.; Ma, L.; Ingham, D.B.; Pourkashanian, M. Assessing the potential of urban wind energy in a major UK city using an analytical model. Renew. Energy 2013, 60, 701–710. [Google Scholar] [CrossRef] [Green Version]
- Lukač, N.; Štumberger, G.; Žalik, B. Wind resource assessment using airborne LiDAR data and smoothed particle hydrodynamics. Environ. Model. Softw. 2017, 95, 1–12. [Google Scholar] [CrossRef]
- Avtar, R.; Suzuki, R.; Sawada, H. Natural Forest Biomass Estimation Based on Plantation Information Using PALSAR Data. PLoS ONE 2014, 9, e86121. [Google Scholar] [CrossRef] [PubMed]
- Harrison, J.D. Tool for Preliminary Site-Suitability Analysis. Master’s Thesis, University of Southern California, Los Angeles, CA, USA, August 2012. [Google Scholar]
- Yi, C.S.; Lee, J.H.; Shim, M.P. Site location analysis for small hydropower using geo-spatial information system. Renew. Energy 2010, 35, 852–861. [Google Scholar] [CrossRef]
- Jakubiec, J.A.; Reinhart, C.F. A method for predicting city-wide electricity gains from photovoltaic panels based on LiDAR and GIS data combined with hourly Daysim simulations. Solar Energy 2013, 93, 127–143. [Google Scholar] [CrossRef]
- Catita, C.; Redweik, P.; Pereira, J.; Brito, M.C. Extending solar potential analysis in buildings to vertical facades. Comput. Geosci. 2014, 66, 1–12. [Google Scholar] [CrossRef]
- Jacovides, C.P.; Tymvios, F.S.; Assimakopoulos, V.D.; Kaltsounides, N.A. Comparative study of various correlations in estimating hourly diffuse fraction of global solar radiation. Renew. Energy 2006, 31, 2492–2504. [Google Scholar] [CrossRef]
- Norman, S.E. Solar Penetration Indicator; Patent and Trademark Office: Washington, DC, USA, 1959. [Google Scholar]
- Hammer, A.; Heinemann, D.; Hoyer, C.; Toggweiler, P.; Brügger, U.; Reise, C.; Wiemken, E.; Beyer, H.G.; van Dijk, V.; Betcke, J. Surveillance of Photovoltaic Solar Energy Systems Using METEOSAT Derived Irradiances. In Proceedings of the EUMETSAT Meteorological Satellite Data Users’ Conference, Bologna, Italy, 29 May–2 June 2000; pp. 613–618. [Google Scholar]
- Environmental Systems Research Institute (esri). Boston Showcases Solar Power Potential with Web GIS. Available online: https://www.esri.com/news/arcnews/fall08articles/boston-showcases.html (accessed on 30 June 2019).
- Coolbaugh, M.F.; Kratt, C.; Fallacaro, A.; Calvin, W.M.; Taranik, J.V. Detection of geothermal anomalies using Advanced Spaceborne Thermal Emission and Reflection Radiometer (ASTER) thermal infrared images at Bradys Hot Springs, Nevada, USA. Remote Sens. Environ. 2007, 106, 350–359. [Google Scholar] [CrossRef]
- Gutiérrez, F.J.; Lemus, M.; Parada, M.A.; Benavente, O.M.; Aguilera, F.A. Contribution of ground surface altitude difference to thermal anomaly detection using satellite images: Application to volcanic/geothermal complexes in the Andes of Central Chile. J. Volcanol. Geotherm. Res. 2012, 237, 69–80. [Google Scholar] [CrossRef]
- Vaughan, R.G.; Keszthelyi, L.P.; Davies, A.G.; Schneider, D.J.; Jaworowski, C.; Heasler, H. Exploring the limits of identifying sub-pixel thermal features using ASTER TIR data. J. Volcanol. Geotherm. Res. 2010, 189, 225–237. [Google Scholar] [CrossRef]
- Qin, Q.; Zhang, N.; Nan, P.; Chai, L. Geothermal area detection using Landsat ETM+ thermal infrared data and its mechanistic analysis—A case study in Tengchong, China. Int. J. Appl. Earth Obs. Geoinf. 2011, 13, 552–559. [Google Scholar] [CrossRef]
- Haselwimmer, C.; Prakash, A.; Holdmann, G. Quantifying the heat flux and outflow rate of hot springs using airborne thermal imagery: Case study from Pilgrim Hot Springs, Alaska. Remote Sens. Environ. 2013, 136, 37–46. [Google Scholar] [CrossRef] [Green Version]
- Watson, F.G.R.; Lockwood, R.E.; Newman, W.B.; Anderson, T.N.; Garrott, R.A. Development and comparison of Landsat radiometric and snowpack model inversion techniques for estimating geothermal heat flux. Remote Sens. Environ. 2008, 112, 471–481. [Google Scholar] [CrossRef]
- Savage, S.L.; Lawrence, R.L.; Custer, S.G.; Jewett, J.T.; Powell, S.L.; Shaw, J.A. Review of alternative methods for estimating terrestrial emittance and geothermal heat flux for Yellowstone National Park using landsat imagery. GIScience Remote Sens. 2010, 47, 460–479. [Google Scholar] [CrossRef]
- Mia, M.B.; Bromley, C.J.; Fujimitsu, Y. Monitoring heat flux using Landsat TM/ETM+ thermal infrared data—A case study at Karapiti (‘Craters of the Moon’) thermal area, New Zealand. J. Volcanol. Geotherm. Res. 2012, 235–236, 1–10. [Google Scholar] [CrossRef]
- Boothroyd, I.K.G. Ecological characteristics and management of geothermal systems of the Taupo Volcanic Zone, New Zealand. Geothermics 2009, 38, 200–209. [Google Scholar] [CrossRef]
- Nash, G.D.; Moore, J.N.; Sperry, T. Vegetal-spectral anomaly detection at the Cove Fort-Sulphurdale thermal anomaly, Utah, USA: Implications for use in geothermal exploration. Geothermics 2003, 32, 109–130. [Google Scholar] [CrossRef]
- Fialko, Y.; Simons, M. Deformation and seismicity in the Coso geothermal area, Inyo County, California: Observations and modeling using satellite radar interferometry. J. Geophys. Res. Solid Earth 2000, 105, 21781–21793. [Google Scholar] [CrossRef] [Green Version]
- Carnec, C.; Fabriol, H. Monitoring and modeling land subsidence at the Cerro Prieto Geothermal Field, Baja California, Mexico, using SAR interferometry. Geophys. Res. Lett. 1999, 26, 1211–1214. [Google Scholar] [CrossRef]
- Sarychikhina, O.; Glowacka, E.; Mellors, R.; Vidal, F.S. Land subsidence in the Cerro Prieto Geothermal Field, Baja California, Mexico, from 1994 to 2005: An integrated analysis of DInSAR, leveling and geological data. J. Volcanol. Geotherm. Res. 2011, 204, 76–90. [Google Scholar] [CrossRef]
- Lubitz, C.; Motagh, M.; Wetzel, H.U.; Kaufmann, H. Remarkable urban. uplift in staufen im Breisgau, Germany: Observations from TerraSAR-X InSAR and leveling from 2008 to 2011. Remote Sens. 2013, 5, 3082–3100. [Google Scholar] [CrossRef]
- Sass, I.; Burbaum, U. Damage to the historic town of Staufen (Germany) caused by geothermal drillings through anhydrite-bearing formations. Acta Carsologica 2010, 39. [Google Scholar] [CrossRef] [Green Version]
- García-Martín, A.; de la Riva, J.; Pérez-Cabello, F.; Montorio, R. Using remote sensing to estimate a renewable resource: Forest residual biomass. In Remote Sensing of Biomass-Principles and Applications; IntechOpen: London, UK, 2012. [Google Scholar]
- Lefsky, M.A.; Cohen, W.B.; Parker, G.G.; Harding, D.J. Lidar Remote Sensing for Ecosystem Studies. BioScience 2014, 52, 19–30. [Google Scholar] [CrossRef]


| No. | Renewable Energy | Remote Sensing | Results | Recommendations |
|---|---|---|---|---|
| 1 |
|
|
|
|
| ||||
| ||||
| 2 |
|
|
|
|
| 3 |
|
|
|
|
| 4 |
|
|
| |
| 5 |
|
|
|
|
| 6 |
|
|
|
|
| No. | Renewable Energy | Remote Sensing | Results | Recommendations |
|---|---|---|---|---|
| Wind | ||||
| 1 |
|
|
|
|
| 2 |
|
|
|
|
| 3 |
|
|
|
|
| Biomass | ||||
| 4 |
|
|
|
|
| Solar | ||||
| 5 |
|
|
|
|
| 6 |
|
|
| |
| Hydropower | ||||
| 7 |
|
|
|
|
© 2019 by the authors. Licensee MDPI, Basel, Switzerland. This article is an open access article distributed under the terms and conditions of the Creative Commons Attribution (CC BY) license (http://creativecommons.org/licenses/by/4.0/).
Share and Cite
Avtar, R.; Sahu, N.; Aggarwal, A.K.; Chakraborty, S.; Kharrazi, A.; Yunus, A.P.; Dou, J.; Kurniawan, T.A. Exploring Renewable Energy Resources Using Remote Sensing and GIS—A Review. Resources 2019, 8, 149. https://doi.org/10.3390/resources8030149
Avtar R, Sahu N, Aggarwal AK, Chakraborty S, Kharrazi A, Yunus AP, Dou J, Kurniawan TA. Exploring Renewable Energy Resources Using Remote Sensing and GIS—A Review. Resources. 2019; 8(3):149. https://doi.org/10.3390/resources8030149
Chicago/Turabian StyleAvtar, Ram, Netrananda Sahu, Ashwani Kumar Aggarwal, Shamik Chakraborty, Ali Kharrazi, Ali P. Yunus, Jie Dou, and Tonni Agustiono Kurniawan. 2019. "Exploring Renewable Energy Resources Using Remote Sensing and GIS—A Review" Resources 8, no. 3: 149. https://doi.org/10.3390/resources8030149
APA StyleAvtar, R., Sahu, N., Aggarwal, A. K., Chakraborty, S., Kharrazi, A., Yunus, A. P., Dou, J., & Kurniawan, T. A. (2019). Exploring Renewable Energy Resources Using Remote Sensing and GIS—A Review. Resources, 8(3), 149. https://doi.org/10.3390/resources8030149