Article

Performance of Remotely Sensed Soil Moisture for Temporal and Spatial Analysis of Rainfall over São Francisco River Basin, Brazil

1
Postgraduate Program in Environmental Sciences, State University of Pará (UEPA), Belém 66095-100, Brazil
2
Earth Sciences Institute (ICT) and Faculty of Sciences (FCUP), University of Porto, 4169-007 Porto, Portugal
*
Author to whom correspondence should be addressed.
Geosciences 2019, 9(3), 144; https://doi.org/10.3390/geosciences9030144
Submission received: 30 January 2019 / Revised: 20 March 2019 / Accepted: 22 March 2019 / Published: 26 March 2019
(This article belongs to the Special Issue Remote Sensing used in Environmental Hydrology)

Abstract

:
Variability in precipitation patterns in the northeast and southeast regions of Brazil are complex, and the combined effects of the Tropical Atlantic, Pacific Niños, and local characteristics influence the precipitation rates. This study assesses the performance of multi-satellite precipitation product SM2RAIN-Climate Change Initiative (SM2RAIN-CCI) for the period of 1998–2015 at monthly scale. To accomplish this aim, various statistical analyses and comparison of multi-satellite precipitation analysis products with rain gauge stations are carried out. In addition, we used three values corresponding to extreme events: The total daily precipitation (PRCPTOT) and the number of consecutive dry/wet days (CDD/CWD). Results reveal that monthly rainfall data from SM2RAIN-CCI are compatible with surface observations, showing a seasonal pattern typical of the region. Data correlate well with observations for the selected stations (r ≥ 0.85) but tend to overestimate high rainfall values (>80 mm/month) in the rainy area. There is a significant decrease in rainfall to the indices, especially in PRCPTOT during the occurrence of tropical ocean–atmosphere interactions, reflecting CWD and CDD values. Moreover, our findings also indicate a relationship, at interannual timescales, between the state of El Niño Southern-Oscillation (ENSO) and Tropical Atlantic (TA) annual precipitation variability from 1998 to 2015. The SM2RAIN-CCI could be a useful alternative for rain-gauge precipitation data in the São Francisco River basin.

1. Introduction

Changes in hydrological cycles are expected in the context of global climate changes. In South America, specifically, there is a diversity of precipitation, temperature, and wind patterns which characterises the climate and climate variability over the region [1]. From these, precipitation is one of the most critical and complex climate variables regarding global distribution and variability, and its monitoring continues to represent a great challenge for the scientific community, mainly due to its spatio-temporal variations in intensity and duration [2,3,4,5].
Traditionally measured by ground stations, precipitation data is of utmost importance for water resources assessment, agricultural production, and decision making on extreme events of floods or droughts [6]. However, in several regions around the world, ground stations are not very well distributed across large areas, with some of them located in relatively remote areas where maintenance and data extraction are not frequent. In such cases and at large scales, remotely sensed data and numerical predictions have helped to overcome the lack of meteorological stations, serving as an alternative source of time series data on global or regional scales and enabling event detection and decision-making with accurate and reliable information [7]. Significant improvements have been made related to this subject, when several national and international agencies and institutes started to produce satellite-based data sets through different procedures and algorithms. These products include the NOAA Climate Prediction Center (CPC) morphing technique CMORPH [8], NASA TRMM Multi-Satellite Precipitation Analysis (TMPA) [9], NASA Integrated MultisatellitE Retrievals for GPM (IMERG) [10], the precipitation estimation from remotely sensed information using artificial neural networks (PERSIANN) family of products [11] and, more recently, the rainfall product obtained from satellite soil moisture (SM) data through the soil moisture to rainfall (SM2RAIN) algorithm based on the inversion of the soil water balance equation [12]. SM2RAIN estimates the rainfall considering the change in time of the amount of water stored into the soil, thus considering it as a natural rain gauge [13,14]. Rather than use it to correct rainfall, as in Crow et al. [15] and Pellarin et al. [16], Brocca et al. [12] presented an approach to directly estimate rainfall. This algorithm can provide short-term precipitation with daily temporal resolution, and it has been applied at both local and global scales with ground and satellite SM data as input [17]. The satisfactory results obtained in these studies prove the SM2RAIN’s capability of estimating rainfall and eventually be a good alternative for locations where few rainfall measurements are observed, such as in large hydrographic basins. Therefore, to verify the suitability of the SM2RAIN data set in a region with still few applications as South America [18], the São Francisco River basin, located in Brazil, was selected as study area.
In the São Francisco River Basin, different aspects must be highlighted, such as the increase of population density, the increase of water demand in the coming years due to the expansion of irrigated areas, the implementation of Transposition Project, and the lack of policies and incentives for efficient water use [19]. Moreover, a possible influence of climate change in the near future over the local environment is currently a relevant concern. Episodes of extreme weather and climate events are likely to change in the twenty-first century due to anthropogenic climate change [20,21,22]. A possible scenario is an increase, in magnitude and frequency, of extreme precipitation events according to the Intergovernmental Panel on Climate Change (IPCC) [23].
Therefore, the key question addressed in this paper is whether the development of satellite remotely sensed datasets provides an opportunity to retrieve the spatio-temporal patterns of precipitation with high resolution in areas that have had few field observations. Specifically, this paper focuses on the performance evaluation of the satellite-derived SM product SM2RAIN-CCI over the São Francisco River basin, Brazil, and its capability to estimate rainfall accumulations over an extended period (18 years) including aspects related to ocean–atmosphere interaction and hydrological factors. Although the short period limits the representability of the temporal pattern in weather, this paper evaluates whether the rainfall satellite-derived SM can reflect the spatial patterns and seasonal variations in precipitation.

2. Materials and Methods

2.1. Study Area

The São Francisco River basin is located in the east of Brazil, occupies an area of approximately 640 km2, and covers six Brazilian states: Bahia, Minas Gerais, Pernambuco, Alagoas, Sergipe, Goiás, and the Distrito Federal, as shown in Figure 1.
The three different climate regions of the São Francisco River basin have been defined according to the Köppen classification as the tropical and savanna (Aw), dry winter and warm summer (Cwb), and another with dry winter and hot summer (Cwa) described by Santos et al. [24,25]. The mean annual precipitation is 1036 mm, ranging from 600 mm in the semi-arid area to 1800 mm at the source of the river (Minas Gerais State).

2.2. Rainfall Dataset

For this study, the daily-observed rainfall data were analyzed from 1980 to 2015 for a network of 24 meteorological stations located across the study area (Figure 1). The data were obtained from the Meteorological Data Base for Teaching and Research (BDMEP) of the National Meteorology Institute (INMET).
The SM2RAIN algorithm [26] simplifies the soil-water balance equation to estimate rainfall directly from the knowledge of relative soil moisture. The physical processes in the land part of the hydrologic cycle can be mainly described by the soil-water balance, presented in Equation (1):
Z ( L ) d s ( t ) d t = p ( t ) r ( t ) e ( t ) g ( t )
where Z ( L ) [m] is the soil layer depth, d s ( t ) / d t [ t−1 ] is the change of relative saturation of soil with respect to time, p ( t ) [ L . s 1 ] and e ( t ) [ L . s 1 ] are the intensity of precipitation and evapotranspiration, whilst r ( t ) [ L . s 1 ] and g ( t ) [ L . s 1 ] are the runoff and drainage flow rates. It is assumed that all precipitation is infiltrated into the soil and consequently the runoff rate is zero. When precipitation occurs, evapotranspiration is assumed negligible. Drainage to groundwater stores is expressed as:
g ( t ) = a s ( t ) b
where a [ L . s 1 ] and b [ ] are the only two parameters that need calibration. Consequently, the formula used to describe the retrieval of rainfall from soil moisture is:
p ( t ) = Z * d s ( t ) d t + a . s ( t ) b
The SM2RAIN-CCI product is obtained by the implementation of the SM2RAIN algorithm [27] combined active and passive product provided by the European Space Agency (ESA) Climate Change Initiative (CCI) (i.e., ESA CCI SM v03.2). Next, an integration procedure based on a weighted average is applied to obtain the accumulated rainfall between 00:00 and 23:59 UTC of the same day. The algorithm has been calibrated during three different periods (1998–2001, 2002–2006, and 2007–2013) against the Global Precipitation Climatology Centre full-data daily dataset [2]. On the other hand, the quality flag provided within the raw soil moisture observations is used to mask (see Figure 1) out low-quality data and those observations characterised by issues in the retrieval (e.g., frozen soil, snow-dominated regions, dense vegetation, and high topographic complexity).
The SM2RAIN-CCI is a global daily precipitation dataset available at 0.25° spatial resolution and the time-span of the data ranges from 1 January 1998 to 31 December 2015 (available online at http://doi.org/10.5281/zenodo.1305021). More information about the SM2RAIN algorithm can be found in Reference [17].
The Climate Hazards Group infrared precipitation with station data (CHIRPS version 2) is a global daily precipitation product specifically designed for monitoring agricultural drought and global environmental change over land [28]. CHIRPS combine remotely sensed precipitation data of geosynchronous and polar orbiting satellites, from five different satellite products, with more than 2000 stations records to calibrate global cold cloud duration rainfall estimates [29]. The product presents a spatial resolution of 0.05° from 50° S to 50° N (across all longitudes) with a >30-year final monthly precipitation record (1981–present).
The NOAA Climate Prediction Center (CPC) MORPHing technique [8] provides quasi-global estimates of precipitation at relatively high spatial resolution (0.0726° × 0.0726°) and frequent temporal resolution (half-hourly), from 60° N to 60° S. CMORPH uses precipitation estimates from passive microwave observations and propagates these features using motion vectors from geostationary satellite IR (infrared) imagery at half-hour intervals. The shape and intensity of the precipitation features are modified during the time between microwave sensors scans by performing a time-weighted linear interpolation [30]. However, it is recognised that CMORPH could be strongly biased in regions with sparse density and inconvenient spatial distribution of rain gauge station networking [31] (Table 1).

2.3. Rainfall Metrics

Three precipitation indices were used (Table 2): (1) The total precipitation (PRCPTOT); (2) the maximum number of consecutive dry days (CDD) and; (3) the corresponding index for the maximum number of consecutive wet days (CWD). These indices are usually employed to analyse precipitation time series from rain gauge stations [32], but they are computed, hereafter, from the homogenised daily rainfall time series of the SM2RAIN-CCI data at 0.25° resolution and annual timescales.

2.4. Statistical Measures

Four comparison parameters were used to evaluate the results of the satellite product SM2RAIN-CCI, including the coefficient of determination (R2), mean absolute error (MAE), root mean square error (RMSE), and the Bias. These parameters were calculated by Equations (4)–(7), respectively:
R 2 = [ i = 1 N ( O i O ¯ ) ( P i P ¯ ) ] 2 i = 1 N ( O i O ¯ ) 2 i = 1 N ( P i P ¯ ) 2
MAE = i = 1 N | O i P i | N
RMSE = i = 1 N ( O i P i ) 2 N
B i a s = i = 1 N O i / i = 1 N P i 1
where O i is the observation measured by rain gauge; P i is the precipitation estimated by satellite-derived SM at the location of rain gauge; O ¯ is the mean value of all rain gauge observations, and P ¯ is the mean value of the estimated precipitation in all locations with rain gauges.
In particular, the linear regression and nonparametric Mann–Kendall (MK) trend test were used to test the variation trends of precipitation [33]. The MK non-parametric statistical test method is a rank-based procedure that is suitable for detecting non-linear trends, which are not disturbed by few outliers and are commonly used in meteorological and hydrological sequence analysis. In this study, 5% significance level ( Z 0.025 = 1.96 ) was considered.
In addition, the Sen non-parametric test [33,34] was used to calculate the magnitude of trends in the time series data. This test proceeds by calculating the slope of a change in observation values to the change of the corresponding times. According to Sen’s test, the overall estimator b s e n is the median of the data slopes, and it can be calculated from Equation (8),
b s e n = M e d i a n [ X i X j i j ]
where X i and X j are data values at time i and j, respectively.

3. Results

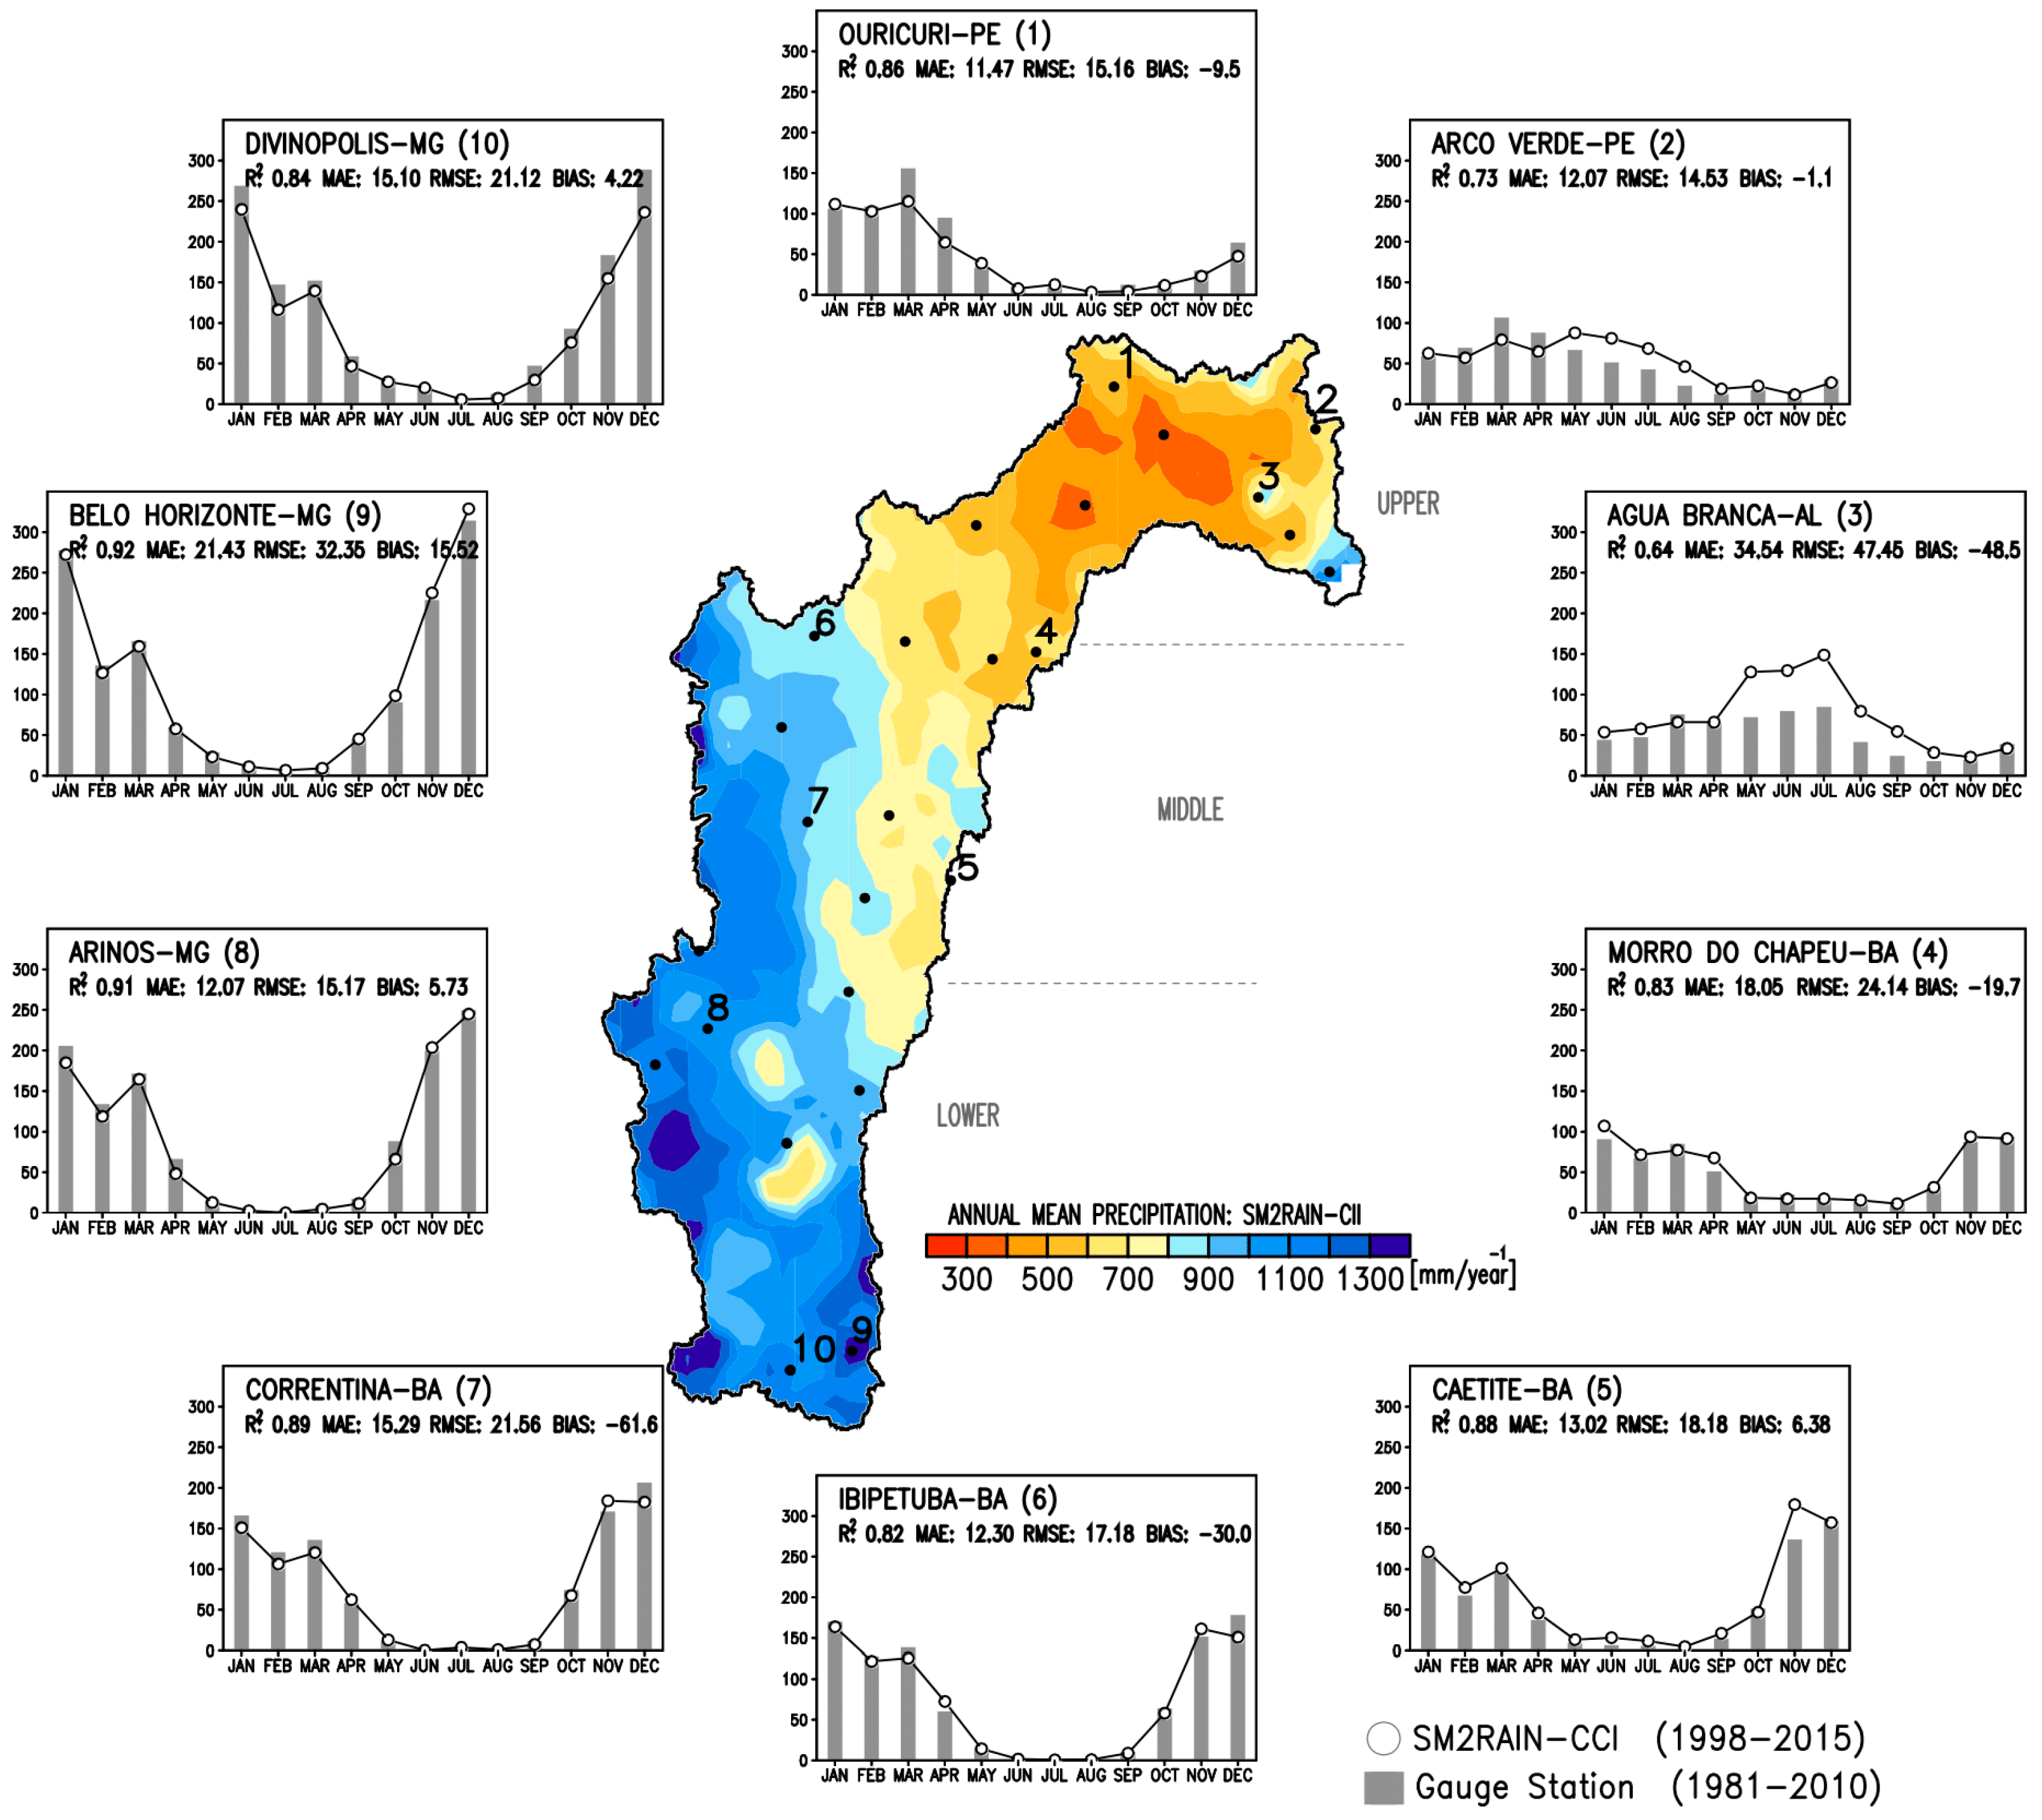
3.1. Validation of SM2RAIN-CCI with Ground Stations Rainfall Data

The annual rainfall trends over São Francisco River basin are presented in Figure 2. The mean annual satellite product SM2RAIN-CCI shows a minor decreased trend (−6.3 mm/year) over an 18-year period, however it does not present any significant increasing trends at the 95% confidence level under MK analysis. Moreover, the variation trend of the annual precipitation from SM2RAIN-CCI was considered consistent with the observed time series, with linear tendency rates of 3.5 and −6.3 mm year−1 and determination coefficients (R2) of 0.0062 and 0.0141, respectively. The annual precipitation observed by the average ground stations was 1880.7 mm.
Figure 3 shows the averaged values of monthly precipitation between the satellite-derived SM and the in-situ rain gauge data for the São Francisco River basin. Due to the data regularity and consistency along the period analyzed, 10 meteorological stations were selected to represent precipitation across the basin (Figure 3).
In the upper area, the rainfall totals were consistently overestimated by as much as 10 mm in all months, except in the Água Branca and Arco Verde meteorological stations located in the Alagoas and Pernambuco states, respectively. The middle and lower areas had similar rainfall pattern in most of the months.
As would be expected, the high-resolution SM2RAIN-CCI data captured more seasonal trends in precipitation patterns for the entire basin. The most significant difference pattern between the observed and the estimated datasets occurred in February, March, September, October, November, and December months. One of the notable discrepancies occurred in the tropical coastal of the northeast region, where the Arco Verde and Água Branca meteorological stations are located, and SM2RAIN-CCI exceeded >150 mm during the May to August and May to September, respectively. The annual monthly mean precipitation observed by the ground stations increased from approximately 25 mm month−1 in June and September to approximately 100 to 300 mm month−1 in December and then decreased gradually to 40 mm month−1 in April.
The results show that the SM2RAIN-CCI has high correlation for the monthly rainfall estimation. The coefficient of determination ranges from a maximum of 0.92 (Belo Horizonte) to a minimum value of 0.64 (Água Branca). On average, 85% of the total observed rainfall variation is explained by the SM2RAIN algorithm. In addition, the SM2RAIN-CCI obtained a RMSE ranging from 15.17 to 47.45 mm day−1 and a MAE ranging from 11.47 to 34.2 mm day−1, although precipitation is slightly overestimated in some areas as in Arcoverde e Água Branca stations.
The Table 3 presents the statistical results from SM2RAIN-CCI rainfall product against rain gauge measurements at multi-time scale from 1998 to 2015. From Table 3, it can be observed a significant correlation between the two datasets during the seasonal variability. The correlation coefficients reached 0.86 (Ouricuri) and 0.92 (Belo Horizonte), which all passed the 0.05 level of significance test. These results indicated a linear correlation and consistency between SM2RAIN-CCI rainfall product and rain gauge data. In terms of bias, the mean annual was −23.5 (Água Branca) and 20.88 (Divinópolis), which means that the precipitation was overestimated by SM2RAIN-CCI when compared with observations from rain gauge stations. Taken together, these findings suggest a strong applicability of the SM2RAIN-CCI data in the estimation of precipitation over the São Francisco River basin.

3.2. Comparison between Satellite Products SM2RAIN-CCI, CHIRPS, and CMORPH

Figure 4 shows the mean seasonal rainfall of SM2RAIN-CCI over the San Francisco basin compared to other data from satellite estimates, such as the CMORPH and CHIRPS products. It is observed that on the basin area, the SM2RAIN precipitation distribution behaved in a similar way to that obtained with other remote sensing data.
The December–January–February (DJF) precipitation (Figure 4a) of the SM2RAIN-CCI showed a spatial variation of 10 to 80 mm, from 90 to 160 mm, and 120 to 200 mm for the upper, middle, and lower areas, respectively. This same spatial variation is presented in the data series of the CMORPH and CHIRPS products, with differences in rainfall accumulation between 15 and 45 mm, mainly in the basin lower area. The seasonal periods for March–April–May (MAM) (Figure 4b,f,j) and June–July–August (JJA) (Figure 4c,g,k) presented a homogeneity of the data, where JJA stands out as the driest period of the São Francisco river basin, both in the series and temporal (see Figure 3). In the September–October–November (SON) period, the SM2RAIN-CCI data presented a precipitation deficit in the lower part of the basin, where rainfall above 150 mm stands out, consistent with the data observed from São Francisco.

3.3. Analysis of Rainfall Metrics for 1998–2015, 2009–2010, 2011–2012, 2013–2014 Periods

Figure 5 shows the spatial analysis results and reveals large differences for means of different years and the long-term average to SM2RAIN-CCI, especially in the upper and middle area of the São Francisco River basin, whereas the differences were relatively small in the lower area of the São Francisco River basin.
The overall spatial distribution of the observed annual precipitation in 2009–2010 was generally the same as that the 2011–2012; however, the number of regions with lower precipitation decreased in the upper area (Figure 5c). In the 2013–2014 period, the observed annual precipitation was relatively low over the entire basin. In addition, the SM2RAIN-CCI data for the period 2009–2014 allows us to understand the rainfall pattern of the region, describing two regions of higher and lower rainfall. The annual average cycle of precipitation (Figure 5a) under the São Francisco River Basin is represented by the consistency of each period (Figure 5b–d) estimated, with different standards, considering an interannual scale, which are more visible in the upper and lower areas of the basin.
Annual rainfall trends (PRCPTOT) at 10 stations over the São Francisco River basin are listed in Table 4 and the variability of the rainfall metrics is plotted in Figure 6a–l. Rainfall data analysis results indicate that the annual rainfall of approximately 69% of the basin area had insignificant decrease during the period 1998–2015, and the annual rainfall reduction occurred mainly in the upper area. However, only 17% of the basin area had an increase in annual rainfall with an insignificant trend during the past 18 years, and a significant reduction in annual rainfall between 1998 and 2015 found at station 9 (Belo Horizonte). It is worthy to note that the station 9 is located in the lower area, which records information for approximately 18% of the basin.
The maximum consecutive wet days (CWD) and maximum consecutive dry days (CDD) describe the duration of wet and dry periods, respectively. In general, the CWD and CDD always show an opposite trend. Results of trend tests of CWD and CDD for the São Francisco River basin are presented in Table 5 and Table 6, respectively.
Table 5 shows that an increasing trend in wet duration was found in 77% of the basin lower area over the last years, whereas the decrease trend in the wet period was mainly found in the upper area. However, the change in wet duration over the short-term period (1998–2015) is not statistically significant. During the past decade, an insignificant decrease trend in wet duration was found in most of the whole basin. However, only 15% of the total area located in the upper area had a significant reduction in wet duration.
Regarding Table 6, the decreasing trend in dry duration was found in 56% of the total basin scattered across the São Francisco River basin during the period 1998–2015. However, only 13% of the basin area had a statistically significant reduction of dry period. In addition, during the past 18 years, the insignificant increase of dry duration was found in as much 70% of the São Francisco River basin (Figure 6j–i), and about 20% of the basin showed a significant increasing trend in dry period (Figure 6j).
Figure 6a–l illustrates the spatial distribution of rainfall metrics during climatological and seasonal years from SM2RAIN-CCI product applied in this study. Rainfall metrics for different years such as: (i) Above normal rainfall year (2009–2010), (ii) deficit rainfall year (2011–2012), and (iii) normal rainfall year (2013–2014) are reviewed. The distribution of total rainfall (PRCPTOT) for 2009–2010, 2011–2012, and 2013–2014 was 118%, 71%, and 89% of long-term average (1998–2015) respectively. It should be noted that São Francisco River basin did not experience an above normal extreme precipitation during the last years, thus 2009–2010 year, which was close to the above normal category (>118% of long-term average), is treated as an above normal year in the present study.
The spatial distribution of 2009–2010, 2011–2012 and 2013–2014 years follows long-term average over São Francisco River basin except the lower area where 2009–2010 (Figure 6b,f,j) was above wet over the upper area, while in 2011–2012 (Figure 6c,g,k) was much warmer. For the normal year, rainfall distribution was typically wet while in the deficit year, rainfall estimates were relatively dry and hence warm. Thus, the SM2RAIN-CCI data product was able to capture the inter-annual variability in accordance to the variation in seasonal rainfall, which is consistent with the known hydro-climatology of the region.
The spatial distribution of CWD (Figure 6e–h) shows good variability when compared with CDD (Figure 6i−l), however, CDD exhibited wet trend in the São Francisco River basin from SM2RAIN-CCI (Table 5). This led to a relatively less spatial correlation in CDD (0.71) than CWD (0.87) when compared with the rain gauge stations. This has been verified calculating the correlation and excluding the upper area and found that it increases to 0.89. This lower correlation was reviewed further and found to be primarily due to the coastal area where the quality/reliability of SM2RAIN-CCI is questionable.

4. Discussion

This study aimed to compare SM2RAIN-CCI datasets and classic time series meteorological stations according to different criteria in the São Francisco River basin. The results pointed out that the SM2RAIN algorithm seasonal trends are relatively consistent, as already proved in some studies carried out in different regions of the world and, particularly, in the northeast region of Brazil [35], making the SM2RAIN-CCI a suitable algorithm for use in the São Francisco River basin.
Precipitation over São Francisco River basin varies dramatically, geographically, and seasonally due to the influences of different atmospherics systems [36], as the Intertropical Convergence Zone (ITCZ) [37], Easterly Wave Disturbances (EWD) [38], Front Systems (FS) in the lower part of the São Francisco River Basin, and South Atlantic Convergence Zone (SACZ) [39,40]. When analysing the mean precipitation of the areas, it can be observed different mean precipitation within the basin. This is due to the activity of different weather systems in the northeast and southeast regions of Brazil as well as different types of vegetation cover and the effect of mesoscale phenomena, such as breeze circulation [41,42]. Therefore, the SM2RAIN-CCI product was able to reproduce well the mean annual rainfall (1998 to 2015) when compared to the historical series of the meteorological stations, CMORPH and CHIRPS [43].
In a study carried over the northeast region of Brazil [35], the performance of SM2RAIN-CCI was partially affected by orographic effects, suggesting that some areas of the São Francisco River basin may have suffered from a large overestimation. These findings are consistent with our results (see Figure 3), demonstrating some limitations of the SM2RAIN algorithm in comparison with other precipitation data over São Francisco River basin in coastal areas and high elevation zones.
According to the spatial patterns observed in the graphs of Figure 6 and probable seasonal trends in the short-term (18 years), SM2RAIN-CCI data provide useful information for a better understanding of the climatology over São Francisco River basin. It can be inferred that the main precipitation variation is influenced by the ocean–atmosphere interactions, mainly by the tropical ocean among rainy months [37,44]. Barbosa and Kumar [45] reported that the precipitation variability over the Brazilian northeast and southeast regions is associated with the passage of the ITCZ and the passage of the SACZ, partially influenced by the intraseasonal and interannual conditions distributed through the year.

5. Conclusions

This study focuses on the performance of SM2RAIN-CCI for precipitation estimates in the São Francisco river basin, Brazil. The evaluation carried out here indicated that rainfall data from SM2RAIN-CCI fits well with the seasonality of the São Francisco basin when compared to data from local meteorological stations. In general, the SM2RAIN-CCI rainfall estimates had a good correspondence in the first six years of study (1998–2004) regarding the interannual variability but, presented lower performance in the subsequent years (2005–2010).
The local scale data indicated that precipitation in the São Francisco basin has two periods: Rainy and dry, considering the rainfall records of meteorological stations. It was observed a greater overestimation of precipitation in areas close to the coastal region, and the divergences of the overestimated data occur mainly in the months of greater rainfall intensity. Such findings might reflect a possible limitation of SM2RAIN-CCI data; however, the evaluation of parameters related to the amount and occurrence of precipitation showed satisfactory values, according with those found in the recent literature.
Spatial comparisons of SM2RAIN-CCI to determine seasonality over the basin showed the great potential that SM2RAIN-CCI precipitation estimates have when associated with CMORPH and CHIRPS products. These estimates describe the distribution of hydrological patterns considering seasonal accumulations and are of great importance for a region with a scarcity of local data. With a tendency to overestimate some months of higher rainfall intensity, rainfall estimates derived from SM allowed reproducing the seasonal variations in the São Francisco river basin, spatially and temporally. Overall, the results demonstrate the great potential of SM2RAIN-CCI to provide more accurate rainfall estimates for the study area, being able to present a high temporal and spatial resolution precipitation data in the northeast and southeast regions of Brazil.
Thus, the SM2RAIN-CCI rainfall estimates can complement the information of the local rainfall networks, supply the areas of poor coverage of rain gauges, as well as the areas of difficult access, improving the estimation of spatial variability. However, further spatio-temporal analyses using the SM2RAIN-CCI data are needed to assess the product quality since its extension in grid points and the scarcity of observed data are potential limiting factors that should be careful considered. Therefore, new approaches to integrate that SM2RAIN algorithm are required.

Author Contributions

Conceptualization, N.B.; formal analysis, J.S.; investigation, J.S.; methodology, N.B.; supervision, N.B. and A.T.; validation, J.S.; writing—original draft, J.S.; writing—review and editing, N.B. and A.T.

Funding

This study was financed in part by the Coordenação de Aperfeiçoamento de Pessoal de Nível Superior —Brasil (CAPES) (Finance Code 001).

Conflicts of Interest

The authors declare no conflict of interest.

References

  1. Garreaud, R.D.; Vuille, M.; Compagnucci, R.; Marengo, J. Present-day South American climate. Palaeogeogr. Palaeoclimatol. Palaeoecol. 2009, 281, 180–195. [Google Scholar] [CrossRef]
  2. Schamm, K.; Ziese, M.; Becker, A.; Finger, P.; Meyer-Christoffer, A.; Schneider, U.; Schroder, M.; Stender, P. Global gridded precipitation over land: A description of the new GPCC First Guess Daily product. Earth Syst. Sci. Data 2014, 6, 49–60. [Google Scholar] [CrossRef]
  3. Levy, M.C.; Cohn, A.; Lopes, A.V.; Thompson, S.E. Addressing rainfall data selection uncertainty using connections between rainfall and streamflow. Sci. Rep. 2017, 7, 219. [Google Scholar] [CrossRef]
  4. Ferguson, D.B.; Masayesva, A.; Meadow, A.M.; Crimmins, M.A. Rain Gauges to Range Conditions: Collaborative Development of a Drought Information System to Support Local Decision-Making. Weather Clim. Soc. 2016, 8, 345–359. [Google Scholar] [CrossRef]
  5. Borga, M.; Stoffel, M.; Marchi, L.; Marra, F.; Jakob, M. Hydrogeomorphic response to extreme rainfall in headwater systems: Flash floods and debris flows. J. Hydrol. 2014, 518, 194–205. [Google Scholar] [CrossRef]
  6. Sun, Q.; Miao, C.; Duan, Q.; Ashouri, H.; Sorooshian, S.; Hsu, K.-L. A Review of Global Precipitation Data Sets: Data Sources, Estimation, and Intercomparisons. Rev. Geophys. 2018, 56, 79–107. [Google Scholar] [CrossRef] [Green Version]
  7. Nogueira, S.C.; Moreira, M.; Lordelo Volpato, M. Evaluating Precipitation Estimates from Eta, TRMM and CHRIPS Data in the South-Southeast Region of Minas Gerais State—Brazil. Remote Sens. 2018, 10, 313. [Google Scholar] [CrossRef]
  8. Joyce, R.J.; Janowiak, J.E.; Arkin, P.A.; Xie, P. CMORPH: A Method that Produces Global Precipitation Estimates from Passive Microwave and Infrared Data at High Spatial and Temporal Resolution. J. Hydrometeorol. 2004, 5, 487–503. [Google Scholar] [CrossRef]
  9. Huffman, G.J.; Bolvin, D.T.; Nelkin, E.J.; Wolff, D.B.; Adler, R.F.; Gu, G.; Stocker, E.F. The TRMM Multisatellite Precipitation Analysis (TMPA): Quasi-Global, Multiyear, Combined-Sensor Precipitation Estimates at Fine Scales. J. Hydrometeorol. 2007, 8, 38–55. [Google Scholar] [CrossRef]
  10. Hou, A.Y.; Kakar, R.K.; Neeck, S.; Azarbarzin, A.A.; Kummerow, C.D.; Kojima, M.; Iguchi, T. The Global Precipitation Measurement Mission. Bull. Am. Meteorol. Soc. 2014, 95, 701–722. [Google Scholar] [CrossRef] [Green Version]
  11. Ashouri, H.; Hsu, K.-L.; Sorooshian, S.; Braithwaite, D.K.; Knapp, K.R.; Cecil, L.D.; Prat, O.P. PERSIANN-CDR: Daily Precipitation Climate Data Record from Multisatellite Observations for Hydrological and Climate Studies. Bull. Am. Meteorol. Soc. 2015, 96, 69–83. [Google Scholar] [CrossRef]
  12. Brocca, L.; Moramarco, T.; Melone, F.; Wagner, W. A new method for rainfall estimation through soil moisture observations. Geophys. Res. Lett. 2013, 40, 853–858. [Google Scholar] [CrossRef] [Green Version]
  13. Brocca, L.; Ciabatta, L.; Massari, C.; Moramarco, T.; Hahn, S.; Hasenauer, S.; Levizzani, V. Soil as a natural rain gauge: Estimating global rainfall from satellite soil moisture data. J. Geophys. Res. Atmos. 2014, 119, 5128–5141. [Google Scholar] [CrossRef] [Green Version]
  14. Ciabatta, L.; Brocca, L.; Massari, C.; Moramarco, T.; Puca, S.; Rinollo, A.; Wagner, W. Integration of Satellite Soil Moisture and Rainfall Observations over the Italian Territory. J. Hydrometeorol. 2015, 16, 1341–1355. [Google Scholar] [CrossRef]
  15. Crow, W.T.; Huffman, G.J.; Bindlish, R.; Jackson, T.J. Improving Satellite-Based Rainfall Accumulation Estimates Using Spaceborne Surface Soil Moisture Retrievals. J. Hydrometeorol. 2009, 10, 199–212. [Google Scholar] [CrossRef]
  16. Pellarin, T.; Louvet, S.; Gruhier, C.; Quantin, G.; Legout, C. A simple and effective method for correcting soil moisture and precipitation estimates using AMSR-E measurements. Remote Sens. Environ. 2013, 136, 28–36. [Google Scholar] [CrossRef]
  17. Ciabatta, L.; Brocca, L.; Massari, C.; Moramarco, T.; Gabellani, S.; Puca, S.; Wagner, W. Rainfall-runoff modelling by using SM2RAIN-derived and state-of-the-art satellite rainfall products over Italy. Int. J. Appl. Earth Obs. Geoinf. 2016, 48, 163–173. [Google Scholar] [CrossRef]
  18. Satgé, F.; Ruelland, D.; Bonnet, M.-P.; Molina, J.; Pillco, R. Consistency of satellite-based precipitation products in space and over time compared with gauge observations and snow-hydrological modelling in the Lake Titicaca region. Hydrol. Earth Syst. Sci. 2019, 23, 595–619. [Google Scholar] [CrossRef]
  19. Bezerra, B.G.; Silva, L.L.; Santos e Silva, C.M.; de Carvalho, G.G. Changes of precipitation extremes indices in São Francisco River Basin, Brazil from 1947 to 2012. Theor. Appl. Climatol. 2019, 135, 565–576. [Google Scholar] [CrossRef]
  20. Sun, T.; Ferreira, V.; He, X.; Andam-Akorful, S. Water Availability of São Francisco River Basin Based on a Space-Borne Geodetic Sensor. Water 2016, 8, 213. [Google Scholar] [CrossRef]
  21. Creech, C.T.; Siqueira, R.B.; Selegean, J.P.; Miller, C. Anthropogenic impacts to the sediment budget of São Francisco River navigation channel using SWAT. Int. J. Agric. Biol. Eng. 2015, 8, 140–157. [Google Scholar]
  22. Ummenhofer, C.C.; Meehl, G.A. Extreme weather and climate events with ecological relevance: A review. Philos. Trans. R. Soc. B Biol. Sci. 2017, 372, 20160135. [Google Scholar] [CrossRef]
  23. De Jong, P.; Tanajura, C.A.S.; Sánchez, A.S.; Dargaville, R.; Kiperstok, A.; Torres, E.A. Hydroelectric production from Brazil’s São Francisco River could cease due to climate change and inter-annual variability. Sci. Total Environ. 2018, 634, 1540–1553. [Google Scholar] [CrossRef]
  24. Santos, C.A.G.; Morais, B.S. Identification of precipitation zones within São Francisco River basin (Brazil) by global wavelet power spectra. Hydrol. Sci. J. 2013, 58, 789–796. [Google Scholar] [CrossRef] [Green Version]
  25. Santos, C.A.G.; Brasil Neto, R.M.; da Silva, R.M.; de Araújo Passos, J.S. Integrated spatiotemporal trends using TRMM 3B42 data for the Upper São Francisco River basin, Brazil. Environ. Monit. Assess. 2018, 190, 175. [Google Scholar] [CrossRef]
  26. Brocca, L.; Massari, C.; Ciabatta, L.; Moramarco, T.; Penna, D.; Zuecco, G.; Martínez-Fernández, J. Rainfall estimation from in situ soil moisture observations at several sites in Europe: An evaluation of the SM2RAIN algorithm. J. Hydrol. Hydromech. 2015, 63, 201–209. [Google Scholar] [CrossRef]
  27. Ciabatta, L.; Massari, C.; Brocca, L.; Gruber, A.; Reimer, C.; Hahn, S.; Paulik, C.; Dorigo, W.; Kidd, R.; Wagner, W. SM2RAIN-CCI: A new global long-term rainfall data set derived from ESA CCI soil moisture. Earth Syst. Sci. Data 2018, 10, 267–280. [Google Scholar] [CrossRef]
  28. Funk, C.; Peterson, P.; Landsfield, M.; Pedreros, D.; Verdin, J.; Rowland, J.; Romero, B.; Husak, G.; Michaelsen, J.; Verdin, A. A Quase-Global Precipitation Time Series for Drought Monitoring; US Geological Survey: Reston, VA, USA, 2014.
  29. Funk, C.; Peterson, P.; Landsfeld, M.; Pedreros, D.; Verdin, J.; Shukla, S.; Michaelsen, J. The climate hazards infrared precipitation with stations—A new environmental record for monitoring extremes. Sci. Data 2015, 2, 150066. [Google Scholar] [CrossRef] [PubMed]
  30. Xie, P.; Joyce, R.; Wu, S.; Yoo, S.-H.; Yarosh, Y.; Sun, F.; Lin, R. Reprocessed, Bias-Corrected CMORPH Global High-Resolution Precipitation Estimates from 1998. J. Hydrometeorol. 2017, 18, 1617–1641. [Google Scholar] [CrossRef]
  31. Zubieta, R.; Getirana, A.; Espinoza, J.C.; Lavado, W. Impacts of satellite-based precipitation datasets on rainfall–runoff modeling of the Western Amazon basin of Peru and Ecuador. J. Hydrol. 2015, 528, 599–612. [Google Scholar] [CrossRef]
  32. Cattani, E.; Merino, A.; Guijarro, J.; Levizzani, V. East Africa Rainfall Trends and Variability 1983–2015 Using Three Long-Term Satellite Products. Remote Sens. 2018, 10, 931. [Google Scholar] [CrossRef]
  33. Zeleňáková, M.; Purcz, P.; Blišťan, P.; Vranayová, Z.; Hlavatá, H.; Diaconu, D.; Portela, M. Trends in Precipitation and Temperatures in Eastern Slovakia (1962–2014). Water 2018, 10, 727. [Google Scholar] [CrossRef]
  34. Larbi, I.; Hountondji, F.; Annor, T.; Agyare, W.; Mwangi Gathenya, J.; Amuzu, J. Spatio-Temporal Trend Analysis of Rainfall and Temperature Extremes in the Vea Catchment, Ghana. Climate 2018, 6, 87. [Google Scholar] [CrossRef]
  35. Paredes-Trejo, F.; Barbosa, H.; Rossato Spatafora, L. Assessment of SM2RAIN-Derived and State-of-the-Art Satellite Rainfall Products over Northeastern Brazil. Remote Sens. 2018, 10, 1093. [Google Scholar] [CrossRef]
  36. Polzin, D.; Hastenrath, S. Climate of Brazil’s nordeste and tropical atlantic sector: Preferred time scales of variability. Rev. Bras. Meteorol. 2014, 29, 153–160. [Google Scholar] [CrossRef]
  37. Paredes Trejo, F.; Brito-Castillo, L.; Barbosa Alves, H.; Guevara, E. Main features of large-scale oceanic-atmospheric circulation related to strongest droughts during rainy season in Brazilian São Francisco River Basin. Int. J. Climatol. 2016, 36, 4102–4117. [Google Scholar] [CrossRef]
  38. Gomes, H.B.; Ambrizzi, T.; Herdies, D.L.; Hodges, K.; Pontes da Silva, B.F. Easterly Wave Disturbances over Northeast Brazil: An Observational Analysis. Adv. Meteorol. 2015, 2015, 176238. [Google Scholar] [CrossRef]
  39. Valverde, M.C.; Marengo, J.A. Extreme rainfall índices in the hydrographic basins of Brazil. Open J. Mod. Hydrol. 2014, 4, 10–26. [Google Scholar] [CrossRef]
  40. Marengo, J.A.; Torres, R.R.; Alves, L.M. Drought in Northeast Brazil—Past, present, and future. Theor. Appl. Climatol. 2017, 129, 1189–1200. [Google Scholar] [CrossRef]
  41. Getirana, A. Extreme water deficit in Brazil detected from space. J. Hydrometeorol. 2016, 17, 591–599. [Google Scholar] [CrossRef]
  42. Pereira, M.P.S.; Justino, F.; Malhado, A.C.M.; Barbosa, H.; Marengo, J. The influence of oceanic basins on drought and ecosystem dynamics in Northeast Brazil. Environ. Res. Lett. 2014, 9, 124013. [Google Scholar] [CrossRef] [Green Version]
  43. Paredes-Trejo, F.J.; Barbosa, H.A.; Lakshmi Kumar, T.V. Validating CHIRPS-based satellite precipitation estimates in Northeast Brazil. J. Arid Environ. 2017, 139, 26–40. [Google Scholar] [CrossRef]
  44. Marengo, J.A.; Alves, L.M.; Soares, W.R.; Rodriguez, D.A.; Camargo, H.; Riveros, M.P.; Pabló, A.D. Two Contrasting Severe Seasonal Extremes in Tropical South America in 2012: Flood in Amazonia and Drought in Northeast Brazil. J. Clim. 2013, 26, 9137–9154. [Google Scholar] [CrossRef]
  45. Barbosa, H.A.; Lakshmi Kumar, T.V. Influence of rainfall variability on the vegetation dynamics over Northeastern Brazil. J. Arid Environ. 2016, 124, 377–387. [Google Scholar] [CrossRef]
Figure 1. The São Francisco river basin, showing the soil moisture to rainfall (SM2RAIN)-Climate Change Initiative (CCI) grid and the locations of the selected meteorological stations.
Geosciences 09 00144 g001
Figure 2. Comparison of inter-annual (1998 to 2015) variations between average rain gauge measurements and SM2RAIN-CCI over the grid cells with rain gauges. Linear regression lines were added for both data.
Geosciences 09 00144 g002
Figure 3. Comparison of precipitation measured by SM2RAIN-CCI with the meteorological stations data at monthly time-scales (from 1981 to 2010).
Geosciences 09 00144 g003
Figure 4. Seasonal monthly mean precipitation distributions over São Francisco River basin for (ad) SM2RAIN-CCI, (e–h) CMORPH, and (i–l) CHIRPS.
Geosciences 09 00144 g004
Figure 5. Spatial variation patterns of the mean and observed annual precipitation in the São Francisco River basin for different years: (a) Multi-year mean precipitation; (b) observed annual precipitation in 2009–2010; (c) observed annual precipitation in 2011–2012; (d) observed annual precipitation in 2013–2014.
Geosciences 09 00144 g005
Figure 6. Annual distribution of (ad) PRCPTOT (mm), (eh) CWD (days), and (il) CDD (days) for the different events the El Niño-Oscillation Southern.
Geosciences 09 00144 g006
Table 1. Satellite precipitation estimates considered and their main characteristics (in the data source column, S stands for satellite, R for reanalysis, and G for gauge information).
Full NameAcronymData SourceTemporal CoverageTemporal ResolutionSpatial Resolution
Soil Moisture to Rain from ESA Climate Change InitiativeSM2RAIN-CCIS1998–2015Daily0.25° × 0.25°
Climate Hazard Group InfraRed Precipitation with StationCHIRPSS, R, G1981–presentDaily0.05° × 0.05°
CPC MORPHing technique bias correctedCMORPH-CRTS, G1998–present30 min0.08° × 0.08°
Table 2. Precipitation indices used in the study.
Indices (Units)Definition
PRCPTOT (mm) Total daily precipitation with RR ≥1 mm
CDD (days)Maximum number of consecutive dry days (RR <1 mm)
CWD (days)Maximum number of consecutive wet days (RR ≥1 mm)
* RR is the daily precipitation amount on a wet day.
Table 3. Mean seasonal values for coefficient of determination, mean absolute error (MAE), root mean square error (RMSE), and Bias (from 1998 to 2015).
SeasonValidation Station
UpperMiddleLower
12345678910
R2December–January–February0.740.890.590.590.610.720.800.760.320.83
March–April–May0.820.820.640.740.810.640.730.850.860.66
June–July–August0.340.850.040.030.790.020.030.820.640.77
September–October–November0.860.600.770.730.760.860.790.870.350.78
MAE (mm)December–January–February22.7512.9814.2427.9825.6822.4618.3220.3634.9726.81
March–April–May16.3416.9137.9418.514.1612.1715.8713.5213.9113.06
June–July–August2.9810.8164.6710.580.8811.9557.11.244.011.95
September–October–November3.847.3721.3215.1611.3712.6419.913.1832.8318.61
RMSE (mm)December–January–February30.9118.3820.2539.2337.0927.2325.3526.7660.3136.64
March–April–May20.5222.1452.4225.5318.0318.1320.9115.8118.8919.83
June–July–August4.617.4384.1812.151.6465.8511.471.955.863.23
September–October–November4.6310.1732.9719.6715.9717.5328.5316.1644.3624.81
BIAS (%)December–January–February−11.92.07−12.6−38.311.992.90−10.23.0212.283.64
March–April–May4.037.36−43.0−22.7−1.422.51−14.19.0215.628.09
June–July–August−27.9−6.58−70.215.6113.66−128−2004.6010.582.13
September–October–November−2.32−7.42−68.4−33.51.322.33−22.36.2823.623.02
Table 4. Detail of total precipitation (PRCPTOT) rainfall metric.
PRCPTOT
(1998–2015)
Station
UpperMiddleLower
12345678910
Trend nature++
Trend significantNoYesYesNoNoNoNoNoYesNo
Sen’s slope17.3−30.3−25.422.2−21.4−40.3−23.4−9.86−84.225.3
Available years1015131212161516811
Average (mm)574703602664836877959110014581106
SD (mm)154215149164209207229206319336
* + = increasing trend, − = decreasing trend.
Table 5. Detail of consecutive wet days (CWD) rainfall metric.
CWD
(1998–2015)
Station
UpperMiddleLower
12345678910
Trend natureNA+++++
Trend significantNoNoNoNoNoNoNoNoNoNo
Sen’s slope−0.12−0.23−0.27−0.250.00−0.63−0.080.000.150.07
Available years1371516151615161313
Average (days)3545668121512
SD (days)1322334464
* + = increasing trend, − = decreasing trend.
Table 6. Detail of consecutive dry days (CDD) rainfall metric.
CDD
(1998–2015)
Station
UpperMiddleLower
12345678910
Trend nature+NA+++++
Trend significantYesNoNoNoNoNoNoNoYesNo
Sen’s slope2.23−2.80−3.810.50−2.080.810.161.508.003.40
Available years1481516151615161412
Average (days)151117126121112115889213489
SD (days)54614948415044476744
* + = increasing trend, − = decreasing trend.

