1. Introduction
Loudspeaker systems are electroacoustic devices that employ transducers designed to reproduce distinct frequency ranges. This is achieved through the implementation of RLC filter networks, commonly referred to as crossover circuits. The electromagnetic transducers utilized in such systems comprise a magnetic assembly, a structural frame (basket), and a complete vibratory system. The vibratory system itself consists of a voice coil, a diaphragm assembly, a lower spring (lower suspension), and a dust cap.
The voice coil is typically composed of copper or CCAW (Copper-Coated Aluminum Wire) wound in a linear fashion around a former, which is most often fabricated from aluminum or Kapton-type film. The wire used for winding is thermally bondable, featuring an adhesive coating (commonly referred to as pre-bonded wire). To ensure the mechanical integrity of the coil, the wound assembly is subjected to thermal curing in an oven, thereby bonding the wire to the former.
The diaphragm assembly includes a cone—usually made from paper or PVC film—an upper suspension (surround), and conductive leads. The lower spring, a phenolic resin-based elastic component, serves to center the voice coil within the magnetic gap while providing mechanical compliance. These phenolic components are manufactured by impregnating cotton fabric with phenolic resin and curing it under high temperature and pressure.
Within audiophile communities, there exists a prevailing belief that “burn-in”—the process of operating loudspeakers over an extended period—can lead to measurable and perceptible improvements in both objective and subjective performance characteristics. Proponents of this theory argue that aging-related changes in transducer components, such as increased compliance of suspension elements, can enhance frequency response and reduce nonlinear distortion. Additionally, thermal effects on the voice coil are posited to alter its electrical properties in a beneficial manner.
Advocates claim that burn-in results in improved depth, detail, dynamic range, and reduced distortion. Conversely, skeptics highlight the absence of rigorous scientific evidence substantiating any significant changes in either objective measurements or subjective listening impressions attributable to the burn-in process.
The aim of this study is to verify whether the burn-in process significantly affects the electrical, acoustic, or perceptual characteristics of loudspeakers. Specifically, it examines whether burn-in leads to measurable changes in impedance or frequency response, and whether such changes are perceptible to trained listeners in blind tests.
While audiophile perspectives remain largely anecdotal, recent peer-reviewed research has begun to address the scientific basis for aging effects in loudspeakers. Klippel [
1] systematically investigated mechanical fatigue and load-induced aging of suspension components, demonstrating that extended excitation cycles lead to increased compliance, decreased stiffness, and changes in resonance frequency of the moving system. These changes, while subtle, can alter both the linear and nonlinear response of the driver, particularly in the low-frequency range.
Furthermore, a recent study published in
Sensors [
2] examined environmental aging effects, including humidity and temperature exposure, on loudspeaker materials. The results confirmed that microstructural changes in polymeric suspensions and diaphragms can occur even after limited use, potentially influencing the mechanical and acoustic behavior of transducers. These findings support the need for empirical verification of whether such material changes have a perceptible impact on subjective audio quality.
This study is therefore situated at the intersection of subjective perception and objective measurement, seeking to determine whether material aging—commonly associated with the so-called “burn-in” period—results in measurable variations in impedance and frequency response, and whether these changes are audibly detectable under controlled conditions by trained listeners.
According to Polish law [
3], all participants provided written informed consent prior to taking part in the study, including consent for the processing of their personal data. The consent form contained detailed information about the purpose of the research and a clear explanation of the investigated problem. Participation was entirely voluntary, and the study posed no health risks to the participants.
2. Burn-In Process
The burn-in procedure was conducted in accordance with the PN-EN 60268-5:2021 [
4] and AES75-2023 [
5] standards. The loudspeaker systems under testing were subjected to a broadband signal known as “Music Noise” [
5], applied at a voltage corresponding to half of the maximum input voltage
, as determined by Equation (1). The burn-in process lasted for a duration of three hours.
The AES75-2023 standard defines the “Music Noise” signal as a new benchmark that yields results more representative of actual music playback compared to traditional program-type signals.
In the article “Loudspeaker Break-In: Fact or Fiction?” published in Audioholics, Mark Sanfilipo notes that, “Depending on the number of mechanical factors relating to its design, construction, and materials composition, a net post-burn-in compliance increase on the order of 5–10% would not be unusual” [
6]. He emphasizes that mechanical components of the loudspeaker, such as the upper and lower suspensions, undergo changes in compliance as a result of operational stress. His research suggests that the burn-in process for a transducer may take only a few seconds and could be integrated into the manufacturing workflow. The article presents models of the transducer before and after burn-in, highlighting observed differences. The amplitude discrepancy was limited to just 0.09 dB in favor of the burned-in transducer model. Differences were also noted in the peak values of the impedance magnitude characteristics.
In his publication “The Audio Expert: Everything You Need to Know About Audio” (Focal Press) [
7], Ethan Winer addresses common audiophile myths and acknowledges that over time, relaxation phenomena may occur in the materials used in transducer construction. However, he concludes that such changes are unlikely to result in perceptible auditory differences.
3. Research Methodology
This study employed a combined methodological approach to evaluate the effects of the burn-in process on loudspeaker performance. Initially, a series of objective measurements was conducted to assess key electroacoustic parameters, including frequency response, total harmonic distortion, impedance characteristics, sensitivity, and resonant frequency. These measurements were carried out in a controlled acoustic environment using calibrated equipment and standardized test signals to ensure accuracy and repeatability.
Following the objective analysis, subjective listening tests were performed to capture perceptual differences in sound quality. A panel of trained listeners participated in double-blind A/B comparison sessions conducted in an acoustically treated room. Participants evaluated various auditory attributes, such as tonal balance, clarity, spatial imaging, and overall listening experience. The subjective data were collected using standardized rating scales and subsequently analyzed to determine whether any perceptible changes could be attributed to the burn-in process.
4. Objective Measurement
Objective measurements were conducted using the Audio Precision APx515 measurement system in conjunction with a dedicated power amplifier designed for testing electroacoustic transducers and loudspeaker systems, both manufactured by Audio Precision. During the measurements, the test microphone was positioned at a distance of 1 m from the loudspeaker under testing, at a height of 1.2 m, corresponding to the height of the tweeter in the tested systems. A swept sine signal (Sweep) with an RMS voltage of 2.83 V was applied at the output of the power amplifier. The loudspeakers were measured across a frequency range of 20 Hz to 40 kHz [
4].
4.1. Frequency Response
Figure 1 presents the frequency response plots of the tested loudspeaker systems. The legend indicates the serial numbers of the loudspeaker units included in the study. The letters U, W, and N denote, respectively, used, burned-in, and new devices. The frequency responses are shown with 1/12 octave smoothing applied.
As can be observed, there are significant discrepancies in the frequency characteristics of the tested units, particularly in the low-frequency range. This variation is evident even among loudspeakers from the same series with consecutive serial numbers.
Figure 2 provides a more detailed view of these differences. The most pronounced discrepancies were observed among non-burned-in devices from the same production series, despite having sequential serial numbers.
4.2. Impedance Magnitude Characteristics
Impedance magnitude measurements were performed by applying a sinusoidal signal with an RMS voltage of 1 V to the loudspeaker system under testing, across a frequency range of 20 Hz to 40 kHz. Measurements were taken at 200 discrete frequency points. By knowing the voltage at the amplifier output and measuring the current flowing through the loudspeaker system, the impedance magnitude at each frequency point was calculated using the following relationship:
where
Z is the impedance magnitude,
Uf is the voltage, and
If is the current at a given frequency. This method allowed for the precise determination of the impedance characteristics of the tested loudspeaker systems.
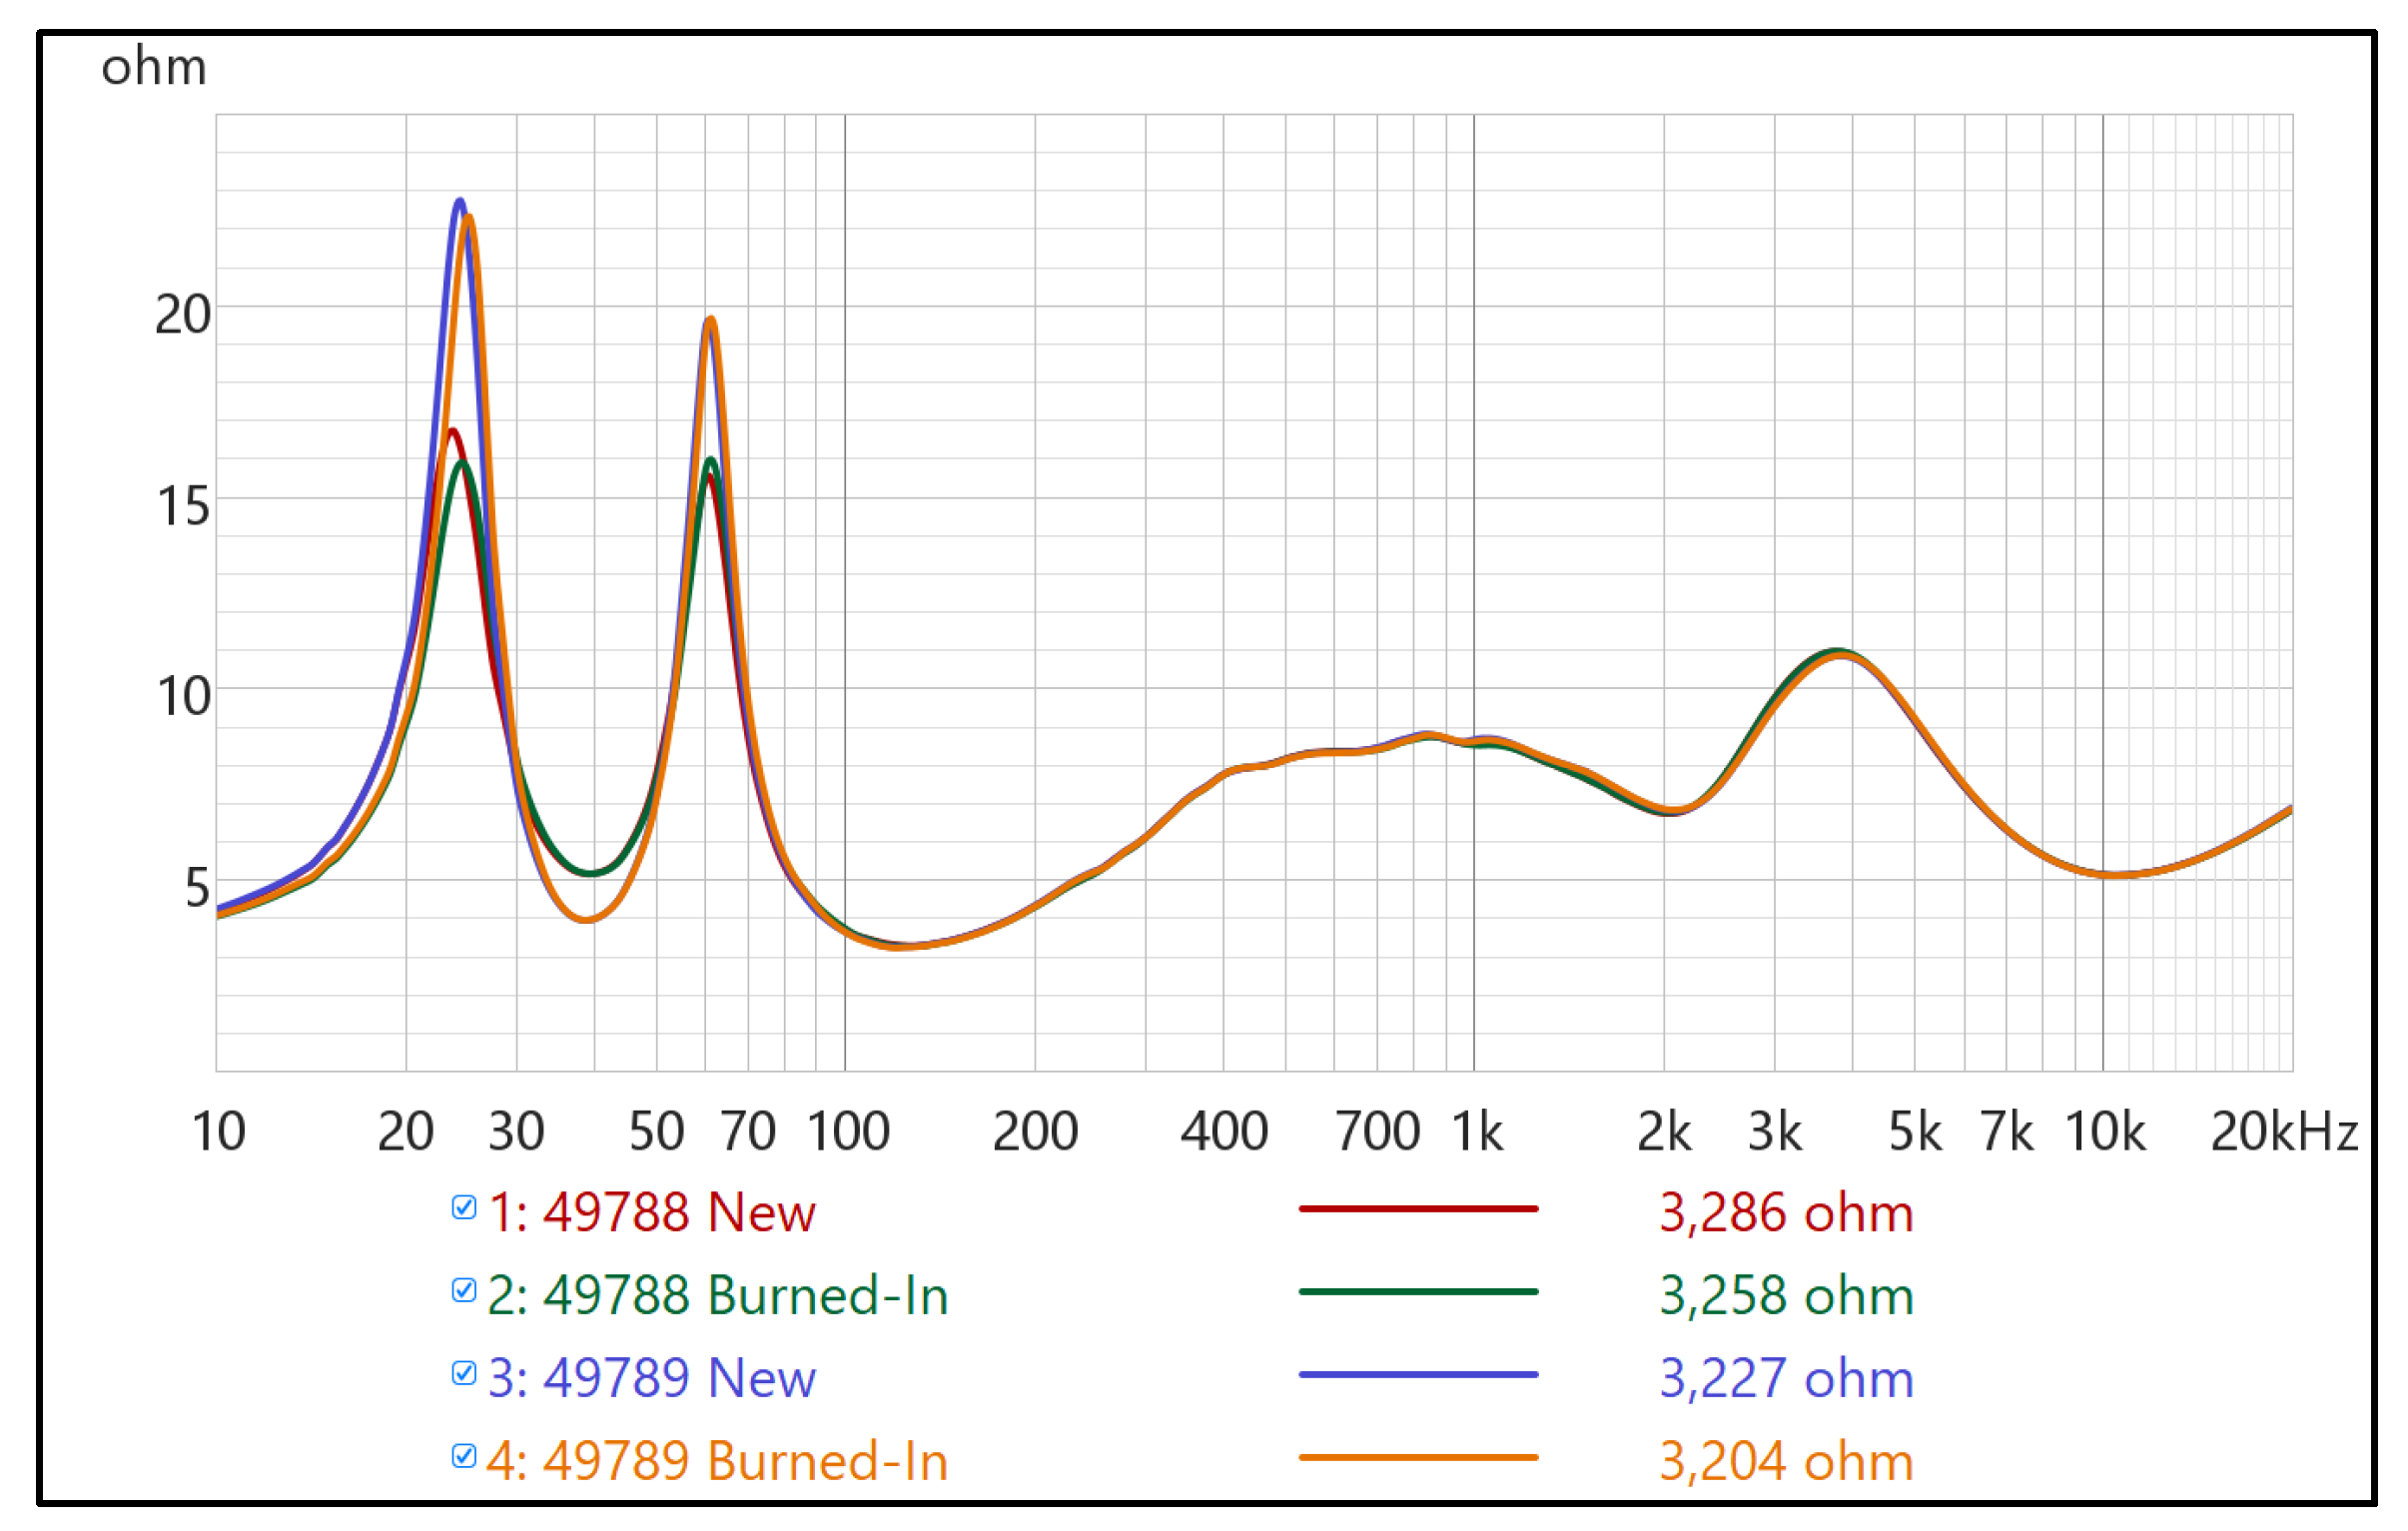
Figure 3 presents the impedance magnitude plots for all tested loudspeaker units. As observed, the impedance peaks associated with the interaction between the diaphragm and the bass reflex port occur at the same frequency across all tested devices. However, the peaks resulting from the parameters of the transducer’s vibratory system appear to be shifted by several hertz relative to one another. This variation is attributed to manufacturing tolerances in the transducers and the aging processes affecting the components of the vibratory system.
The most significant differences in impedance magnitude were observed among loudspeakers from the same production series, which confirms that manufacturing inconsistencies have a greater impact than the burn-in process.
By analyzing
Figure 4 and
Figure 5, it can be observed that there are notable differences in the impedance magnitude plots between loudspeaker systems from the same production series that differ by as little as one serial number. These discrepancies appear despite identical design, materials, and nominal parameters, suggesting that small variations introduced during the manufacturing process can result in measurable differences in electroacoustic behavior. Such variability may stem from tolerances in material properties, adhesives, mechanical alignment, or suspension geometry introduced during assembly.
Furthermore, the burn-in process caused a slight but consistent shift in the impedance peak frequency of the transducers. This shift typically indicates an increase in the mechanical compliance of the suspension system, particularly in the surround and spider components. The most likely explanation involves physical relaxation or softening of the elastomeric materials used in the upper suspension (usually rubber or foam) due to repeated mechanical stress and localized heat buildup during prolonged operation. Additionally, early-stage microstructural degradation or plastic deformation of the phenolic resin used in the spider (lower suspension) may reduce stiffness and alter resonance characteristics.
These changes, although small in magnitude, reflect real physical phenomena that can influence transducer performance in the early phase of use. However, it is important to note that the observed variations remained within acceptable industry tolerances and did not result in perceptible changes in subjective evaluations, as confirmed by blind listening tests. This suggests that while burn-in may slightly alter mechanical properties, the resulting acoustic impact is minimal and largely inaudible under normal listening conditions.
4.3. Harmonic Distortion
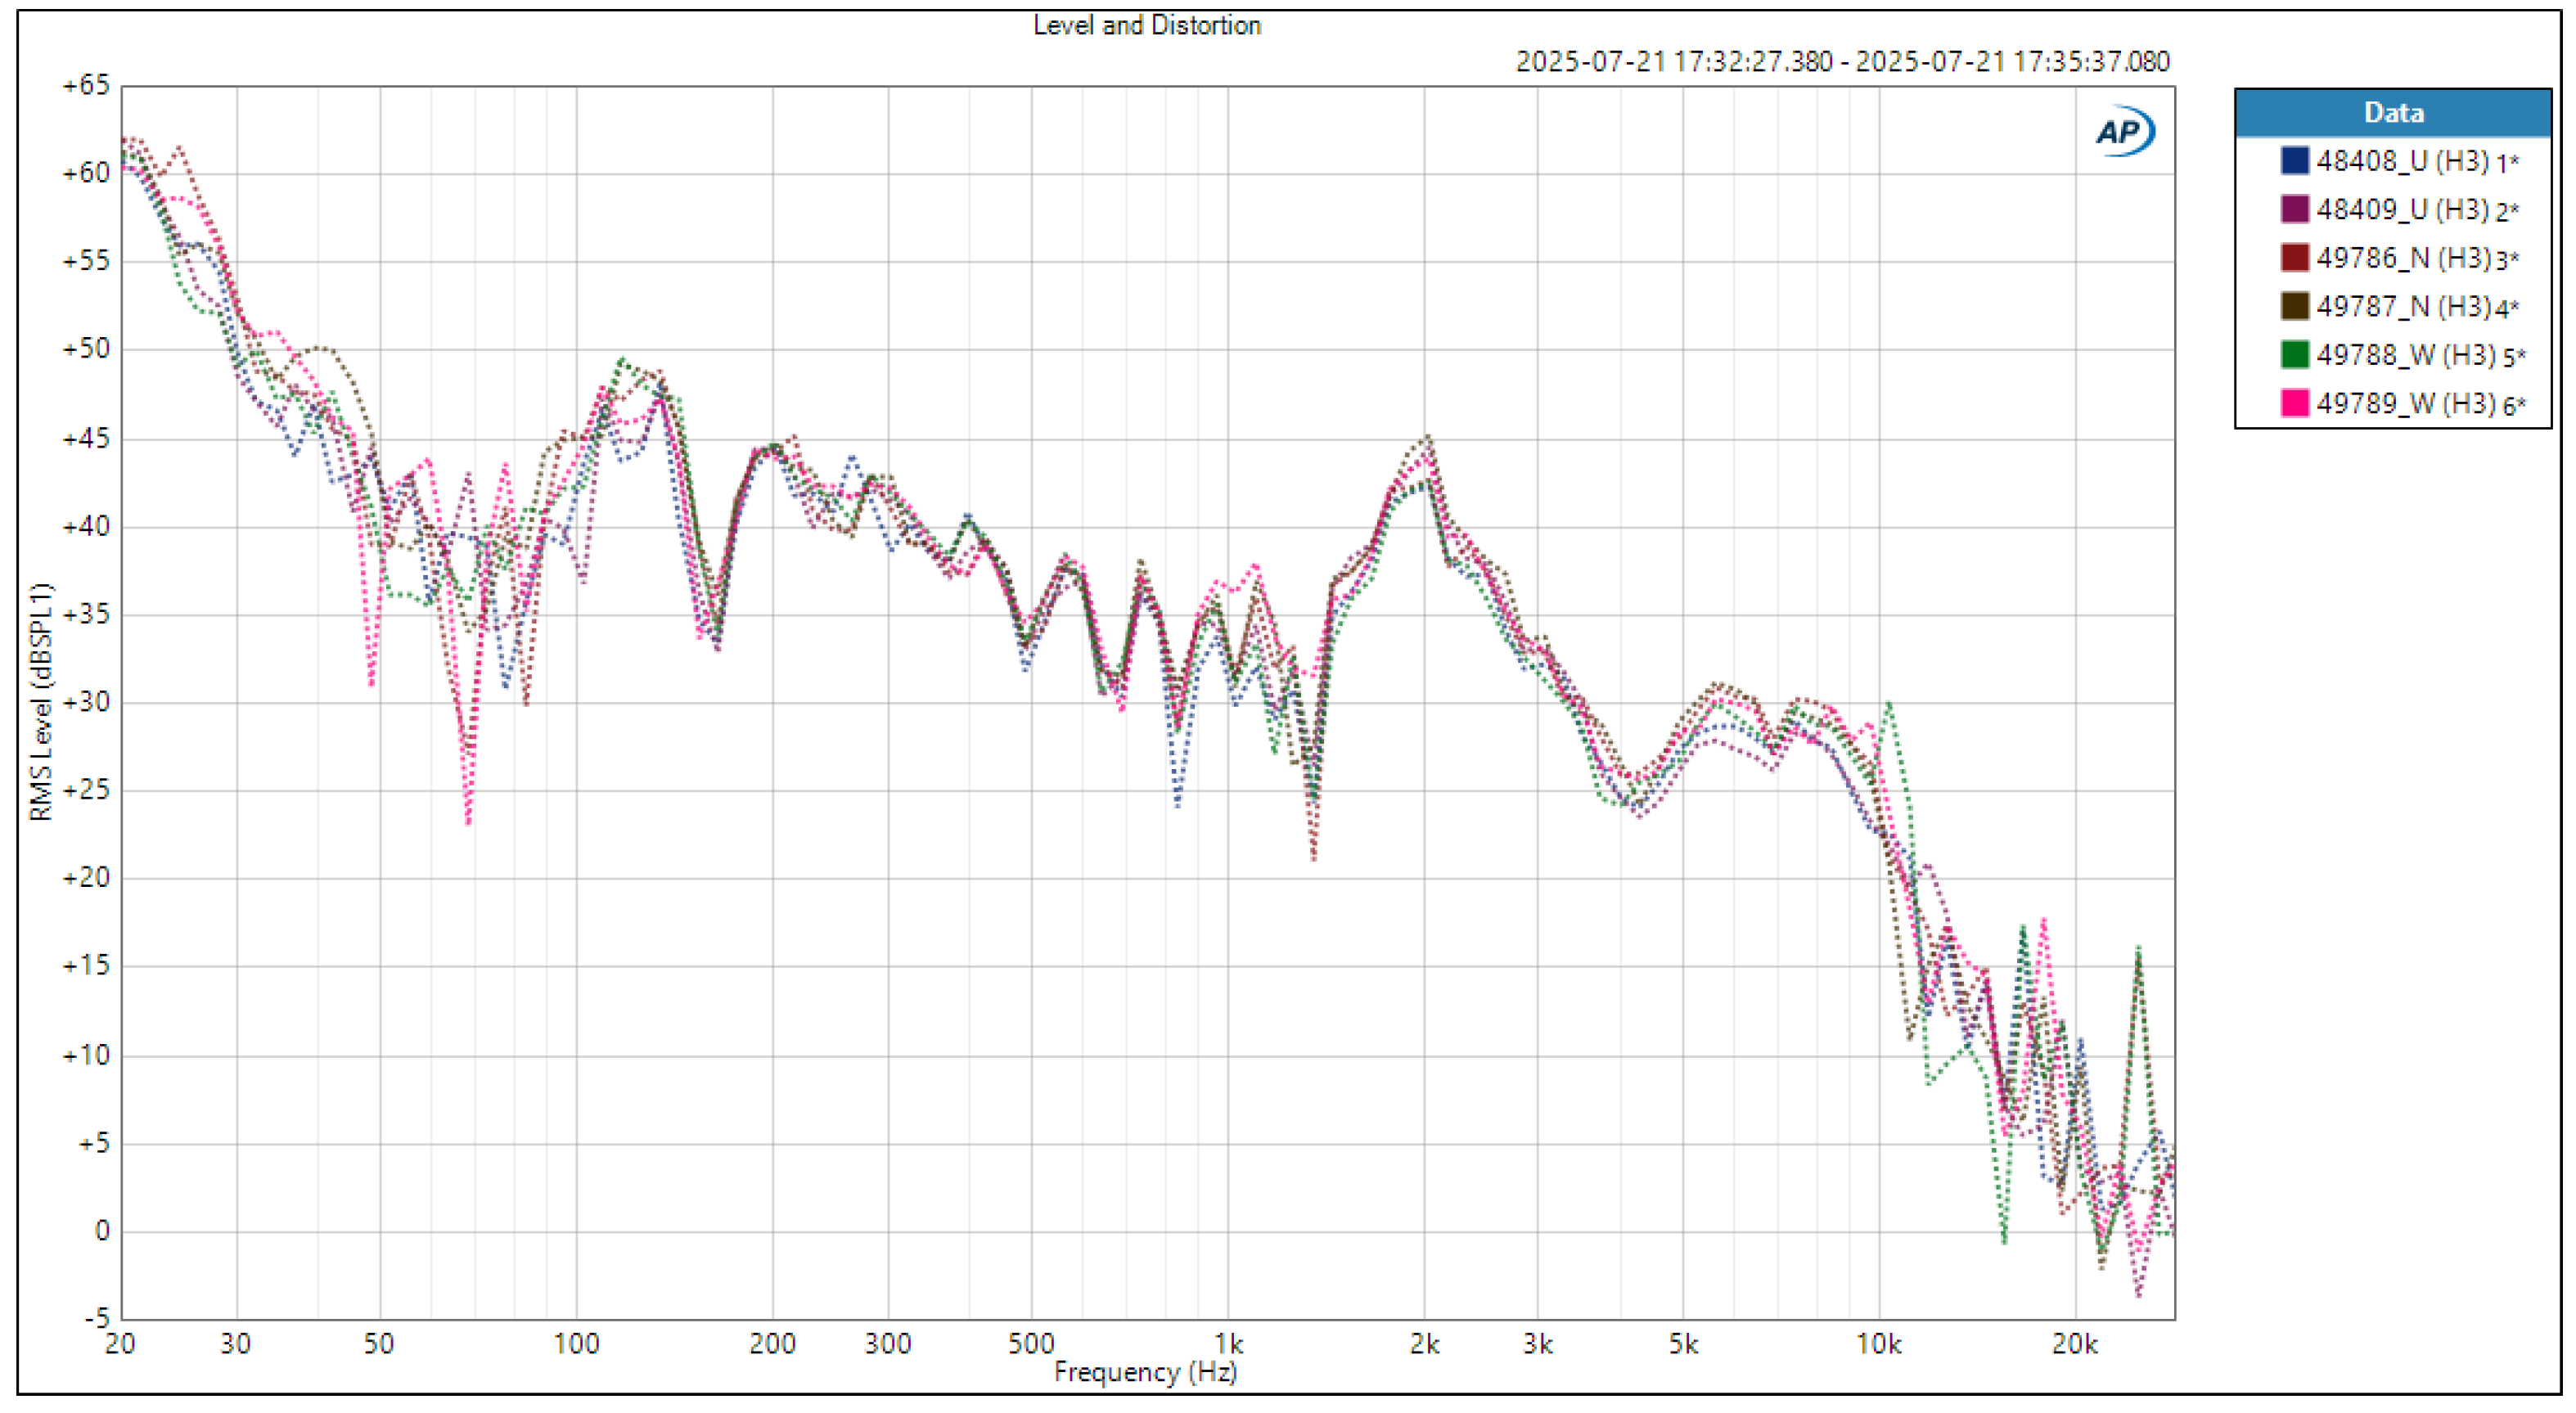
Figure 6,
Figure 7 and
Figure 8 present the plots of the second and third harmonic distortion components, as well as the total harmonic distortion (THD). Harmonic distortion arises from nonlinearities in the components of the complete vibratory system, such as the upper suspension and the spider [
8]. The distortion values across all tested loudspeaker systems are consistent with one another, indicating that the burn-in process does not have a significant impact on harmonic distortion.
5. Subjective Measurements
5.1. Test Signals
The test material consisted of 15 s excerpts from musical tracks representing three different genres:
Pop: “Alone” by Halsey (0:16–0:31);
Jazz: “Tonight” by Oscar Peterson (0:32–0:47);
Rock: “Teardrops” performed by Bring Me The Horizon (0:09–0:24).
Each sample had a duration of 15 s [
9,
10,
11].
5.2. Test Group
An expert group consisting of 11 participants took part in the study. Prior to the listening tests, each participant underwent audiometric screening. All individuals demonstrated normal hearing, with thresholds ranging from −5 dB to +0 dB HL (Hearing Level).
5.3. Evaluation Method
The evaluated sensory attributes were transparency, dynamics, sound clarity, and overall assessment. A comparative method using a 7-point CCR (Comparison Category Rating) scale [
12] was used to conduct the evaluation in the study. The point scale is presented in
Table 1.
5.4. Experimental Procedure
To conduct a detailed analysis, the study was divided into three experiments in which the following device comparisons were made:
All tests were carried out in an acoustic chamber (absorbing walls and ceiling, reflective rectangular floor, volume of 815 m
3, ceiling height 6.5 m) at Wrocław University of Science and Technology, compliant with the recommendations [
13,
14]. The loudspeaker sets were positioned at a distance of four meters. The listening point was determined based on documents [
15,
16] (listening area 2–4 m from measured devices, area radius ≤ 0.7 m). The sound level at the reference point, measured with a Class I sound-level meter, was 85 dB.
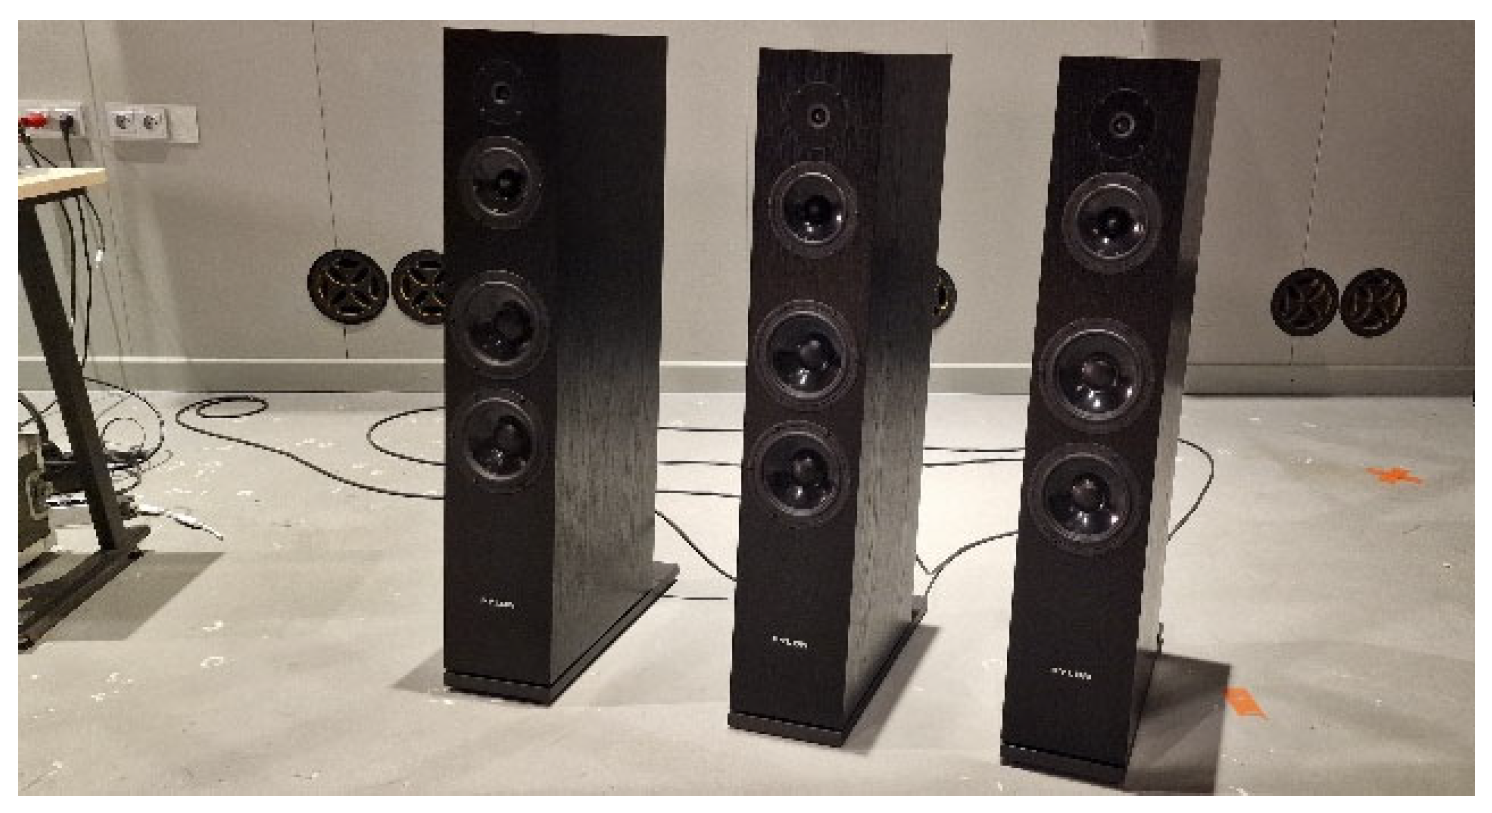
Figure 9 shows the listening spot and speaker system setup.
The tests were based on comparative evaluation, where audio samples were played in four sequences: A-A, B-B, A-B, and B-A. The A-A and B-B sequences served as control sequences. The interval between individual samples within a measurement sequence was 5 s, and the interval between successive sequences was 15 s, during which listeners performed their evaluations [
17]. A 20 min break was provided for listeners before each subsequent experiment.
Figure 9,
Figure 10 and
Figure 11 depict the listening area and the speaker systems under examination. Although all systems were of the same model, they were produced at different times. To maintain equal distances between the tested speakers, they were arranged from left to right in the following sequence: new, used, burned-in, new, used, burned-in.
5.5. Evaluation of the Collected Data
To perform the analysis of the results, various statistical measures and tests were conducted and presented in the form of tables and charts. To illustrate the differences between the sequences, the mean values for individual sensory attributes and music genres were calculated (
Figure 12,
Figure 13 and
Figure 14).
For a more detailed analysis, two types of statistical tests were applied: Levene’s test (Tables 2, 4 and 6) and ANOVA (Tables 3, 5 and 7). The former determines whether the mean values of the individual groups are equal. Levene’s test is used to assess the homogeneity of variances. The null hypothesis assumes that these values are equal. The significance level, i.e., the statistical threshold, was set at α = 0.05 for both tests.
All statistical tests and charts were generated using the STATISTICA 13.3 software [
18,
19,
20].
5.6. Analysis of the First Measurement
Figure 12 presents the differences across various music genres. Listeners evaluated rock music samples similarly across all sensory attributes—for transparency, the average rating was 0. In the case of pop music, the ratings were slightly lower; however, the average for dynamics was above 0. Jazz music showed greater variation in ratings across different sensory attributes. All observed differences were minor, and the confidence interval did not exceed 0.2.
Figure 12.
Mean ratings with 75% confidence intervals for new and used audio evices.
Figure 12.
Mean ratings with 75% confidence intervals for new and used audio evices.
The chart illustrating the average differences for playback sequences shows variation across different configurations. However, the A–A test sequence was centered around 0 for all evaluated parameters. The visible discrepancies were minor and may have resulted from the listeners’ emotional state or unconscious expectation of a difference.
The statistical analyses shown in
Table 2 and
Table 3 revealed no statistically significant effects. Specifically, Levene’s test confirmed the assumption of homogeneity of variances, indicating that the variability within groups (new vs. used devices) is comparable. Furthermore, the ANOVA results showed no significant differences in mean scores across the evaluated variables. These findings suggest that the condition of the device—whether new or used—did not have a measurable impact on participants’ perceptions in terms of clarity, dynamics, brightness of sound, or overall evaluation.
Table 2.
Levene’s test for homogeneity of variance for new and used devices.
Table 2.
Levene’s test for homogeneity of variance for new and used devices.
| Variable | SS Effect | df Effect | MS Effect | SS Error | df Error | MS Error | F | p |
|---|
| Clarity | 0.516 | 2 | 0.258 | 65.930 | 129 | 0.511 | 0.505 | 0.605 |
| Dynamics | 0.317 | 2 | 0.159 | 56.057 | 129 | 0.435 | 0.365 | 0.695 |
| Brightness | 1.796 | 2 | 0.898 | 45.091 | 129 | 0.350 | 2.569 | 0.080 |
| Overall rating | 1.705 | 2 | 0.853 | 73.464 | 129 | 0.569 | 1.497 | 0.228 |
Table 3.
Analysis of variance (ANOVA) for new and used devices.
Table 3.
Analysis of variance (ANOVA) for new and used devices.
| Variable | SS Effect | df Effect | MS Effect | SS Error | df Error | MS Error | F | p |
|---|
| Clarity | 0.045 | 2 | 0.023 | 111.682 | 129 | 0.866 | 0.026 | 0.974 |
| Dynamics | 0.197 | 2 | 0.098 | 109.886 | 129 | 0.852 | 0.116 | 0.891 |
| Brightness | 1.106 | 2 | 0.553 | 87.409 | 129 | 0.678 | 0.816 | 0.444 |
| Overall rating | 0.288 | 2 | 0.144 | 137.591 | 129 | 1.067 | 0.135 | 0.874 |
This outcome supports the notion that both device types performed similarly from the users’ perspective, at least within the scope of the tested parameters. It may also imply that other factors, such as user expectations, environmental conditions, or individual preferences, play a more substantial role in shaping subjective evaluations than the device’s usage status alone.
5.7. Analysis of the Second Measurement
Figure 13 shows that the values are centered around zero. There are no visible differences between musical genres. In the case of test sequences, the new devices appear to be rated slightly more favorably. The test sequences cluster around zero for all perceptual features, as expected.
Figure 13.
Mean ratings with 75% confidence intervals for new and burned-in audio devices.
Figure 13.
Mean ratings with 75% confidence intervals for new and burned-in audio devices.
The statistical tests shown in
Table 4 and
Table 5 conducted for the second measurement revealed no statistically significant effects. Levene’s test confirmed the assumption of homogeneity of variances, indicating that the variability within groups (new vs. conditioned devices) is consistent across all perceptual features. Additionally, the ANOVA results showed no significant differences in mean ratings between the devices.
Table 4.
Levene’s test for homogeneity of variance for new and burned-in devices.
Table 4.
Levene’s test for homogeneity of variance for new and burned-in devices.
| Variable | SS Effect | df Effect | MS Effect | SS Error | df Error | MS Error | F | p |
|---|
| Clarity | 0.423 | 2 | 0.211 | 52.275 | 129 | 0.405 | 0.522 | 0.595 |
| Dynamics | 1.026 | 2 | 0.513 | 44.161 | 129 | 0.342 | 1.499 | 0.227 |
| Brightness | 0.138 | 2 | 0.069 | 54.391 | 129 | 0.427 | 0.163 | 0.850 |
| Overall rating | 0.497 | 2 | 0.248 | 56.775 | 129 | 0.440 | 0.565 | 0.570 |
Table 5.
Analysis of variance (ANOVA) for new and burned-in devices.
Table 5.
Analysis of variance (ANOVA) for new and burned-in devices.
| Variable | SS Effect | df Effect | MS Effect | SS Error | df Error | MS Error | F | p |
|---|
| Clarity | 0.197 | 2 | 0.098 | 91.773 | 129 | 0.711 | 0.138 | 0.871 |
| Dynamics | 1.470 | 2 | 0.735 | 96.409 | 129 | 0.747 | 0.983 | 0.377 |
| Brightness | 0.106 | 2 | 0.053 | 92.523 | 129 | 0.717 | 0.074 | 0.929 |
| Overall rating | 0.652 | 2 | 0.326 | 124.341 | 129 | 0.964 | 0.338 | 0.714 |
These findings suggest that the process of burning in the device did not lead to perceptible improvements in sound quality as evaluated by listeners. The mean values for all tested features—clarity, dynamics, brightness of sound, and overall evaluation—clustered around zero, indicating a general consistency in perception regardless of device condition. Moreover, the lack of visible differences across musical genres further supports the conclusion that the device’s usage state does not significantly influence subjective auditory impressions.
This outcome reinforces the reliability and consistency of the devices tested and suggests that any perceived differences may be more influenced by individual listener expectations or contextual factors rather than by the physical state of the equipment.
5.8. Analysis of the Third Measurement
Figure 14 shows that the values are centered around zero. There are no visible differences between the test sequences. Jazz music slightly deviates from the other musical genres, but the differences are minimal.
Figure 14.
Mean ratings with 75% confidence intervals for used and burned-in audio devices.
Figure 14.
Mean ratings with 75% confidence intervals for used and burned-in audio devices.
The statistical tests conducted for the third measurement, shown in
Table 6 and
Table 7, revealed no statistically significant effects. Levene’s test confirmed the assumption of homogeneity of variances, indicating that the variability within groups (used vs. conditioned devices) is consistent across all perceptual features. Similarly, the ANOVA results showed no significant differences in mean ratings between the devices.
Table 6.
Levene’s test for homogeneity of variance for burned-in and used devices.
Table 6.
Levene’s test for homogeneity of variance for burned-in and used devices.
| Variable | SS Effect | df Effect | MS Effect | SS Error | df Error | MS Error | F | p |
|---|
| Clarity | 0.721 | 2 | 0.361 | 44.142 | 129 | 0.342 | 1.054 | 0.351 |
| Dynamics | 0.529 | 2 | 0.264 | 37.051 | 129 | 0.287 | 0.920 | 0.401 |
| Brightness | 0.601 | 2 | 0.301 | 36.119 | 129 | 0.280 | 1.073 | 0.345 |
| Overall rating | 0.642 | 2 | 0.321 | 45.903 | 129 | 0.356 | 0.902 | 0.408 |
Table 7.
Analysis of variance (ANOVA) for used and burned-in devices.
Table 7.
Analysis of variance (ANOVA) for used and burned-in devices.
| Variable | SS Effect | df Effect | MS Effect | SS Error | df Error | MS Error | F | p |
|---|
| Clarity | 2.470 | 2 | 1.235 | 90.046 | 129 | 0.698 | 1.769 | 0.175 |
| Dynamics | 1.379 | 2 | 0.689 | 75.136 | 129 | 0.582 | 1.184 | 0.309 |
| Brightness | 1.773 | 2 | 0.886 | 67.136 | 129 | 0.520 | 1.703 | 0.186 |
| Overall rating | 2.970 | 2 | 1.485 | 100.000 | 129 | 0.775 | 1.915 | 0.151 |
The statistical analysis indicates that, across all tests, the loudspeaker devices were evaluated consistently, with mean values remaining nearly identical. The plotted means are centered around zero and do not exceed a difference of 0.5. No significant differences were found between musical genres—any variations observed were minimal or negligible.
These slight discrepancies may stem from a subconscious desire to detect differences, and the observed deviations could be the result of illusory perception rather than actual acoustic differences.
6. Conclusions
Objective tests revealed the presence of slight differences in the impedance module characteristics of the analyzed loudspeaker sets. These differences result from increased compliance of the suspensions used in the transducers. Measurements of frequency responses and impedance modules of the tested sets showed discrepancies caused by technological processes on the assembly lines—both in the transducers themselves and in the complete loudspeaker systems.
Changes in transducer parameters due to usage should not deviate more than 10% to 15% from their initial values. These differences are measured by performing a series of tests on a new transducer, followed by a 24 h operation using a program-type signal adjusted to the transducer’s frequency range and at a voltage corresponding to its nominal power. After this period, the transducer is subjected to the same tests again, and the changes between the two-measurement series are analyzed. If the changes exceed the limits defined by standards (± 10–15%), the entire production batch is considered defective.
Subjective tests did not reveal any significant differences between the tested pairs of loudspeaker sets. This aligns with the objective findings, which showed greater variation between units within the same production batch than between new, used, and conditioned (burned-in) sets. The expert panel consistently reported no noticeable changes in clarity, dynamics, brightness, or overall evaluation—regardless of musical genre or test sequence.
The lack of perceived differences due to burning in is further supported by the fact that changes were reported in identical test sequences (A–A and B–B), while no differences were observed in cross-sequences (A–B and B–A). This suggests that the observed variations may stem from a subconscious desire to detect differences or from the emotional state of the expert group.
In conclusion, burning in of loudspeaker sets results in minor changes to transducer parameters—as confirmed by objective tests (e.g., changes in suspension compliance)—but these do not significantly affect measurable acoustic parameters. In fact, greater discrepancies were observed among devices from the same production series than between new, used, and conditioned sets.
Author Contributions
Conceptualization, T.K. and B.K.; methodology, T.K., B.K. and J.K.; software, T.K.; validation, T.K., B.K. and J.K.; formal analysis, T.K. and J.K.; investigation, T.K., B.K. and J.K.; resources, B.K.; data curation, T.K.; writing—original draft preparation, T.K.; writing—review and editing, T.K. and B.K.; visualization, T.K.; supervision, T.K.; project administration, T.K.; funding acquisition, B.K. All authors have read and agreed to the published version of the manuscript.
Funding
This research received no external funding.
Institutional Review Board Statement
Not applicable.
Informed Consent Statement
Informed consent was obtained from all subjects involved in the study.
Data Availability Statement
The original contributions presented in this study are included in the article. Further inquiries can be directed to the corresponding author.
Conflicts of Interest
The authors declare no conflicts of interest.
References
- Klippel, W. Mechanical Fatigue and Load-Induced Aging of Loudspeaker Suspension; Audio Engineering Society: New York, NY, USA, 2011; pp. 20–23. [Google Scholar]
- Chojnacki, B. Dispersion Influence of Electroacoustic Transducer Parameters in the Design Process of Miniature Loudspeaker Arrays and Omnidirectional Sound Sources. Sensors 2024, 24, 4958. [Google Scholar] [CrossRef] [PubMed]
- Małek-Orłowska, M.K.; Jach, K. Aspekty normatywne i aktualna sytuacja komisji etyki badań naukowych z udziałem ludzi na polskich uczelniach technicznych. Diametros 2022, 19, 19–35. [Google Scholar] [CrossRef]
- PN-EN 60268-5:2021; Urządzenia Systemów Elektroakustycznych. Część 5: Głośniki. Polski Komitet Normalizacyjny: Warszawa, Poland, 2021.
- AES75-2023; AES Standard for Acoustics-Measuring Loudspeaker Maximum Linear Sound Levels Using Noise. Audio Engineering Society: New York, NY, USA, 2023.
- Sanfilipo, M. Loudspeaker Break In: Fact or Fiction? Available online: https://www.audioholics.com/loudspeaker-design/speaker-break-in-fact-or-fiction (accessed on 18 July 2024).
- Winer, E. The Audio Expert: Everything You Need to Know About Audio; Routledge: London, UK, 2017. [Google Scholar]
- Brüel & Kjær Automatic Quality Testing of Loudspeaker Eiectroacoustic. Available online: https://www.hbkworld.com/en/solutions/applications/acoustics/electroacoustics/speaker-testing (accessed on 18 July 2024).
- ITU-R BS.562-3; Subjective Assessment of Sound Quality. ITU-R: Geneva, Switzerland, 1978.
- ITU-R BS.1284-2; General Methods for the Subjective Assessment of Sound Quality. ITU-R: Geneva, Switzerland, 2019.
- ITU-T P.913; Methods for the Subjective Assessment of Video Quality, Audio Quality and Audiovisual Quality of Internet Video and Distribution Quality Television in Any Environment. ITU-T: Geneva, Switzerland, 2014.
- ITU-T P.800; Methods for Subjective Determination of Transmission Quality. ITU-T: Geneva, Switzerland, 1996.
- AES20-1996; AES Recommended Practice for Professional Audio—Subjective Evaluation of Loudspeakers. Audio Engineering Society: New York, NY, USA, 1996.
- ITU-R BS.1116-3; Methods for the Subjective Assessment of Small Impairments in Audio Systems. ITU-R: Geneva, Switzerland, 2015.
- EBU Tech. 3276; Listening Conditions for the Assessment of Sound Programme Material: Monophonic and Two–Channel Stereophonic. EBU: Singapore, 1998.
- EBU Tech. 3686-E; Assessment Methods for the Subjective Evaluation of the Quality of Sound Programme Material–Music. EBU: Singapore, 1997.
- Ahmed, E.; Hossain, S.; Raheem, E. Absolute Penalty Estimation. International Encyclopedia of Statistical Science; Springer: Berlin/Heidelberg, Germany, 2011. [Google Scholar]
- Breitsohl, H. Beyond ANOVA: An Introduction to Structural Equation Models for Experimental Designs. Organ. Res. Methods 2019, 22, 649–677. [Google Scholar] [CrossRef]
- Solari, A.; Basso, D.; Pesarin, F.; Salmaso, L. Permutation Tests for Stochastic Ordering and ANOVA: Theory and Applications with R, Lecture Notes in Statistics, 1st ed.; Springer: New York, NY, USA, 2009; Volume 194, ISBN 9780387859552. [Google Scholar]
- Rouder, J.N.; Engelhardt, C.R.; McCabe, S.; Morey, R.D. Model Comparison in ANOVA. Psychon. Bull. Rev. 2016, 23, 1779–1786. [Google Scholar] [CrossRef] [PubMed]
| Disclaimer/Publisher’s Note: The statements, opinions and data contained in all publications are solely those of the individual author(s) and contributor(s) and not of MDPI and/or the editor(s). MDPI and/or the editor(s) disclaim responsibility for any injury to people or property resulting from any ideas, methods, instructions or products referred to in the content. |
© 2025 by the authors. Licensee MDPI, Basel, Switzerland. This article is an open access article distributed under the terms and conditions of the Creative Commons Attribution (CC BY) license (https://creativecommons.org/licenses/by/4.0/).


