Abstract
An innovative solar monitoring system has been developed. The system aimed at measuring the main parameters and characteristics of solar plants; collecting, diagnosing and processing data. The system communicates with the inverters, electrometers, metrological equipment and additional components of the photovoltaic arrays. The developed and constructed long working system is built on special data collecting technologies. At the generating plants, a special data logger BBbox is installed. The new monitoring system has been used to follow 65 solar plants in the Czech Republic and elsewhere for 175 MWp. As an example, we have selected 13 PV plants in this paper that are at least seven years old. The monitoring system contributes to quality management of plants, and it also provides data for scientific purposes. Production of electricity in the built PV plants reflects the expected values according to internationally used software PVGIS (version 5) during the previous seven years of operation. A comparison of important system parameters clearly shows the new solutions and benefits of the new Solarmon-2.0 monitoring system. Secured communications will increase data protection. A higher frequency of data saving allows higher accuracy of the mathematical models.
1. Introduction
Growing interest and investments in photovoltaic (PV) technology as a consequence of increased lifespan and efficiency, the decrease of PV modules’ price and the reduction of the environmental impact of solar systems in comparison to traditional fossil fuel technologies have led to many PV systems and big solar plants being installed.
Monitoring of PV system plants is an urgent and imperative activity for practical implementation of new ecologically clean solar plants due to the information that allows owners to maintain, operate and control these systems, to reduce maintenance costs and to avoid unwanted electric power disruptions. Different monitoring systems with various requirements have been reviewed and described in [1].
The functioning of solar photovoltaic arrays obviously requires having high quality real-time measurements (monitoring) and a data storing system for several essential parameters; see also, for example, [2,3,4,5]. A wide variety of the control and monitoring systems for photovoltaic arrays was discussed in [6,7,8,9,10,11,12,13,14].
The works [15,16] described Lab-VIEW software, maximum power point tracking algorithms, a monitoring system with the implementation of metrological data and solar irradiation with the help of satellites, which were employed for displaying, storing and processing the obtained monitoring data, which enabled forecasting of sunny and cloudy hours. In the future, more and more PV systems will be integrating with other renewable systems and GIS systems designed for optimal collecting and distributing of electrical power nets according to the consumer demand.
The work [17] discussed monitoring of the damaged PV solar modules by a drone. The main reasons for the failures of PV solar modules were summarized, for instance, in the report [18].
One more important example of a real-time monitoring system is rMeter™, developed by Loren Kallevig and Ron Swenson [19]. This site presents useful information on PV systems for Northern California on the web. All data are collected and stored on a server with backup. Data are collected by the data loggers and periodically pushed to the central server, where they may be accessible to the public or password protected with restricted access. These are some of the components that go into a typical data monitoring installation. Optional items such as wireless communication and a display kiosk are also included. Some owners and clients choose to display their rMeter™ data on-site to inform their employees about their assurance of energy independence. This is the paradigm of a self-contained display station.
Solar radiation monitoring is an important part for any monitoring system. The University of Oregon Solar Radiation Monitoring Laboratory is a solar radiation data center, whose goal is to provide important solar resource data for planning, designing, deployment and operation of solar electric facilities in the Pacific Northwest of the USA [20]. Creating the short- and long-term solar radiation database necessary to achieve this goal requires persistence, the maintenance of high standards and an effort to inform and educate people about the importance of a solar radiation database and how to process the versatile data. Both Internet resources [19,20] are very useful for educational activities, particularly for students of different universities in CA, like San Jose State University.
The paper [21] discussed photovoltaic module performance measurements’ traceability and mentioned that improved uncertainty is a key factor for the fast-growing PV market and has a huge impact on the economy and environment.
In solar power generation systems, the existence of faults in any PV module of the array may lead to reductions in overall power generation [22]. This paper considered testing results used to ascertain the feasibility of the photovoltaic generation fault diagnosis meter. However, it is very suitable for development only into a portable solar power generation system fault and flaw diagnosis meter.
The goal of the current paper is to describe experience in creating a new expensive monitoring system. We start from the work described in [23]. In recent years, numerous photovoltaic arrays had been installed in the Czech Republic. At the beginning of 2009, there were approximately 50 MWp of PV photovoltaic arrays and systems, and only after one year in early 2010, there were 460 MWp installed. Furthermore, in early 2011, this reached 2000 MWp. The generated energy from photovoltaic arrays has subsided since 2006. However, until the period between 2007 and 2008, the dramatic decrease in the cost of PV solar modules led to the reduction of photovoltaic arrays and boosted the investment return. The boom lasted for three years from 2008 till the end of 2010, when the drop of government subsidies put an end to this boom. A similar circumstance has happened in several other European countries since the beginning of this century.
This article focuses on designing and testing a unique monitoring system with third generation software for photovoltaic arrays with the cooperation of Solarmonitoring ltd. and the Faculty of Engineering of the Czech University of Life Sciences Prague.
Instead of the usual programmable logic controller (PLC) hardware system, an innovative system using dynamic-link library (DLL) is created. Therefore, the monitoring system is not fixed on a single specific type of hardware. The DLL-based monitoring system can be used on different types of computers with different operating systems (Microsoft, Unix, etc.).
In the paper, data from 13 photovoltaic arrays during seven-year periods are presented. All photovoltaic arrays are equipped with PV solar modules placed on the ground-mounting system and face south (see below). Photovoltaic arrays with the sun-tracking mounting system [24,25] and systems with the concentration of solar radiation were also installed [26,27]. On those photovoltaic arrays, a monitoring system was also installed. However, data used for the comparison were taken from the PV system with a similar construction only. Data were compared with the predicted amount of generated energy for specific locations and photovoltaic array constructions.
The described monitoring systems were installed at 65 photovoltaic plants in total in Czechia and elsewhere (Slovakia, Romani, Chile); see, for example [28].
2. Explanation of the Monitoring System Solarmon-2.0
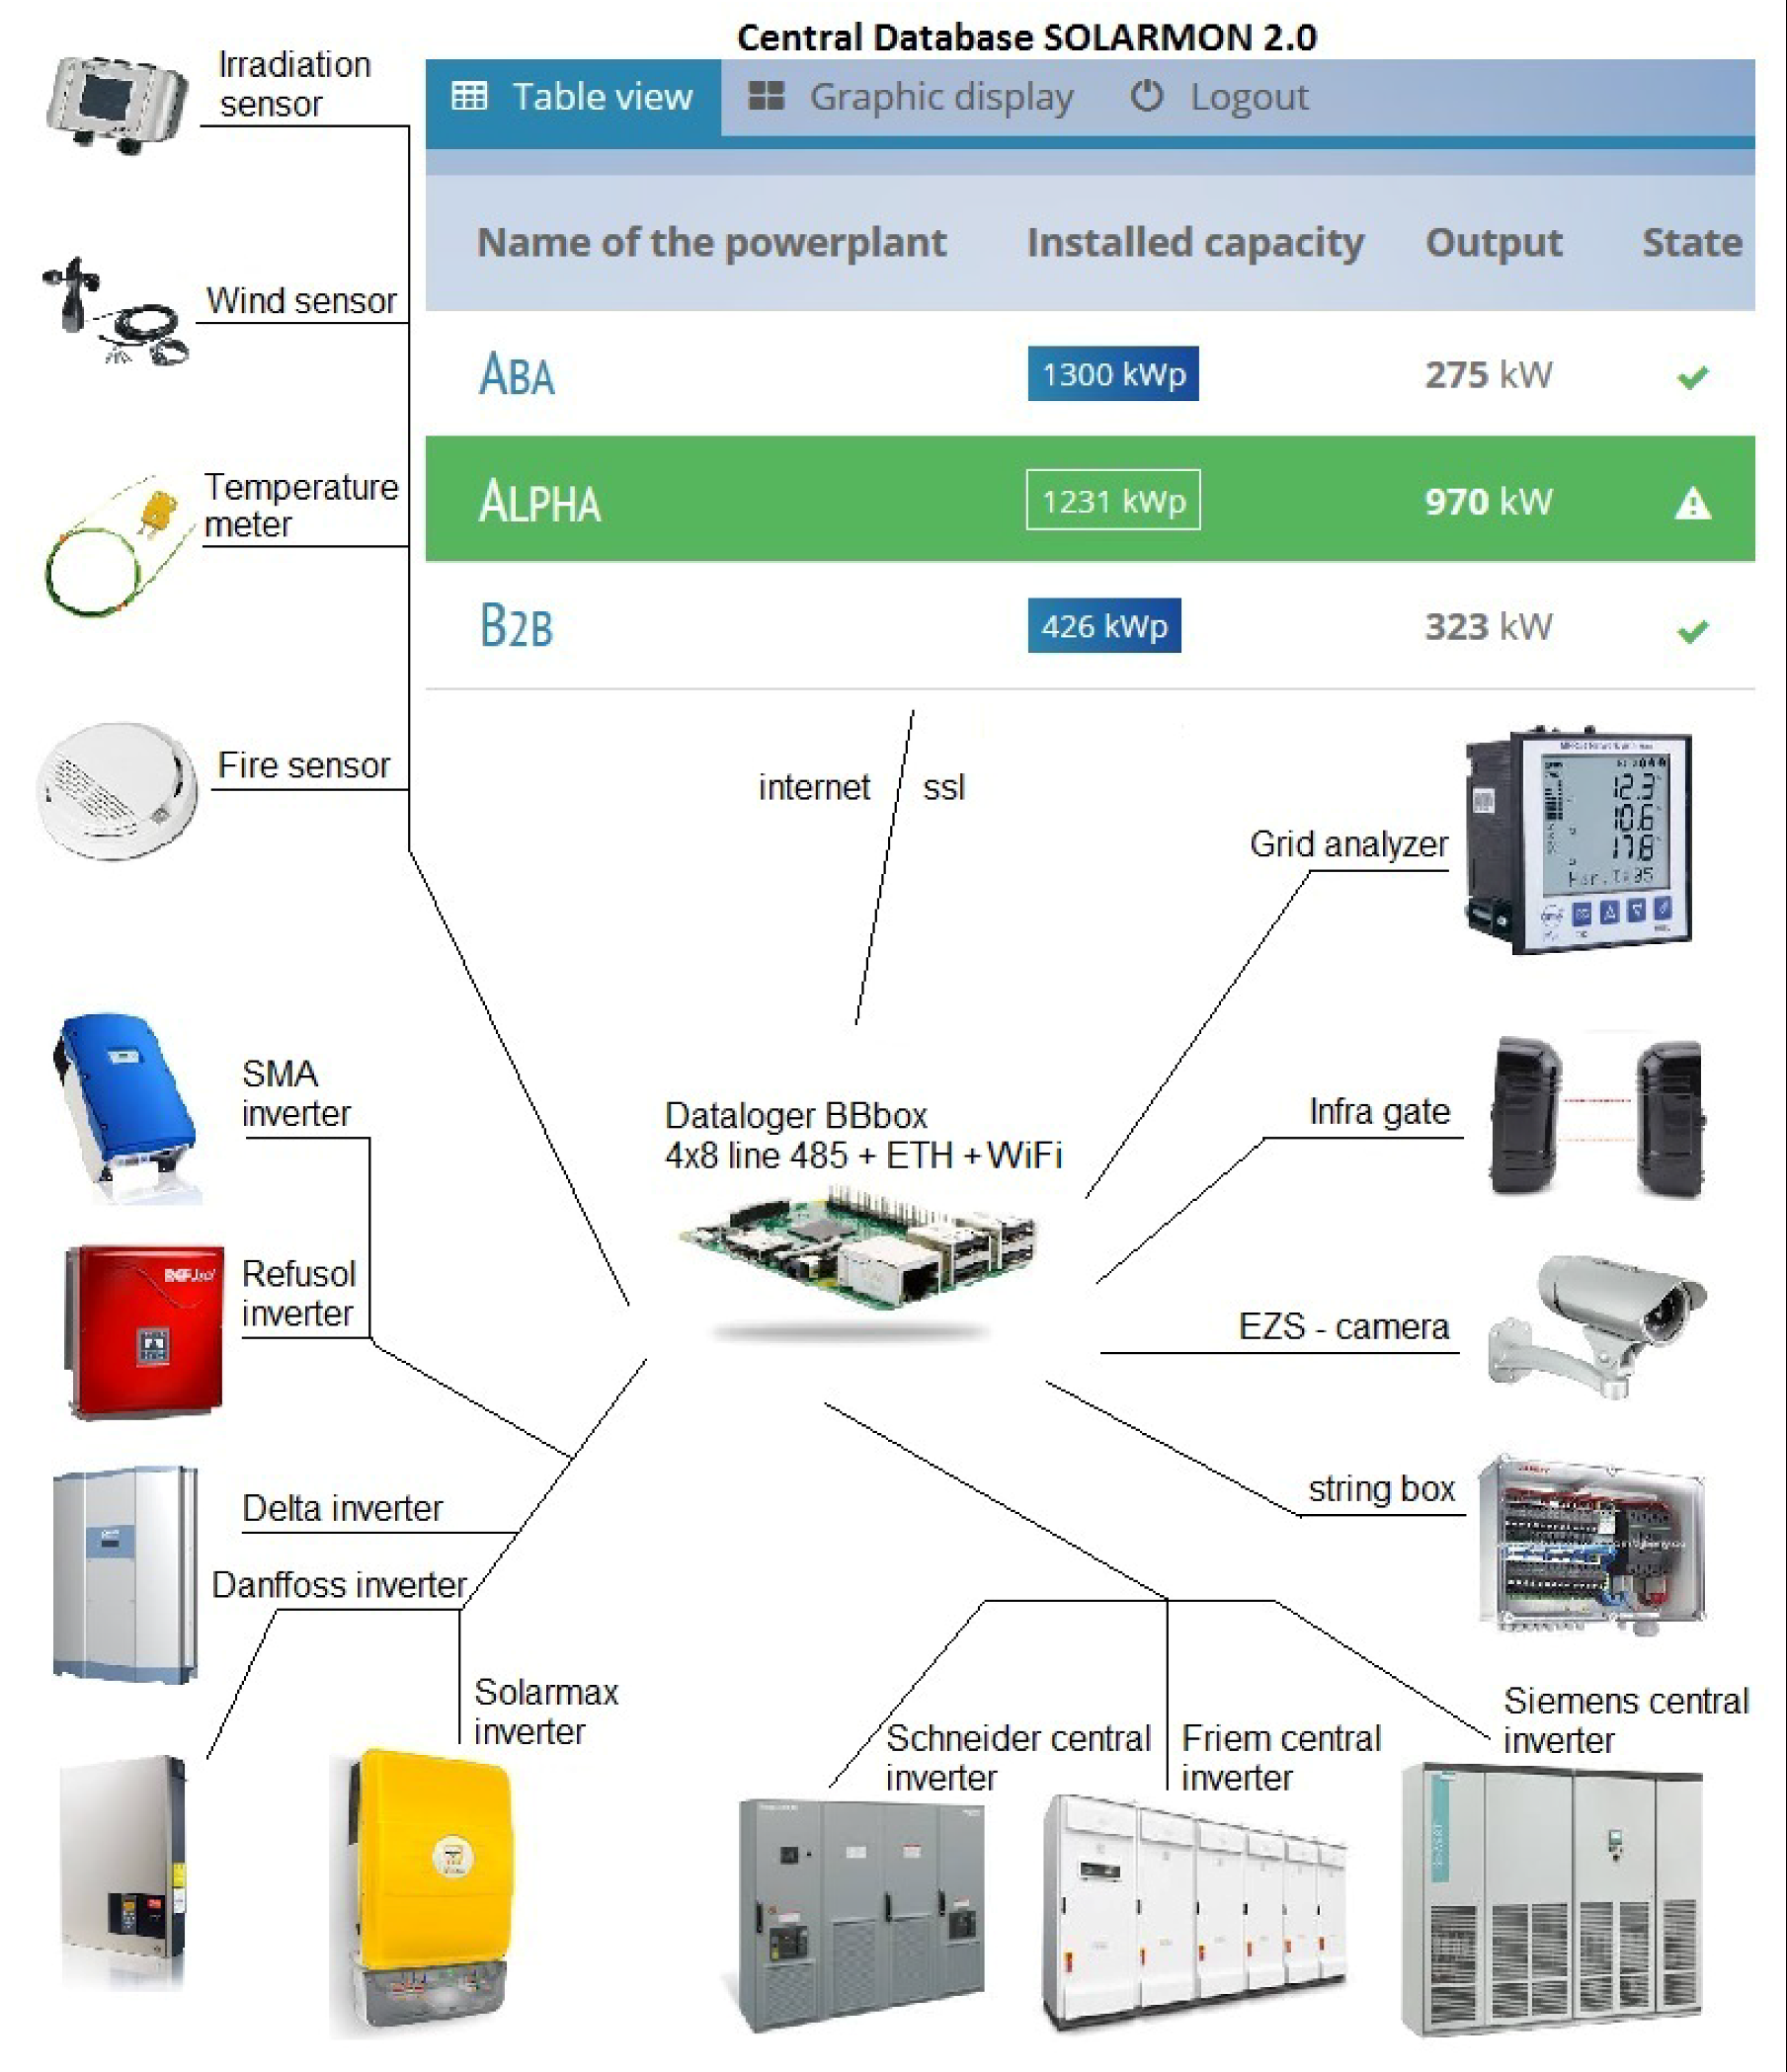
The new monitoring system named Solarmon-2.0 is intended for collecting, diagnosing and processing data. The system communicates with the inverters, electrometers, metrological equipment and external components of the photovoltaic arrays. The whole system is developed and built on special data collecting technology. At the photovoltaic array, a special data logger BBbox is installed. This device has similar functions as the devices used by inverter manufactures DELTA, SMA, Vacon, ABB and DANFFOS (Solar-Log, etc.). On the big photovoltaic arrays, long-distance communication technology has to be used. The data logger is programmed for standard protocols RS485, MODbus and SCADA. This is the most ideal and cost-effective solution for data collection. BBbox is able to communicate with many devices and sensors in the photovoltaic plant (Figure 1) with a responding time from 1–3 s and for distances up to 1200 m. Data signals that are connected to BBbox include outputs from the electric meters on the low voltage (LV) and high voltage (HV) side of the transformer and outputs from inverters of any kind (SMA, Fronius, Kaco, Delta, etc.), as well as a security system such as fire sensor, moving sensors, metrological sensors, thermometers, thermocouples, sensors measuring wind direction and speed and meters measuring irradiance.
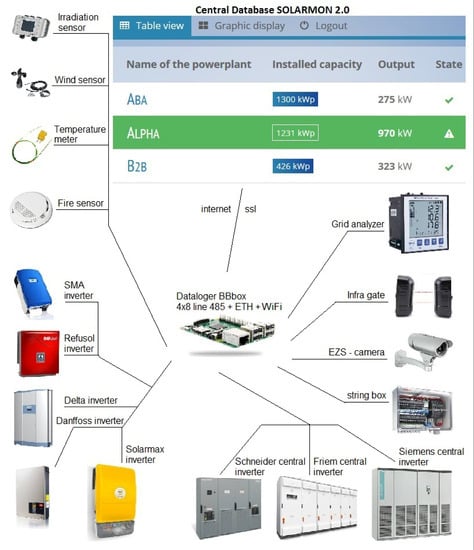
Figure 1.
Scheme of the monitoring system Solarmon-2.0.
Data downloaded to BBox from inverters, substations and other devices are generally processed, stored and properly labeled. Data are sent over a secure SSL channel to the database server Solarmon-2.0. The database can receive and process data from different types of data loggers (see Figure 1). BBbox can exchange information with another BBbox. This opportunity is mainly used in photovoltaic arrays with nominal power above 5 MWp and with a large working area. Communication and transmission of data are mostly done using optical fiber.
Solarmon-2.0 receives raw data from inverters or substations, and according to their priority, the data are categorized and assigned to the appropriate sub-database. The triggers are software algorithms performing regular operations related to the defined time. The operations are for example comparison of the energy and power at inverters and strings. Individual triggers, respectively complex and sophisticated patterns, place the data for individual diagnostic tests. The developed system uses tests for calculating faults and errors, for comparison of inverters and for control of voltage on each branch to evaluate efficiency, energy losses on each individual device and to predict the power from the system. The processed output data are displayed on two types of interface: service and user.
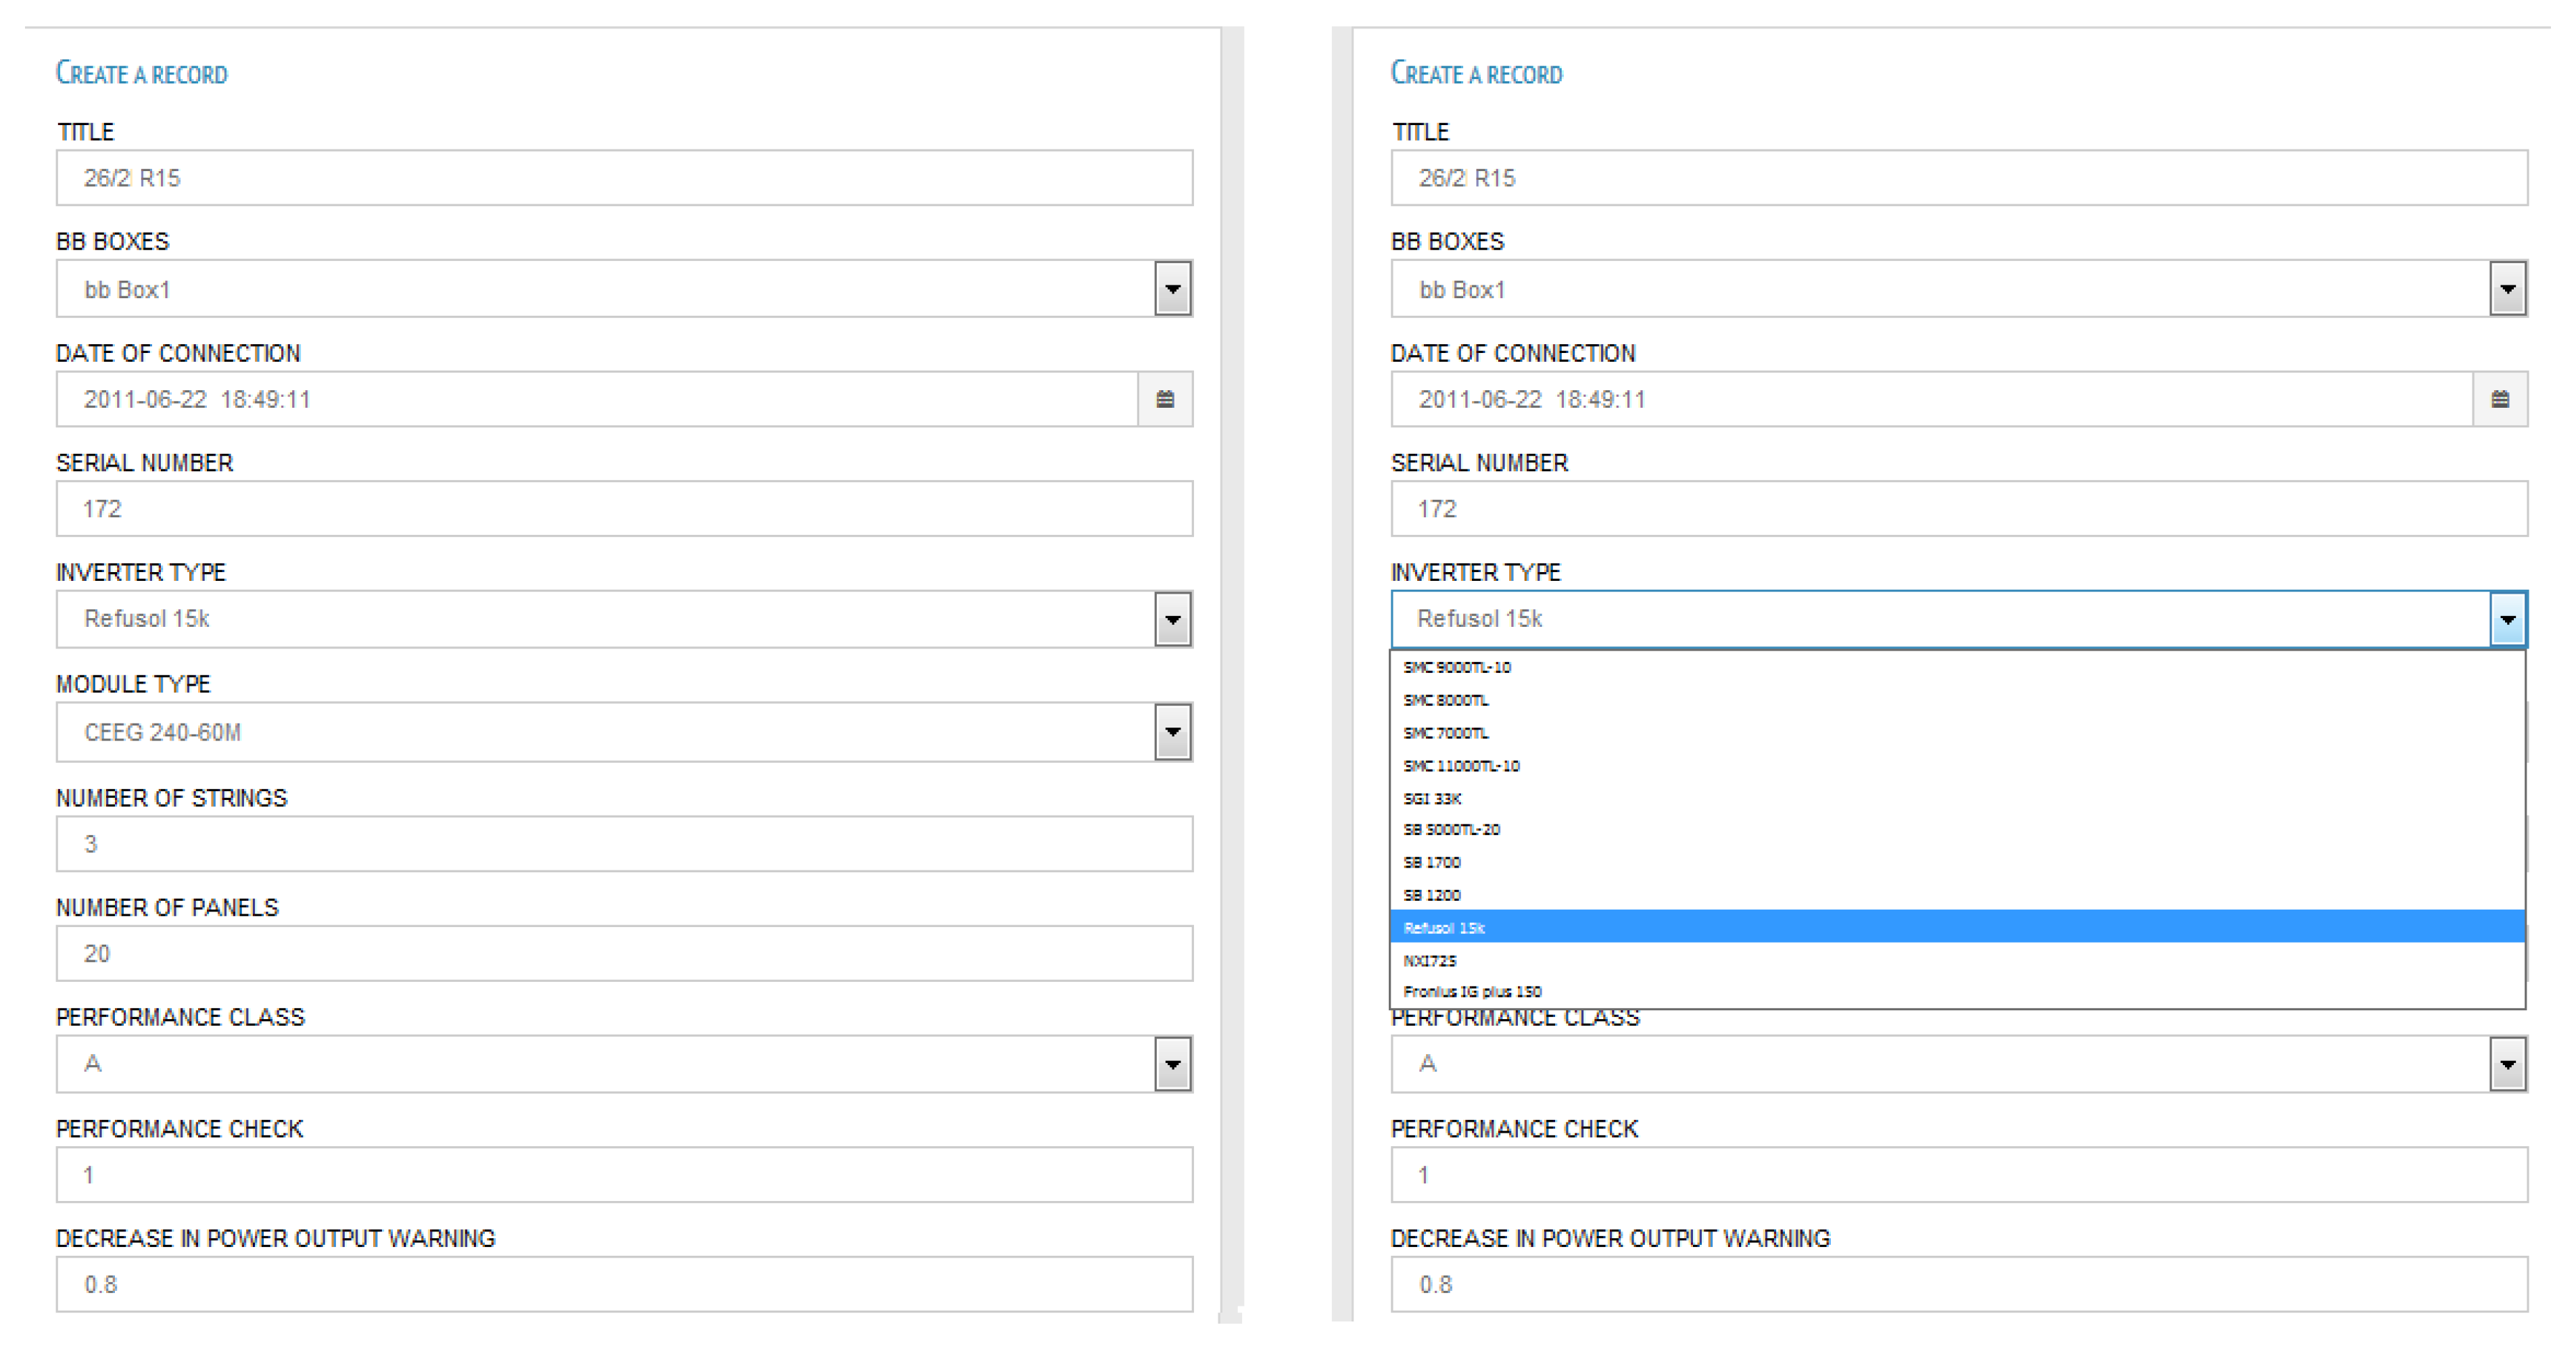
Service interface: This is designed in more detail for service technicians, who require more comprehensive supervision over the photovoltaic array. The service mode identifies and defines the causes of the defects of described errors and the events that have occurred. The service interface allows specifying the parameters of the solar plant, which are an essential part of the algorithm (see Figure 2). The system could define the responsibility for the serviceman of a specific photovoltaic array and set up emails and phone numbers for sending the notice about errors, reports and interruptions. Furthermore, technical specifications such as the type of each panel, inverter and substation could be specified. The limit value of temperature, temperature coefficients and other input data are used to predict the performance of PV solar modules. The chart of the predicted performance is derived from the actual values recorded from the metrological station (temperature + irradiance measuring device of the panel), user-defined values of the active solar modules’ area (area of silicon wafers), the performance of the solar modules, the tolerance of the solar modules, the performance characteristics of the given type of solar modules, the temperature coefficient, the number of solar modules in the string, the number of strings on the inverter and the number of inverters.
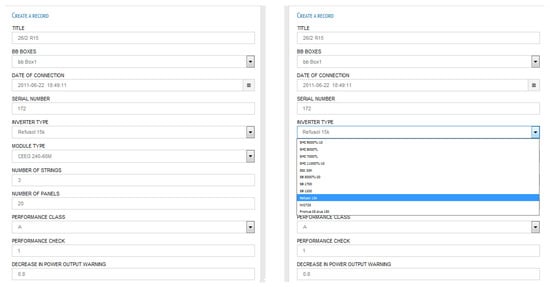
Figure 2.
Service interface of the monitoring system Solarmon-2.0.
The interface for users was developed particularly for investors, bankers, insurance companies and manufacturers of solar modules. The detailed performance is shown for the owners of the photovoltaic arrays. Specifically, the current performance of inverters is shown. It also demonstrates the daily supply and energy consumption, which is an important basis for billing; there are also a monthly invoice template, reports of individual inverters, the calculation of earnings and emission allowances. There is a window called “Failure”, which indicates and sends reports of serious faults and errors in the solar plant.
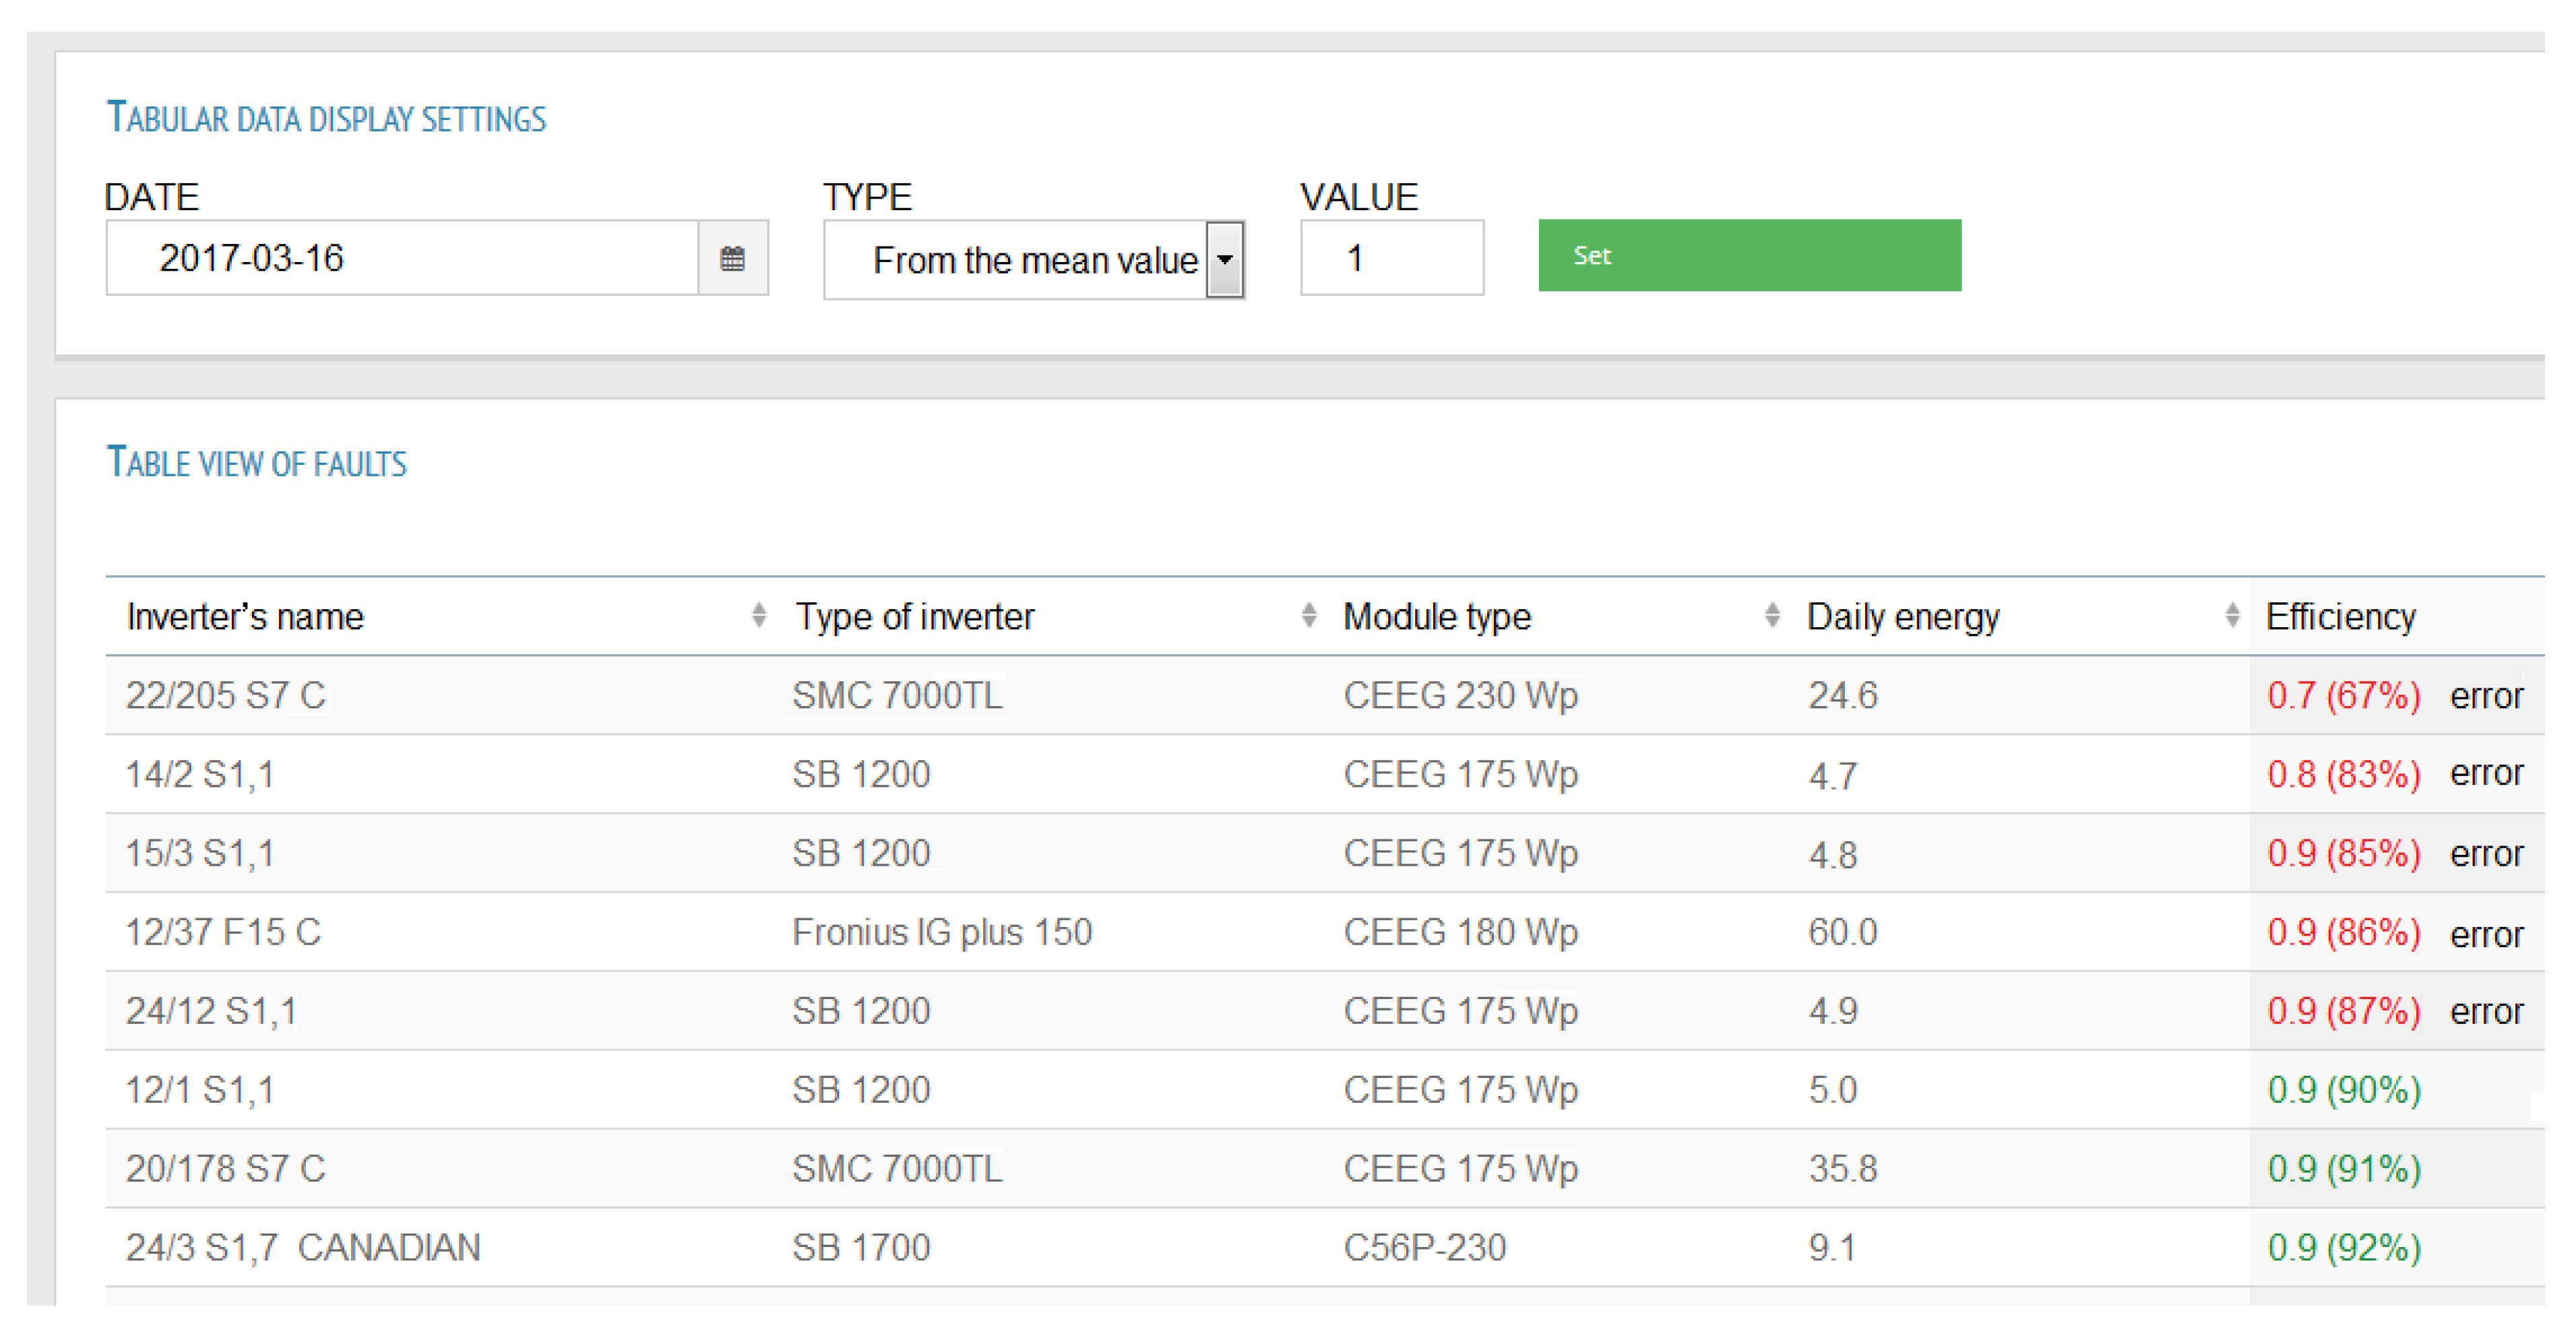
The database system Solarmon-2.0 allows one to track the current status of the individual inverters, including the possibility of a description of the fault or error related to a project number. Weather equipment monitoring provides information on wind and temperature, which is an essential basis for insurance companies (for instance, if the wind speed exceeds the hurricane level, it means the investors will lose the guarantee on a certain type of construction). Most of the solar plant mechanical structures are designed for wind speeds up to 190 km/h. According to international standard ENV 1991-2-4 “Basis of design and actions on structures-Part 2–4: Actions on structures-Wind actions” in the territory of Central Europe, construction must deal with the wind at ground level of a max speed equal to 160 km/h. A similar issue is related to the temperature; e.g., PV solar modules from CEEG Company (as well as the majority of PV solar modules worldwide) have operating temperatures from −40–+90 °C. The operating temperature range is determined mostly for encapsulation of PV cells in standard PV solar modules using ethylene vinyl acetate (EVA). A larger operating temperature range can be achieved by using a special technology for encapsulation of PV cells with polysiloxane gel. This technology is described for example in [29] for the PV solar modules and in [30,31] for Photovoltaic/Photothermal solar modules. The report [32] is related to monitoring of PV panel temperature. Whenever the PV panel temperature exceeds the operating limit, it may cause permanent damage, thereby automatically voiding the warranty. Solarmon-2.0 has the function of controlling defective invertors. This is by the comparison of the average values of actual powers (see Figure 3). Additionally, it measures and monitors voltages in each string and compares them with the limit values. The resulting records are reported and also trackable. Reports of significant failures are recorded and sent via SMS and e-mail to the responsible person or investor.
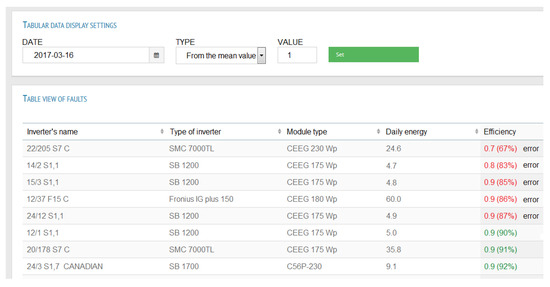
Figure 3.
Data output of the monitoring system Solarmon-2.0.
3. Determination of Power Losses
Losses of power can be defined in several ways. The determination of losses on the DC side of the inverter is the most important and most complicated. This is a specially developed algorithm that defines the current performance of the solar modules. Input parameters are the temperature of PV solar modules and the immediate value of the irradiance falling on the plane parallel with the solar modules. Information about the type of PV solar modules used is important to improve the accuracy of prediction. The power temperature coefficient predicts the panel behavior under certain temperature conditions. This value is based on the detection conditions of the manufacturer (most often indicating 25 °C, irradiance 1000 W/m2, t = 1 s, but in some cases, the temperature is set at 300 K, which is 27 °C). The estimation of the active area of the panel is another factor. The next important parameters are the number of PV cells per the PV panel (usually 36 or 72), the number of parallel branches (usually 3 on 12, 3 on 24), the size and arrangement of the PV cells (pseudosquare) and output terminals. Finally, it is important to minimize the power variation of the solar modules (the manufacturer proclaims variation of the PV solar modules at a range of mostly around 3%). Variation can be minimized by sorting solar modules into groups according to the maximum power point current Impp (aiming to achieve maximum power in serial parallel connection). Modules are classified into four groups A–D (A = highest Impp). The sorting of PV solar modules is related to the implementation project. Then, the setting of the Solarmon-2.0 individual drives is done while putting the photovoltaic array into operation. Therefore, there is a map of each group of solar modules connected with the project. Defining the operation point MPP (maximum power point) of PV solar modules in the string is the most complicated part. V-I (Volt-Ampere) characteristics of individual PV solar modules are a little different. This is the place for further improving and subsequent calculation of prediction performance (depending on the temperature and incident energy) of one concrete type of PV solar module.
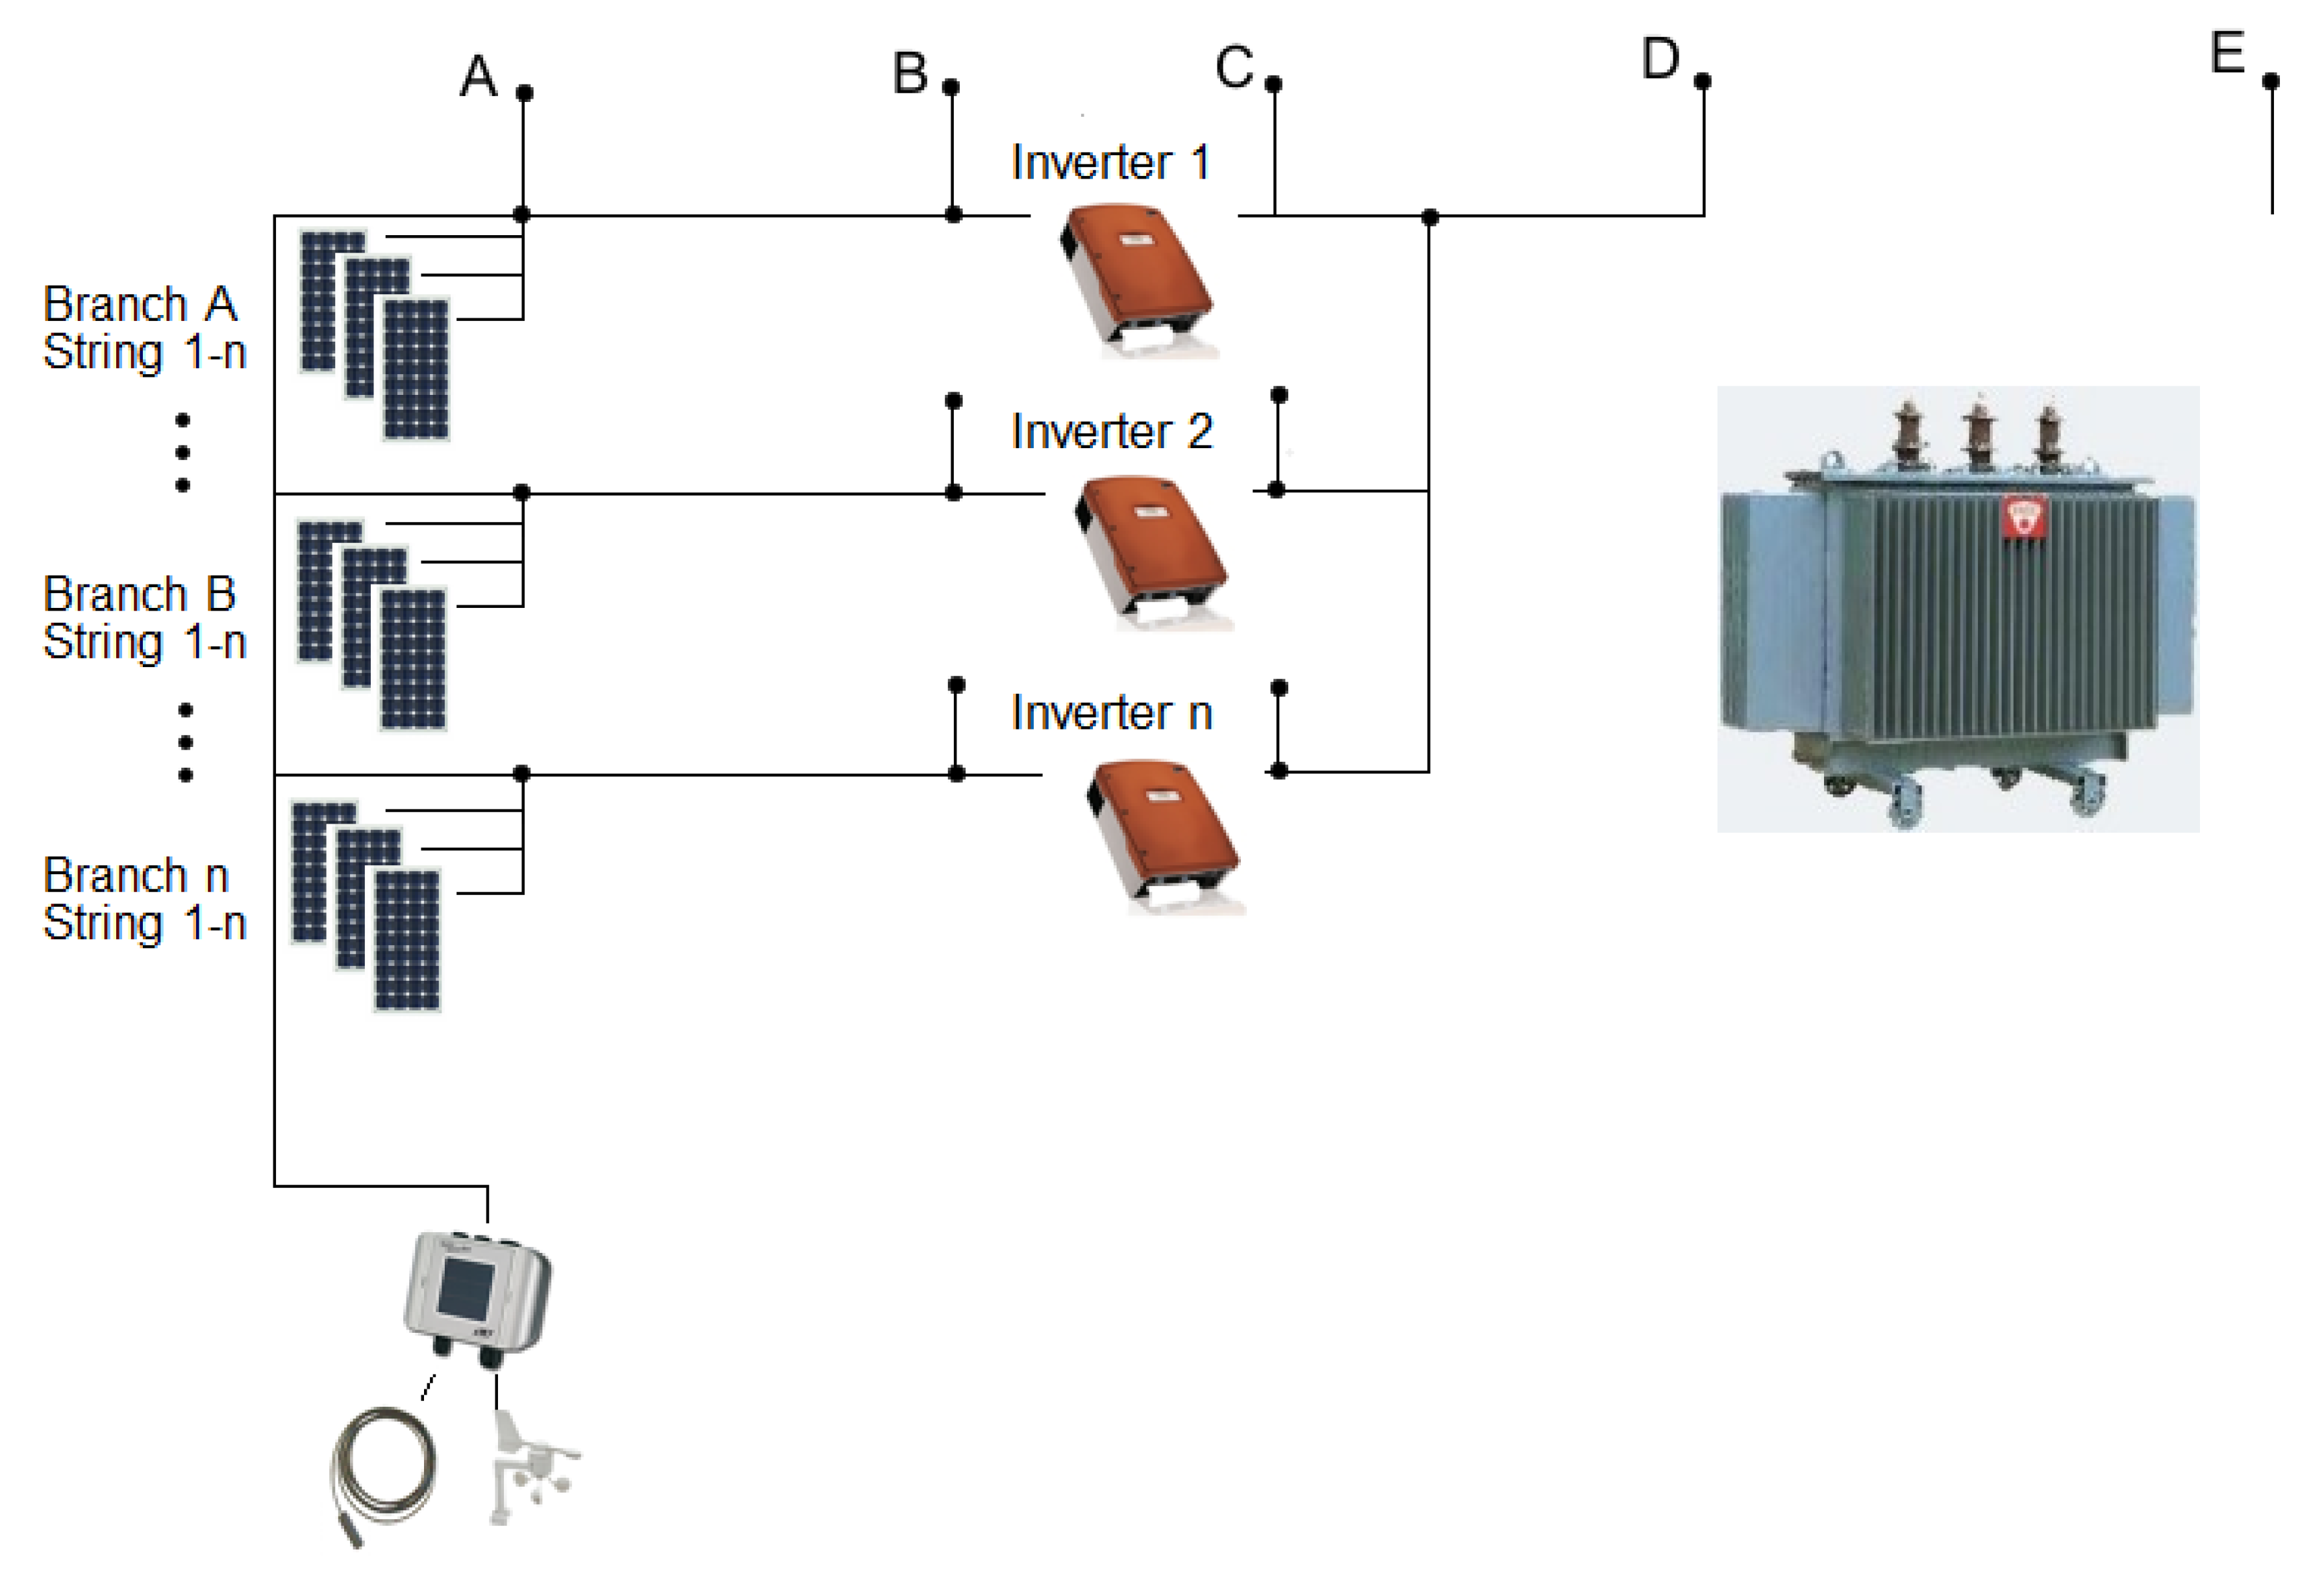
To determine the losses in DC cables, the scheme shown in Figure 4 should be used. For instance, the inverter SB 1200 has one string with 13 modules of Type CEEG 175. The measurement in front of inverters is performed at Point B. By comparing the actual performance of concrete power A and concrete drive B (B/A), this is counted as lost on the DC line. The measurement behind inverters is performed at the point C (Pac (W) from the inverter). It is therefore an alternative current output. When comparing the actual inverter output power to the input, we get the efficiency drive. From the data, we can declare that 90% load of the inverter efficiency corresponds to an accuracy of ±3%. There is a rule saying that the reduction of load inverters increases the inaccuracy of measurement. Measurement of input in the transformer with the calibrated meter point is given by D. By comparing the points D and C, the sum indicates loss on the AC side. Comparing output energy via an opto-element E, comparing the values of E/D, we get the efficiency of the transformer. Electricity connection is important also in terms of billing. Finally, the overall efficiency of the photovoltaic array can be determined by comparing the sum of E/A. The overall efficiency of the solar plant is the most important basis for the banks as lenders.
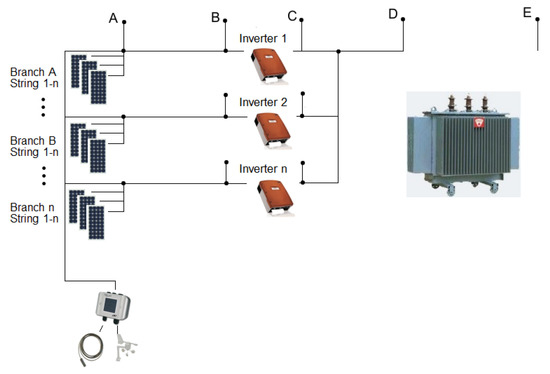
Figure 4.
Scheme of the monitoring points.
4. Saving of Data and Archive
An integral part of the whole system is the back up and reviewing of the data. Solarmon-2.0 can support the database and create a preview of these files. It is a statement of values under the specified time. The data archive has four subsections: inverters, Meteo station, substation, electronic security system. Considering the data are divided into three types: daily, monthly and yearly classification, it is possible to extract data on specific drivers and summarize the overall data. Data from individual drives are very much needed to allocate the existing errors and faults. All categories of time (daily, monthly, annual) are further divided into seconds and hours and summarized. The files are saved as XLS files; therefore, it is also possible to download them.
5. Results and Discussion
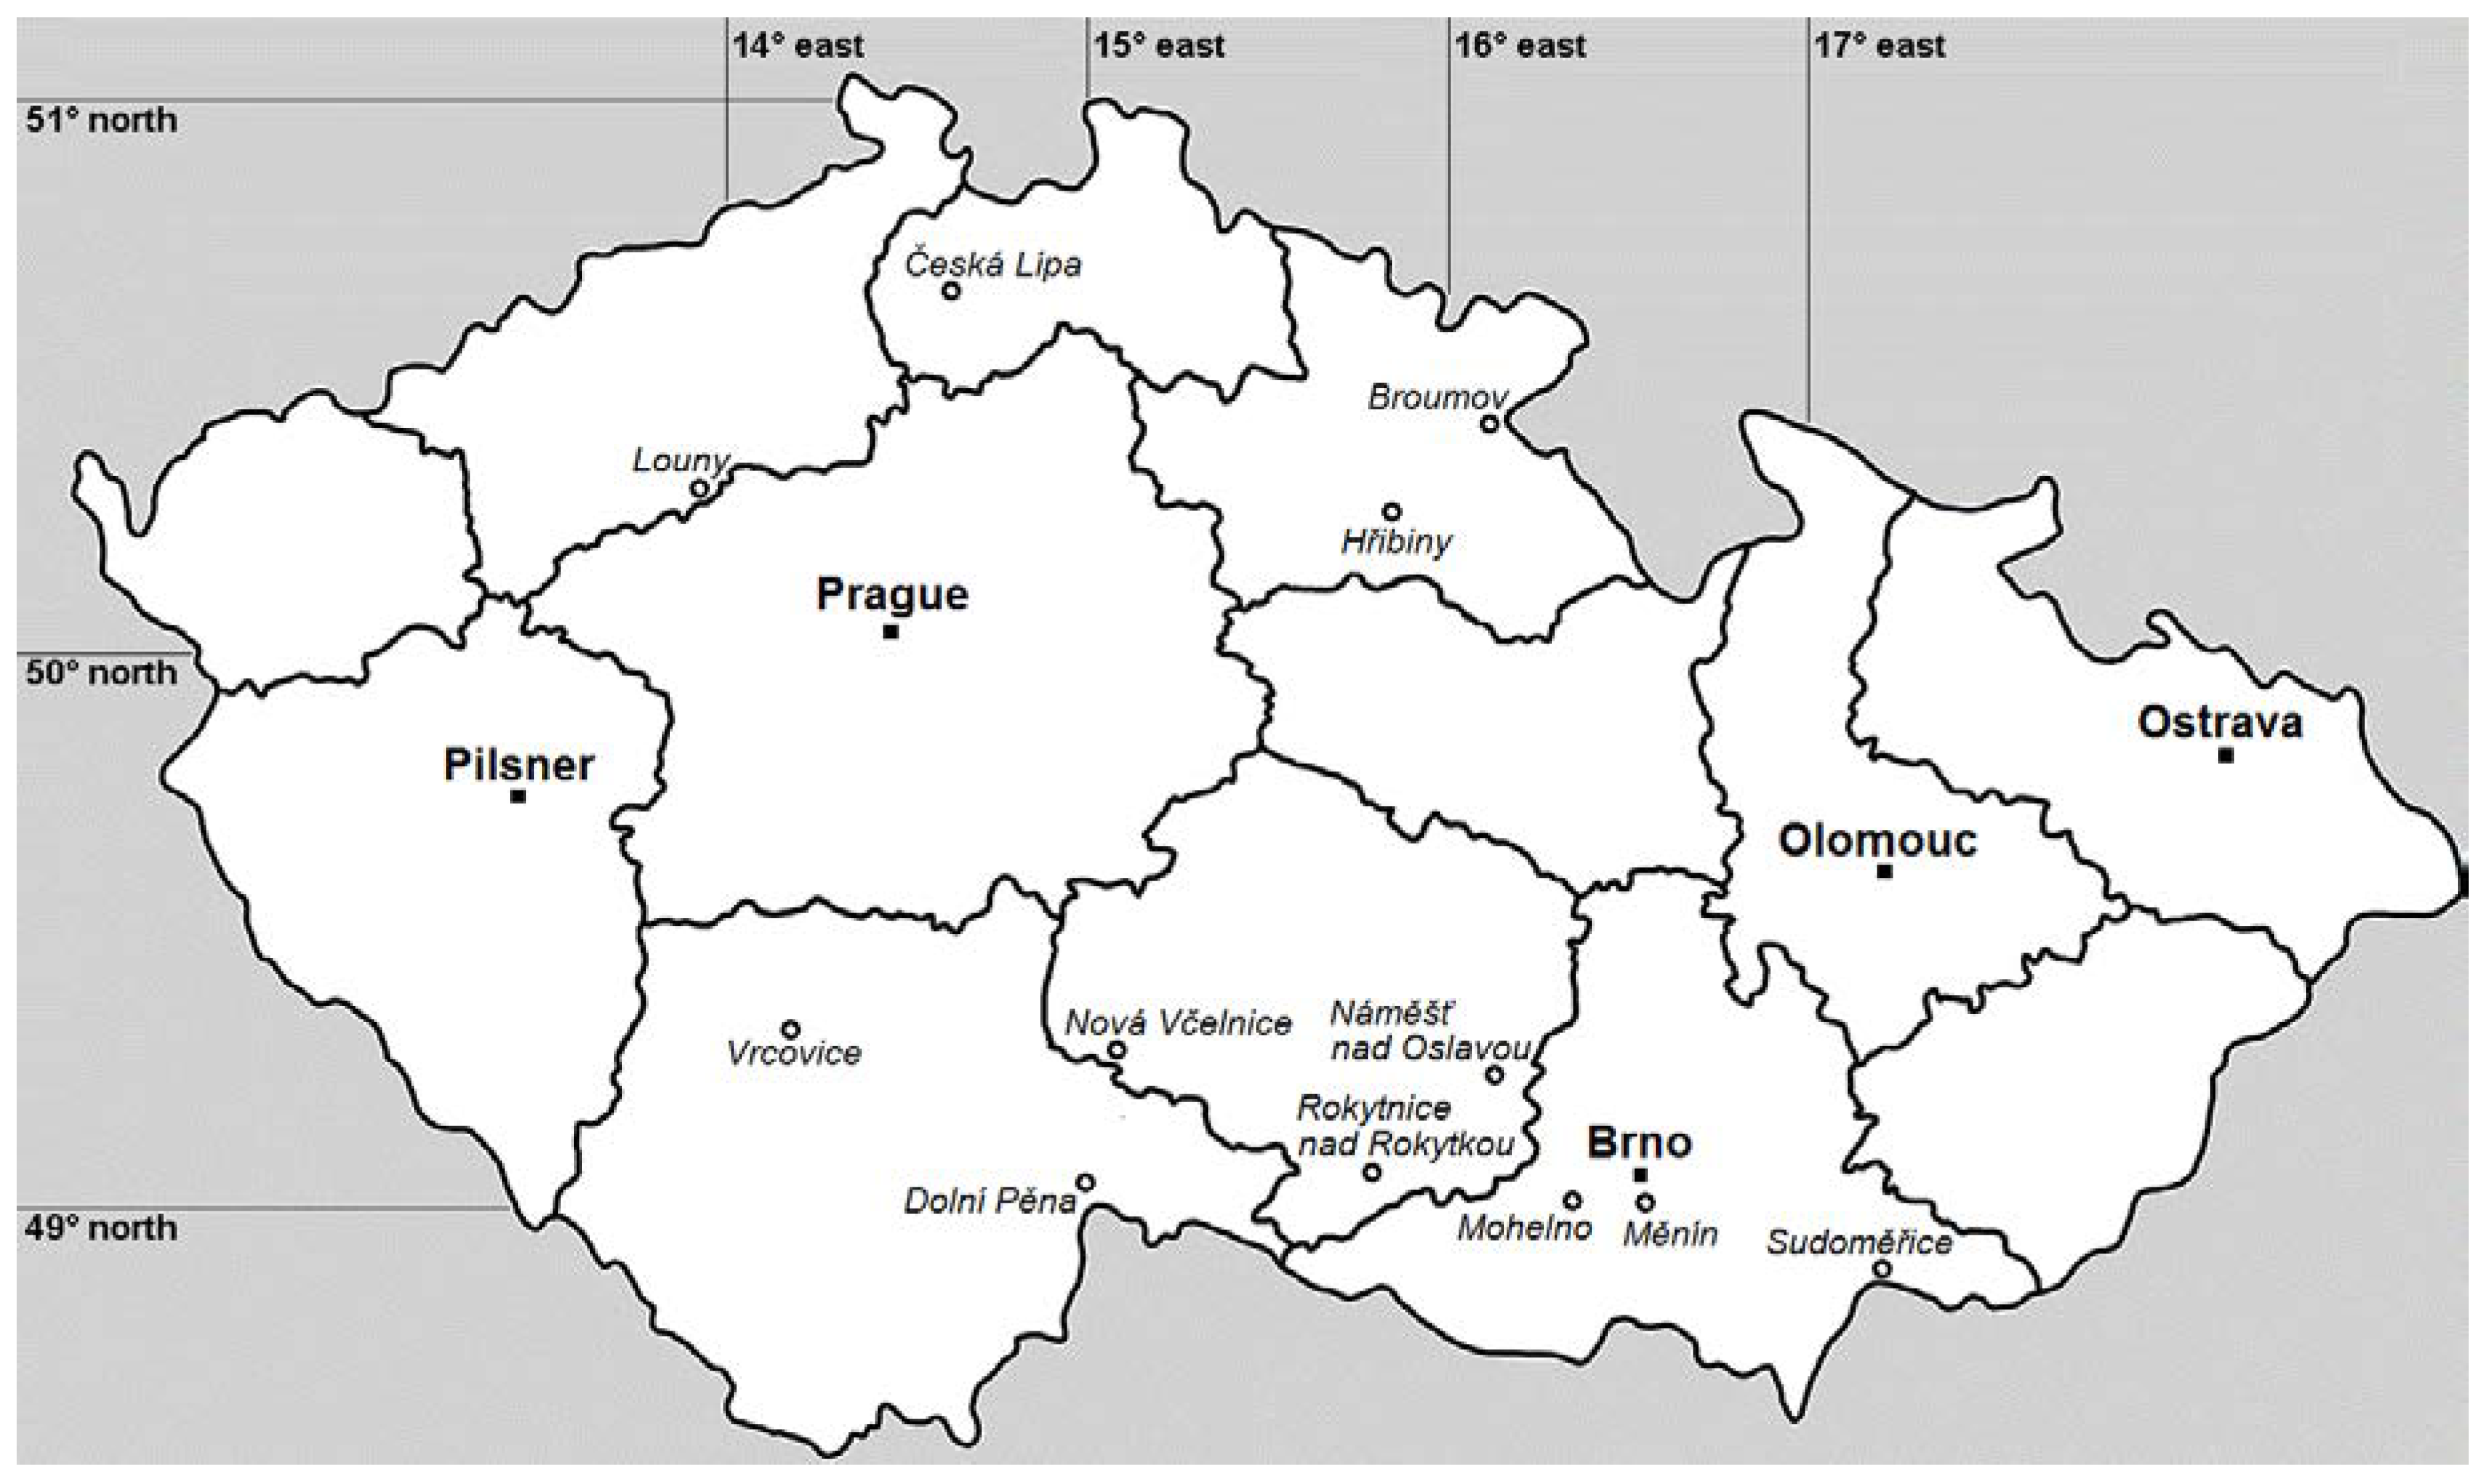
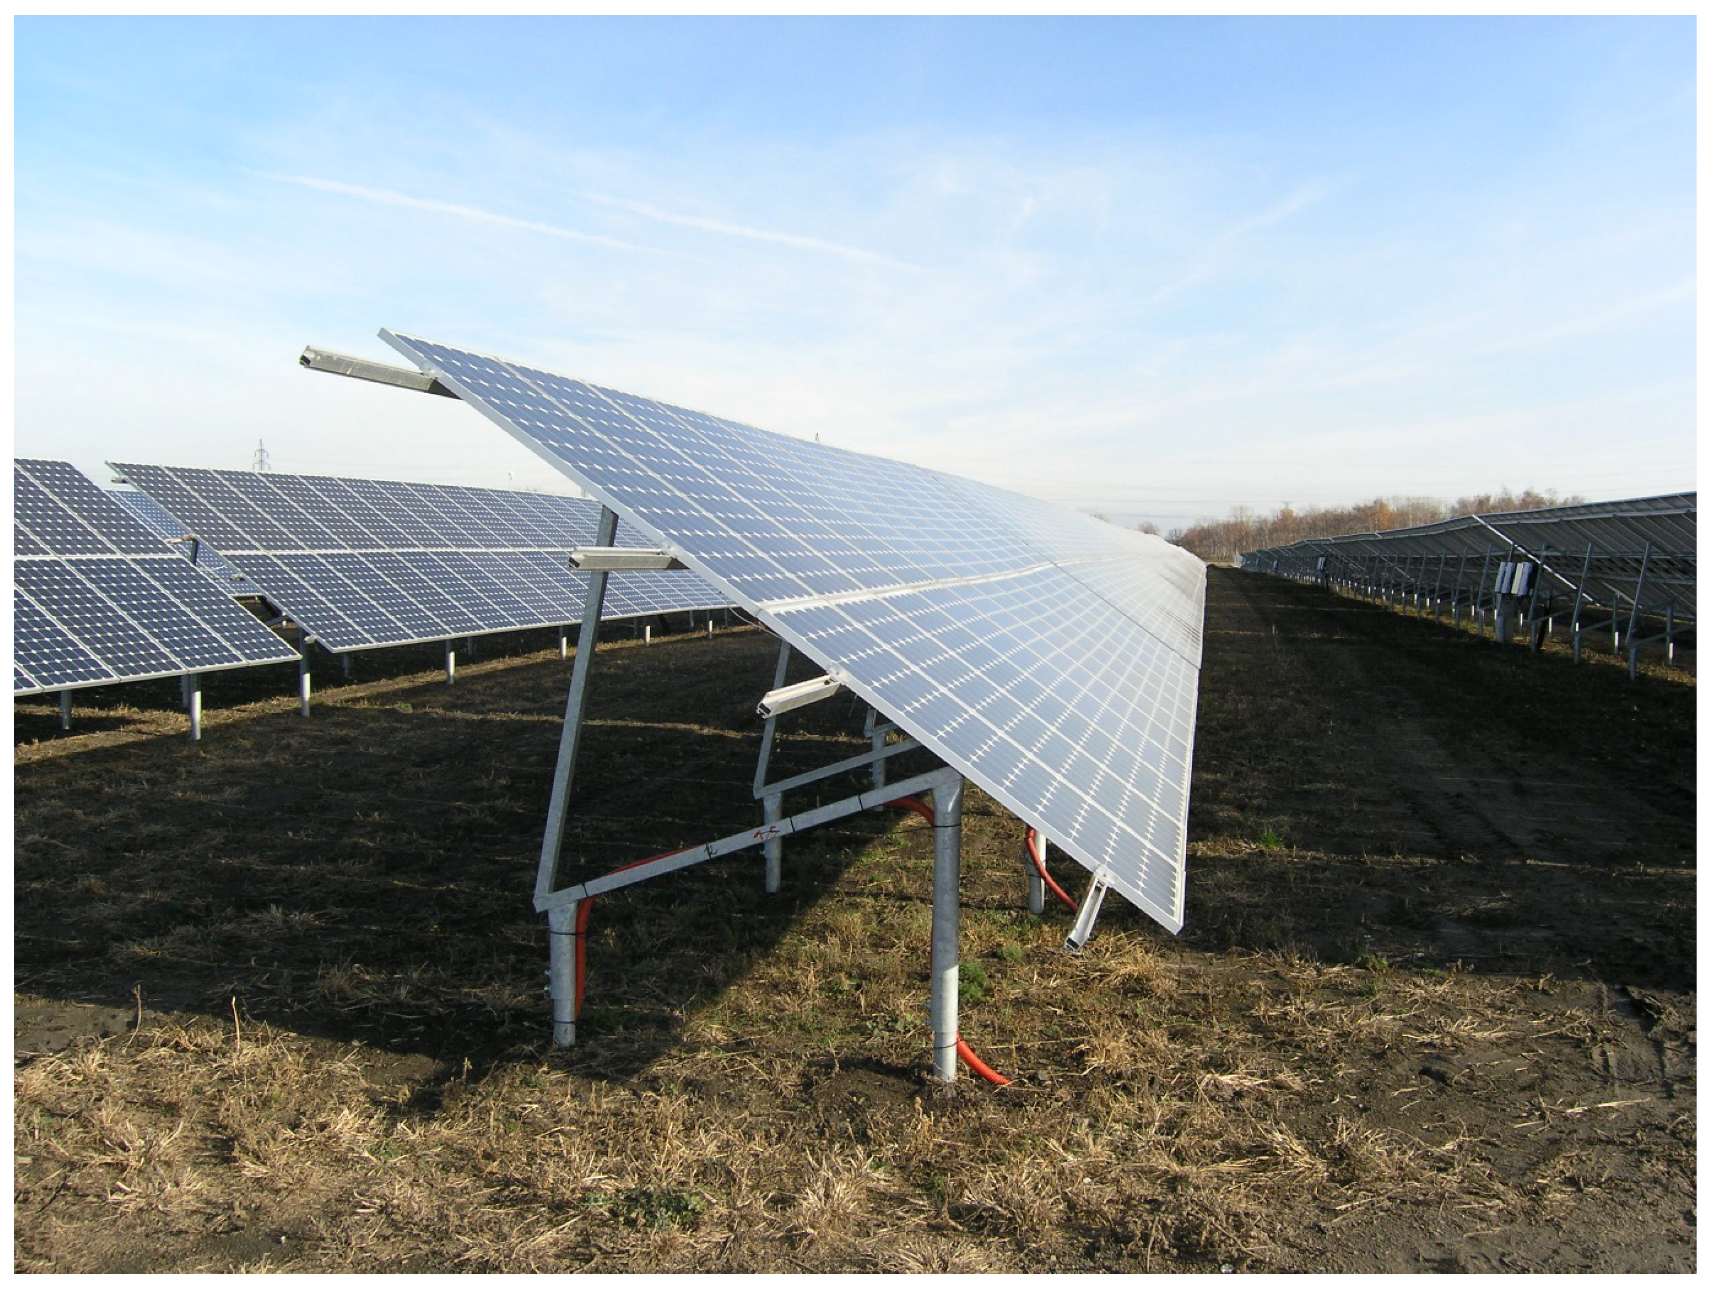
The Solarmon-2.0 monitoring system as designed and described above had been installed and tested in 65 photovoltaic arrays. The testing helped to identify and eliminate installation errors and contributed to the failure-free operation and exploitation of the photovoltaic arrays. As an example, we present and discuss data from 13 selected photovoltaic arrays in this paper. These photovoltaic arrays were equipped with the new monitoring system. The data have been recorded and evaluated for the seven-year period. All these photovoltaic arrays had PV solar modules based on crystalline silicon and installed on a fixed mounting system with an angle of 35 degrees to the south. Such a fixed inclination is approximately 50° north latitude optimal in terms of the maximum annual yield of electricity. Figure 5 shows the locations where photovoltaic arrays were placed. Figure 6 shows the example of the photovoltaic array at Měnín.
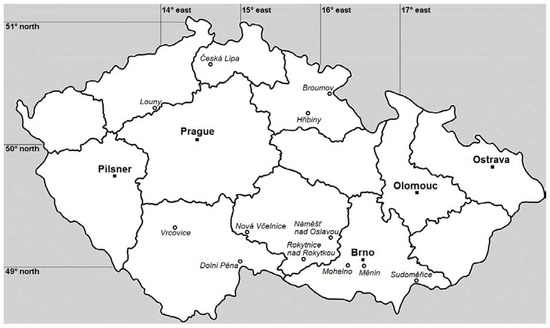
Figure 5.
Position of the selected photovoltaic arrays.
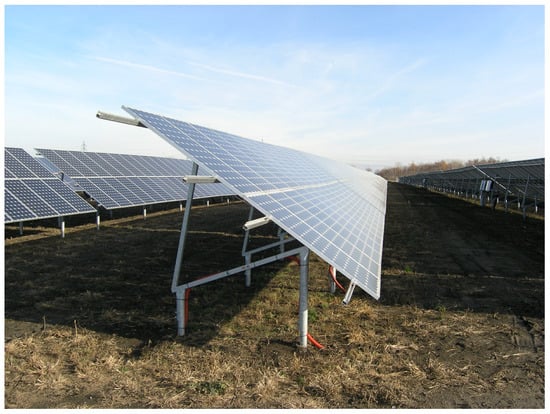
Figure 6.
Photovoltaic array at Měnín.
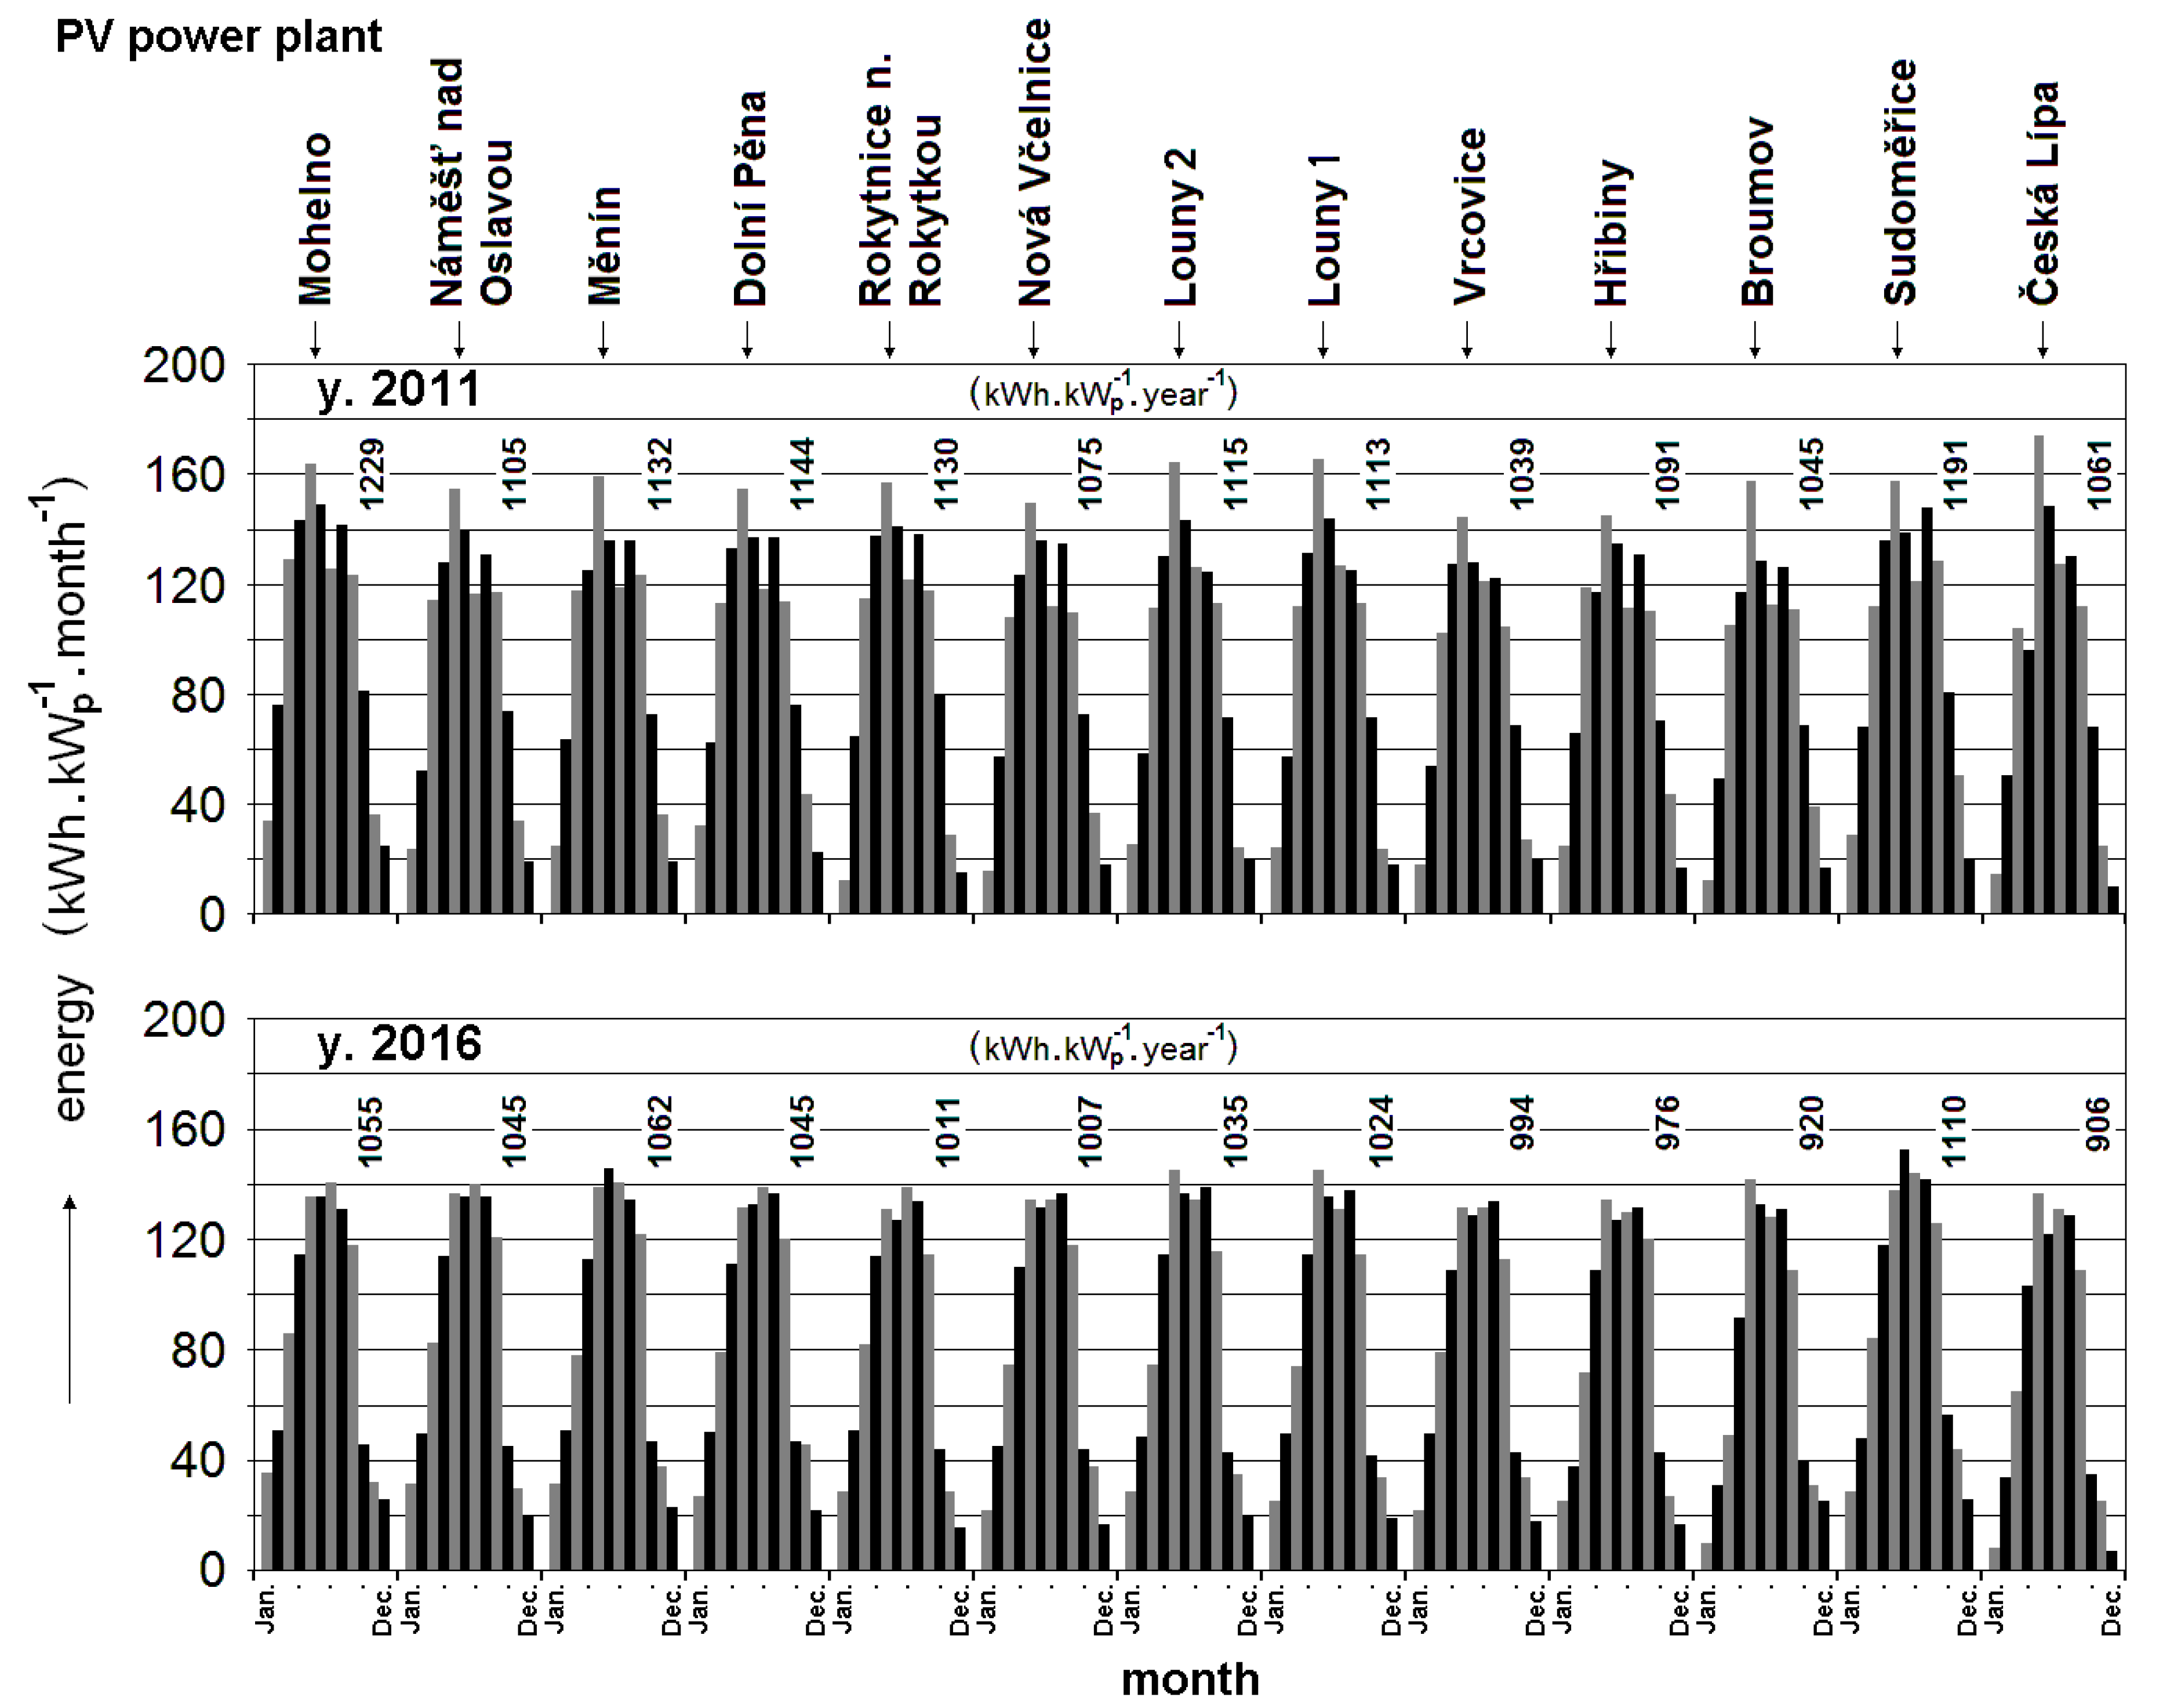
An example of the data evaluation is given in Figure 7. The figure shows the graph of generated electrical energy for each month during two selected years. The summary annual value of produced electricity is also included. The values were recalculated for 1 kW of installed nominal output photovoltaic arrays to be able to objectively compare the values. It is seen that during the observation period, the operation does not show a decrease in production of electric energy due to the aging of the PV solar modules. However, the variation of weather conditions had a strong impact on energy production. The observation period of seven years is still relatively short compared with an expected lifetime of the PV solar modules of 25 years. It is likely that the effect of the aging of the PV solar modules will eventually occur, and a decrease in energy conversion efficiency would be significantly reflected in the second half-life of the PV modules (see [33]).
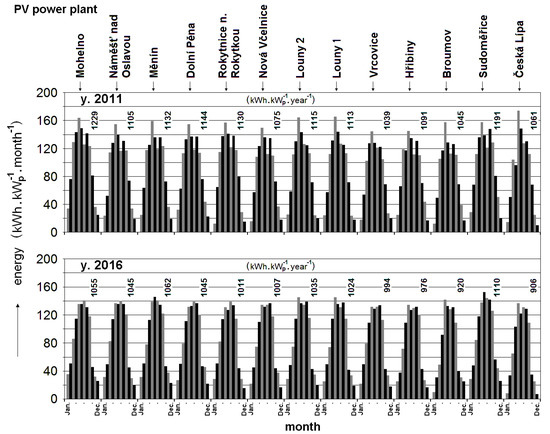
Figure 7.
An example of the data evaluation from the selected PV power plants during the years 2011 and 2016; the graph of generated electrical energy for each month.
Table 1 shows the comparison between predicted and actual values of generated electrical energy from the selected photovoltaic arrays. The expected amount was determined in accordance with the internationally used software PVGIS [34] and the actual energy is calculated as the average of seven years of results (actual values for each year are shown in Table 2). It is seen that in all the above PV, the power amount of produced electric energy corresponded to the prediction; in all cases, the actual values were higher by 10–20%. It can be assumed that due to the aging of PV solar modules, the amount of electricity produced would decrease by 10–20% within 20 years of operation, which is common; see, e.g., [35,36].

Table 1.
Comparison between predicted and actual values of generated electric energy from selected photovoltaic arrays in the Czech Republic.
Table 2.
Annual electric energy production from selected photovoltaic arrays in the Czech Republic (an example of the evaluation of monitored data).
Table 3 shows an example of the comparison of parameters between the widely-used monitoring system Solar-Log 1200 and the newly-developed system Solarmon-2.0. The system Solar-Log 1200 was selected for comparison because it is widely used at present.
Table 3.
Comparison of parameters between the widely-used monitoring system Solar-Log 1200 and the newly-developed system Solarmon-2.0.
6. Conclusions
A new monitoring system was successfully designed and tested on 65 photovoltaic arrays in the Czech Republic and several other countries. The monitoring system contributes to quality management of plants and also provides data for scientific purposes.
The production of electricity in the photovoltaic array built by our projects reflects the expected values according to the internationally used software PVGIS during the previous six years of operation. Data evaluation and counting of the predicted decline in energy conversion efficiency of PV solar modules during the aging process make the assumption that electricity production will comply with expected values for the lifetime of all these photovoltaic arrays.
The monitoring system helped to identify and eliminate installation errors and contributed to the continuous operation of the photovoltaic arrays. If reduced output power were indicated by the monitoring system, the servicemen and engineers would check the PV plant on the spot and fix the errors. Experience with the operation will be applied to the further improvement on the new version of the monitoring system Solarmon-2.0.
The measurements show that even with degradation of photovoltaic modules by 1% per year, there is a slight increase in the energy produced from photovoltaic sources in Central Europe. The increase is due to a higher number of sun hours and little precipitation.
A comparison of important system parameters clearly shows the new solutions and benefits of the new Solarmon-2.0 monitoring system. The increased number of input lines, especially the service log, automatic error reports and their exact localization, will be appreciated by operators of large photovoltaic arrays. Secured communications will increase data protection. A higher frequency of data saving allows a higher accuracy of the mathematical models. It is also advantageous to collect additional data from other power plant components (grid analyzer and invoicing measurement).
Solarmon-2.0 uses so-called responsive web design: the system adapts to each display. Solarmon-2.0 software is available at: app.solarmon.eu (user name: demo, password: demo1234).
Author Contributions
V.B. (15%), design of solar monitoring system, Software, Visualization; T.O. (15%), data processing and analysis, on site measurements, Formal Analysis; M.L. (14%), data processing and analysis, article editing, Methodology, Data Curation, Writing-Review & Editing, Supervision, Funding Acquisition; V.P. (14%), data processing and analysis, article editing, Conceptualization, Writing-Original Draft Preparation, Project Administration; J.S. (14%), data processing and analysis, Investigation; M.-Q.D. (14%), data processing and analysis, on site measurements, Resources; I.I.T. (14%), data processing and analysis, Validation.
Funding
This research was funded by Czech University of Life Sciences Prague, grant number IGA 2018:31120/1312/3118.
Conflicts of Interest
The authors declare no conflicts of interest.
References
- Rahman, M.M.; Selvaraja, J.; Rahima, N.A.; Hasanuzzamana, M. Global modern monitoring systems for PV based power generation: A review. Renew. Sustain. Energy Rev. 2018, 82, 4142–4158. [Google Scholar] [CrossRef]
- Olalla, C.; Maksimovic, D.; Deline, C.H.; Martinez-Salamero, L. Impact of distributed power electronics on the lifetime and reliability of PV systems. Prog. Photovolt. Res. Appl. 2017, 25, 821–835. [Google Scholar] [CrossRef]
- Otani, K.; Kato, K.; Takashima, T.; Yamaguchi, T.; Sakuta, K. Field Experience with Large-scale Implementation of Domestic PV Systems and with Large PV Systems on Buildings in Japan. Prog. Photovolt. Res. Appl. 2004, 12, 449–459. [Google Scholar] [CrossRef]
- Reinders, A.H.M.E.; van Dijk, V.A.P.; Wiemken, E.; Turkenburg, W.C. Technical and Economic Analysis of Grid-connected PV Systems by Means of Simulation. Prog. Photovolt. Res. Appl. 1999, 7, 71–82. [Google Scholar] [CrossRef]
- Guerriero, P.; Di Napoli, F.; Vallone, G. Monitoring and Diagnostics of PV Plants by a Wireless Self-Powered Sensor for Individual Solar modules. IEEE J. Photovolt. 2016, 6, 286–294. [Google Scholar] [CrossRef]
- Ayompe, L.M.; Duffy, A.; McCormack, S.J.; Conlon, M. Measured performance of a 1.72 kW rooftop grid connected photovoltaic system in Ireland. Energy Convers. Manag. 2011, 52, 816–825. [Google Scholar] [CrossRef]
- Boonmee, C.H.; Plangklang, B.; Watjanatepin, N. System performance of a three-phase PV-grid-connected system installed in Thailand: Data monitored analysis. Renew. Energy 2009, 34, 384–389. [Google Scholar] [CrossRef]
- Madeti, S.R.; Singh, S.N. Monitoring system for photovoltaic plants: A review. Renew. Sustain. Energy Rev. 2017, 67, 1180–1207. [Google Scholar] [CrossRef]
- Ventura, C.; Tina, G.M. Utility scale photovoltaic plant indices and models for on-line monitoring and fault detection purposes. Electr. Power Syst. Res. 2016, 136, 43–56. [Google Scholar] [CrossRef]
- Yahyaoui, I.; Segatto, M.E.V. A practical technique for on-line monitoring of a photovoltaic plant connected to a single-phase grid. Energy Convers. Manag. 2017, 132, 198–206. [Google Scholar] [CrossRef]
- Ma, S.; Chen, M.; Wu, J.; Huo, W.; Huang, L. Augmented Nonlinear Controller for Maximum Power-Point Tracking with Artificial Neural Network in Grid-Connected Photovoltaic Systems. Energies 2016, 9, 1005. [Google Scholar] [CrossRef]
- Liberos, M.; González-Medina, R.; Garcerá, G.; Figueres, E. Modelling and Control of Parallel-Connected Transformerless Inverters for Large Photovoltaic Farms. Energies 2017, 10, 1242. [Google Scholar] [CrossRef]
- Zhao, J.; Zhou, X.; Ma, Y.; Liu, Y. Analysis of Dynamic Characteristic for Solar Arrays in Series and Global Maximum Power Point Tracking Based on Optimal Initial Value Incremental Conductance Strategy under Partially Shaded Conditions. Energies 2017, 10, 120. [Google Scholar] [CrossRef]
- Han, Y.; Chen, W.; Li, Q. Energy Management Strategy Based on Multiple Operating States for a Photovoltaic/Fuel Cell/Energy Storage DC Microgrid. Energies 2017, 10, 136. [Google Scholar] [CrossRef]
- Rezk, H.; Tyukhov, I.; Raupov, A. Experimental implementation of meteorological data and photovoltaic solar radiation monitoring system. Int. Trans. Electr. Energy Syst. 2015, 25, 3573–3585. [Google Scholar] [CrossRef]
- Tyukhov, I.I.; Rezk, H.; Vasant, P. Modern Optimization Algorithms and Applications in Solar Photovoltaic Engineering. In Sustaining Power Resources through Energy Optimization and Engineering Pandian Vasant and Nikolai Voropai; IGI Global: Hershey, PA, USA, 2016; Chapter 16; pp. 390–445. ISBN 978-1466697553. [Google Scholar]
- Grimaccia, F.; Leva, S.; Dolara, A. Survey on PV Modules’ Common Faults After an O&M Flight Extensive Campaign Over Different Plants in Italy. IEEE J. Photovolt. 2017, 7, 810–816. [Google Scholar]
- Villarini, M.; Cesarotti, V.; Alfonsi, L.; Introna, V. Optimization of photovoltaic maintenance plan by means of a FMEA approach based on real data. Energy Convers. Manag. 2017, 152, 1–12. [Google Scholar] [CrossRef]
- Energy Monitoring—Solar Results to the Web. Available online: http://www.rmeter.com/ (accessed on 10 May 2018).
- UO Solar Radiation Monitoring Laboratory. Available online: http://solardat.uoregon.edu/AboutSrml.html and http://solardat.uoregon.edu/Photovoltaics.html (accessed on 26 April 2018).
- Dubard, J.; Filtz, J.-R.; Cassagne, V.; Legrain, P. Photovoltaic module performance measurements traceability: Uncertainties survey. Measurement 2014, 51, 451–456. [Google Scholar] [CrossRef]
- Chao, K.H.; Chen, C.T. A remote supervision fault diagnosis meter for photovoltaic power generation systems. Measurement 2017, 104, 93–104. [Google Scholar] [CrossRef]
- Beránek, V.; Libra, M. Monitoring system for photovoltaic plants. In Proceedings of the 4th International Conference TAE 2010, Prague, Czech Republic, 7–10 September 2010; pp. 668–675, ISBN 978-80-213-2088-8. [Google Scholar]
- Poulek, V.; Khudysh, A.; Libra, M. Self powered solar tracker for Low Concentration PV (LCPV) systems. Sol. Energy 2016, 127, 109–112. [Google Scholar] [CrossRef]
- Reatti, A.; Kazimierczuk, M.K.; Catelani, M.; Ciani, L. Monitoring and field data acquisition system for hybrid static concentrator plant. Measurement 2017, 98, 384–392. [Google Scholar] [CrossRef]
- Poulek, V.; Libra, M. New solar tracker. Sol. Energy Mater. Solar Cells 1998, 51, 113–120. [Google Scholar] [CrossRef]
- Poulek, V.; Khudysh, A.; Libra, M. Innovative low concentration PV systems with bifacial solar modules. Sol. Energy 2015, 120, 113–116. [Google Scholar] [CrossRef]
- Libra, M.; Beránek, V.; Sedláček, J.; Poulek, V.; Tyukhov, I.I. Roof photovoltaic power plant operation during the solar eclipse. Sol. Energy 2016, 140, 109–112. [Google Scholar] [CrossRef]
- Poulek, V.; Strebkov, D.S.; Persic, I.S.; Libra, M. Towards 50 years lifetime of PV solar modules laminated with silicone gel technology. Sol. Energy 2012, 86, 3103–3108. [Google Scholar] [CrossRef]
- Matuska, T.; Sourek, B.; Jirka, V.; Pokorny, N. Glazed PVT collector with polysiloxane encapsulation of PV cells: Performance and economic analysis. Int. J. Photoenergy 2015, 2015, 718316. [Google Scholar] [CrossRef]
- Shemelin, V.; Matuška, T. Detailed Modeling of Flat Plate Solar Collector with Vacuum Glazing. Int. J. Photoenergy 2017, 2017, 1587592. [Google Scholar] [CrossRef]
- Correa-Betanzo, C.; Calleja, H.; Lizarraga, A. Photovoltaic system assessment considering temperature and overcast conditions: Light load efficiency enhancement technique. Sol. Energy 2016, 137, 148–157. [Google Scholar] [CrossRef]
- Chamberlin, C.E.; Rocheleau, M.A.; Marshall, M.W.; Reis, A.M.; Coleman, N.T.; Lehman, P.A. Comparison of PV Module Performance before and after 11 and 20 Years of Field Exposure. In Proceedings of the 37th IEEE Photovoltaic Specialists Conference, Seattle, DC, USA, 19–24 June 2011; pp. 000101–000105, ISBN 978-142449965-6. [Google Scholar]
- PVGIS. Photovoltaic Geographical Information System-Interactive Maps. Available online: http://re.jrc.ec.europa.eu/pvgis/apps4/pvest.php# (accessed on 4 June 2018).
- Kaplani, E. Detection of Degradation Effects in Field-Aged c-Si Solar Cells through IR Thermography and Digital Image Processing. Int. J. Photoenergy 2012, 2012, 396792. [Google Scholar] [CrossRef]
- Olšan, T.; Libra, M.; Poulek, V.; Chalupa, B.; Sedláček, J. Combination of Three Methods of Photovoltaic Solar modules Damage Evaluation. Sci. Agric. Bohem. 2017, 48, 98–101. [Google Scholar]
© 2018 by the authors. Licensee MDPI, Basel, Switzerland. This article is an open access article distributed under the terms and conditions of the Creative Commons Attribution (CC BY) license (http://creativecommons.org/licenses/by/4.0/).