Article

Mapping Alteration Minerals Associated with Aktogay Porphyry Copper Mineralization in Eastern Kazakhstan Using Landsat-8 and ASTER Satellite Sensors

by
Elmira Orynbassarova
1,
Hemayatullah Ahmadi
2,3,4,*,
Bakhberde Adebiyet
1,
Alma Bekbotayeva
4,
Togzhan Abdullayeva
4,
Amin Beiranvand Pour
5,*,
Aigerim Ilyassova
1,
Elmira Serikbayeva
6,
Dinara Talgarbayeva
6 and
Aigerim Bermukhanova
1
1
Geomatics Innovation Center, Satbayev University, Almaty 050013, Kazakhstan
2
Department of Geological Engineering and Exploration of Mines, Faculty of Geology and Mines, Kabul Polytechnic University, Kabul 1001, Afghanistan
3
Department of Water Resources, Wood Rodgers, Inc., Orange, CA 92866, USA
4
Department of Geological Survey, Search and Exploration of Mineral Deposits, Geology and Oil-Gas Business Institute, Satbayev University, Almaty 050013, Kazakhstan
5
Institute of Oceanography and Environment (INOS), Higher Institution Center of Excellence (HICoE) in Marine Science, Universiti Malaysia Terengganu (UMT), Kuala Nerus 21030, Malaysia
6
Institute of Ionosphere, Almaty 050020, Kazakhstan
*
Authors to whom correspondence should be addressed.
Minerals 2025, 15(3), 277; https://doi.org/10.3390/min15030277
Submission received: 30 January 2025 / Revised: 2 March 2025 / Accepted: 7 March 2025 / Published: 9 March 2025

Abstract

:
Mineral resources, particularly copper, are crucial for the sustained economic growth of developing countries like Kazakhstan. Over the past four decades, the diversity and importance of critical minerals for high technology and environmental applications have increased dramatically. Today, copper is a critical metal due to its importance in electrification. Porphyry deposits are important sources of copper and other critical metals. Conventional exploration methods for mapping alteration zones as indicators of high-potential zones in porphyry deposits are often associated with increased cost, time and environmental concerns. Remote sensing imagery is a cutting-edge technology for the exploration of minerals at low cost and in short timeframes and without environmental damage. Kazakhstan hosts several large porphyry copper deposits, such as Aktogay, Aidarly, Bozshakol and Koksai, and has great potential for the discovery of new resources. However, the potential of these porphyry deposits has not yet been fully discovered using remote sensing technology. In this study, a remote sensing-based mineral exploration approach was developed to delineate hydrothermal alteration zones associated with Aktogay porphyry copper mineralization in eastern Kazakhstan using Landsat-8 and ASTER satellite sensors. A comprehensive suite of image processing techniques was used to analyze the two remote sensing datasets, including specialized band ratios (BRs), principal component analysis (PCA) and the Crosta method. The remote sensing results were validated against field data, including the spatial distribution of geological lineaments and petrographic analysis of the collected rock samples of alteration zones and ore mineralization. The results show that the ASTER data, especially when analyzed with specialized BRs and the Crosta method, effectively identified the main hydrothermal alteration zones, including potassic, propylitic, argillic and iron oxide zones, as indicators of potential zones of ore mineralization. The spatial orientation of these alteration zones with high lineament density supports their association with underlying mineralized zones and the spatial location of high-potential zones. This study highlights the high applicability of the remote sensing-based mineral exploration approach compared to traditional techniques and provides a rapid, cost-effective tool for early-stage exploration of porphyry copper systems in Kazakhstan. The results provide a solid framework for future detailed geological, geochemical and geophysical studies aimed at resource development of the Aktogay porphyry copper mineralization in eastern Kazakhstan. The results of this study underpin the effectiveness of remote sensing data for mineral exploration in geologically complex regions where limited geological information is available and provide a scalable approach for other developing countries worldwide.

1. Introduction

The economic development of a country depends largely on its mineral resources. Society’s increasing demand for minerals due to exponential population growth and industrialization makes it necessary to replenish dwindling reserves by searching for new ore deposits. Remote sensing technology can bring new impetus and cutting-edge technology to mineral exploration and identification of ore mineralization zones, especially in challenging environments and complex geological settings where conventional methods may have limited applications [1,2,3,4,5,6,7]. By using sophisticated sensor systems mounted on satellites or airplanes, data can be collected from large areas [8,9,10,11,12,13,14]. Therefore, a systematic mineral exploration program that uses remote sensing technology is necessary for the steady growth of developing countries. Porphyry deposits are key sources of valuable metals, such as copper (Cu), molybdenum (Mo), gold (Au), silver (Ag), tin (Sn), and critical metals (as by-products), such as rhenium (Re), tungsten (W), indium (In), platinum (Pt), palladium (Pd) and selenium (Se). Their undeniable economic importance lies in their role as key suppliers of strategic raw materials for a variety of industries and modern technologies [15,16,17,18,19].
Landsat-8 and Advanced Spaceborne Thermal Emission and Reflection Radiometer (ASTER) multispectral satellite sensors have been widely used for mapping hydrothermal alteration minerals and zones associated with porphyry copper deposits around the world [20,21,22]. The spectral capabilities of these sensors aid in the mapping of hydrothermal alteration minerals and zones associated with porphyry copper deposits, particularly in the detection of gossan, silica, phyllic, argillic, potassic and propylitic alteration zones [9,23,24,25,26,27,28,29]. By utilizing the strengths of these two multispectral sensors, the limitations of the individual datasets can be easily overcome, and more robust results can be obtained.
The complex interplay of magmatism, hydrothermal activity and sedimentation in Kazakhstan has created a geodynamically active environment that favors the formation of a large number of copper deposits [30,31,32,33,34,35]. Kazakhstan’s copper reserves are estimated at around 40 million tons, 82% of which are mainly located in the eastern and central regions [31]. Copper resources in Kazakhstan are primarily found in two geological settings: sandstone-hosted stratiform copper mineralization and porphyry copper deposits. The most significant deposit of sandstone-hosted stratiform copper is located in Zhezkazgan, central Kazakhstan [36]. Porphyry copper deposits are mostly distributed in east Kazakhstan, such as Aktogay, Aidarly and Kyzylkiya, which were formed by magma intrusion and subsequent hydrothermal activity, resulting in a concentration of copper in the form of chalcopyrite and bornite and associated with hydrothermal alteration minerals and zones [37].
The Aktogay deposit in eastern Kazakhstan is a significant source of porphyry copper mineralization [30,38]. Stratiform copper deposits account for the primary commercial value of Kazakhstan’s copper mining and the rest of the reserves, making up 51.0% of the total explored reserves. Porphyry copper deposits also occupy a significant position with 26.5% of the reserves, followed by chalcopyrite zones with 14.5%, veined quartz sulfide zones (6.8%) and skarn zones (1.1%), which play a subordinate role in the total copper reserves [30].
Despite the extensive global experience in the application of remote sensing technology for porphyry copper exploration [39,40,41,42,43,44,45], there is a lack of utilization of remote sensing imagery for porphyry copper deposits in Kazakhstan. The country hosts several large porphyry copper deposits (e.g., Aktogay, Aidarly, Bozshakol and Koksai). However, the potential of these deposits has not yet been fully discovered. Accurate mapping of the hydrothermal minerals and zones associated with this porphyry copper deposit remains a major challenge due to the intricate structures and complex geological features in this region. The heterogeneity of the ore-bearing rocks combined with the different sedimentary conditions and tectonic influences make geological mapping and conventional exploration techniques difficult. In order to optimize the exploration of porphyry copper deposits in Kazakhstan, comprehensive and systematic remote sensing studies are essential. Such studies will not only enable efficient mining of the resources, but also significantly improve the geological understanding of the region. The present study aimed to address this gap by adapting and applying spectral analysis to Landsat-8 and ASTER data to map the potassic, propylitic and argillic hydrothermal zones via indicator minerals such as quartz, orthoclase, calcite, chlorite, epidote, kaolinite and illite/montmorillonite associated with the Aktogay porphyry copper deposit in eastern Kazakhstan (Figure 1a,b). The results should make an important contribution to understanding the characteristics of porphyry copper deposits for the exploration of new potential zones and ultimately help to provide strategic metals and sustainable mineral exploration and mining practices for the steady growth of Kazakhstan.

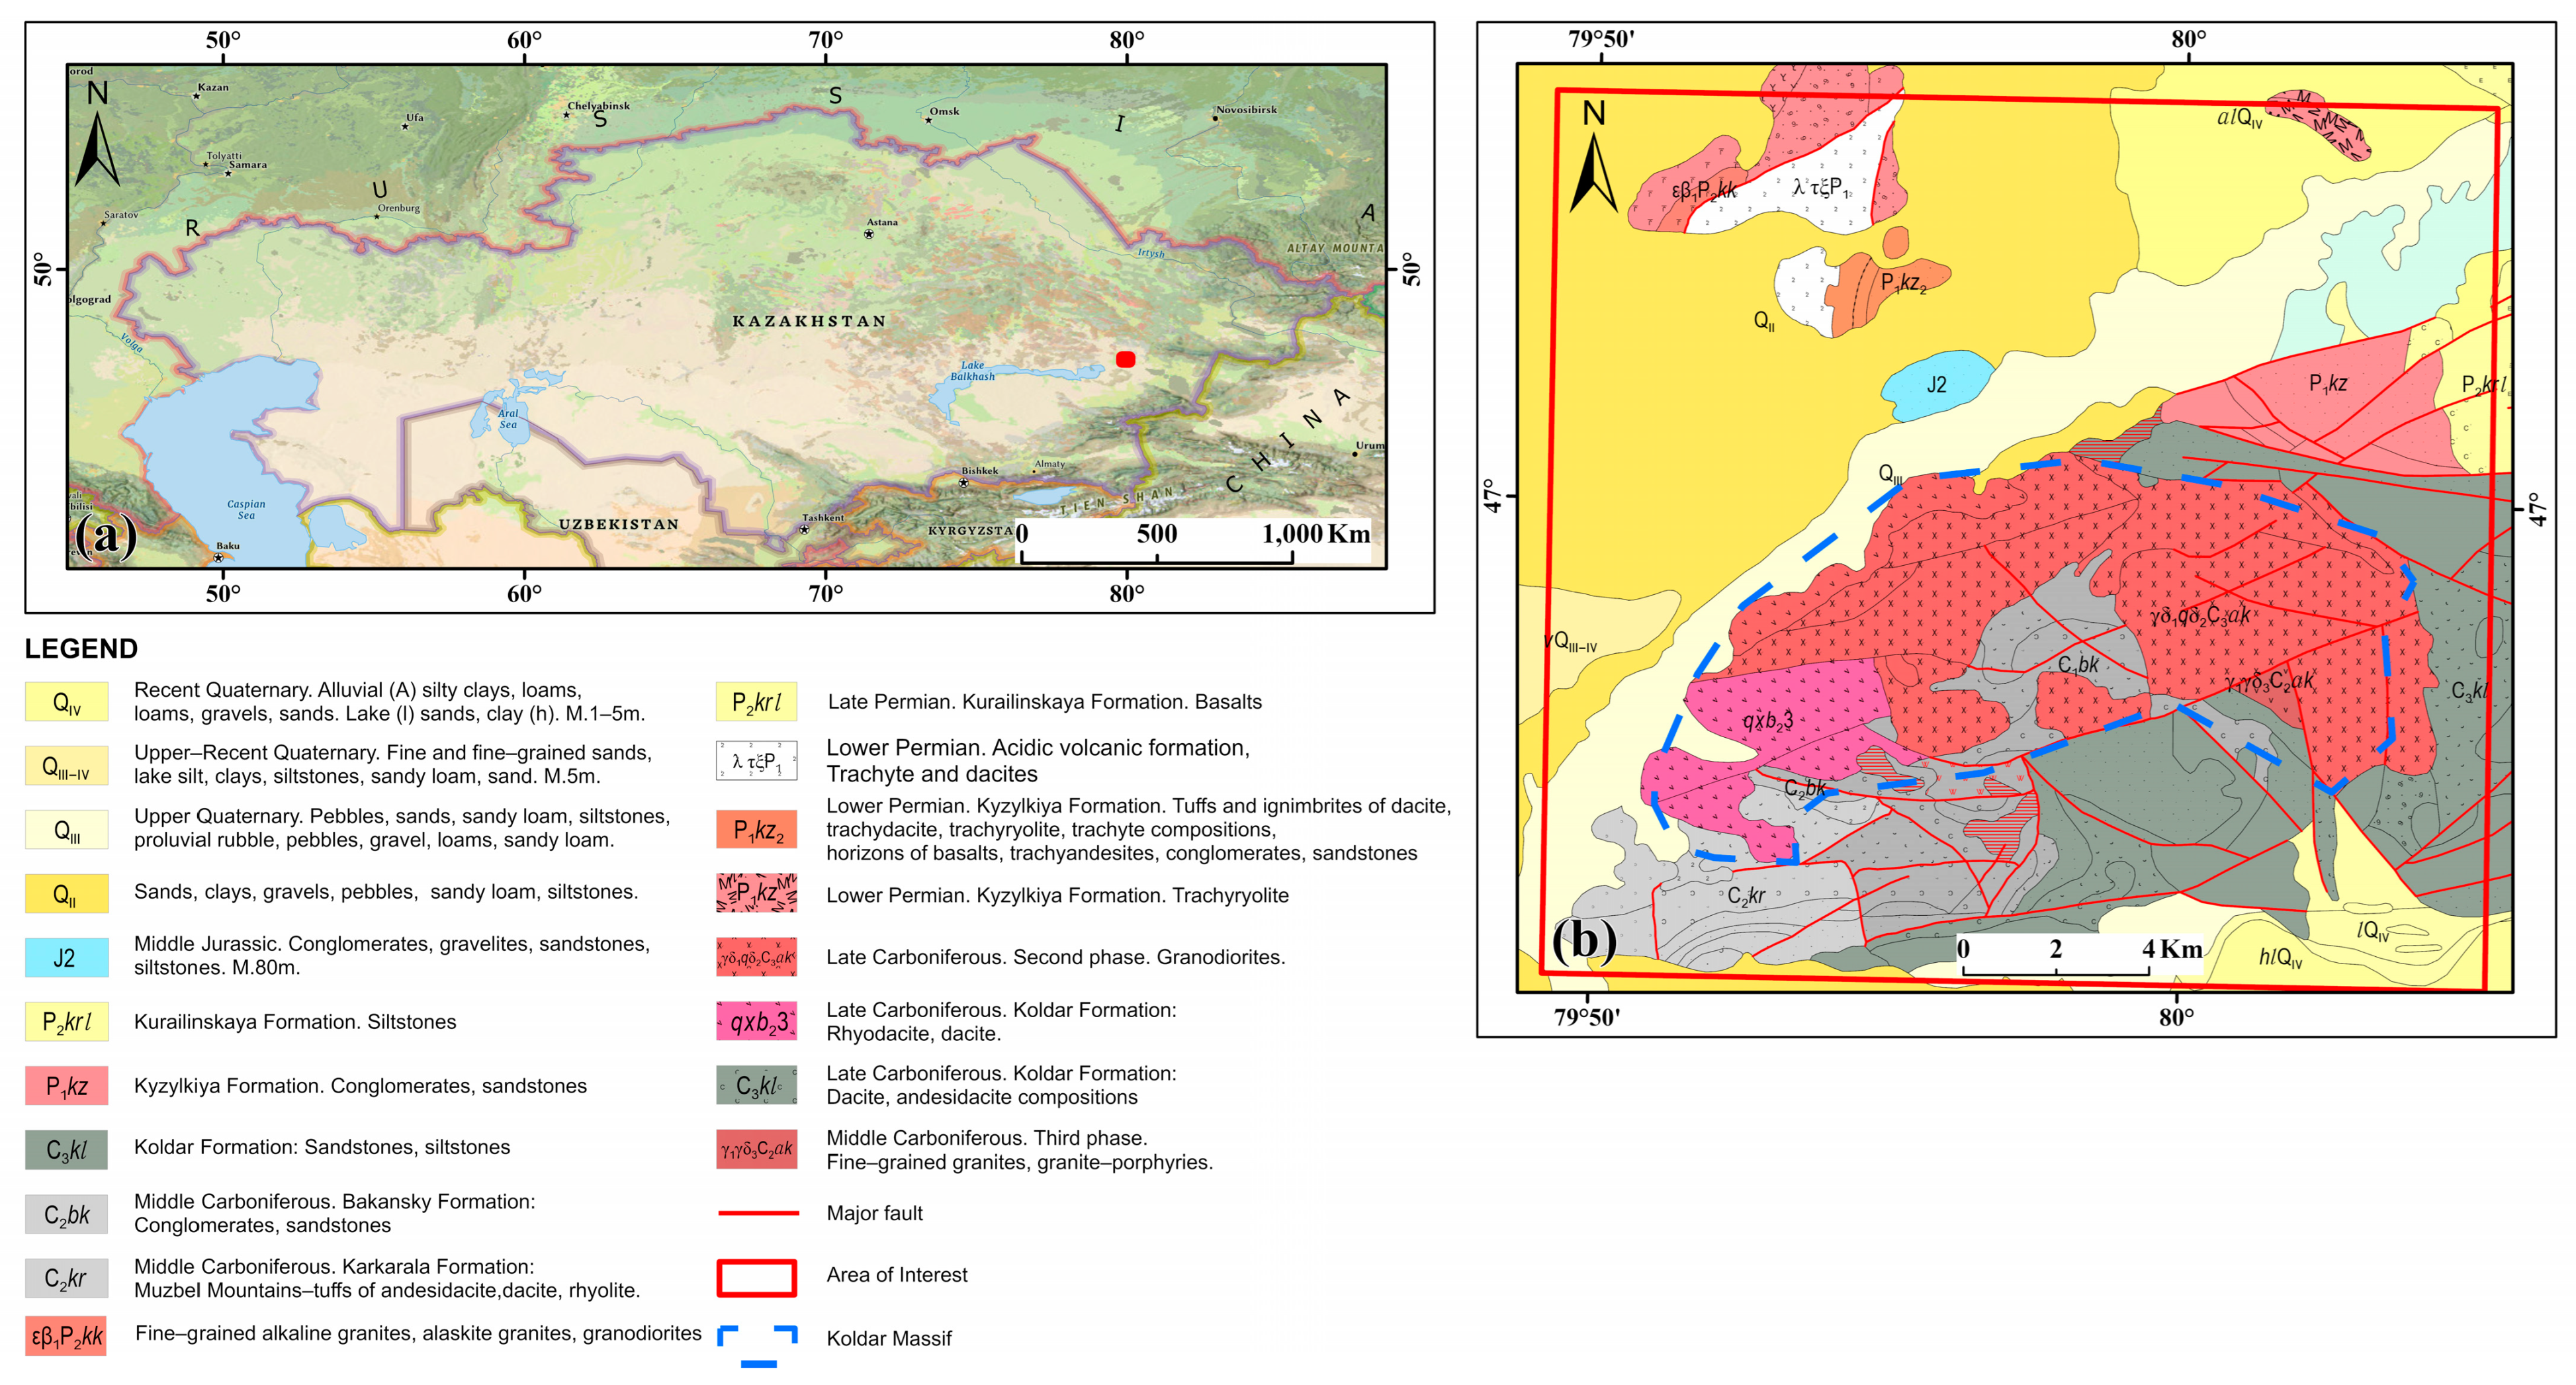
2. Geological Settings of the Study Area

The Aktogay copper deposit is located in the Ayagoz district of the Abay region in southeastern Kazakhstan, approximately 470 km northeast of Almaty, 250 km west of the Chinese border and 22 km east of the Aktogay railroad station. The surrounding region features gently rolling plains interspersed with low hills, with elevations typically ranging from 300 to 500 m above sea level. The area experiences relatively low annual precipitation, averaging around 194–196 mm per year, which is typical for its semi-arid climate. Vegetation in the Aktogay area is sparse, dominated by grasses and shrubs with limited tree cover, all adapted to the dry conditions and low precipitation levels [46]. Commercial production began in 2015, and the mine is expected to operate for at least another 25 years [47,48]. Geologically, this deposit is located in the western part of the Central Asian orogenic belt, an area characterized by intense magmatic activity. The geological structure of the deposit consists mainly of rocks of magmatic origin, including porphyry, volcanic and intrusive bodies [49,50].
The Aktogay copper deposit is located within the Koldar granite pluton, a large, irregularly shaped igneous intrusion formed when molten rock solidified beneath the Earth’s surface. This pluton consists mainly of granodiorite and granite, but also contains smaller amounts of gabbro, diorite and quartz diorite, indicating a complex history of magma composition. Importantly, the late Carboniferous Koldar pluton intruded the Carboniferous Keregetas volcanic series, suggesting that copper mineralization, often associated with magmatic activity, occurred after the formation of these volcanic rocks [51,52,53] (Figure 1b).
The copper mineralization in the Aktogay deposit is characterized by the occurrence of chalcopyrite. It is hosted in stockwork veins. In addition, chalcopyrite is also found as individual, early-formed crystals or phenocrysts embedded in the surrounding rock matrix. This type of mineralization indicates a hydrothermal origin, where hot, mineral-rich fluids circulated through the rock and deposited copper sulfide along fracture surfaces and within the rock itself [47]. Mineralization in the Aktogay copper deposit occurs in the rocks of the first intrusive phase and the volcano-sedimentary rocks of the Keregetas Formation. This mineralization is spatially associated with small stocks and dikes of porphyritic granodiorites and late granodiorite porphyries. Structural influences, particularly faulting, played an important role in the deposition of copper and associated molybdenum. Approximately 70% of the mineralization is confined to the intrusive rocks, while the remaining 30% is found in the volcano-sedimentary rocks [47,50,54,55] (Figure 1b). In the area of the orebody, all rocks except the late mafic dykes have been altered. The central barren core has a siliceous zone with quartz bodies and a dense network of barren quartz veinlets, together with a thin sericite–quartz alteration zone. This core transitions into a thick zone of early potassic alteration (K-feldspar and biotite) surrounding the main orebody. Within the potassic zone, there are weakly mineralized intervals with intense K-feldspar alteration and a biotite halo. Phyllic alteration (quartz–carbonate chlorite–sericite) occurs as thin linear zones at granodiorite–porphyry contacts and fracture zones along the flanks of the orebody. The outermost part of the system has a large propylitic halo with epidote–amphibole and albite–chlorite–prehnite [49]. Looking at the regional geology (Figure 1), the Koldar Massif, which consists mainly of granitic rocks, is bounded by Quaternary sediments to the north and west. Potassic and propylitic alteration zones are conspicuously aligned along this contact, suggesting a genetic link to underlying faults. These structures may represent conduits for hydrothermal fluids that have favored the formation of the observed alteration patterns. Porphyry copper deposits are genetically linked to hydrothermal processes that cause alteration of surrounding rocks and minerals. These hydrothermal fluids migrate through subsurface geologic structures such as faults, fissures and fractures. Although these structures are usually hidden below the surface, they often show up as lines in topographic and remotely sensed images.
Figure 1. (a) Geographical location of the study area and surroundings regions. (b) Simplified geological map of study area (modified from RGF Report 45219 by V. M. Mertenov (sheets L-44-I, II, III), Almaty, 1997).
Minerals 15 00277 g001

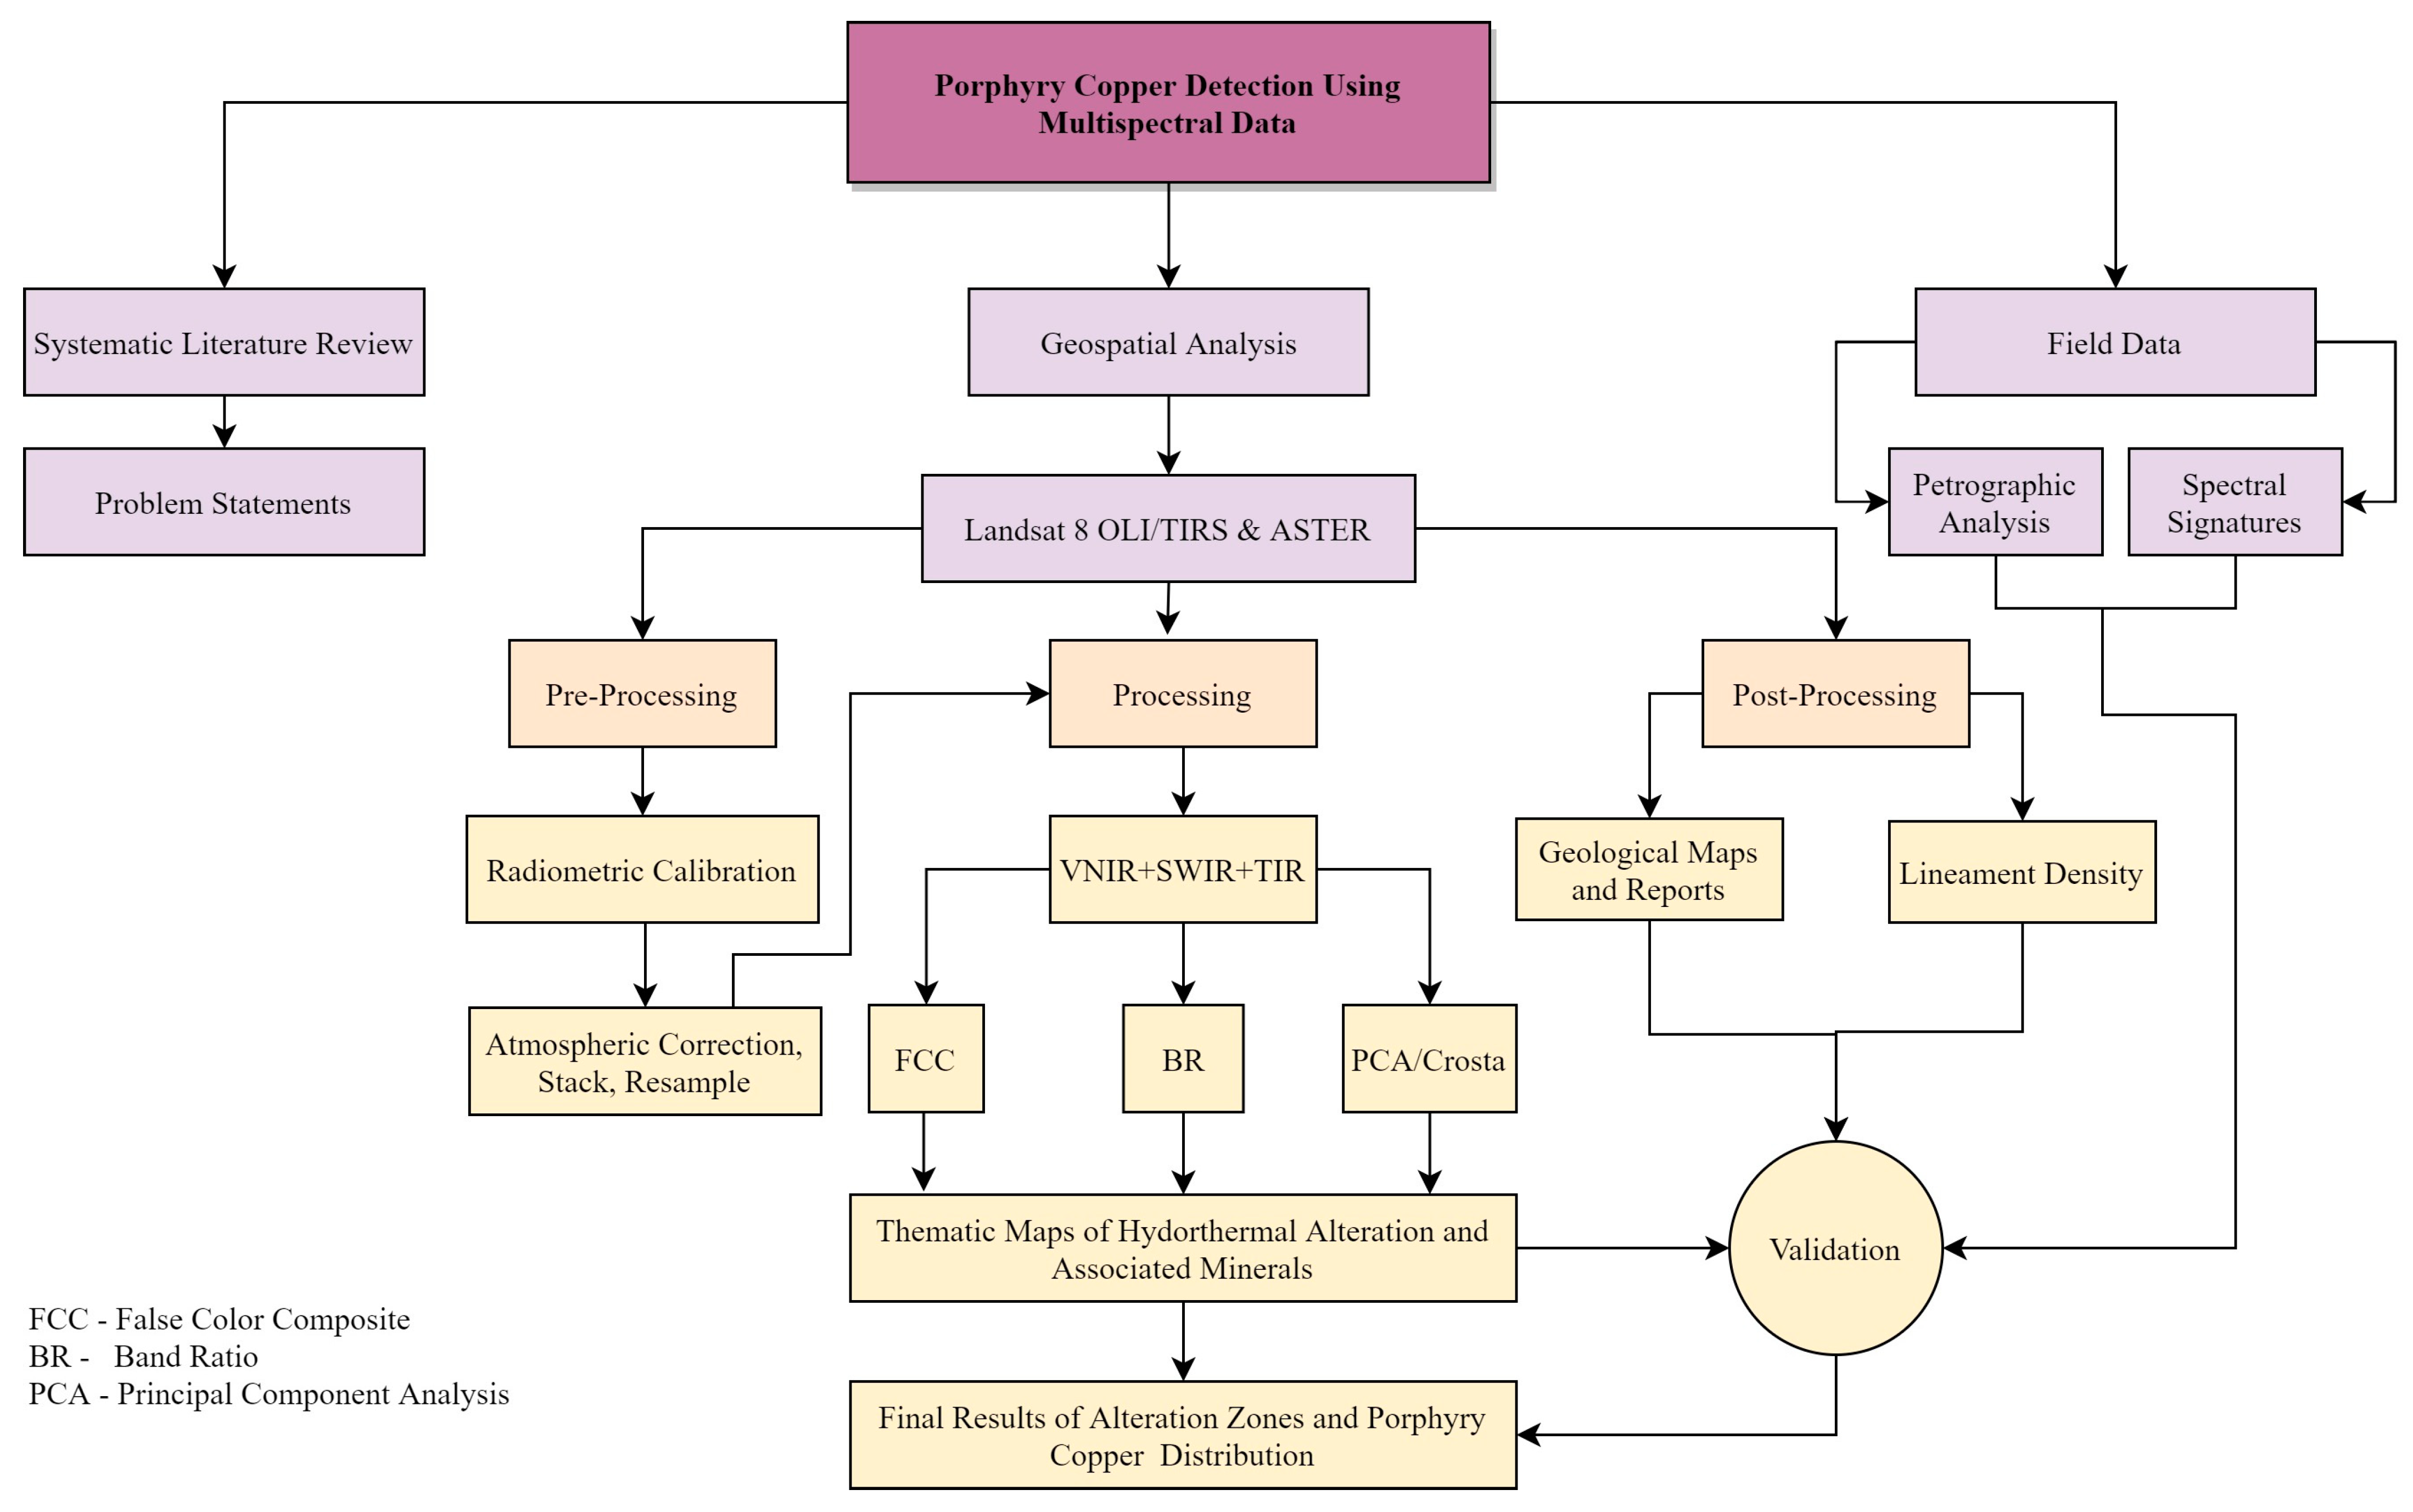
3. Materials and Methods

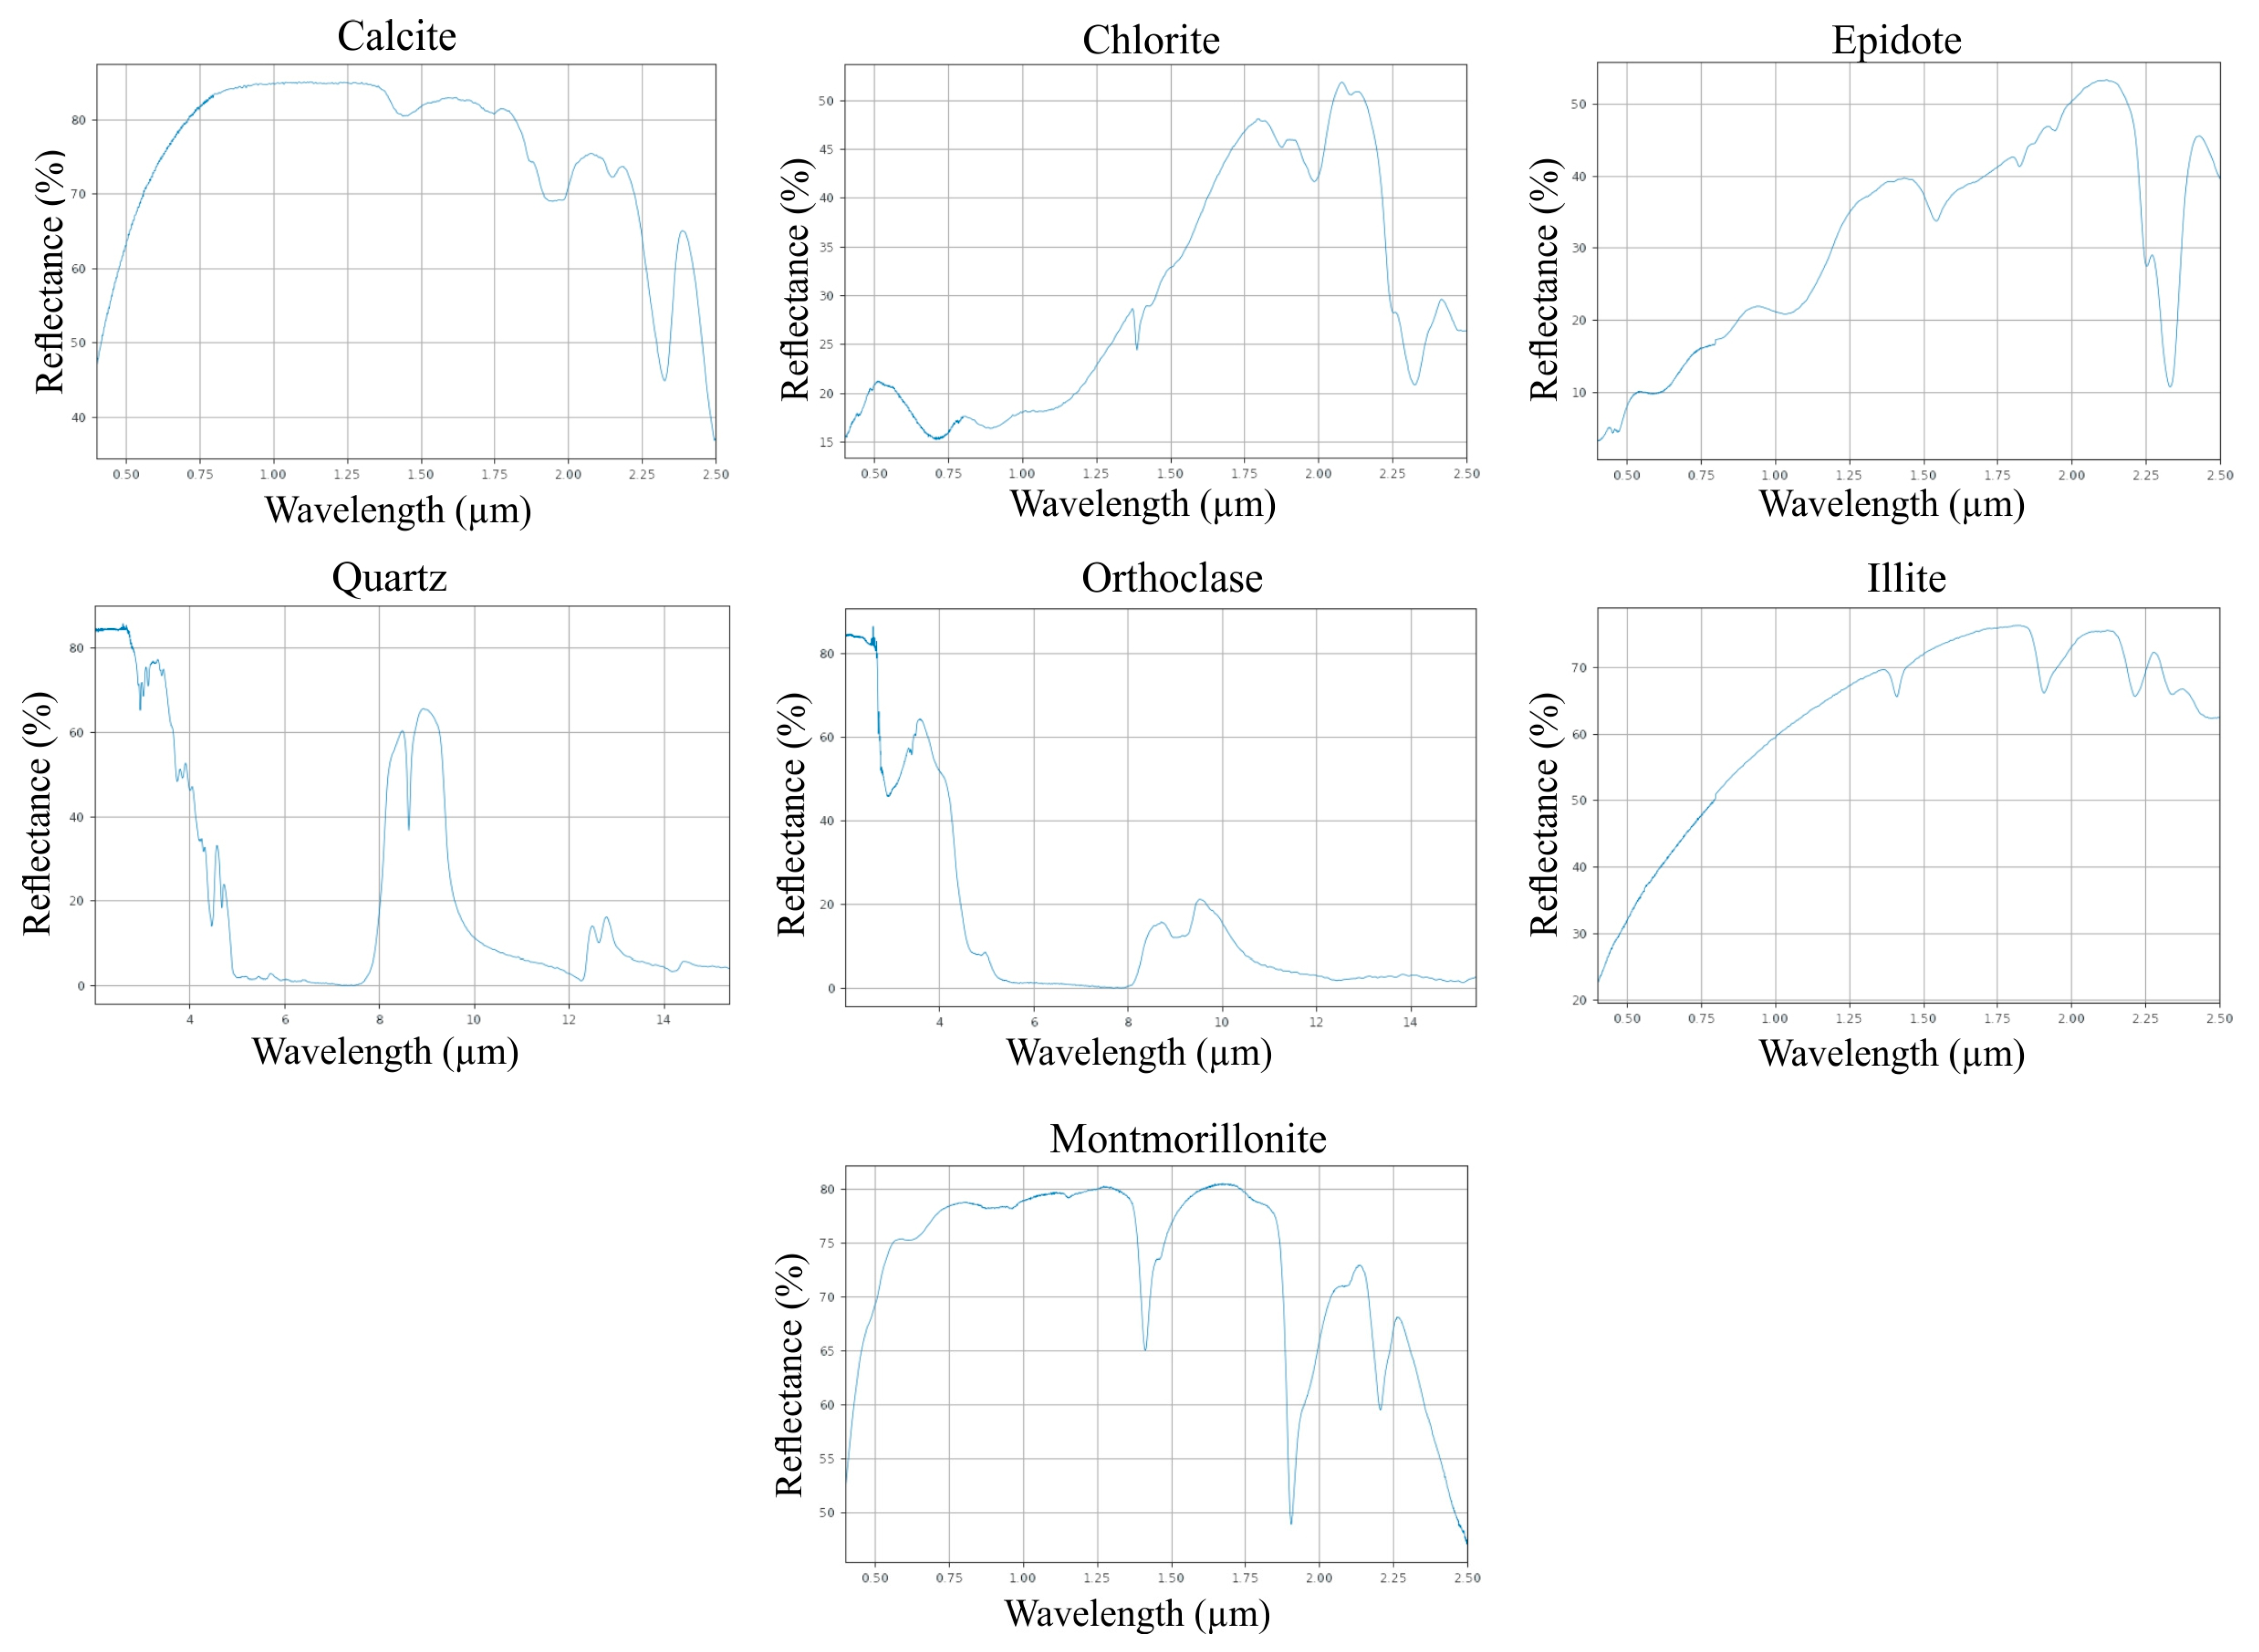
3.1. Characteristics of Remote Sensing Data

Given the unique geological features and geographical location of the Aktogay porphyry copper deposit, multispectral Landsat-8 and ASTER imagery data with minimal cloud and vegetation interference were subjected to rigorous spectral analysis in this study. While Landsat-9 provides more recent data, Landsat-8 was selected for this study because it covers a broader temporal frame that better matches the timeframe of the study. The expanded data coverage of Landsat-8 allows for a more comprehensive analysis of temporal variations and trends, which are essential for understanding the long-term geological evolution of porphyry copper deposits. In addition, the combination of Landsat-8 with ASTER data provides a synergistic advantage both spatially and spectrally. The higher temporal resolution of Landsat-8 allows more frequent observations, which is crucial for tracking dynamic geological changes. It can detect subtle changes in surface composition, temperature and vegetation cover, which are often indicative of geological processes such as erosion, landslides, volcanic activity and tectonic movements. On the other hand, ASTER’s strength lies in its finer spatial and spectral resolution, particularly the SWIR and TIR bands, making it ideal for identifying and analyzing specific mineralogical features and alteration zones associated with porphyry copper deposits. By integrating the capabilities of both sensors, the study gained a refined and detailed perspective that neither sensor alone can provide. This combined methodology improved the accuracy and depth of the analysis and led to a more robust interpretation of geological features and processes. Combining Landsat-8 and ASTER data improves hydrothermal alteration and mineralization mapping by leveraging their complementary spectral capabilities. Landsat-8′s SWIR bands enhance clay and sulfate detection, while its VNIR bands refine iron oxide mapping with higher radiometric resolution. ASTER’s detailed SWIR bands better distinguish alteration minerals like kaolinite and alunite, and its multi-band TIR data improve silicate mineral differentiation.
Figure 2 shows an overview of the workflow used in this study. To obtain the surface reflectance values, a comprehensive preprocessing with the QUick Atmospheric Correction (QUAC) algorithm was applied to the Landsat-8 and ASTER data. A number of image processing techniques were used to improve spectral distinctiveness and identify areas of potential interest: False-Color Composites (FCCs) to visually interpret the spectral variations of hydrothermal alteration zones, band ratio (BR) mathematical analysis to highlight specific spectral features, principal component analysis (PCA) for dimensionality reduction and noise reduction, and a combined band ratio and PCA approach to optimize feature extraction. In addition, a DEM-derived hill shade was used for automatic lineament extraction to validate the results. In this process, an azimuthal analysis was performed to determine the orientation of surface features, followed by parametric automatic lineament extraction to accurately identify linear features. The extracted lineaments were then subjected to a comprehensive lineament density analysis to assess their spatial distribution and frequency. In addition, extensive fieldwork was carried out to verify the remote sensing results over the southern and northeastern parts of the Koldar Massif. The samples obtained were subjected to both macroscopic and microscopic analyses. This approach made it possible to compare the results of the remote sensing data analysis with known geological information, thus increasing the reliability of the interpretation. Ultimately, the complementary use of Landsat-8 and ASTER data provides a holistic view of the study area and improves the mineral exploration and geological mapping work. Digital image processing and spectral analysis were performed in ENVI 5.3 and PCI Geomatica 2018, while the visualization and interpretation of the obtained results was performed in ArcGIS Pro using the geologic basemap of the study area in combination with the geological map of the study area.
The Landsat-8 satellite was a real breakthrough in the field of space imagery. It was launched on 4 February 2013. The spectral data from Landsat-8 are a valuable tool for a variety of tasks in geology, forestry, agriculture, hydrology, environmental studies and many other fields [56]. Landsat-8 is equipped with two sensors, namely, an Operational Land Imager (OLI) and a Thermal InfraRed Sensor (TIRS). The OLI records data in nine spectral bands (0.433–2.3 μm) covering the visible and near-infrared spectrum, with a spatial resolution of 30 m. The TIRS operates in two bands in the thermal infrared (10.60–12.51 μm) with a spatial resolution of 100 m [57,58]. The visible and near-infrared (VNIR) bands (1 to 5) of Landsat-8 contain the Fe3+/Fe2+ absorption features of supergene minerals such as limonite, goethite and hematite. Anomalous limonite-rich rocks (gossan) can be specifically mapped using Landsat-8 bands 1–5, which are a potential indicator of supergene alteration of porphyry copper deposits [26].
The Advanced Spaceborne Thermal Emission and Reflection Radiometer (ASTER) is a multispectral imaging instrument that was launched on 18 December 1999 aboard NASA’s Terra satellite, part of the Earth Observing System (EOS). ASTER captures detailed images of the Earth’s surface in 14 different spectral bands, ranging from visible to thermal infrared. Its capabilities include multispectral imaging with a spatial resolution of 15 m for the visible and near-infrared region (VNIR), 30 m for the shortwave infrared region (SWIR) and 90 m for the thermal infrared region (TIR), as well as stereo imaging to create detailed digital elevation models (DEMs) of the Earth’s surface [59,60,61]. The shortwave infrared (SWIR) bands of ASTER (4 to 9) showed great capabilities in distinguishing between the hydrothermal alteration zones and in specifically identifying phyllic, argillic, potassic and propylitic alterations, which are important as indicators of the potential of copper mineralization in the region. Moreover, the thermal infrared (TIR) bands of ASTER are able to map silicate minerals [27]. Therefore, combining the multispectral bands from Landsat-8 and ASTER can improve the accuracy and efficiency of alteration mineral mapping and provide a more comprehensive understanding of the geological features associated with porphyry copper deposits.
A cloud-free Landsat-8 Level 1 T (terrain-corrected) image was acquired for the study area from the USGS Earth Resources Observation and Science (EROS) Center for 27 August 2016, while ASTER Level 1T (Precision Terrain Corrected Registered At-Sensor Radiance) data with minimal cloud and vegetation cover were obtained from the official Earth Data Portal on 14 August 2004. The detailed image properties of Landsat-8 and ASTER level 1 T data are listed in Table 1. In order to isolate the spectral information on mineral composition, Landsat-8 multispectral bands 1–7 and ASTER bands 1–14 data were used for this study. The Landsat-8 panchromatic, TIR and cirrus bands (8–11) were not considered, nor was the backward stereo band (3B) of ASTER.
Landsat-8 and ASTER have become indispensable instruments for geological remote sensing. The multispectral and thermal capabilities of the satellite are a valuable source of data for lithologic mapping, structural analysis, mineral exploration and natural hazard assessment [56,62]. The spectral bands covering the visible and near-infrared (VNIR) and shortwave infrared (SWIR) regions allow the identification of formations based on their material composition and genesis, as well as secondary alterations associated with the formation of new minerals. ASTER SWIR bands (4 to 9) are of particular value for mineral exploration [63]. They are successfully used to distinguish rock types with different mineral compositions based on their unique spectral properties. In addition, ASTER SWIR bands play a crucial role in the recognition and mapping of hydrothermal minerals and zones (e.g., phyllic, argillic, potassic and propylitic alteration zones), which are often associated with porphyry copper deposits [64].

3.2. Methods

3.2.1. False-Color Composite (FCC)

False-Color Composite (FCC) is an image processing technique in which certain spectral bands of a multispectral image (i.e., bands from the Vis, NIR, SWIR, TIR portions, etc.) are assigned to the red, green and blue (RGB) color channels for visual display. By strategically combining different spectral wavelengths, FCC effectively enhances the visibility of features and phenomena that may not be perceptible in natural color images. This technique is widely used in remote sensing to improve the interpretation and analysis of features on the Earth’s surface [25,65]. In the field of geological remote sensing, FCC is an important tool for distinguishing between different rock types and mineral groups based on their unique spectral signatures. By carefully selecting and combining specific spectral bands, we can effectively enhance subtle spectral variations, facilitating the delineation of lithological units, the identification of alteration zones and the exploration of mineral deposits [66].
Considering the spectral characteristics of minerals typical of copper porphyry deposits, 7-5-2 and 4-6-8 were used as the RGB band combinations for Landsat-8 and ASTER data, respectively, in this study. These specific band combinations are particularly effective for highlighting hydrothermal alteration zones and associated mineral groups [67,68]. Shortwave infrared band 7 (2.11–2.29 μm) is particularly sensitive to spectral variations associated with clay, hydroxyl, carbonate and sulfate minerals. This spectral sensitivity makes it an effective tool for the detection and mapping of alteration minerals, including chlorite, epidote and sericite, which are commonly associated with porphyry copper mineralization. Bands 2 (blue, 0.45–0.51 μm) and 5 (near-infrared, 0.85–0.88 μm) are sensitive to iron oxides and hydroxides, important indicators of oxidation zones in copper porphyry systems. These minerals exhibit strong absorption in the spectral range of 0.4–1.1 μm, which includes both bands. In addition, band 5 effectively distinguishes areas of high vegetation and helps identify anomalous mineralized zones [4,15,25,67] (Figure 3).

3.2.2. Band Ratio (BR) Math Analysis

The band ratio method is often used as a spectral enhancement technique in remote sensing. This method effectively extracts diagnostic spectral information by combining or manipulating multiple spectral bands. The resulting ratios or mathematical transformations improve the visibility of geological structures, lithological units and alteration minerals associated with ore deposits [24,69]. For instance, porphyry copper deposits exhibit characteristic zonal alteration patterns. A central potassic core enriched in quartz and potassium feldspar is usually surrounded by concentric zones of argillic, phyllic and propylitic alteration. These alteration minerals, including those containing hydroxyl groups and other representing minerals, such as chlorite, kaolinite, orthoclase and illite, exhibit distinct spectral absorption features in the VNIR and SWIR regions [70].
Figure 3. Spectral signatures of relevant hydrothermal alteration minerals for porphyry copper deposits modified from [71,72].
Minerals 15 00277 g003
In addition, an oxidation zone enriched with iron oxide minerals (gossan) forms above many porphyry bodies [26,67]. To improve the delineation of hydrothermal alteration zones associated with porphyry copper mineralization, different band ratio indices were calculated on Landsat-8 and ASTER in this study and then visualized as pixels with thresholds and RGB composites. Hydroxyl-bearing minerals such as clays and carbonates show a strong reflectance in Landsat-8 band 6 (1.56–1.65 μm) and a prominent absorption feature in band 7 (2.11–2.29 μm) due to Al-OH and CO3 vibrational properties (Figure 3) [28]. To improve the mapping of these minerals, a band ratio of band 6 to band 7 was calculated to highlight the spectral contrasts associated with the hydroxyl and carbonate contents in the study area. In addition, iron oxides and hydroxides, including hematite, jarosite and limonite, were mapped using Landsat-8 bands 2 (blue, 0.45–0.52 μm) and 4 (red, 0.63–0.69 μm). These minerals exhibit strong absorption in the blue band and high reflectance in the red band, which facilitates their spectral identification [2,26].
A variety of band ratios (BRs) were used to delineate the potassic, propylitic and argillic hydrothermal alteration zones based on their diagnostic mineral assemblages. Given the distinctive reflectance properties of quartz-rich minerals (Figure 3) within the thermal region, two specific BRs, (B11 × B11)/B10/B14 and B14/B12, were utilized to target orthoclase and quartz as indicators of potassic alteration [70]. Chlorite, calcite and epidote are characteristic minerals of propylitic alteration zones, exhibiting diagnostic spectral signatures within the VNIR and SWIR regions. Band ratios (BRs) of B5/B8 for chlorite, (B6 + B7)/(2 × B8) for calcite and (B6 + B9)/(B7 + B8) for epidote were calculated from ASTER data to map their distribution (Figure 3) [70,73,74]. To identify argillic alteration zones in the study area, band ratios of B4/B6 and (B7 + B5)/(B6 + B9) were calculated from ASTER data. These ratios, which correspond to spectral properties of kaolinite and illite–montmorillonite, respectively, serve as proxies for these clay minerals commonly associated with argillic alteration (Figure 3) [70,75].

3.2.3. Principal Component Analysis (PCA)

Principal component analysis (PCA) is a robust statistical technique for reducing the dimensionality of data, highlighting key features and revealing underlying patterns or structures in multidimensional datasets. When applied to satellite imagery, PCA effectively reduces the dimensionality of the data while preserving the most important information. This process highlights the most important factors that can be used to identify lithological and hydrothermal alteration features of reservoirs [76,77].
Typically, principal components (PCs) with high eigenvalues in certain spectral channels show the reflection and absorption of the corresponding mineral groups with opposite signs. Positive eigenvalues in a spectral band highlight a mineral group as bright pixels that coincide with the reflection bands, while negative eigenvalues represent the mineral group as dark pixels that coincide with the absorption bands (Figure 3) [78,79]. In the context of copper porphyry deposit detection, PCA can be particularly effective. Porphyry copper deposits are often associated with hydrothermal alteration zones that have different spectral signatures. By applying PCA to satellite imagery, such as Landsat-8 and ASTER data, it is possible to improve the detection of these alteration zones. For example, specific PCAs can be used to identify important alteration minerals, such as kaolinite, muscovite and alunite, which are indicative of argillic alteration zones [80,81]. Analyzing the statistical data obtained by PCA transformation over the VNIR and SWIR spectral channels of Landsat-8 can help identify significant indicators of various geological and mineralogical features in this study. In this case, eigenvectors and eigenvalues are considered to determine the contribution of the different channels to the formation of each PC and to reveal their possible interpretation.

3.2.4. Crosta Technique

The Crosta method, also known as Feature-Oriented Principal Component Selection (FPCS), was introduced by Crosta and Moore in 1998 [82]. This technique is a specialized application within principal component analysis (PCA) that focuses on identifying principal component (PC) images that contain significant information related to the spectral signatures of specific minerals. The core idea of the Crosta method is to use the statistical results from PCA eigenvector loadings to determine which PC images are most informative for detecting particular mineral signatures [2,83,84]. This method has been extensively used in geological studies, especially for identifying areas rich in iron oxides and hydroxyl minerals [85,86]. A crucial step in the Crosta method is the selection of effective components. This selection is based on analyzing the eigenvalues and their corresponding eigenvectors. Specifically, components are chosen based on the minimum and maximum eigenvalues, as well as the presence of opposite signs in the eigenvector loadings, which indicate the targeted mineral signatures [2]. In this study, the Crosta method was used to find propylitic and argillic alteration zones [2,12,68]. Eight VNIR+SWIR bands of the ASTER data were used to calculate the eigenvectors for this method. Bands 1, 4, 5 and 8 were then selected for propylitic alteration zones and bands 1, 4, 6 and 7 for argillic alteration zones [68]. The band selection was based on the spectral reflectance and absorption properties of the predominant minerals associated with these alteration types.

3.2.5. Automated Lineament Extraction

Automated lineament extraction is conducted using advanced computer-assisted software designed to streamline the process. This automated workflow encompasses several key stages: image enhancement; filtering; edge detection; and, ultimately, lineament extraction [62]. These methods significantly expedite the analysis, enabling the production of results in a relatively short timeframe. The initial stage, image enhancement, involves improving the quality of the input data to highlight features of interest. This is followed by filtering, which reduces noise and enhances the clarity of potential lineaments. Edge detection algorithms are then applied to identify the boundaries of linear features within the data. Finally, the lineament extraction phase isolates these features for further analysis.
It is imperative for the user or analyst to critically evaluate the extracted lineaments. This evaluation often involves integrating manual interpretations to verify and refine the automated results. By combining automated techniques with expert judgment, the accuracy and reliability of the lineament extraction process can be significantly enhanced, ensuring that the final results are both scientifically robust and geologically meaningful [62].
In this study, the lineaments were automatically extracted using DEM data, facilitated by the LINE algorithm in PCI Geomatica. This process involved six key parameters: RADI (filter radius in pixels), GTHR (edge gradient threshold in pixels), LTHR (curve length threshold in pixels), FTHR (line approximation error threshold in pixels), ATHR (angular difference threshold in degrees) and DTHR (link distance threshold in pixels). These parameters were meticulously adjusted to optimize the extraction process, ensuring that the lineaments were accurately identified and represented. The resulting lineaments were then converted into vector format, which allowed for precise manipulation and analysis. These vectors were subsequently exported to the ArcMap environment, where they underwent further density analysis and plotting to visualize the spatial distribution and concentration of the lineaments. The results are illustrated in the subsequent section.

4. Results

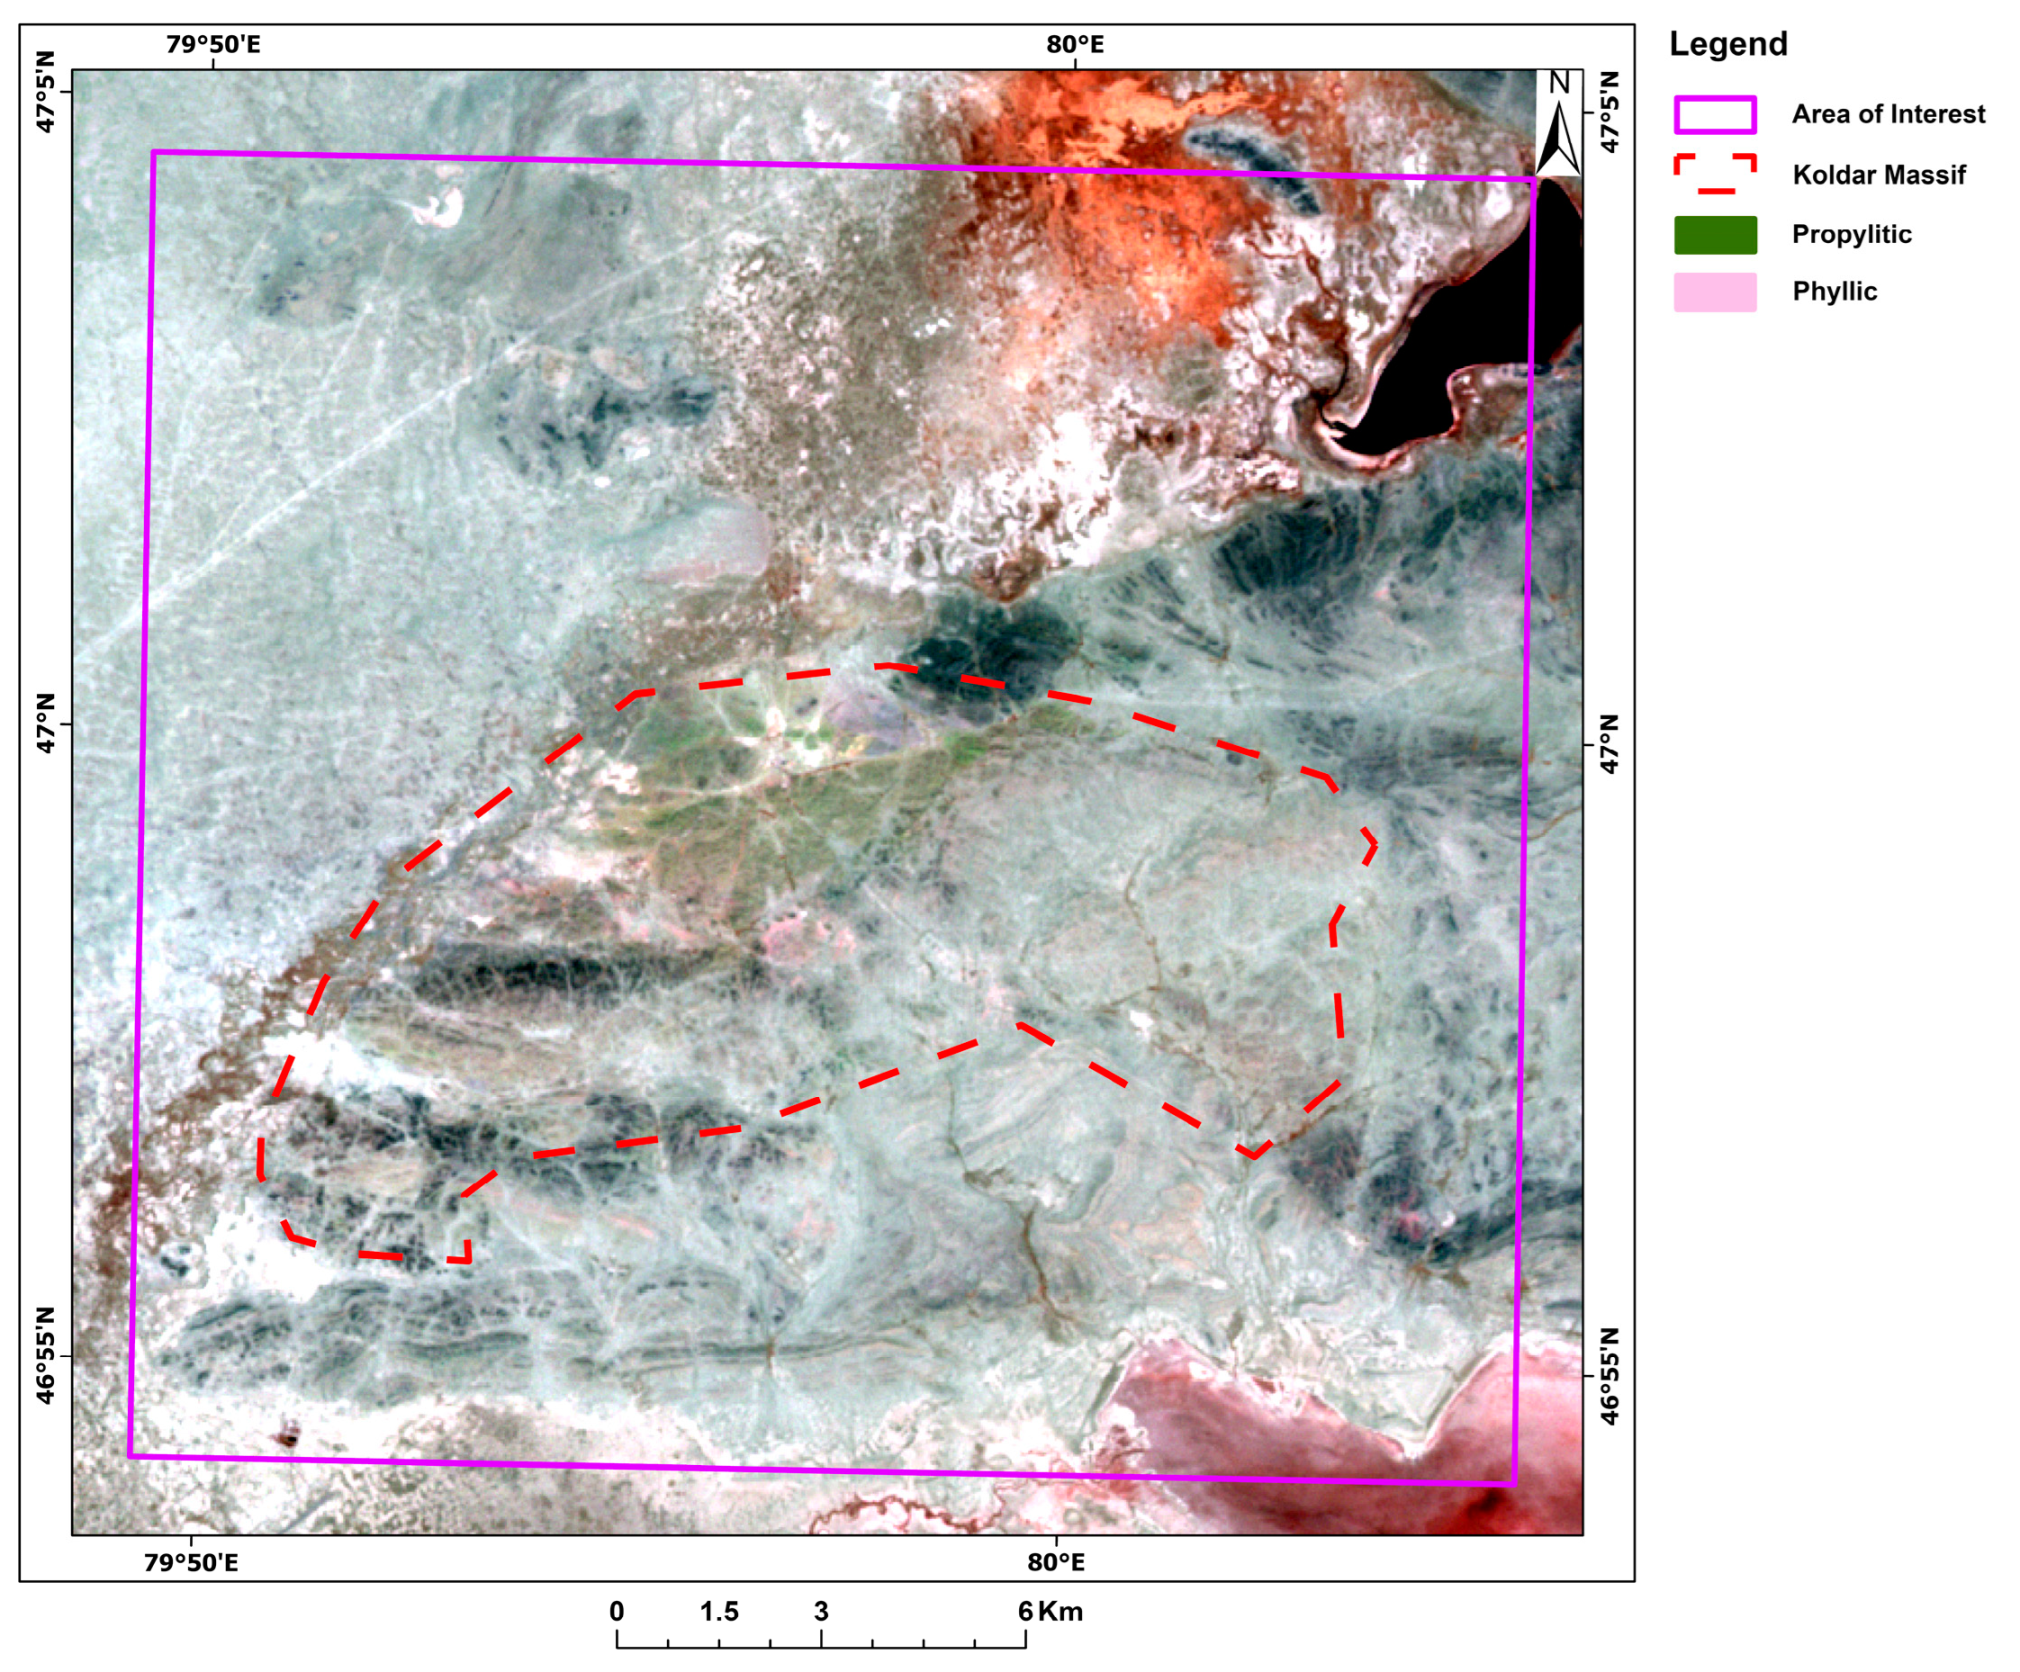
4.1. Mapping Alteration Zones and Minerals

In this study, two FCCs, one using Landsat-8 bands 7, 5 and 2 and the other using ASTER bands 4, 6 and 8 as RGB components, were used to effectively map hydrothermal alteration zones within the Aktogay porphyry copper deposit (Figure 4 and Figure 5). The Landsat-8 FCC of 7, 5 and 2 successfully enhanced the spectral contrast of these zones, highlighting them as distinct anomalous areas characterized by white to light-yellow hues. The spatial distribution of the identified alteration zones within the study area shows a pronounced east–west orientation, suggesting a possible structural control on their evolution (Figure 4). In addition, the ASTER FCC of 4, 6 and 8 effectively highlighted propylitic (light green) and phyllic (light purple) hydrothermal alteration zones in the study area (Figure 5).
The FCCs effectively differentiated alteration areas from the surrounding landscapes and unaltered zones by creating distinct spectral signatures for vegetation (light green) and water bodies (light blue) in the northeastern and southeastern regions (Figure 4 and Figure 5). This vegetation highlight is due to its optimal reflectance characteristics within the near-infrared (NIR) portion, which corresponds to band 5 of the Landsat-8 satellite imagery, as illustrated in Figure 4. Vegetation reflects strongly in the NIR region, typically between 700 nm and 1300 nm, due to the internal structure of plant leaves and the presence of chlorophyll. This strong reflectance in the NIR band is a key indicator of plant health. This distinct spectral contrast enabled the precise exclusion of these irrelevant features, greatly improving the accuracy and reliability of hydrothermal alteration zone identification. By suppressing the influence of vegetation- and water-related spectral signals, the FCCs optimized the detection of subtle spectral anomalies associated with hydrothermal alteration zones.
Considering the geologic structure and mineral composition, particularly within the Aktogay copper deposit, different BRs were applied to delineate the spatial distribution of the associated hydrothermal alteration zones. Application of the Landsat-8 band ratio of B6/B7 identified two anomalous zones indicative of clay minerals, predominantly kaolinite, in the northeastern and southeastern sectors of the study area (Figure 6a). In addition, the Landsat-8 band ratio of B4/B2 was used to enhance the spectral signature of iron oxides, a diagnostic indicator of porphyry copper oxidation zones within the Aktogay deposit. The pronounced reflectance of iron oxides in the red band combined with their strong absorption in the blue band resulted in effective spectral enhancement by this ratio. Distinct iron oxide-rich zones were identified within and surrounding the study area (Figure 6b). Some areas coincided with the Aktogay copper deposit, suggesting a genetic link between copper mineralization and iron oxide alteration. Other zones, located northeast and east of the deposit, showed an elongated morphology. These results suggest a possible link between the iron oxide distribution and the broader regional pattern of mineralization that extends beyond the porphyry copper system.
Processing of ASTER data provided results in the detection of potassic alteration zones in the study area. BRs of (B11 × B11)/B10/B14 and B14/B12 effectively identified orthoclase and quartz, minerals indicative of potassic alteration, near and northwest of the Kolar Massif within the Aktogay copper deposit (Figure 7). Propylitic alteration minerals (calcite, chlorite and epidote) were also successfully mapped using B5/B8, (B6 + B7)/(2 × B8) and (B6 + B9)/(B7 + B8), respectively (Figure 8). This propylitic alteration zone is spatially associated with other alteration zones that are characteristic of porphyry copper deposits and have been identified using complementary methods. It is noteworthy that calcite and chlorite are more widespread in the study area than epidote. The results show that the Kolar Massif is surrounded by NE-SW trending propylitic alteration zones (Figure 8).
Furthermore, the application of BRs to ASTER data to locate argillic hydrothermal alteration zones based on diagnostic mineral assemblages showed promising results consistent with those from Landsat-8 data. Kaolinite, which was identified using the B4/B6 ratio, has a wider spatial distribution in the study area compared to illite–montmorillonite, which was mapped using the (B7 + B5)/(B6 + B9) ratio. Based on these results, argillic alteration zones are predominant in the Koldar Massif and the surrounding northeastern and southeastern regions. Within the Koldar Massif and the study area, these zones have a northeast–southwest orientation that coincides with the ongoing Aktogai mining operation (Figure 9). Due to the spectral similarity between the alteration minerals, the surrounding vegetation and the minerals from different alteration zones, some of the discovered alteration minerals were initially misclassified. However, to increase the reliability of the results, the Quaternary vegetation and sedimentary formations in the northeast of the study area were carefully masked based on the findings from the FCC results and the existing geologic and field data. This approach effectively distinguished between alteration zones and unaltered areas, as shown in Figure 7, Figure 8 and Figure 9.
PCA was applied to the seven bands of Landsat-8 to reduce dimensionality and extract principal components (PCs). The eigenvalues and eigenvectors were calculated and are shown in Table 2 and Table 3. PC1, characterized by high positive loadings across all bands, primarily represents the overall brightness of the image (albedo). PC2 is mainly influenced by SWIR2 (band 7), blue (band 1) and red (band 4). Band 7 has the strongest negative loading (−0.75765) on PC2, which means that areas with low SWIR2 reflectance (e.g., moist soils and certain minerals) have high PC2 values and appear dark in the PC2 image (Table 3). Conversely, the positive loading (0.48096) indicates that regions with high blue reflectance (e.g., exposed rocks) also have high PC2 values and appear bright. The remaining bands (2, 3, 5 and 6) have negligible loadings on PC2, suggesting that they contribute only minimally to its formation. Consequently, PC2 can be interpreted as a contrast index that primarily distinguishes between moisture-bearing features (e.g., soils and minerals) and exposed surfaces (e.g., rocks and soils), possibly responding to vegetation (Table 3).
PC3 is primarily influenced by SWIR1 (band 6) with a strong negative loading and, to a lesser extent, by SWIR2 (band 7) and VNIR (band 1) with a positive loading. Given the dominant negative contribution of band 6 and the negligible loadings from the other bands, dark pixels in the PC3 image are likely indicative of areas with high concentrations of hydroxyl-bearing minerals and carbonates (Table 3).
PC4 is strongly influenced by the red band (negative loading of −0.64112), indicating a possible sensitivity to iron oxides and hydroxyl-bearing minerals. Areas with a high abundance of these minerals are likely to appear as dark pixels in the PC4 image (Table 3). PC5, PC6 and PC7 together account for less than 1% of the total variance, indicating a limited information content compared to the first four components. Their high loadings in the green (band 3) and NIR (band 5) bands indicate a possible relationship to vegetation (Table 3).
Accordingly, an RGB color composite of PC3, PC4 and PC2 was selected for the visualization of the Landsat-8 PCA results (Figure 10), as this combination optimally highlights the hydrothermally altered zones and associated minerals. To improve the contrast and clarity of the image, the negative loadings of the selected components were inverted by multiplying by −1. The RGB composite image effectively differentiates various geological features. Vegetation and alluvium appear in shades of blue, while water bodies are represented by shades ranging from white to light blue. Iron oxides and hydroxides, important indicators of oxidation zones, are highlighted in light green. The most intense green coloration corresponds to the Aktogay porphyry copper deposit, indicating a high concentration of iron-bearing minerals such as hematite, goethite and limonite. Clay minerals associated with hydrothermal alteration are shown in red and form a clear contrast to the oxidation zones (Figure 10).
Considering the effectiveness of the Crosta method using ASTER bands for detecting alteration minerals, PCA was performed on two selected band sets. The first, using bands B1, B4, B5 and B8, focused on propylitic alteration, while the second, using bands B1, B4, B6 and B7, targeted argillic alteration. These band combinations were selected based on their sensitivity to the spectral reflectance and absorption properties of chlorite and clay minerals, respectively (Table 3, Figure 11). In agreement with the chlorite reflectance and coefficient loadings, both PC3 and PC4 effectively enhanced pixels indicative of propylitic alteration zones. However, PC4 showed better results in delineating the propylite alteration distribution and was consistent with the BR and FCC analyses. The identified propylitic zone is spatially associated with the Koldar Massif and its surroundings, a region known for its proximity to the Aktogay porphyry copper deposit. Based on the reflection of the clay minerals and the calculated Crosta principal components, PC4 highlighted the pixels corresponding to argillic alteration. As shown in Figure 11 and Table 3, the argillic alteration zone is characterized by brighter pixel values and has a smaller spatial extent compared to the propylitic alteration in the study area. These results were confirmed by PCA analysis of the Landsat-8 data and BRs. Based on the promising techniques employed, a comprehensive final map was generated to present the identified alteration zones, which were subsequently verified (Figure 13). This map was created by integrating the optimal results derived from the band ratio (BR) and Crosta techniques applied to ASTER data. As illustrated in Figure 13, the potassic alteration zone was delineated using the results from Figure 7. The propylitic alteration zone was added by integrating the results from Figure 8 and Figure 11. Similarly, the argillic alteration zone was inserted by combining the results from Figure 9 and Figure 11. The integration of these techniques allowed for a more accurate and detailed representation of the alteration zones. Considering the spectral similarities of minerals associated with potassic, propylitic and argillic alteration zones, some overlaps were observed in Figure 13. However, by cross-referencing field sample data, the geological map and the typical patterns of a porphyry copper system, the optical results were carefully selected and integrated into Figure 13. This approach ensured that the spectral data accurately reflected the geological context and enhanced the reliability of the mineral alteration analysis.

4.2. Verification of the Image Processing Results

Three primary hydrothermal alteration zones, namely, potassic, propylitic and argillic zones, were successfully mapped in the study area using BRs derived from ASTER data (Figure 7, Figure 8 and Figure 9). While the distribution of argillic alteration was generally consistent with the Landsat-8 BRs, the latter also showed a significant iron oxide signature within the Aktogay deposit (Figure 6), likely related to ongoing mining activities. All identified alteration zones are spatially concentrated in the north and northwest of the Koldar Massif and extend beyond the study area with a predominant northeast–southwest orientation (Figure 7, Figure 8 and Figure 9). These results were corroborated by Crosta methods applied to ASTER data.
There is a strong correlation between the distribution of hydrothermal alteration zones and the density of lineaments in the study area. As can be seen in Figure 12, a high concentration of extracted lineaments coincides with the previously identified alteration zones northwest of the Koldar Massif. The spatial pattern, density and orientation of the lineaments provide compelling evidence of the relationship between the discovered hydrothermal alteration zones and the underlying porphyry copper mineralization in the study area.
Furthermore, the results show a high correlation between the hydrothermal alteration zones and the lineaments discovered, which correspond well with the data collected during the fieldwork. Samples from the southern and northeastern parts of the Koldar Massif were examined macroscopically and microscopically to characterize the alteration zones and the minerals they contain. As shown in Figure 13 and Figure 14, three representatives of the analyzed samples overlap with the propylitic and argillic alteration zones detected by the BR and PCA approaches. According to the petrographic and mineralogical analyzes, sample #1 from the southern part of the study area within the potassic alteration zone detected by remote sensing data consists of quartz, amphibole, medium-acid plagioclase and potassium feldspar (K-feldspar) (Figure 14a,b). In addition, secondary minerals, such as chlorite, sericite and calcite, as well as accessory ore minerals, such as chalcopyrite, bornite and pyrite, can be observed in a thin section of this sample (Figure 14a,b). This sample clearly shows the relationship between the potassic alteration zone and the presence of copper ore minerals.
Sample #2 was taken in the southeastern part of the study area, within the contact zone of volcanic rocks, which are predominantly acidic in composition. Based on field and thin-section observations, propylitic and potassic hydrothermal alteration zones are present (Figure 14c,d) that correlate highly with the alteration zones detected by the ASTER data in this study. The sample was identified as dacitic tuff consisting of quartz, feldspar, plagioclase, volcanic glass and biotite as major minerals, with chlorite, sericite, epidote, sphene, chalcopyrite and pyrite as secondary ore minerals (Figure 14c,d). Sample #3 was taken from the northeastern part of the Koldar Massif, within the argillic alteration zone. Based on sectional observations, the sample consists of quartz, feldspar, plagioclase of medium composition, biotite and amphibole as major minerals, with chlorite, sericite, epidote, sphene, chalcopyrite and pyrite as minor and ore minerals. Argillic alteration can be observed both in situ and under the microscope, represented by the sericitization and politicization of plagioclase and orthoclase (Figure 14e,f). Accordingly, the spatial distribution of the lineaments and the collected samples representing the propylitic, potassic and argillic hydrothermal alteration zones provide evidence to verify the results obtained from the remote sensing datasets.
In addition, a total of 45 reference points were obtained from the spectral signatures of hydrothermal alteration zones provided by the KAZ Minerals Company. These reference points were utilized to perform an accuracy assessment and calculate the Kappa Coefficients, which are essential metrics for evaluating the reliability of remote sensing results. The spatial distribution of these reference points (Table 4) and their correlation with the detected alteration zones (Figure 13) were analyzed comprehensively. Out of the 45 reference points, 32 were found to correspond to the detected alteration zones, yielding an overall accuracy of 71.11%. Furthermore, the calculated Kappa Coefficient of 0.615 indicates a substantial level of agreement beyond chance. These results suggest that the applied remote sensing techniques demonstrate a strong capacity for accurately identifying hydrothermal alteration zones. The lower percentage of matching in the accuracy assessment is attributed to the spectral signature points, which are predominantly concentrated within the Aktogay copper mine area. However, detailed and comprehensive field sampling, along with further verification and the development of advanced machine learning algorithms, are planned for future studies. These efforts will aim to enhance the accuracy and reliability of the spectral data analysis, ensuring more robust and precise results in subsequent research.

5. Discussion

This study successfully demonstrates the application of Landsat-8 and ASTER multispectral data to detect and delineate hydrothermal alteration zones associated with porphyry copper mineralization at the Aktogay deposit in eastern Kazakhstan. In particular, the ASTER data, especially when processed with BRs and PCA, effectively identified potassic, propylitic, argillic and iron oxide alteration zones. These alteration zones, mapped mainly in the northwest of the Koldar Massif, spatially coincide with structural lineaments, indicating their association with copper-bearing zones. The study highlights the superior capabilities of ASTER data for rapid and cost-effective mineral exploration and offers significant potential for the early identification of porphyry copper systems in arid and semi-arid environments, particularly where there is no prior remote sensing analysis.
The comparison of these results with previous studies underlines their importance for the further development of remote sensing applications for mineral exploration in developing countries such as Kazakhstan. Previous studies have shown that hydrothermal alteration zones in porphyry systems have different spectral characteristics that can be recognized by remote sensing [9,25,26,29,72,87,88]. The current study extends these results by showing that ASTER data, with their higher spectral resolution in the VNIR and SWIR bands, outperform Landsat-8 data in accurately mapping hydrothermal zones. This result is in line with Alimohammadi et al. [10], Beiranvand Pour and Hashim [26], and Bolouki et al. [11], who emphasized the effectiveness of ASTER in detecting sericite-rich phyllic alteration zones. Furthermore, by integrating Crosta and FCC techniques, the study refines the delineation of mineralized zones and bridges existing methodological gaps in remote sensing-based exploration in the study area. This research fills a significant knowledge gap by applying an integrated suite of remote sensing techniques to a geologically complex region that has seen limited exploration to date. While conventional methods have struggled to characterize the porphyry copper systems of the Aktogay deposit in eastern Kazakhstan, the combined use of ASTER and Landsat-8 data with image processing techniques enabled detailed mapping of hydrothermal alteration. These results confirm the utility of remote sensing for mineral exploration in regions with complex geology and limited geological mapping and provide a scalable approach for other developing countries around the world.
The strengths of the study lie in its comprehensive methodological framework, which combined several remote sensing techniques to verify and improve the accuracy of alteration zone detection. The superior spectral resolution of ASTER enabled precise mapping of alteration minerals, while the integration of field data allowed for robust validation of the remote sensing results. However, the study was constrained by the limited spatial resolution of the datasets and the lack of hyperspectral data that would allow finer discrimination of mineralogical variations. In addition, the focus on surface spectral features may have led to subsurface mineralization being overlooked, necessitating integration with geophysical methods for comprehensive exploration. Overall, this study demonstrates the effectiveness of ASTER and Landsat-8 data in mapping hydrothermal alteration zones associated with porphyry copper mineralization. The results emphasize the value of remote sensing as a rapid, cost-effective tool for early-stage mineral exploration, particularly in developing countries around the world. Future research should focus on the use of higher-resolution hyperspectral data, advanced analytical techniques and the integration of geophysical and geochemical datasets to refine mineral exploration strategies and develop comprehensive geological models of the Aktogay deposit.

6. Conclusions

In this study, several image processing techniques were applied to Landsat-8 and ASTER data to map the hydrothermal alteration zones associated with the Aktogay porphyry copper deposit in eastern Kazakhstan. Analysis of the BRs has effectively delineated zones indicative of propylitic and argillic hydrothermal alteration and oxidation zones characterized by clay, chlorite minerals and iron oxides, respectively, commonly associated with porphyry copper systems. FCC images facilitated the visual interpretation of various spectral signatures associated with hydrothermal alteration, such as propylitic, argillic and iron oxides, as well as vegetation and water features. ASTER BR results were able to effectively recognize the spatial distribution of potassic, propylitic and argillic alteration zones trending north–south in the northwest of the Koldar Massif. The PCA method extracted latent information from Landsat-8 data and created a composite image (PC3-PC4-PC2) that effectively distinguished different geological units and their associated minerals. The Crosta method using ASTER data also showed promising results in detecting propylitic and argillic alteration zones in the study area.
This study demonstrates the utility of Landsat-8 and ASTER data for efficient mapping and preliminary evaluation of porphyry copper deposits in developing countries around the world. The delineated anomalous zones represent prospective targets for detailed exploration. The dataset generated will also serve as the basis for the creation of a regional geological map. The practical implications of these results are significant, as they can guide future exploration efforts, optimize resource distribution and accelerate the development of the region’s mineral potential as well as those of other developing countries. Future research should focus on the following: (1) utilizing hyperspectral data with higher spatial and spectral resolutions to enable more precise mapping of minerals and geological structures; (2) employing advanced analytical techniques, such as spectral unmixing and machine learning, to improve the accuracy of mineral identification and abundance estimation; (3) conducting integrated geophysical and geochemical surveys to confirm the remote sensing results and assess the mineral potential of the deposit; and (4) integrating remote sensing data with field and drilling observations to create a comprehensive geological model of the deposit.

Author Contributions

Conceptualization, H.A. and E.O.; methodology, H.A., E.O. and B.A.; software, B.A., E.S. and D.T.; validation, H.A. and E.O.; formal analysis, H.A. A.I. and B.A.; investigation, H.A., E.O. and A.B. (Alma Bekbotayeva); resources, A.B. (Aigerim Bermukhanova), T.A. A.I. and E.S.; data curation, H.A., A.B.P. and E.O.; writing—original draft preparation, H.A., A.B.P., E.O. and B.A.; writing—review and editing, H.A. and A.B.P.; visualization, B.A., A.B. (Aigerim Bermukhanova) and A.B. (Alma Bekbotayeva); supervision, H.A. and E.O.; project administration, E.O.; funding acquisition, E.O. All authors have read and agreed to the published version of the manuscript.

Funding

The research was funded by the Committee of Science of the Ministry of Science and Higher Education of the Republic of Kazakhstan (Grant No. BR21882179).

Data Availability Statement

All data associated with the results are presented in the paper.

Acknowledgments

The authors express their gratitude to the Kaz Minerals Company for supplying the spectral signature reference points of the associated minerals, which were crucial for the verification of this study.

Conflicts of Interest

The authors declare no conflicts of interest.

References

  1. Smirnova, I.O.; Kirsanov, A.A.; Kamyshnikova, N.V. A review of the past 5 years of international advances in multi- and hyperspectral satellite data application and processing techniques in geological research. Sovrem. Probl. Distantsionnogo Zo. Zemli Iz Kosmosa 2020, 17, 9–27. [Google Scholar] [CrossRef]
  2. Ahmadi, H.; Uygucgil, H. Targeting iron prospective within the Kabul Block (SE Afghanistan) via hydrothermal alteration mapping using remote sensing techniques. Arab. J. Geosci. 2021, 14, 183. [Google Scholar] [CrossRef]
  3. Akhmetov, R.; Makhmetova, G.; Orynbassarova, E.; Baltiyeva, A.; Togaibekov, A.; Roberts, K.; Yerzhankyzy, A. The Study of Kinematic Gnss Surveying for Bim Georeferencing. Int. Arch. Photogramm. Remote Sens. Spat. Inf. Sci. 2022, XLVI-5/W1-, 7–14. [Google Scholar] [CrossRef]
  4. Mohebi, A.; Mirnejad, H.; Lentz, D.; Behzadi, M.; Dolati, A.; Kani, A.; Taghizadeh, H. Controls on porphyry Cu mineralization around Hanza Mountain, south-east of Iran: An analysis of structural evolution from remote sensing, geophysical, geochemical and geological data. Ore Geol. Rev. 2015, 69, 187–198. [Google Scholar] [CrossRef]
  5. Zhang, T.; Yi, G.; Li, H.; Wang, Z.; Tang, J.; Zhong, K.; Li, Y.; Wang, Q.; Bie, X. Integrating Data of ASTER and Landsat-8 OLI (AO) for Hydrothermal Alteration Mineral Mapping in Duolong Porphyry Cu-Au Deposit, Tibetan Plateau, China. Remote Sens. 2016, 8, 890. [Google Scholar] [CrossRef]
  6. Pour, A.B.; Hashim, M.; Hong, J.K.; Park, Y. Lithological and alteration mineral mapping in poorly exposed lithologies using Landsat-8 and ASTER satellite data: North-eastern Graham Land, Antarctic Peninsula. Ore Geol. Rev. 2019, 108, 112–133. [Google Scholar] [CrossRef]
  7. Rajendran, S.; Majed Said AL-Dhuhli, A.; Hazaa Saif Al-Ali, H. Discrimination of copper mineralized zone of part of sultanate of Oman using remote sensing technique. In Proceedings of the 12th EAGE International Conference on Geoinformatics-Theoretical and Applied Aspects, Kiev, Ukraine, 13–16 May 2013. [Google Scholar]
  8. Shebl, A.; Abdellatif, M.; Elkhateeb, S.O.; Csámer, Á. Multisource Data Analysis for Gold Potentiality Mapping of Atalla Area and Its Environs, Central Eastern Desert, Egypt. Minerals 2021, 11, 641. [Google Scholar] [CrossRef]
  9. Eldosouky, A.M.; Abdelkareem, M.; Elkhateeb, S.O. Integration of remote sensing and aeromagnetic data for mapping structural features and hydrothermal alteration zones in Wadi Allaqi area, South Eastern Desert of Egypt. J. Afr. Earth Sci. 2017, 130, 28–37. [Google Scholar] [CrossRef]
  10. Alimohammadi, M.; Alirezaei, S.; Kontak, D.J. Application of ASTER data for exploration of porphyry copper deposits: A case study of Daraloo–Sarmeshk area, southern part of the Kerman copper belt, Iran. Ore Geol. Rev. 2015, 70, 290–304. [Google Scholar] [CrossRef]
  11. Bolouki, S.M.; Ramazi, H.R.; Maghsoudi, A.; Pour, A.B.; Sohrabi, G. A remote sensing-based application of bayesian networks for epithermal gold potential mapping in Ahar-Arasbaran area, NW Iran. Remote Sens. 2020, 12, 105. [Google Scholar] [CrossRef]
  12. Ranjbar, H.; Honarmand, M.; Moezifar, Z. Application of the Crosta technique for porphyry copper alteration mapping, using ETM+ data in the southern part of the Iranian volcanic sedimentary belt. J. Asian Earth Sci. 2004, 24, 237–243. [Google Scholar] [CrossRef]
  13. Orynbassarova, E.O.; Adebiyet, B.; Iliuf, F.A.; Sydyk, N.K. Analysis of mineral indices from remote sensing: A case-study of the Tokrau river. Eurasian Min. 2024, 1, 71–76. [Google Scholar] [CrossRef]
  14. Rahmani, N.R.; Ahmadi, H.; Rahimy, F.; Yousufi, A. Automated detection of granitic complexes in NW Parwan, NE Afghanistan using Sentinel-2B/MSI and ASTER data. Discov. Geosci. 2024, 2, 86. [Google Scholar] [CrossRef]
  15. Yazdi, Z.; Jafari Rad, A.; Aghazadeh, M.; Afzal, P. Alteration Mapping for Porphyry Copper Exploration Using ASTER and QuickBird Multispectral Images, Sonajeel Prospect, NW Iran. J. Indian Soc. Remote Sens. 2018, 46, 1581–1593. [Google Scholar] [CrossRef]
  16. Windley, B.F.; Xiao, W. Ridge subduction and slab windows in the Central Asian Orogenic Belt: Tectonic implications for the evolution of an accretionary orogen. Gondwana Res. 2018, 61, 73–87. [Google Scholar] [CrossRef]
  17. Xu, X.-W.; Li, H.; Peters, S.G.; Qin, K.-Z.; Mao, Q.; Wu, Q.; Hong, T.; Wu, C.; Liang, G.-L.; Zhang, Z.-F.; et al. Cu-rich porphyry magmas produced by fractional crystallization of oxidized fertile basaltic magmas (Sangnan, East Junggar, PR China). Ore Geol. Rev. 2017, 91, 296–315. [Google Scholar] [CrossRef]
  18. Fu, Y.; Cheng, Q.; Jing, L.; Ye, B.; Fu, H. Mineral Prospectivity Mapping of Porphyry Copper Deposits Based on Remote Sensing Imagery and Geochemical Data in the Duolong Ore District, Tibet. Remote Sens. 2023, 15, 439. [Google Scholar] [CrossRef]
  19. Liu, C.; Qiu, C.; Wang, L.; Feng, J.; Wu, S.; Wang, Y. Application of ASTER Remote Sensing Data to Porphyry Copper Exploration in the Gondwana Region. Minerals 2023, 13, 501. [Google Scholar] [CrossRef]
  20. Chouhan, A.K.; Singh, D.; Pal, S.K.; Choudhury, P. Delineation of subsurface geological fractures in the Cambay rift and surrounding regions of NW India: An integrated approach using satellite derived EIGEN-6C4 gravity data. Geocarto Int. 2022, 37, 268–283. [Google Scholar] [CrossRef]
  21. Chen, Y.; Wang, Y.; Zhang, F.; Dong, Y.; Song, Z.; Liu, G. Remote Sensing for Lithology Mapping in Vegetation-Covered Regions: Methods, Challenges, and Opportunities. Minerals 2023, 13, 1153. [Google Scholar] [CrossRef]
  22. Wang, Z.; Zuo, R.; Jing, L. Fusion of Geochemical and Remote-Sensing Data for Lithological Mapping Using Random Forest Metric Learning. Math. Geosci. 2021, 53, 1125–1145. [Google Scholar] [CrossRef]
  23. Khalifa, I.H.; Hegazi, A.M.; Faisal, M. Geological setting for porphyry copper deposits in calc-alkaline rocks: Wadi Rofaiyed area, Sinai, Egypt. Arab. J. Geosci. 2016, 9, 336. [Google Scholar] [CrossRef]
  24. Deshpande, S.; Subeesh, A.; Saini, A. Analysis of Most Significant Bands and Band Ratios for Discrimination of Hydrothermal Alteration Minerals. In Proceedings of the 2019 10th Workshop on Hyperspectral Imaging and Signal Processing: Evolution in Remote Sensing (WHISPERS), Amsterdam, The Netherlands, 24–26 September 2019; pp. 1–5. [Google Scholar]
  25. Khosravi, V.; Shirazi, A.; Shirazy, A.; Hezarkhani, A.; Pour, A.B. Hybrid Fuzzy-Analytic Hierarchy Process (AHP) Model for Porphyry Copper Prospecting in Simorgh Area, Eastern Lut Block of Iran. Mining 2021, 2, 1–12. [Google Scholar] [CrossRef]
  26. Pour, A.B.; Hashim, M. Hydrothermal alteration mapping from Landsat-8 data, Sar Cheshmeh copper mining district, south-eastern Islamic Republic of Iran. J. Taibah Univ. Sci. 2015, 9, 155–166. [Google Scholar] [CrossRef]
  27. Son, Y.-S.; Kim, K.-E.; Yoon, W.-J.; Cho, S.-J. Regional mineral mapping of island arc terranes in southeastern Mongolia using multi-spectral remote sensing data. Ore Geol. Rev. 2019, 113, 103106. [Google Scholar] [CrossRef]
  28. Traore, M.; Takodjou Wambo, J.D.; Ndepete, C.P.; Tekin, S.; Pour, A.B.; Muslim, A.M. Lithological and alteration mineral mapping for alluvial gold exploration in the south east of Birao area, Central African Republic using Landsat-8 Operational Land Imager (OLI) data. J. Afr. Earth Sci. 2020, 170, 103933. [Google Scholar] [CrossRef]
  29. Mahboob, M.A.; Genc, B.; Celik, T.; Ali, S.; Atif, I. Mapping hydrothermal minerals using remotely sensed reflectance spectroscopy data from Landsat. J. South. Afr. Inst. Min. Metall. 2019, 119, 279–289. [Google Scholar] [CrossRef]
  30. Baibatsha, A.; Arshamov, Y.; Bekbotayeva, A.; Baratov, R. Geology of the main industrial types of copper ore deposits in Kazakhstan. In Proceedings of the International Multidisciplinary Scientific GeoConference, Albena, Bulgaria, 29 June–5 July 2017; SGEM: Varna, Bulgaria, 2017; pp. 231–237. [Google Scholar]
  31. ZH, D.; HE, Z.; LI, M.; ZH, H.; GA, Y. Analysis of Kazakhstan’s Copper Resources, Development Situation and Investment Potential. Northwest. Geol. 2023, 56, 157–165. [Google Scholar]
  32. Dyachkov, B.; Mizernaya, M.; Kuzmina, O.; Zimanovskaya, N.; Oitseva, T. Tectonics and Metallogeny of East Kazakhstan. In Tectonics–Problems of Regional Settings; InTech: Houston, TX, USA, 2018. [Google Scholar]
  33. Hedenquist, J.W.; Harris, M.; Camus, F. Geology and Genesis of Major Copper Deposits and Districts of the World—A Tribute to Richard H. Sillitoe; Society of Economic Geologists: Littleton, CO, USA, 2012; ISBN 978-1-6294-9041-0. [Google Scholar]
  34. Vikentyev, I.V.; Shatov, V.V.; Smirnov, D.I.; Volchkov, A.G. The Yubileinoe Porphyry Gold–Copper Deposit (Western Kazakhstan): Geological Position and Conditions of Formation. Geol. Ore Depos. 2023, 65, S6–S41. [Google Scholar] [CrossRef]
  35. Zhu, Y.; An, F.; Feng, W.; Zhang, H. Geological evolution and huge ore-forming belts in the core part of the Central Asian metallogenic region. J. Earth Sci. 2016, 27, 491–506. [Google Scholar] [CrossRef]
  36. Box, S.E.; Syusyura, B.; Seltmann, R.; Creaser, R.A.; Dolgopolova, A.; Zientek, M.L. Dzhezkazgan and Associated Sandstone Copper Deposits of the Chu-Sarysu Basin, Central Kazakhstan. In Geology and Genesis of Major Copper Deposits and Districts of the World—A Tribute to Richard H. Sillitoe; Society of Economic Geologists: Littleton, CO, USA, 2012. [Google Scholar]
  37. Yakubchuk, A.; Degtyarev, K.; Maslennikov, V.; Wurst, A.; Stekhin, A.; Lobanov, K. Tectonomagmatic Settings, Architecture, and Metallogeny of the Central Asian Copper Province. In Geology and Genesis of Major Copper Deposits and Districts of the World—A Tribute to Richard H. Sillitoe; Society of Economic Geologists: Littleton, CO, USA, 2012. [Google Scholar]
  38. Li, G.; Qin, K.; Li, Z. Geological features and tectonic setting of porphyry copper deposits rounding the Balkhash region, Central Kazakhstan, Central Asia. Acta Petrol. Sin. 2008, 24, 2679–2700. [Google Scholar]
  39. Kakavand, M.; Bonyadi, Z. Evaluation of alteration zones around Parmagasu copper indication, Kuh Zar, Damghan, Iran, using ASTER satellite data. Geocarto Int. 2022, 37, 16827–16845. [Google Scholar] [CrossRef]
  40. Hosseini, S.; Gholamzadeh, M.; Pour, A.B.; Ahmadirouhani, R.; Sekandari, M.; Bagheri, M. Multi-Sensor Satellite Remote-Sensing Data for Exploring Carbonate-Hosted Pb-Zn Mineralization: Akhlamad Area, Razavi Khorasan, North East Iran. Mining 2024, 4, 367–388. [Google Scholar] [CrossRef]
  41. Rowan, L.C.; Hook, S.J.; Abrams, M.J.; Mars, J.C. Mapping hydrothermally altered rocks at Cuprite, Nevada, using the Advanced Spaceborne Thermal Emission and Reflection Radiometer (ASTER), a new satellite-imaging system. Econ. Geol. 2003, 98, 1019–1027. [Google Scholar] [CrossRef]
  42. Mars, J. Regional mapping of phyllic- and argillic-altered rocks in the Zagros magmatic arc, Iran, using Advanced Spaceborne Thermal Emission and Reflection Radiometer (ASTER) data and logical operator algorithms. Geosphere 2006, 2, 161. [Google Scholar] [CrossRef]
  43. Pour, A.B.; Hashim, M. The application of ASTER remote sensing data to porphyry copper and epithermal gold deposits. Ore Geol. Rev. 2012, 44, 1–9. [Google Scholar] [CrossRef]
  44. Rowan, L.C.; Mars, J.C. Lithologic mapping in the Mountain Pass, California area using Advanced Spaceborne Thermal Emission and Reflection Radiometer (ASTER) data. Remote Sens. Environ. 2003, 84, 350–366. [Google Scholar] [CrossRef]
  45. Mars, J.L. Hydrothermal Alteration Maps of the Central and Southern Basin and Range Province of the United States Compiled from Advanced Spaceborne Thermal Emission and Reflection Radiometer (ASTER) Data; No. 2013-1139; US Geological Survey: Reston, VA, USA, 2013.
  46. Muratkhanov, D.; Bulegenov, K.; Shakirova, G.; Kembayev, M. About the new porphyry copper mineralization object in the Eastern Balkhash region (Kazakhstan). In Proceedings of the International Multidisciplinary Scientific GeoConference, Albena, Bulgaria, 29 June–8 July 2024. [Google Scholar]
  47. Li, C.; Shen, P.; Pan, H. Mineralogy of the Aktogai giant porphyry Cu deposit in Kazakhstan: Insights into the fluid composition and oxygen fugacity evolution. Ore Geol. Rev. 2018, 95, 899–916. [Google Scholar] [CrossRef]
  48. Bar, N.; Teleu, N.; Zlobin, H.; Mohr, P.; McQuillan, A. Rock slope design and residual risk management for Aktogay Copper Mine, Kazakhstan. In Proceedings of the ISRM Congress, Salzburg, Austria, 9–14 October 2023. [Google Scholar]
  49. Zvezdov, V.S.; Migachev, I.F.; Girfanov, M.M. Porphyry copper deposits of the CIS and the models of their formation. Ore Geol. Rev. 1993, 7, 511–549. [Google Scholar] [CrossRef]
  50. Li, C.; Shen, P.; Pan, H.; Cao, C.; Seitmuratova, E. Geology and ore-forming fluid evolution of the Aktogai giant porphyry Cu deposit, Kazakhstan. J. Asian Earth Sci. 2018, 165, 192–209. [Google Scholar] [CrossRef]
  51. Chen, X.; Seitmuratova, E.; Wang, Z.; Chen, Z.; Han, S.; Li, Y.; Yang, Y.; Ye, B.; Shi, W. SHRIMP U–Pb and Ar–Ar geochronology of major porphyry and skarn Cu deposits in the Balkhash Metallogenic Belt, Central Asia, and geological implications. J. Asian Earth Sci. 2014, 79, 723–740. [Google Scholar] [CrossRef]
  52. Cao, M.; Li, G.; Qin, K.; Seitmuratova, E.Y.; Liu, Y. Major and Trace Element Characteristics of Apatites in Granitoids from Central Kazakhstan: Implications for Petrogenesis and Mineralization. Resour. Geol. 2012, 62, 63–83. [Google Scholar] [CrossRef]
  53. Shen, P.; Pan, H.; Hattori, K.; Cooke, D.R.; Seitmuratova, E. Large Paleozoic and Mesozoic porphyry deposits in the Central Asian Orogenic Belt: Geodynamic settings, magmatic sources, and genetic models. Gondwana Res. 2018, 58, 161–194. [Google Scholar] [CrossRef]
  54. Cao, M.-J.; Li, G.-M.; Qin, K.-Z.; Evans, N.J.; Seitmuratova, E.Y. Assessing the magmatic affinity and petrogenesis of granitoids at the giant Aktogai porphyry Cu deposit, Central Kazakhstan. Am. J. Sci. 2016, 316, 614–668. [Google Scholar] [CrossRef]
  55. Li, C.; Shen, P.; Zhao, Y.; Li, P.; Zhang, L.; Pan, H. Mineral chemistry of chlorite in different geologic environments and its implications for porphyry Cu ± Au ± Mo deposits. Ore Geol. Rev. 2022, 149, 105112. [Google Scholar] [CrossRef]
  56. Ridwan, M.A.; Radzi, N.A.M.; Ahmad, W.S.H.M.W.; Mustafa, I.S.; Din, N.M.; Jalil, Y.E.; Isa, A.M.; Othman, N.S.; Zaki, W.M.D.W. Applications of Landsat-8 Data: A Survey. Int. J. Eng. Technol. 2018, 7, 436. [Google Scholar] [CrossRef]
  57. Irons, J.R.; Dwyer, J.L.; Barsi, J.A. The next Landsat satellite: The Landsat Data Continuity Mission. Remote Sens. Environ. 2012, 122, 11–21. [Google Scholar] [CrossRef]
  58. Roy, D.; Wulder, M.; Loveland, T.R. Landsat-8: Science and Product Vision for Terrestrial Global Change Research Remote Sensing of Environment Landsat-8: Science and product vision for terrestrial global change research. Remote Sens. Environ. 2014, 145, 154–172. [Google Scholar] [CrossRef]
  59. Ahmadi, H.; Hussaini, M.R.; Yousufi, A.; Bekbotayeva, A.; Baisalova, A.; Amralinova, B.; Mataibayeva, I.; Rahmani, A.B.; Pekkan, E.; Sahak, N. Geospatial Insights into Ophiolitic Complexes in the Cimmerian Realm of the Afghan Central Block (Middle Afghanistan). Minerals 2023, 13, 1453. [Google Scholar] [CrossRef]
  60. Ahmadi, H.; Pekkan, E.; Seyitoğlu, G. Automatic lineaments detection using radar and optical data with an emphasis on geologic and tectonic implications: A case study of Kabul Block, eastern Afghanistan. Geocarto Int. 2023, 38, 2231400. [Google Scholar] [CrossRef]
  61. NASA ASTER|Terra. Available online: https://terra.nasa.gov/about/terra-instruments/aster (accessed on 7 April 2022).
  62. Ahmadi, H.; Pekkan, E. Fault-Based Geological Lineaments Extraction Using Remote Sensing and GIS—A Review. Geosciences 2021, 11, 183. [Google Scholar] [CrossRef]
  63. Ourhzif, Z.; Algouti, A.; Algouti, A.; Hadach, F. Lithological mapping using landsat 8 oli and aster multispectral data in imini-ounilla district south high atlas of marrakech. Int. Arch. Photogramm. Remote Sens. Spat. Inf. Sci. 2019, 42, 1255–1262. [Google Scholar] [CrossRef]
  64. Habashi, J.; Mohammady Oskouei, M.; Jamshid Moghadam, H.; Beiranvand Pour, A. Optimizing alteration mineral detection: A fusion of multispectral and hyperspectral remote sensing techniques in the Sar-e-Chah-e Shur, Iran. Remote Sens. Appl. Soc. Environ. 2024, 35, 101249. [Google Scholar] [CrossRef]
  65. Kamal El-Din, G.M.; El-Noby, E.; Abdelkareem, M.; Hamimi, Z. Using multispectral and radar remote sensing data for geological investigation, Qena-Safaga Shear Zone, Eastern Desert, Egypt. Arab. J. Geosci. 2021, 14, 997. [Google Scholar] [CrossRef]
  66. Habibnia, A.; Rahimipour, G.R.; Ranjbar, H. Anomaly delineation of porphyry copper deposits of Hanza Region through geochemical data analyses and multispectral remote sensing. J. Min. Environ. 2019, 10, 747–762. [Google Scholar] [CrossRef]
  67. Neal, L.C.; Wilkinson, J.J.; Mason, P.J.; Chang, Z. Spectral characteristics of propylitic alteration minerals as a vectoring tool for porphyry copper deposits. J. Geochem. Explor. 2018, 184, 179–198. [Google Scholar] [CrossRef]
  68. Shirazi, A.; Shirazy, A.; Karami, J. Remote sensing to identify copper alterations and promising regions, Sarbishe, South Khorasan, Iran. Int. J. Geol. Earth Sci. 2018, 4, 36–52. [Google Scholar]
  69. Rezaei, A.; Hassani, H.; Moarefvand, P.; Golmohammadi, A. Lithological mapping in Sangan region in Northeast Iran using ASTER satellite data and image processing methods. Geol. Ecol. Landsc. 2020, 4, 59–70. [Google Scholar] [CrossRef]
  70. Yao, F.; Xu, X.; Yang, J.; Geng, X. A Remote-Sensing-Based Alteration Zonation Model of the Duolong Porphyry Copper Ore District, Tibet. Remote Sens. 2021, 13, 5073. [Google Scholar] [CrossRef]
  71. Meerdink, S.K.; Hook, S.J.; Roberts, D.A.; Abbott, E.A. The ECOSTRESS spectral library version 1.0. Remote Sens. Environ. 2019, 230, 111196. [Google Scholar] [CrossRef]
  72. Clark, R.N. Spectroscopy of rocks and minerals, and principles of spectrocopy. In Spectroscopy of Rocks and Minerals and Principles of Spectroscopy; Wiley: Hoboken, NJ, USA, 1999. [Google Scholar]
  73. Yao, F.; Liu, S.; Wang, D.; Geng, X.; Wang, C.; Jiang, N.; Wang, Y. Review on the development of multi- and hyperspectral remote sensing technology for exploration of copper–gold deposits. Ore Geol. Rev. 2023, 162, 105732. [Google Scholar] [CrossRef]
  74. Sillitoe, R.H. Porphyry Copper Systems. Econ. Geol. 2010, 105, 3–41. [Google Scholar] [CrossRef]
  75. Proffett, J.M. Geology of the Bajo de la Alumbrera Porphyry Copper-Gold Deposit, Argentina. Econ. Geol. 2003, 98, 1535–1574. [Google Scholar] [CrossRef]
  76. Sheikhrahimi, A.; Pour, A.B.; Pradhan, B.; Zoheir, B. Mapping hydrothermal alteration zones and lineaments associated with orogenic gold mineralization using ASTER data: A case study from the Sanandaj-Sirjan Zone, Iran. Adv. Sp. Res. 2019, 63, 3315–3332. [Google Scholar] [CrossRef]
  77. Forson, E.D.; Menyeh, A.; Wemegah, D.D. Mapping lithological units, structural lineaments and alteration zones in the Southern Kibi-Winneba belt of Ghana using integrated geophysical and remote sensing datasets. Ore Geol. Rev. 2021, 137, 104271. [Google Scholar] [CrossRef]
  78. Joseph, W. Automated spectral analysis: A geological example using AVIRIS data, north Grapevine Mountains, Nevada. In Proceedings of the Proc. Tenth Thematic Conference on Geologic Remote Sensing, Environmental Research Institute of Michigan, San Antonio, TX, USA, 9–12 May 1994; pp. 1407–1418. [Google Scholar]
  79. Estornell, J.; Martí-Gavilá, J.M.; Sebastiá, M.T.; Mengual, J. Principal component analysis applied to remote sensing. Model. Sci. Educ. Learn. 2013, 6, 83–89. [Google Scholar] [CrossRef]
  80. Farahbakhsh, E.; Shirmard, H.; Bahroudi, A.; Eslamkish, T. Fusing ASTER and QuickBird-2 Satellite Data for Detailed Investigation of Porphyry Copper Deposits Using PCA.; Case Study of Naysian Deposit, Iran. J. Indian Soc. Remote Sens. 2015, 44, 525–537. [Google Scholar] [CrossRef]
  81. Shirazi, A.; Hezarkhani, A.; Pour, A.B. Fusion of Lineament Factor (LF) Map Analysis and Multifractal Technique for Massive Sulfide Copper Exploration: The Sahlabad Area, East Iran. Minerals 2022, 12, 549. [Google Scholar] [CrossRef]
  82. Crosta, A.P.; Moore, J.M. Enhancement of Landsat thematic mapper imagery for residual soil mapping in SW Minas Gerais state Brazil: A prospecting case history in Greenstone belt terrain. In Proceedings of the 7th ERIM Thematic Conference on Remote Sensing for Exploration Geology, Calgary, AB, Canada, 2–6 October 1989; pp. 1173–1187. [Google Scholar]
  83. Yetkin, E. Alteration Mapping by Remote Sensing: Application to Hasandağ—Melendiz Volcanic Complex. Master’s Thesis, Middle East Technical University, Ankara, Türkiye, 2003. [Google Scholar]
  84. Ali, A.; Pour, A. Lithological mapping and hydrothermal alteration using Landsat 8 data: A case study in ariab mining district, red sea hills, Sudan. Int. J. Basic Appl. Sci. 2014, 3, 199–208. [Google Scholar] [CrossRef]
  85. Guha, S.; Govil, H.; Tripathi, M.; Besoya, M. Evaluating crosta technique for alteration mineral mapping in Malanjkhand Copper Mines, India. Int. Arch. Photogramm. Remote Sens. Spat. Inf. Sci. 2018, 42, 251–254. [Google Scholar] [CrossRef]
  86. Babaei, M.; Abedi, M.; Norouzi Baghkameh, G.H.; Kazem Alilou, S. Geostatistical modeling of electrical resistivity tomography for imaging porphyry Cu mineralization in Takht-e-Gonbad deposit, Iran. J. Min. Environ. 2020, 11, 143–159. [Google Scholar] [CrossRef]
  87. Pour, A.B.; Hashim, M. Identification of hydrothermal alteration minerals for exploring of porphyry copper deposit using ASTER data, SE Iran. J. Asian Earth Sci. 2011, 42, 1309–1323. [Google Scholar] [CrossRef]
  88. Hunt, G.R. Spectral Signatures of Particulate Minerals in the Visible and Near Infrared. Geophysics 1977, 42, 501–513. [Google Scholar] [CrossRef]
Figure 2. An overview of the methodological flowchart used in this study to map alteration minerals and zones in the Aktogay porphyry copper deposit.
Minerals 15 00277 g002
Figure 4. Landsat-8 FCC of 7, 5 and 2 for the study area.
Minerals 15 00277 g004
Figure 5. ASTER FCC of 4, 6 and 8 for the study area.
Minerals 15 00277 g005
Figure 6. Distribution of clay minerals and iron oxides in the study area detected by Landsat-8 band ratios (a) B6/B7 (SWIR1/SWIR2) and (b) B4/B2 (red/blue).
Minerals 15 00277 g006
Figure 7. Thresholded pixels of ASTER (B11 × B11)/B10/B14 and B14/B12 showing the spatial distribution of potassic hydrothermal alteration zones in the study area.
Minerals 15 00277 g007
Figure 8. Thresholded pixels of ASTER B5/B8, (B6 + B7)/(2 × B8) and (B6 + B9)/(B7 + B8) showing the spatial distribution of propylitic hydrothermal alteration minerals.
Minerals 15 00277 g008
Figure 9. Thresholded pixels of ASTER B4/B6 and (B7 + B5)/(B6 + B9) showing the distribution of argillic hydrothermal alteration zones represented by kaolinite and illite–montmorillonite.
Minerals 15 00277 g009
Figure 10. RGB color combination of PC3, PC4 and PC2 derived from Landsat-8 PCA.
Minerals 15 00277 g010
Figure 11. Distribution of alteration zones detected by PC4 Crosta method on ASTER selected bands: (a) propylitic alteration zones and (b) argillic alteration zones.
Minerals 15 00277 g011
Figure 12. Distribution of lineament density extracted from DEM using the LINE algorithm in PCI Geomatica over the study area.
Minerals 15 00277 g012
Figure 13. Spatial distribution of potassic and propylitic and argillic alteration zones and locations of field sampling in the study area.
Minerals 15 00277 g013
Figure 14. Specimens and thin sections of the collected samples under a 20× polarized microscope: (a) sample photo of hornblende granodiorite; (b) distribution of calcite in a plagioclase–orthoclase–quartz matrix under crossed Nicols; (c) sample photo of dacitic tuff; (d) alteration of feldspars under crossed Nicols; (e) sample photo of granodiorite; (f) politicization process on orthoclase and sericitization alteration on plagioclase.
Minerals 15 00277 g014
Table 1. Characteristics of the acquired Landsat-8 and ASTER level 1 T data.
DataScene IDLongitudeLatitudeAcquisition Date
Landsat-8LC81480272016236LGN0178.9868748.5033126 August 2016
82.1834948.51483
79.0672646.35314
82.1362046.36383
ASTERASTL1A 040814054309040828011679.2663347.2523914 August 2004
80.4116347.26399
80.4192446.56428
79.2887446.55295
Table 2. Eigenvalues of the principal components.
Principal ComponentsEigenvaluesPercentages
PC10.04394183.64%
PC20.00678912.92%
PC30.0009541.82%
PC40.0002000.38%
PC50.0000420.08%
PC60.0000130.02%
PC70.0000020.00%
Table 3. Eigenvectors and relevant bands of Landsat-8 and selected bands of ASTER for Crosta methods.
PCBand 1Band 2Band 3Band 4Band 5Band 6Band 7
PC10.45860−0.08737−0.221470.525920.245050.330010.53614
PC20.48096−0.06849−0.215230.334490.05075−0.17079−0.75765
PC30.46735−0.00996−0.11856−0.24701−0.30195−0.697310.35917
PC40.471400.06295−0.10654−0.64112−0.135180.56906−0.09656
PC50.338600.295700.864590.054240.21370−0.04112−0.00986
PC6−0.036220.70358−0.086740.30997−0.617040.138960.00224
PC7−0.042070.63337−0.35239−0.201100.63365−0.175640.00940
Crosta Method—Propylitic Alteration (ASTER Selected Bands)
EigenvectorsBand 1Band 4Band 5Band 8
PC10.22960.96557−0.117530.03384
PC20.61042−0.045930.78264−0.11291
PC30.54365−0.19536−0.327630.74762
PC40.52831−0.16553−0.51605−0.65359
Crosta Method—Argillic Alteration (ASTER Selected Bands)
EigenvectorsBand 1Band 4Band 6Band 7
PC10.218810.96706−0.123050.04201
PC20.60035−0.032990.79854−0.02855
PC30.55102−0.20586−0.397590.70422
PC40.53673−0.14601−0.43486−0.70817
Table 4. GPS reference points obtained from hydrothermal alteration zones within the Akogay copper deposit during fieldwork.
Sample No.Sample NameLongitudeLatitudeMatch
1A01-000279.9841377546.96808036Yes
2A02-000279.9842302746.9645183No
3A03-000279.9825822946.96952351Yes
4A04-000279.9817619546.96982209Yes
5A05-000279.9816385146.96798282No
6A06-000279.9817220546.96629864No
7A08a-000279.9810870746.97007974Yes
8A09-0000179.9796926546.96454635Yes
9A11-000279.9794941546.96813403Yes
10A18-000279.9739309446.96727211Yes
11A38-000279.9765416546.97003219Yes
12A42-000279.9686630546.96725641No
13A43-000279.9765811746.96446093Yes
14A44-000079.976593446.96810627Yes
15A50-000279.9818161746.96465587No
16A52-000279.9844139346.97189439No
17A55-000279.9752470646.96741214Yes
18GT11-000279.9817623746.96298508No
19GT12-000279.9770028246.96997452Yes
20GT13-000279.9794538246.97196615Yes
21GT14-000279.9826451846.97139292Yes
22GT16-000279.9871319146.96765388Yes
23GT17-000279.9881685146.96627232No
24GT18-000279.9830094946.96958956Yes
25GT19-000279.9868792646.96276154Yes
26GT20-000279.9861698646.96426407Yes
27GT21-000279.9775111246.97139257Yes
28GT29-000279.9683364146.97040541Yes
29GT31-000279.9646875146.96793391Yes
30KMC_00179.9833326146.965661Yes
31KMC_02179.987034246.96507951No
32KMC_03379.986631346.96618371Yes
33KMC_04079.9863193446.96675788Yes
34KMK-01-000279.9801335746.96792155Yes
35KMK-02-000279.9850293346.967517Yes
36KMK-03-000279.9854412346.96442913Yes
37KMK-04-000279.9886247846.96536918Yes
38KMK-05-000279.969604646.96639923No
39KMK-06-000279.9800551346.96674055No
40KMK-08-000279.9782743346.96535971No
41KMK-09-000279.984470146.96365855No
42KMK-11-000279.9887517846.96423172Yes
43KMK-12-000279.9848737446.96261116Yes
44KMK-13-000279.9716172346.96392302Yes
45KMK-14-000279.9741836346.97219178Yes
Total number of matched samples32
Total number of unmatched samples13
Overall Accuracy71.1%
Kappa Coefficient0.615
Disclaimer/Publisher’s Note: The statements, opinions and data contained in all publications are solely those of the individual author(s) and contributor(s) and not of MDPI and/or the editor(s). MDPI and/or the editor(s) disclaim responsibility for any injury to people or property resulting from any ideas, methods, instructions or products referred to in the content.

