Correlational Associations Between Ambient and Household Particulate Matter Exposure and Body Mass Index Across Childhood and Adolescence in Thailand


Abstract
1. Introduction
2. Materials and Methods
2.1. Data Used
2.2. Description of Cross-Correlation
2.3. Description of Spearman Correlation
2.4. Mixed-Effects Model
2.5. Ethical Considerations
3. Results
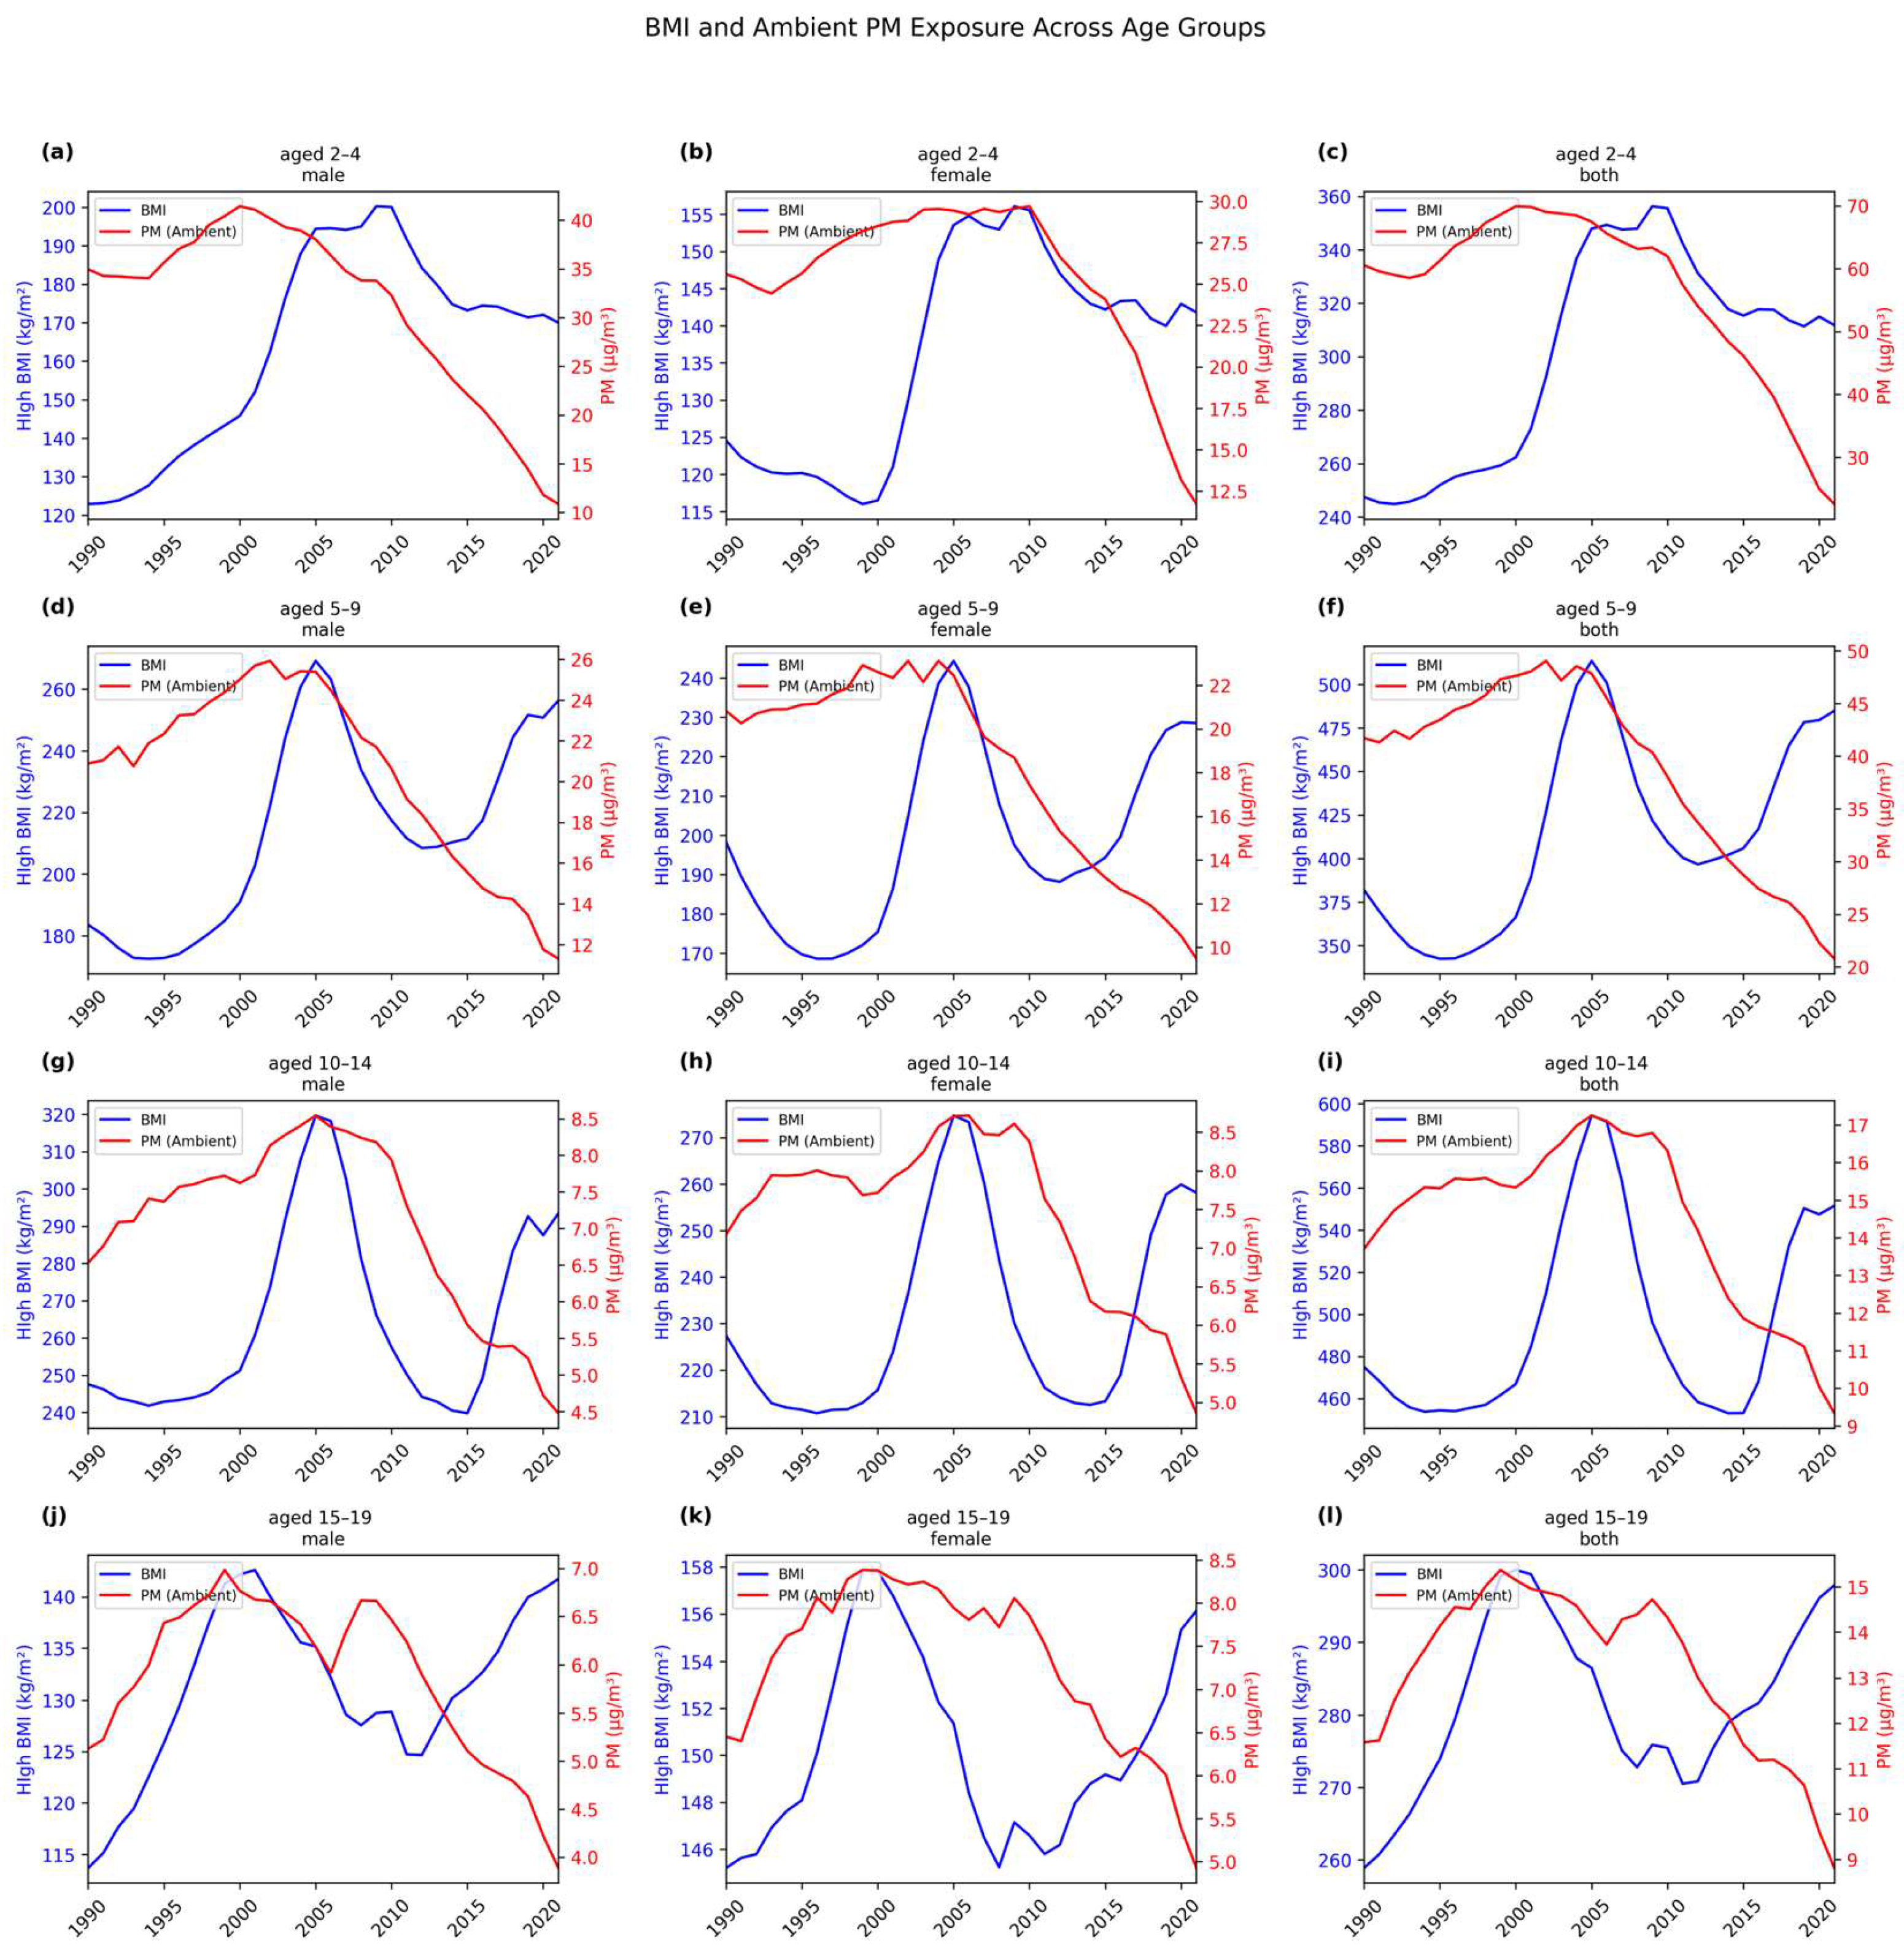
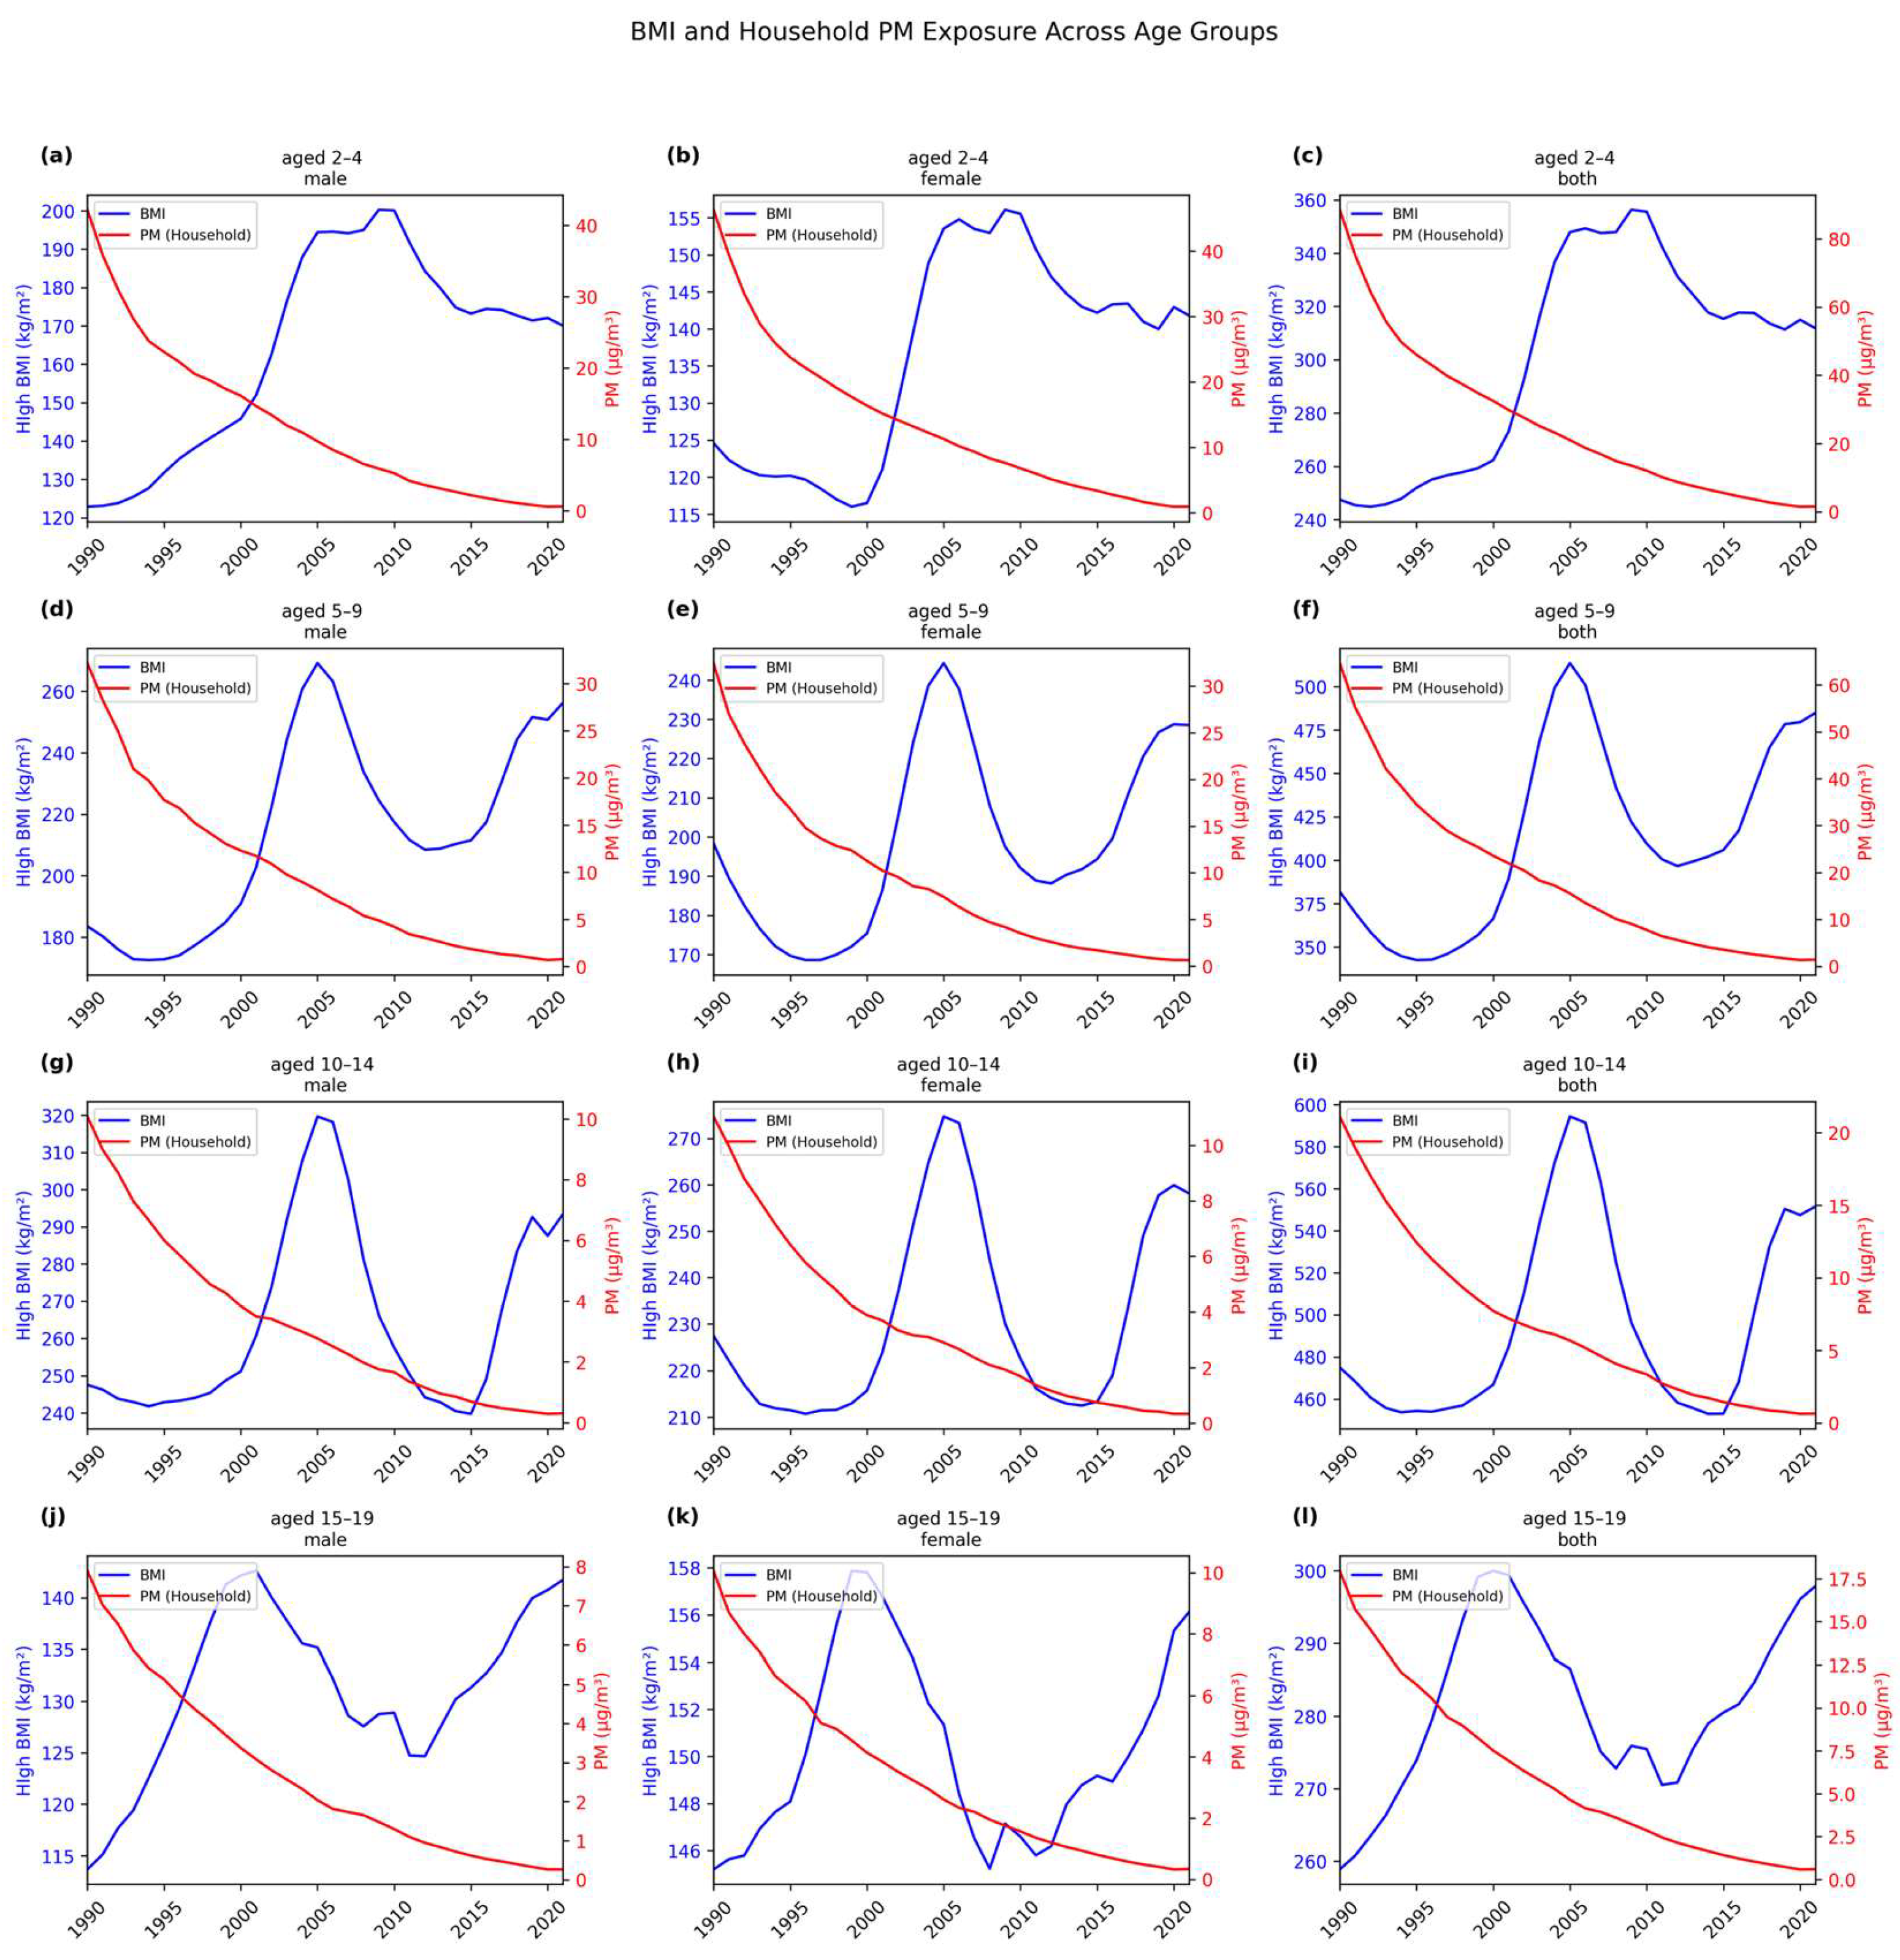
3.1. Time Series Analysis
3.2. Cross-Correlation
3.3. Spearman Correlation
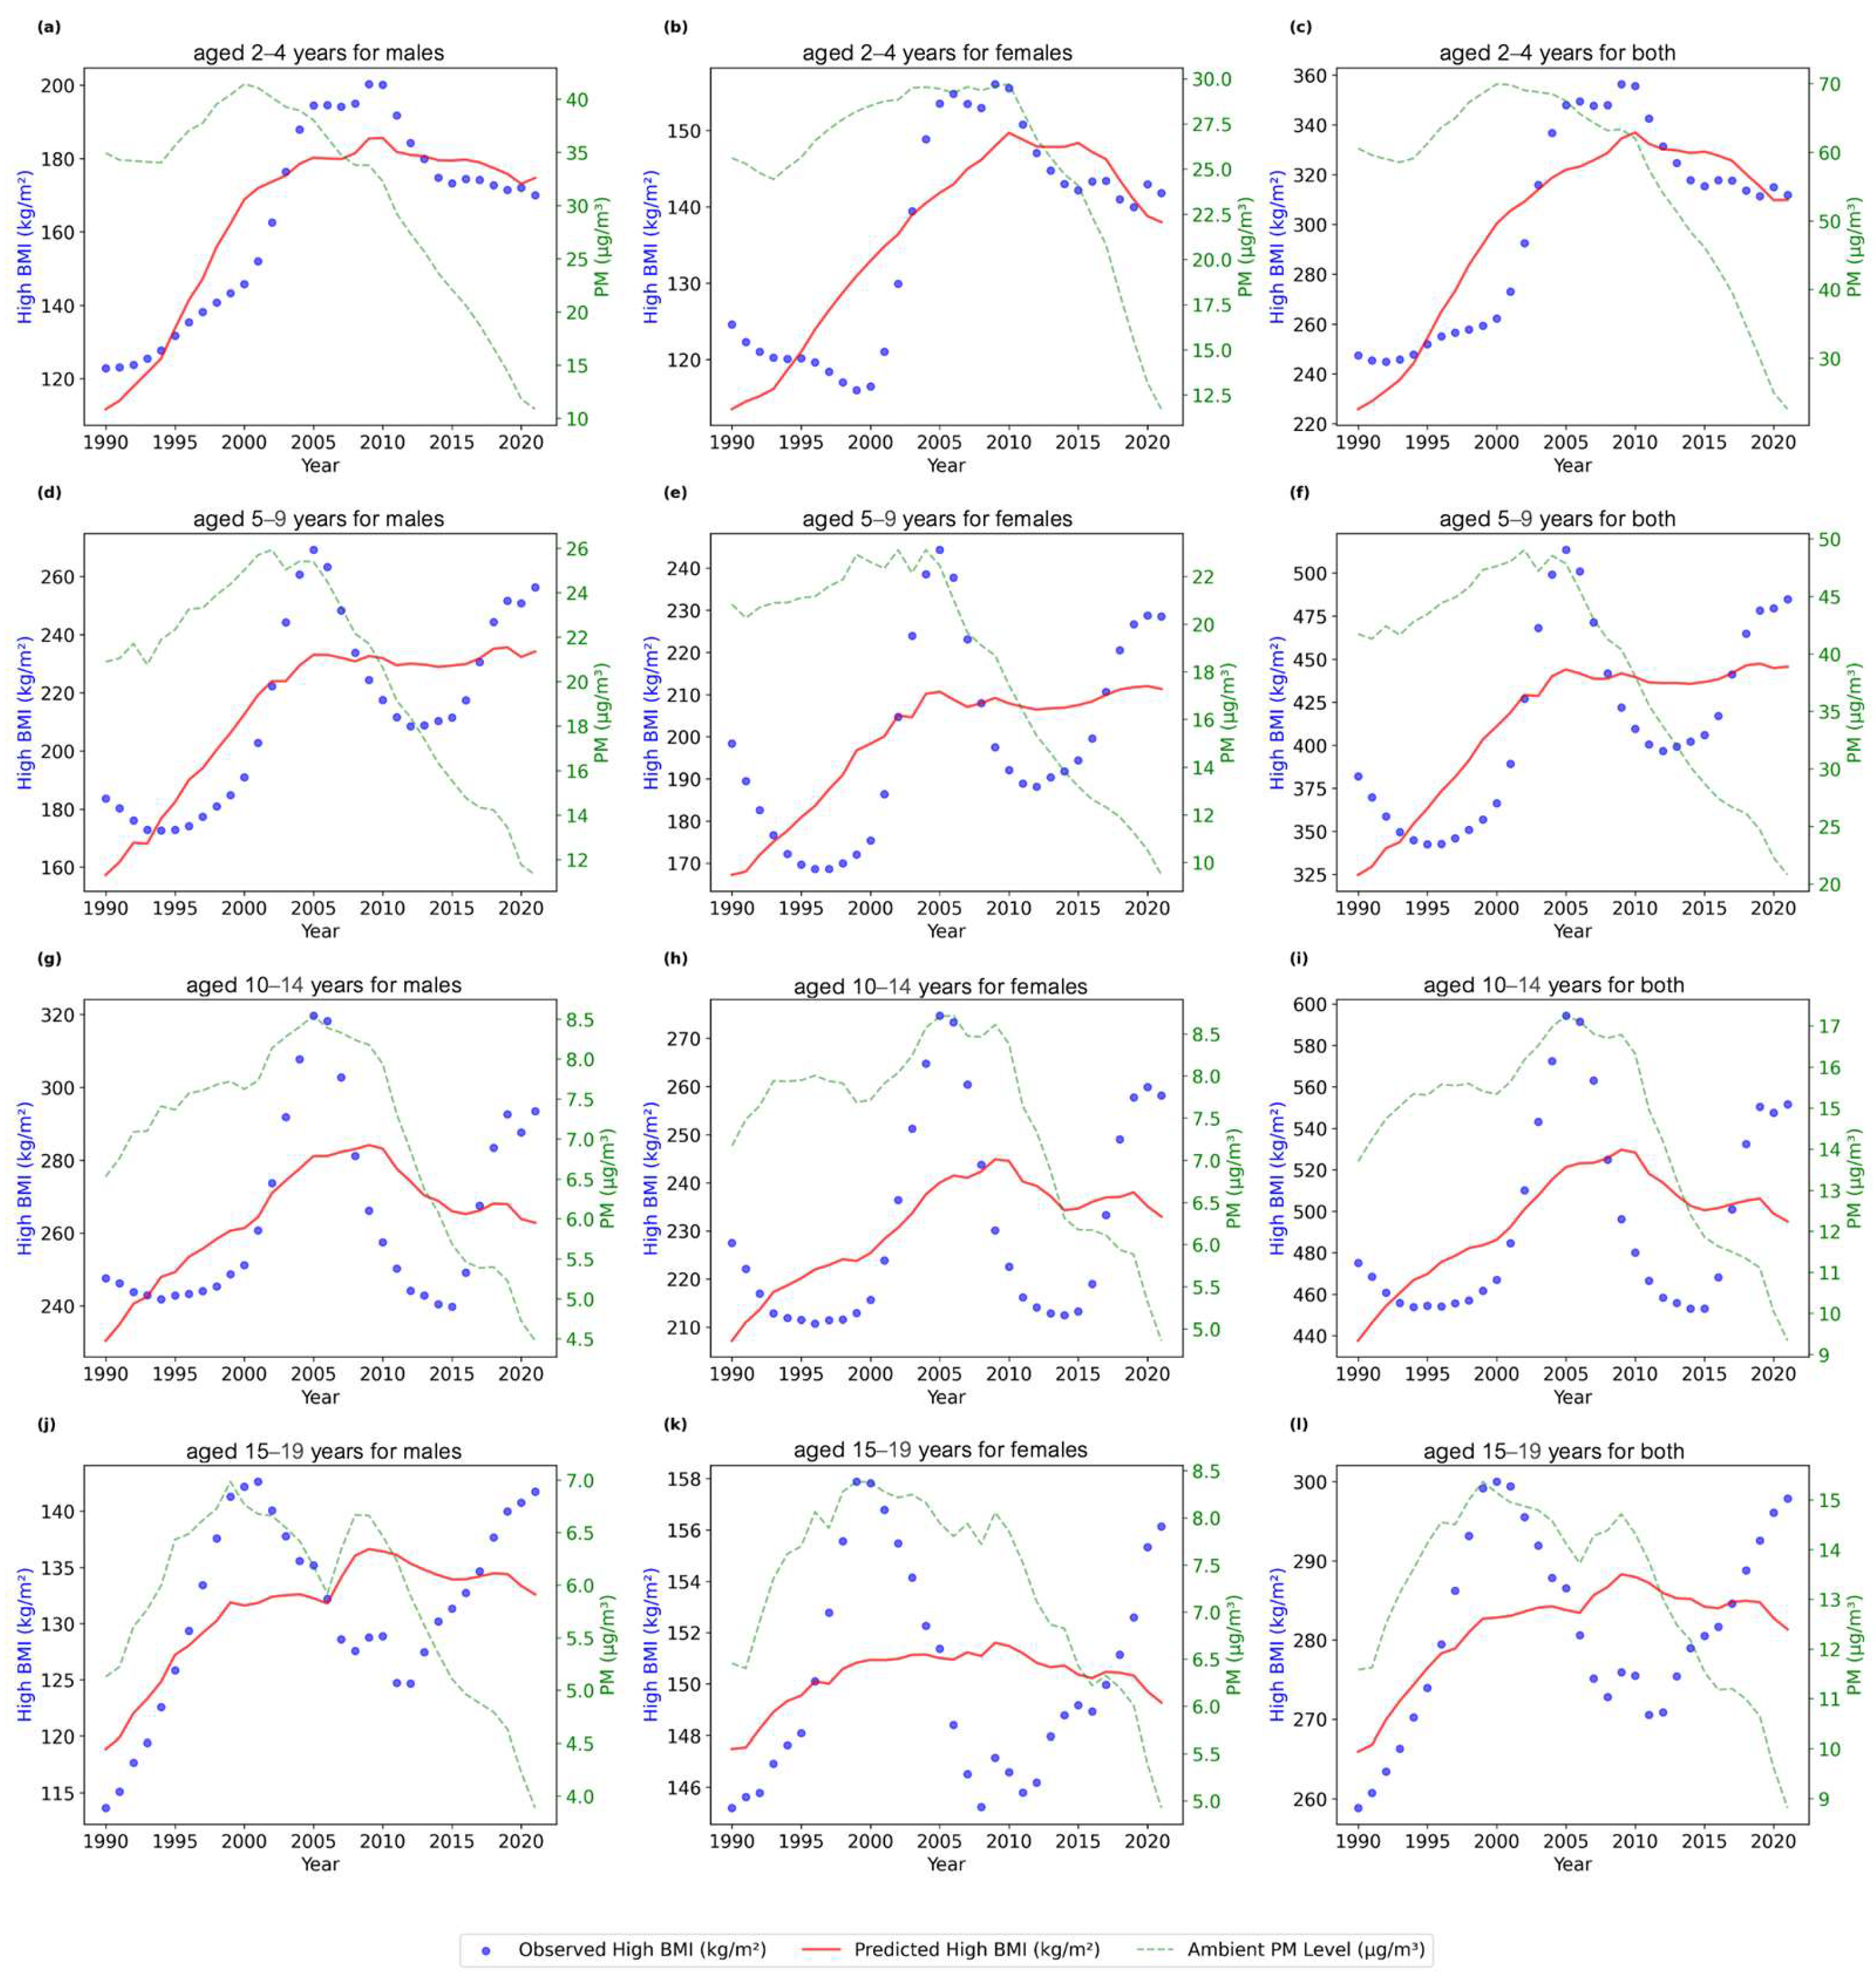
3.4. Mixed-Effects Model Analysis
4. Discussion
5. Conclusions
Author Contributions
Funding
Institutional Review Board Statement
Informed Consent Statement
Data Availability Statement
Acknowledgments
Conflicts of Interest
References
- World Health Organization (WHO). Global Strategy on Diet, Physical Activity, and Health. 2004. Available online: https://www.who.int/publications/i/item/9241592222 (accessed on 10 December 2024).
- Parasin, N.; Amnuaylojaroen, T.; Saokaew, S. Effect of Air Pollution on Obesity in Children: A Systematic Review and Meta-Analysis. Children 2021, 8, 327. [Google Scholar] [CrossRef] [PubMed]
- Brook, R.D.; Rajagopalan, S.; Pope III, C.A.; Brook, J.R.; Bhatnagar, A.; Diez-Roux, A.V.; Holguin, F.; Hong, Y.; Luepker, R.V.; Mittleman, M.A.; et al. Particulate Matter Air Pollution and Cardiovascular Disease: An Update to the Scientific Statement from the American Heart Association. Circulation 2010, 121, 2331–2378. [Google Scholar] [CrossRef] [PubMed]
- Lelieveld, J.; Evans, J.S.; Fnais, M.; Giannadaki, D.; Pozzer, A. The Contribution of Outdoor Air Pollution Sources to Premature Mortality on a Global Scale. Nature 2015, 525, 367–371. [Google Scholar] [CrossRef] [PubMed]
- Bekelman, T.A.; Bellows, L.L.; McCloskey, M.L.; Martin, C.K.; Johnson, S.L. Assessing Dinner Meals Offered at Home Among Preschoolers from Low-Income Families with the Remote Food Photography Method. Pediatr. Obes. 2019, 14, e12558. [Google Scholar] [CrossRef] [PubMed]
- Kuruvilla, D.J.; Widness, J.A.; Nalbant, D.; Schmidt, R.L.; Mock, D.M.; An, G.; Veng-Pedersen, P. Estimation of Adult and Neonatal RBC Lifespans in Anemic Neonates Using RBCs Labeled at Several Discrete Biotin Densities. Pediatr. Res. 2017, 81, 905–910. [Google Scholar] [CrossRef]
- Siewert, B.; Kozajda, A.; Jaskulak, M.; Zorena, K. Examining the Link Between Air Quality (PM, SO2, NO2, PAHs) and Childhood Obesity: A Systematic Review. J. Clin. Med. 2024, 13, 5605. [Google Scholar] [CrossRef]
- Amnuaylojaroen, T.; Parasin, N. Future Health Risk Assessment of Exposure to PM2.5 in Different Age Groups of Children in Northern Thailand. Toxics 2023, 11, 291. [Google Scholar] [CrossRef]
- Cheung, P.K.; Jim, C.Y.; Siu, C.T. Air Quality Impacts of Open-Plan Cooking in Tiny Substandard Homes in Hong Kong. Air Qual. Atmos. Health 2019, 12, 865–878. [Google Scholar] [CrossRef]
- Gold, D.R.; Adamkiewicz, G.; Arshad, S.H.; Celedón, J.C.; Chapman, M.D.; Chew, G.L.; Cook, D.N.; Custovic, A.; Gehring, U.; Gern, J.E.; et al. NIAID, NIEHS, NHLBI, and MCAN Workshop Report: The Indoor Environment and Childhood Asthma—Implications for Home Environmental Intervention in Asthma Prevention and Management. J. Allergy Clin. Immunol. 2017, 140, 933–949. [Google Scholar] [CrossRef]
- Clark, M.L.; Peel, J.L.; Balakrishnan, K.; Breysse, P.N.; Chillrud, S.N.; Naeher, L.P.; Rodes, C.E.; Vette, A.F.; Balbus, J.M. Health and Household Air Pollution from Solid Fuel Use: The Need for Improved Exposure Assessment. Environ. Health Perspect. 2013, 121, 1120–1128. [Google Scholar] [CrossRef]
- Wu, T.Q.; Han, X.; Liu, C.Y.; Zhao, N.; Ma, J. A Causal Relationship Between Particulate Matter 2.5 and Obesity and Its Related Indicators: A Mendelian Randomization Study of European Ancestry. Front. Public Health 2024, 12, 1366838. [Google Scholar] [CrossRef] [PubMed]
- Gauderman, W.J.; Avol, E.; Gilliland, F.; Vora, H.; Thomas, D.; Berhane, K.; McConnell, R.; Kuenzli, N.; Lurmann, F.; Rappaport, E.; et al. The Effect of Air Pollution on Lung Development from 10 to 18 Years of Age. N. Engl. J. Med. 2004, 351, 1057–1067. [Google Scholar] [CrossRef] [PubMed]
- Johnson, N.M.; Hoffmann, A.R.; Behlen, J.C.; Lau, C.; Pendleton, D.; Harvey, N.; Shore, R.; Li, Y.; Chen, J.; Tian, Y.; et al. Air Pollution and Children‘s Health—A Review of Adverse Effects Associated with Prenatal Exposure from Fine to Ultrafine Particulate Matter. Environ. Health Prev. Med. 2021, 26, 29. [Google Scholar] [CrossRef] [PubMed]
- Kelly, F.J.; Fussell, J.C. Linking Ambient Particulate Matter Pollution Effects with Oxidative Biology and Immune Responses. Ann. N. Y. Acad. Sci. 2015, 1340, 84–94. [Google Scholar] [CrossRef]
- Li, N.; Xia, T.; Nel, A.E. The Role of Oxidative Stress in Ambient Particulate Matter-Induced Lung Diseases and Its Implications in the Toxicity of Engineered Nanoparticles. Free Radic. Biol. Med. 2008, 44, 1689–1699. [Google Scholar] [CrossRef]
- Rückerl, R.; Schneider, A.; Breitner, S.; Cyrys, J.; Peters, A. Health Effects of Particulate Air Pollution: A Review of Epidemiological Evidence. Inhal. Toxicol. 2011, 23, 555–592. [Google Scholar] [CrossRef]
- Miller, R.L.; Peden, D.B. Environmental Effects on Immune Responses in Patients with Atopy and Asthma. J. Allergy Clin. Immunol. 2014, 134, 1001–1008. [Google Scholar] [CrossRef]
- Mishra, V.K. What Do We Know About Health Effects of Smoke from Solid Fuel Combustion? Annu. Rev. Public Health 2004, 25, 245–271. [Google Scholar]
- Singh, A.; Bartington, S.E.; Abreu, P.; Anderson, R.; Cowell, N.; Leach, F.C. Impacts of Daily Household Activities on Indoor Particulate and NO₂ Concentrations: A Case Study from Oxford UK. Heliyon 2024, 10, e12558. [Google Scholar] [CrossRef]
- Sukuman, T.; Ueda, K.; Sujaritpong, S.; Praekunatham, H.; Punnasiri, K.; Wimuktayon, T.; Prapaspongsa, T. Health Impacts from PM2.5 Exposure Using Environmental Epidemiology and Health Risk Assessment: A Review. Appl. Environ. Res. 2023, 45, 3. [Google Scholar] [CrossRef]
- Parasin, N.; Amnuaylojaroen, T. Development of a Heat Index Related to Air Quality and Meteorology for an Assessment of Work Performance in Thailand’s Urban Areas. Urban Sci. 2023, 7, 124. [Google Scholar] [CrossRef]
- Bran, S.H.; Macatangay, R.; Chotamonsak, C.; Chantara, S.; Surapipith, V. Understanding the Seasonal Dynamics of Surface PM2.5 Mass Distribution and Source Contributions over Thailand. Atmos. Environ. 2024, 280, 120613. [Google Scholar] [CrossRef]
- Smith, K.R.; Samet, J.M.; Romieu, I.; Bruce, N. Indoor Air Pollution in Developing Countries and Acute Lower Respiratory Infections in Children. Thorax 2000, 55, 518–532. [Google Scholar] [CrossRef] [PubMed]
- Liao, M.; Braunstein, Z.; Rao, X. Sex Differences in Particulate Air Pollution-Related Cardiovascular Diseases: A Review of Human and Animal Evidence. Sci. Total Environ. 2023, 884, 163803. [Google Scholar] [CrossRef]
- Pope III, C.A.; Turner, M.C.; Burnett, R.T.; Jerrett, M.; Gapstur, S.M.; Diver, W.R.; Krewski, D.; Brook, R.D. Relationships Between Fine Particulate Air Pollution, Cardiometabolic Disorders, and Cardiovascular Mortality. Circ. Res. 2015, 116, 108–115. [Google Scholar] [CrossRef]
- Kvakova, M.; Bertkova, I.; Stofilova, J.; Savidge, T.C. Co-Encapsulated Synbiotics and Immobilized Probiotics in Human Health and Gut Microbiota Modulation. Foods 2021, 10, 1297. [Google Scholar] [CrossRef]
- Brauer, M.; Roth, G.A.; Aravkin, A.Y.; Zheng, P.; Abate, K.H.; Abate, Y.H.; Abbafati, C.; Abbasgholizadeh, R.; Abbasi, M.A. Global burden and strength of evidence for 88 risk factors in 204 countries and 811 subnational locations, 1990–2021: A systematic analysis for the Global Burden of Disease Study. Lancet 2024, 403, 2162–2203. [Google Scholar] [CrossRef]
- Cole, T.J.; Bellizzi, M.C.; Flegal, K.M.; Dietz, W.H. Establishing a Standard Definition for Child Overweight and Obesity Worldwide: International Survey. BMJ 2000, 320, 1240–1243. [Google Scholar] [CrossRef]
- World Health Organization. Obesity: Preventing and Managing the Global Epidemic. WHO Technical Report Series, No. 894. 2000. Available online: https://apps.who.int/iris/handle/10665/42330 (accessed on 28 January 2025).
- Shaddick, G.; Thomas, M.L.; Green, A.; Brauer, M.; Van Donkelaar, A.; Burnett, R.; Chang, H.H.; Cohen, A.; Van Dingenen, R.; Dora, C.; et al. Data Integration Model for Air Quality: A Hierarchical Approach to the Global Estimation of Exposures to Ambient Air Pollution. J. R. Stat. Soc. Ser. C Appl. Stat. 2018, 67, 231–253. [Google Scholar] [CrossRef]
- Brauer, M.; Freedman, G.; Frostad, J.; Van Donkelaar, A.; Martin, R.V.; Dentener, F.; Dingenen, R.V.; Estep, K.; Amini, H.; Apte, J.S.; et al. Ambient Air Pollution Exposure Estimation for the Global Burden of Disease 2013. Environ. Sci. Technol. 2016, 50, 79–88. [Google Scholar] [CrossRef]
- Smith, K.R.; Bruce, N.; Balakrishnan, K.; Adair-Rohani, H.; Balmes, J.; Chafe, Z.; Dherani, M.; Hosgood, H.D.; Mehta, S.; Pope, D.; et al. Millions Dead: How Do We Know and What Does It Mean? Methods Used in the Comparative Risk Assessment of Household Air Pollution. Annu. Rev. Public Health 2014, 35, 185–206. [Google Scholar] [CrossRef] [PubMed]
- Black, M.M.; Walker, S.P.; Fernald, L.C.; Andersen, C.T.; DiGirolamo, A.M.; Lu, C.; McCoy, D.C.; Fink, G.; Shawar, Y.R.; Shiffman, J.; et al. Early Childhood Development Coming of Age: Science Through the Life Course. Lancet 2017, 389, 77–90. [Google Scholar] [CrossRef] [PubMed]
- Hawkes, C.; Smith, T.G.; Jewell, J.; Wardle, J.; Hammond, R.A.; Friel, S.; Thow, A.M.; Kain, J. Smart Food Policies for Obesity Prevention. Lancet 2015, 385, 2410–2421. [Google Scholar] [CrossRef] [PubMed]
- Patton, G.C.; Sawyer, S.M.; Santelli, J.S.; Ross, D.A.; Afifi, R.; Allen, N.B.; Arora, M.; Azzopardi, P.; Baldwin, W.; Bonell, C.; et al. Our Future: A Lancet Commission on Adolescent Health and Wellbeing. Lancet 2016, 387, 2423–2478. [Google Scholar] [CrossRef]
- Sawyer, S.M.; Azzopardi, P.S.; Wickremarathne, D.; Patton, G.C. Adolescence: A Foundation for Future Health. Lancet 2012, 379, 1630–1640. [Google Scholar] [CrossRef]
- Wong, C.M.; Ma, S.; Hedley, A.J.; Lam, T.H. Effect of Air Pollution on Daily Mortality in Hong Kong. Environ. Health Perspect. 2001, 109, 335–340. [Google Scholar] [CrossRef]
- Pope, C.A., III; Thun, M.J.; Namboodiri, M.M.; Dockery, D.W.; Evans, J.S.; Speizer, F.E.; Heath, C.W. Particulate Air Pollution as a Predictor of Mortality in a Prospective Study of U.S. Adults. Am. J. Respir. Crit. Care Med. 1995, 151, 669–674. [Google Scholar] [CrossRef]
- Spearman, C. The Proof and Measurement of Association Between Two Things. Am. J. Psychol. 1987, 100, 441–471. [Google Scholar] [CrossRef]
- Shumway, R.H.; Stoffer, D.S. State Space Models. In Time Series Analysis and Its Applications: With R Examples; Springer International Publishing: Cham, Switzerland, 2017; pp. 289–384. [Google Scholar] [CrossRef]
- Fitzmaurice, G.M.; Laird, N.M.; Ware, J.H. Applied Longitudinal Analysis; John Wiley & Sons: Hoboken, NJ, USA, 2012. [Google Scholar] [CrossRef]
- Adhikari, R.B. Economic Research at Asian Development Bank: A Retrospective. In The Elgar Companion to the Asian Development Bank; Edward Elgar Publishing: Cheltenham, UK, 2024; pp. 43–55. [Google Scholar]
- Asian Infrastructure Investment Bank. 2022 Joint Report on Multilateral Development Banks’ Climate Finance; European Investment Bank: Luxemburg, 2023. [Google Scholar] [CrossRef]
- Evans, G.W.; Kantrowitz, E. Socioeconomic Status and Health: The Potential Role of Environmental Risk Exposure. Annu. Rev. Public Health 2002, 23, 303–331. [Google Scholar] [CrossRef]
- Oliveira, M.; Slezakova, K.; Delerue-Matos, C.; Pereira, M.C.; Morais, S. Children’s Environmental Exposure to Particulate Matter and Polycyclic Aromatic Hydrocarbons in School Environments: A Review on Indoor and Outdoor Exposure Levels, Major Sources, and Health Impacts. Environ. Int. 2019, 124, 180–204. [Google Scholar] [CrossRef]
- Cohen Hubal, E.A.; Sheldon, L.S.; Burke, J.M.; McCurdy, T.R.; Berry, M.R.; Rigas, M.L.; Zartarian, V.G.; Freeman, N.C. Children’s Exposure Assessment: A Review of Factors Influencing Children’s Exposure, and the Data Available to Characterize and Assess that Exposure. Environ. Health Perspect. 2000, 108, 475–486. [Google Scholar] [CrossRef] [PubMed]
- Giles-Corti, B.; Kelty, S.F.; Zubrick, S.R.; Villanueva, K.P. Encouraging Walking for Transport and Physical Activity in Children and Adolescents: How Important Is the Built Environment? Sports Med. 2009, 39, 995–1009. [Google Scholar] [CrossRef]
- Amnuaylojaroen, T.; Inkom, J.; Janta, R.; Surapipith, V. Long-Range Transport of Southeast Asian PM2.5 Pollution to Northern Thailand During High Biomass Burning Episodes. Sustainability 2020, 12, 10049. [Google Scholar] [CrossRef]
- Gebremeskel Kanno, G.; Hussen Kabthymer, R. Association of Low Birthweight with Indoor Air Pollution from Biomass Fuel in Sub-Saharan Africa: A Systemic Review and Meta-Analysis. Sustain. Environ. 2021, 7, 1922185. [Google Scholar] [CrossRef]
- Peters, A.; Nawrot, T.S.; Baccarelli, A.A. Hallmarks of Environmental Insults. Cell 2021, 184, 1455–1468. [Google Scholar] [CrossRef]
- Boothe, V.L.; Baldauf, R.W. Traffic Emission Impacts on Child Health and Well-Being. In Transport and Children‘s Wellbeing; Elsevier: Amsterdam, The Netherlands, 2020; pp. 119–142. [Google Scholar] [CrossRef]
- Stover, P.J.; Field, M.S.; Andermann, M.L.; Bailey, R.L.; Batterham, R.L.; Cauffman, E.; Frühbeck, G.; Iversen, P.O.; Starke-Reed, P.; Sternson, S.M.; et al. Neurobiology of Eating Behavior, Nutrition, and Health. J. Intern. Med. 2023, 294, 582–604. [Google Scholar] [CrossRef]
- Hallal, P.C.; Andersen, L.B.; Bull, F.C.; Guthold, R.; Haskell, W.; Ekelund, U. Global Physical Activity Levels: Surveillance Progress, Pitfalls, and Prospects. Lancet 2012, 380, 247–257. [Google Scholar] [CrossRef]
- Blum, R.W.; Bastos, F.I.; Kabiru, C.W.; Le, L.C. Adolescent Health in the 21st Century. Lancet 2012, 379, 1567–1568. [Google Scholar] [CrossRef]
- Wood, S.N. Generalized Additive Models: An Introduction with R; Chapman and Hall; CRC Press: Boca Raton, FL, USA, 2017. [Google Scholar] [CrossRef]
- Chuang, C.C.; McIntosh, M.K. Potential Mechanisms by Which Polyphenol-Rich Grapes Prevent Obesity-Mediated Inflammation and Metabolic Diseases. Annu. Rev. Nutr. 2011, 31, 155–176. [Google Scholar] [CrossRef]
- Wurm, J.; Curtis, N.; Zimmermann, P. The Effect of Antibiotics on the Intestinal Microbiota in Children—A Systematic Review. Front. Allergy 2024, 5, 1458688. [Google Scholar] [CrossRef]
- Gupta, R.; Kumar, P.; Fahmi, N.; Garg, B.; Dutta, S.; Sachar, S.; Matharu, A.S.; Vimaleswaran, K.S. Endocrine Disruption and Obesity: A Current Review on Environmental Obesogens. Curr. Res. Green Sustain. Chem. 2020, 3, 100009. [Google Scholar] [CrossRef]
- Mishra, V. Indoor Air Pollution from Biomass Combustion and Acute Respiratory Illness in Preschool Age Children in Zimbabwe. Int. J. Epidemiol. 2003, 32, 847–853. [Google Scholar] [CrossRef] [PubMed]
- Block, M.L.; Calderón-Garcidueñas, L. Air Pollution: Mechanisms of Neuroinflammation and CNS Disease. Trends Neurosci. 2009, 32, 506–516. [Google Scholar] [CrossRef]
- Gong, P.; Liang, S.; Carlton, E.J.; Jiang, Q.; Wu, J.; Wang, Y.; Remais, J.V. Urbanisation and Health in China. Lancet 2018, 391, 2010–2019. [Google Scholar] [CrossRef]
- Mutahi, A.W.; Borgese, L.; Marchesi, C.; Gatari, M.J.; Depero, L.E. Indoor and Outdoor Air Quality for Sustainable Life: A Case Study of Rural and Urban Settlements in Poor Neighbourhoods in Kenya. Sustainability 2021, 13, 2417. [Google Scholar] [CrossRef]
- Amnuaylojaroen, T.; Parasin, N. Pathogenesis of PM2.5-Related Disorders in Different Age Groups: Children, Adults, and the Elderly. Epigenomes 2024, 8, 13. [Google Scholar] [CrossRef]


| Category | Pollution Type | No Lag | p-Values | Lag 1 | p-Values | Lag 2 | p-Values | Lag 3 | p-Values | |
|---|---|---|---|---|---|---|---|---|---|---|
| Aged 2–4 years | Male | Ambient | −0.27 [−0.57, 0.09] | 0.1335 | −0.19 [−0.51, 0.18] | 0.3153 | −0.09 [−0.44, 0.28] | 0.6199 | 0.01 [−0.36, 0.38] | 0.9512 |
| Household | −0.83 ** [−0.91, −0.67] | 0.0000 | −0.81 ** [−0.90, −0.64] | 0.0000 | −0.79 ** [−0.90, −0.60] | 0.0000 | −0.76 ** [−0.88, −0.55] | 0.0000 | ||
| Female | Ambient | 0.00 [−0.35, 0.35] | 0.9861 | 0.10 [−0.26, 0.44] | 0.5840 | 0.22 [−0.15, 0.54] | 0.2419 | 0.36 [−0.01, 0.64] | 0.0540 | |
| Household | −0.69 ** [−0.84, −0.45] | 0.0000 | −0.71 ** [−0.85, −0.47] | 0.0000 | −0.71 ** [−0.85, −0.48] | 0.0000 | −0.71 ** [−0.86, −0.47] | 0.0000 | ||
| Both | Ambient | −0.19 [−0.50, 0.17] | 0.3086 | −0.10 [−0.44, 0.26] | 0.5922 | −0.00 [−0.36, 0.36] | 0.9822 | 0.11 [−0.27, 0.46] | 0.5784 | |
| Household | −0.79 ** [−0.89, −0.60] | 0.0000 | −0.78 ** [−0.89, −0.59] | 0.0000 | −0.77 ** [−0.88, −0.57] | 0.0000 | −0.75 ** [−0.88, −0.53] | 0.0000 | ||
| Aged 5–9 years | Male | Ambient | −0.24 [−0.54, 0.12] | 0.1834 | −0.17 [−0.49, 0.20] | 0.3703 | −0.10 [−0.44, 0.27] | 0.6005 | −0.05 [−0.41, 0.32] | 0.7777 |
| Household | −0.69 ** [−0.84, −0.45] | 0.0000 | −0.69 ** [−0.84, −0.45] | 0.0000 | −0.69 ** [−0.84, −0.44] | 0.0000 | −0.68 ** [−0.84, −0.42] | 0.0000 | ||
| Female | Ambient | −0.30 [−0.59, 0.05] | 0.0920 | −0.26 [−0.56, 0.11] | 0.1611 | −0.22 [−0.54, 0.15] | 0.2325 | −0.20 [−0.53, 0.18] | 0.2886 | |
| Household | −0.46 ** [−0.70, −0.14] | 0.0077 | −0.52 ** [−0.74, −0.20] | 0.0027 | −0.56 ** [−0.76, −0.25] | 0.0014 | −0.58 ** [−0.78, −0.27] | 0.0011 | ||
| Both | Ambient | −0.29 [−0.58, 0.06] | 0.1058 | −0.23 [−0.54, 0.14] | 0.2204 | −0.17 [−0.50, 0.20] | 0.3575 | −0.14 [−0.48, 0.24] | 0.4711 | |
| Household | −0.60 ** [−0.79, −0.32] | 0.0003 | −0.62 ** [−0.80, −0.35] | 0.0002 | −0.64 ** [−0.81, −0.36] | 0.0002 | −0.64 ** [−0.81, −0.36] | 0.0002 | ||
| Aged 10–14 years | Male | Ambient | 0.16 [−0.20, 0.48] | 0.3954 | 0.14 [−0.22, 0.47] | 0.4402 | 0.10 [−0.27, 0.44] | 0.6083 | 0.01 [−0.36, 0.38] | 0.9545 |
| Household | −0.39 * [−0.65, −0.04] | 0.0293 | −0.38 * [−0.65, −0.03] | 0.0335 | −0.38 * [−0.65, −0.02] | 0.0396 | −0.36 [−0.64, 0.00] | 0.0526 | ||
| Female | Ambient | −0.01 [−0.36, 0.34] | 0.9537 | −0.04 [−0.38, 0.32] | 0.8514 | −0.11 [−0.45, 0.26] | 0.5558 | −0.23 [−0.55, 0.14] | 0.2207 | |
| Household | −0.35 * [−0.62, −0.00] | 0.0492 | −0.39 * [−0.66, −0.04] | 0.0287 | −0.42 * [−0.68, −0.07] | 0.0202 | −0.43 * [−0.69, −0.08] | 0.0187 | ||
| Both | Ambient | 0.08 [−0.28, 0.41] | 0.6756 | 0.06 [−0.30, 0.41] | 0.7473 | −0.00 [−0.36, 0.36] | 0.9991 | −0.10 [−0.45, 0.27] | 0.5889 | |
| Household | −0.37 * [−0.64, −0.03] | 0.0359 | −0.39 * [−0.65, −0.04] | 0.0300 | −0.40 * [−0.66, −0.05] | 0.0283 | −0.40 * [−0.67, −0.04] | 0.0321 | ||
| Aged 15–19 years | Male | Ambient | 0.04 [−0.32, 0.38] | 0.8426 | 0.09 [−0.27, 0.43] | 0.6266 | 0.10 [−0.27, 0.45] | 0.5812 | 0.05 [−0.32, 0.41] | 0.7945 |
| Household | −0.57 ** [−0.77, −0.27] | 0.0007 | −0.48 ** [−0.72, −0.16] | 0.0057 | −0.38 * [−0.65, −0.02] | 0.0383 | −0.26 [−0.57, 0.12] | 0.1717 | ||
| Female | Ambient | 0.13 [−0.23, 0.46] | 0.4795 | 0.15 [−0.22, 0.48] | 0.4199 | 0.13 [−0.24, 0.47] | 0.4974 | 0.04 [−0.33, 0.40] | 0.8449 | |
| Household | −0.18 [−0.50, 0.18] | 0.3166 | −0.11 [−0.44, 0.26] | 0.5727 | −0.02 [−0.38, 0.34] | 0.9159 | 0.08 [−0.29, 0.44] | 0.6707 | ||
| Both | Ambient | 0.08 [−0.28, 0.42] | 0.6643 | 0.13 [−0.24, 0.46] | 0.4981 | 0.13 [−0.24, 0.47] | 0.5030 | 0.06 [−0.32, 0.41] | 0.7732 | |
| Category | Pollution Type | No Lag | p-Values | Lag 1 | p-Values | Lag 2 | p-Values | Lag 3 | p-Values | |
|---|---|---|---|---|---|---|---|---|---|---|
| Aged 2–4 years | Male | Ambient | −0.23 [−0.54, 0.13] | 0.2035 | −0.12 [−0.45, 0.25] | 0.5339 | 0.02 [−0.34, 0.38] | 0.9062 | 0.19 [−0.19, 0.52] | 0.3361 |
| Household | −0.63 ** [−0.80, −0.35] | 0.0001 | −0.59 ** [−0.78, −0.30] | 0.0005 | −0.55 ** [−0.76, −0.23] | 0.0018 | −0.50 ** [−0.73, −0.16] | 0.0061 | ||
| Female | Ambient | 0.31 [−0.04, 0.60] | 0.0818 | 0.44 * [0.10, 0.69] | 0.0139 | 0.54 ** [0.22, 0.75] | 0.0021 | 0.62 ** [0.33, 0.81] | 0.0003 | |
| Household | −0.58 ** [−0.77, −0.29] | 0.0005 | −0.57 ** [−0.77, −0.26] | 0.0009 | −0.55 ** [−0.76, −0.23] | 0.0018 | −0.52 ** [−0.74, −0.19] | 0.0039 | ||
| Both | Ambient | −0.01 [−0.35, 0.34] | 0.9778 | 0.12 [−0.25, 0.45] | 0.5353 | 0.25 [−0.12, 0.56] | 0.1814 | 0.41* [0.05, 0.67] | 0.0291 | |
| Household | −0.64 ** [−0.81, −0.37] | 0.0001 | −0.60 ** [−0.79, −0.32] | 0.0003 | −0.56 ** [−0.77, −0.25] | 0.0012 | −0.52 ** [−0.74, −0.18] | 0.0041 | ||
| Aged 5–9 years | Male | Ambient | −0.10 [−0.43, 0.26] | 0.5941 | 0.02 [−0.34, 0.37] | 0.9074 | 0.11 [−0.26, 0.45] | 0.5513 | 0.17 [−0.21, 0.50] | 0.3795 |
| Household | −0.70 ** [−0.84, −0.46] | 0.0000 | −0.68 ** [−0.84, −0.44] | 0.0000 | −0.66 ** [−0.82, −0.39] | 0.0001 | −0.63 ** [−0.81, −0.34] | 0.0003 | ||
| Female | Ambient | −0.30 [−0.59, 0.05] | 0.0954 | −0.19 [−0.51, 0.17] | 0.2979 | −0.08 [−0.43, 0.29] | 0.6646 | 0.01 [−0.36, 0.37] | 0.9656 | |
| Household | −0.58 ** [−0.77, −0.29] | 0.0005 | −0.63 ** [−0.80, −0.35] | 0.0001 | −0.63 ** [−0.81, −0.35] | 0.0002 | −0.61 ** [−0.80, −0.32] | 0.0004 | ||
| Both | Ambient | −0.22 [−0.53, 0.14] | 0.2345 | −0.08 [−0.43, 0.28] | 0.6506 | 0.03 [−0.34, 0.38] | 0.8877 | 0.10 [−0.27, 0.45] | 0.5880 | |
| Household | −0.67 ** [−0.83, −0.42] | 0.0000 | −0.66 ** [−0.82, −0.40] | 0.0001 | −0.64 ** [−0.82, −0.37] | 0.0001 | −0.62 ** [−0.80, −0.33] | 0.0003 | ||
| Aged 10–14 years | Male | Ambient | 0.34 [−0.01, 0.62] | 0.0562 | 0.35 [−0.00, 0.63] | 0.0521 | 0.31 [−0.06, 0.60] | 0.0971 | 0.20 [−0.18, 0.53] | 0.3056 |
| Household | −0.36 * [−0.63, −0.02] | 0.0412 | −0.35 [−0.63, 0.00] | 0.0516 | −0.34 [−0.62, 0.02] | 0.0674 | −0.30 [−0.60, 0.07] | 0.1077 | ||
| Female | Ambient | 0.13 [−0.23, 0.46] | 0.4765 | 0.09 [−0.27, 0.43] | 0.6167 | 0.03 [−0.34, 0.38] | 0.8803 | −0.05 [−0.41, 0.33] | 0.8134 | |
| Household | −0.42 * [−0.67, −0.08] | 0.0181 | −0.45 * [−0.69, −0.11] | 0.0115 | −0.47 ** [−0.71, −0.13] | 0.0086 | −0.48 ** [−0.72, −0.14] | 0.0078 | ||
| Both | Ambient | 0.26 [−0.09, 0.56] | 0.1467 | 0.26 [−0.10, 0.56] | 0.1590 | 0.22 [−0.15, 0.54] | 0.2417 | 0.13 [−0.25, 0.47] | 0.5095 | |
| Household | −0.34 [−0.62, 0.01] | 0.0568 | −0.35 [−0.63, 0.00] | 0.0507 | −0.37 * [−0.64, −0.01] | 0.0459 | −0.35 [−0.64, 0.02] | 0.0609 | ||
| Aged 15–19 years | Male | Ambient | 0.17 [−0.19, 0.49] | 0.3648 | 0.22 [−0.15, 0.53] | 0.2438 | 0.20 [−0.17, 0.52] | 0.2882 | 0.12 [−0.26, 0.46] | 0.5447 |
| Household | −0.39 * [−0.65, −0.05] | 0.0265 | −0.33 [−0.61, 0.03] | 0.0689 | −0.26 [−0.57, 0.11] | 0.1622 | −0.18 [−0.51, 0.20] | 0.3427 | ||
| Female | Ambient | 0.33 [−0.02, 0.61] | 0.0678 | 0.28 [−0.08, 0.58] | 0.1256 | 0.19 [−0.18, 0.51] | 0.3175 | 0.05 [−0.33, 0.41] | 0.8115 | |
| Household | −0.18 [−0.50, 0.18] | 0.3143 | −0.10 [−0.44, 0.26] | 0.5805 | −0.02 [−0.38, 0.34] | 0.9247 | 0.08 [−0.30, 0.43] | 0.6826 | ||
| Both | Ambient | 0.25 [−0.10, 0.55] | 0.1594 | 0.28 [−0.09, 0.57] | 0.1320 | 0.23 [−0.14, 0.55] | 0.2119 | 0.13 [−0.25, 0.47] | 0.5030 | |
| Household | −0.35 * [−0.62, −0.00] | 0.0485 | −0.29 [−0.58, 0.07] | 0.1174 | −0.21 [−0.53, 0.16] | 0.2576 | −0.13 [−0.47, 0.25] | 0.5046 | ||
| Age | Group | High BMI-PM Corr. | R2 | High BMI Range | PM Range | Trend Description |
|---|---|---|---|---|---|---|
| 2–4 years | male | −0.27 | 0.83 | 122.9–170.0 | 35.0–10.9 | BMI: Increasing; PM: Decreasing |
| female | 0 | 0.7 | 124.6–141.8 | 25.6–11.7 | BMI: Increasing; PM: Decreasing | |
| both | −0.19 | 0.8 | 247.5–311.8 | 60.6–22.6 | BMI: Increasing; PM: Decreasing | |
| 5–9 years | male | −0.24 | 0.65 | 183.6–256.3 | 20.9–11.3 | BMI: Increasing; PM: Decreasing |
| female | −0.3 | 0.39 | 198.4–228.5 | 20.8–9.5 | BMI: Increasing; PM: Decreasing | |
| both | −0.29 | 0.54 | 382.0–484.8 | 41.7–20.8 | BMI: Increasing; PM: Decreasing | |
| 10–14 years | male | 0.16 | 0.33 | 247.6–293.4 | 6.5–4.5 | BMI: Increasing; PM: Decreasing |
| female | −0.01 | 0.24 | 227.5–258.1 | 7.2–4.9 | BMI: Increasing; PM: Decreasing | |
| both | 0.08 | 0.28 | 475.0–551.6 | 13.7–9.3 | BMI: Increasing; PM: Decreasing | |
| 15–19 years | male | 0.04 | 0.35 | 113.7–141.8 | 5.1–3.9 | BMI: Increasing; PM: Decreasing |
| female | 0.13 | 0.07 | 145.2–156.1 | 6.5–4.9 | BMI: Increasing; PM: Decreasing | |
| both | 0.08 | 0.25 | 258.9–297.9 | 11.6–8.8 | BMI: Increasing; PM: Decreasing |
| Age | Group | High BMI-PM Corr. | R2 | High BMI Range | PM Range | Trend Description |
|---|---|---|---|---|---|---|
| 2–4 years | male | −0.83 | 0.7 | 122.9–170.0 | 42.2–0.6 | BMI: Increasing; PM: Decreasing |
| female | −0.69 | 0.5 | 124.6–141.8 | 46.3–0.9 | BMI: Increasing; PM: Decreasing | |
| both | −0.79 | 0.62 | 247.5–311.8 | 88.5–1.6 | BMI: Increasing; PM: Decreasing | |
| 5–9 years | male | −0.69 | 0.49 | 183.6–256.3 | 32.2–0.8 | BMI: Increasing; PM: Decreasing |
| female | −0.46 | 0.31 | 198.4–228.5 | 32.5–0.6 | BMI: Increasing; PM: Decreasing | |
| both | −0.6 | 0.41 | 382.0–484.8 | 64.6–1.4 | BMI: Increasing; PM: Decreasing | |
| 10–14 years | male | −0.39 | 0.15 | 247.6–293.4 | 10.1–0.3 | BMI: Increasing; PM: Decreasing |
| female | −0.35 | 0.15 | 227.5–258.1 | 11.0–0.3 | BMI: Increasing; PM: Decreasing | |
| both | −0.37 | 0.14 | 475.0–551.6 | 21.1–0.7 | BMI: Increasing; PM: Decreasing | |
| 15–19 years | male | −0.57 | 0.38 | 113.7–141.8 | 7.9–0.3 | BMI: Increasing; PM: Decreasing |
| female | −0.18 | 0.07 | 145.2–156.1 | 10.1–0.3 | BMI: Increasing; PM: Decreasing | |
| both | −0.45 | 0.25 | 258.9–297.9 | 18.0–0.6 | BMI: Increasing; PM: Decreasing |
Disclaimer/Publisher’s Note: The statements, opinions and data contained in all publications are solely those of the individual author(s) and contributor(s) and not of MDPI and/or the editor(s). MDPI and/or the editor(s) disclaim responsibility for any injury to people or property resulting from any ideas, methods, instructions or products referred to in the content. |
© 2025 by the authors. Licensee MDPI, Basel, Switzerland. This article is an open access article distributed under the terms and conditions of the Creative Commons Attribution (CC BY) license (https://creativecommons.org/licenses/by/4.0/).
Share and Cite
Parasin, N.; Amnuaylojaroen, T. Correlational Associations Between Ambient and Household Particulate Matter Exposure and Body Mass Index Across Childhood and Adolescence in Thailand. Adolescents 2025, 5, 6. https://doi.org/10.3390/adolescents5010006
Parasin N, Amnuaylojaroen T. Correlational Associations Between Ambient and Household Particulate Matter Exposure and Body Mass Index Across Childhood and Adolescence in Thailand. Adolescents. 2025; 5(1):6. https://doi.org/10.3390/adolescents5010006
Chicago/Turabian StyleParasin, Nichapa, and Teerachai Amnuaylojaroen. 2025. "Correlational Associations Between Ambient and Household Particulate Matter Exposure and Body Mass Index Across Childhood and Adolescence in Thailand" Adolescents 5, no. 1: 6. https://doi.org/10.3390/adolescents5010006
APA StyleParasin, N., & Amnuaylojaroen, T. (2025). Correlational Associations Between Ambient and Household Particulate Matter Exposure and Body Mass Index Across Childhood and Adolescence in Thailand. Adolescents, 5(1), 6. https://doi.org/10.3390/adolescents5010006