


Abstract
This pilot study presents a surrogate modeling framework for estimating carbon emissions for 35 data centers in the New York City metropolitan area. Using publicly available facility data (square footage, operator type, location), we calculated the annual CO2e emissions based on standard industry assumptions. These calculated values, which represent modeled emissions rather than measured data, served as the target variable for surrogate model development. A Random Forest regression model was implemented. The model achieved strong performance in producing the calculated emissions with the test set with cross-validated performance (CV R2 = 0.960 ± 0.022 and CV MAE = 2431 ± 739 MT CO2e). Analysis indicated that data center size was the major predictor, accounting for 79.7% of the total feature importance, while location and operator type contributed 13.6% and 6.6%, respectively. As a localized, preliminary feasibility study, this case study demonstrates that surrogate modeling using only publicly available facility data can provide modeled carbon footprint estimates for infrastructure planning and grid decarbonization efforts. The reproducible methodology can be applied to other metropolitan regions, though generalizability requires further validation with larger datasets.
1. Introduction
Data centers are critical infrastructure for the modern digital economy, supporting cloud computing, internet services, and accommodating the rising computational demands of artificial intelligence. However, their energy consumption and associated carbon emissions are growing rapidly [1,2,3,4]. The International Energy Agency estimates that data centers account for approximately 1% of global electricity demand, with AI workloads accelerating this trend [5] in recent years to match expanding needs. As machine learning (ML) models grow in size and computational intensity, the energy required for both training and inference has become a significant contributor to the carbon footprint of the technology sector [6,7,8].
Despite this growth, few studies have estimated facility-level carbon emissions for major metropolitan regions where most of these facilities are concentrated. The New York City metropolitan area, one of the largest data center markets in the United States, is no exception. Publicly available data on data center facilities is typically limited to square footage, operator type, and general location. Measured energy consumption is rarely disclosed, and operators are not required to report facility-level carbon emissions. This lack of transparency makes it difficult for policymakers, grid operators, and researchers to assess and reduce the carbon footprint of data center infrastructure.
This study addresses this gap by developing and demonstrating a replicable, ML-driven methodology for estimating carbon emissions from data centers using only publicly available facility characteristics. The NYC metropolitan region was selected as the study area because it hosts a high concentration of data centers serving the financial, media, and technology sectors, offers robust publicly available facility data, and is central to ongoing grid-decarbonization efforts in both New York State and New Jersey under the Climate Leadership and Community Protection Act [9] and the Energy Master Plan [10], respectively.
The specific objectives of this investigation are (1) to compile a dataset of data center facilities in the NYC metropolitan region using public sources, including square footage, operator type, and location; (2) to calculate annual CO2e emissions for each facility using standardized industry assumptions (power density, PUE, utilization factor, grid carbon intensity); (3) to implement a Random Forest regression model that predicts estimated emissions from facility characteristics; and (4) to identify which facility characteristics (size, operator type, or location) most strongly influence estimated emissions within the New York Metropolitan area.
This case study responds to the Special Issue by examining how machine learning (ML) applications can advance sustainable infrastructure, while also engaging in interdisciplinary analysis of the ethical and societal implications of deploying ML within critical infrastructure [11].
2. Methods
2.1. Data Collection
A total of 35 data center facilities in the NYC metropolitan area were selected for this pilot study to generate an initial, facility-level understanding of regional emissions patterns. While the region is estimated to contain over 100 data center facilities [12], only 35 had sufficient publicly available information, such as square footage, operator type, and location, necessary for inclusion. Data was collected from operator websites, commercial real estate databases, and industry news publications (Refer to Dataset S1). Facilities were included only if square footage could be reasonably estimated from publicly available sources; those lacking reliable size estimates or with incomplete operator information were excluded. This case study therefore represents the subset of facilities with complete public data, rather than an exhaustive inventory. Each facility was assigned an anonymized identifier (DC-01 through DC-35) to protect commercial sensitivity. General location was recorded as the city or town (e.g., Secaucus, NJ; New York, NY; Brooklyn, NY; Jersey City, NJ). Operator type was categorized based on the facility’s primary business model (Colocation, Cloud, Enterprise, Real Estate & Cloud, National Colocation, or Regional Colocation). Facility size category (Small, Medium, Large, Extra Large) was derived from square footage using the thresholds defined in Table 1. Due to small sample sizes in individual operator subcategories (n = 1–6), facilities were grouped into four broader categories for analysis, as shown in Table 2.
Table 1.
Facility Size Category.
Table 2.
Grouping of operator types for analysis.
2.2. Carbon Emission Calculation
For each facility, annual CO2e emissions were calculated using a standard data center energy estimation methodology (Box 1) based on industry standard assumptions [6]. These calculated values served as the target variable for ML-assisted estimation. The calculation followed a five-step process.
Box 1. Step-by-Step Emission Calculation.
Step 1: IT Load Calculation IT Load (kW) = (Square Footage × Power Density)/1000
IT load, defined as the total power consumption of servers, storage devices, and networking equipment within each facility, was estimated by multiplying facility square footage by a standard power density of 150 W/ft2, then converting to kilowatts.
Step 2: Annual IT Energy Calculation
IT Energy (kWh/year) = IT Load (kW) × 8760 h/year × Utilization Factor
Step 3: Total Facility Energy Calculation
Total Energy (kWh/year) = IT Energy × PUE
Step 4 Unit Conversion Total Energy (MWh/year) = Total Energy (kWh/year)/1000.
Step 5: Carbon Emission Calculation
CO2e (metric tons) = Total Energy (MWh) × Grid Carbon Intensity
Several key assumptions were applied consistently across all 35 facilities. Power density was set at 150 W/ft2, the industry standard for multi-tenant colocation facilities [13]. A utilization factor of 0.7 was used, reflecting typical average server utilization in colocation environments [14]. For colocation facilities, Power Usage Effectiveness (PUE) values were assigned within the industry average range of 1.40 to 1.50 depending on facility age and operator [15,16,17,18]. Thus, colocation facilities were assigned PUE values of 1.45, consistent with industry averages for multi-tenant facilities [15,16,17,18]; The single cloud hyperscale facility (DC-10) was assigned a PUE of 1.09, based on Google’s reported global fleet average [19]. Enterprise and Real Estate & Cloud facilities were assigned PUE = 1.50 and 1.40, respectively, reflecting typical values for their facility types. Where exact PUE values were not publicly available, the typical PUE for their operator type was used for data centers.
For grid carbon intensity, we applied location specific factors reflecting the actual grid territories serving each facility. Facilities located in New York City and its suburbs (e.g., New York, NY; Brooklyn, NY; Staten Island, NY; Elmsford, NY; Orangeburg, NY) are served by the NYISO Zone J grid and were assigned a carbon intensity of 0.209 MT CO2e/MWh. This value corresponds to the NYISO (New York Independent System Operator) Zone J (New York City) marginal emission rate for the 2024–2029 Local Law 97 compliance period [20]. Data centers in New Jersey are served by the PJM (Pennsylvania-New Jersey-Maryland) grid, which generally has higher carbon intensity than NYISO Zone J [21]. Facilities located in New Jersey (e.g., Secaucus, NJ; Jersey City, NJ; Carteret, NJ; Princeton, NJ; East Windsor, NJ; Piscataway, NJ; Somerset, NJ; Totowa, NJ; Carlstadt, NJ) are assigned a carbon intensity of 0.391 MT CO2e/MWh, reflecting the average PJM marginal emission rate [21]. This approach ensures that the calculated emissions accurately reflect the regional grid differences between New York and New Jersey.
2.3. Surrogate Modeling Framework (Random Forest)
While the carbon calculation formula (Box 1) is deterministic, direct application requires facility-specific PUE values, which are often not publicly available. The Random Forest surrogate model provides two practical advantages: (a) it can estimate emissions for facilities with missing PUE data using other facility characteristics (size, operator type, location); and (b) it can be extended to regions where operator-specific PUE values are unknown. This is not a predictive model in the traditional sense, predicting real-world measured emissions, but a computational surrogate that approximates the calculation formula using publicly available facility characteristics.
Random Forest was selected as the primary model for its robustness with small datasets, ability to handle categorical features without extensive preprocessing, intrinsic feature importance calculation, and resistance to overfitting relative to single decision trees [7,8,22]. To assess the robustness of the surrogate modeling approach, we compared the Random Forest against four alternative models: Ridge regression (a linear model with L2 regularization), Gradient Boosting (an ensemble of weak learners), Polynomial Ridge (ridge with polynomial features to capture nonlinearity), and Support Vector Regression (SVR) with an RBF kernel. These models were chosen to represent a range of complexity, from simple linear (Ridge) to nonlinear (Gradient Boosting), and to assess whether the Random Forest provides any advantage over simpler approaches. All models were evaluated using 5-fold cross-validation (CV) to ensure consistent comparison (results reported in Section 3.2). Alternative models were implemented with default scikit-learn parameters to maintain a fair comparison.
A Random Forest regression model was employed using Python (version 3.9) with the scikit-learn library (version 1.0.2) [22].
Features (Inputs):
Size Category (categorical): Small, Medium, Large, Extra Large (Table 1).
Operator Type (categorical): Colocation, Cloud, Enterprise, Real Estate & Cloud (Table 2).
General Location (categorical): Extracted from address information (e.g., Secaucus, NJ; New York, NY; Brooklyn, NY; Jersey City, NJ; Elmsford, NY).
Target (Output): Calculated annual CO2e emissions (metric tons).
Model Configuration:
- Number of trees: 100 (n_estimators = 100).
- Random state: 42 (for reproducibility).
- Minimum samples per split: 2 (min_samples_split = 2).
- One-hot encoding applied to all categorical features using ColumnTransformer and OneHotEncoder to convert categorical variables into binary indicator variables.
Model performance was evaluated using 5-fold cross-validation (CV) on the full dataset of 35 facilities. This approach provides a more robust assessment of model generalizability than a single train–test split by averaging performance across multiple data partitions (results reported in Section 3.2).
Evaluation Metrics: Model performance was assessed using the coefficient of determination (R2), which measures the proportion of variance in the target variable explained by the model (values close to 1 indicate better fit), and the Mean Absolute Error (MAE), which quantifies the average prediction error in the original units (MT CO2e). These metrics provide complementary information: R2 assesses overall model fit, while MAE provides an interpretable measure of prediction accuracy.
Feature Importance: Feature importance was calculated using the Random Forest algorithm’s built-in importance measure, which tracks how much each feature reduces prediction error across all trees. Importance scores were then grouped by original feature categories (Size Category, Operator Type, General Location).
2.4. Statistical Analysis and Visualization
All descriptive statistics and visualizations were generated using Python with matplotlib (version 3.5.0) and seaborn (version 0.11.2). Descriptive statistics included calculation of total, mean, median, standard deviation, and range of estimated CO2e emissions across the 35 facilities. Geographic concentration was assessed by aggregating emissions by general location. The Pareto principle (80/20 rule) was evaluated through cumulative contribution analysis. Histogram skewness was calculated using the scipy.stats library. All confidence intervals are reported at the 95% level where applicable.
3. Results
3.1. Descriptive Statistics
Total calculated CO2e emissions for the 35 facilities were 1,870,581 MT annually. The average emissions were 53,445 MT (SD = 38,386 MT). Emissions ranged from a minimum of 2786 MT (DC-19) to a maximum of 150,926 MT (DC-26), representing a 54-fold difference between the smallest and largest emitters. The 95% confidence interval for the mean was [40,259–66,631 MT]. Table 3 summarizes the statistics for calculated carbon emissions across 35 data centers.
Table 3.
Summary statistics for calculated emissions across 35 facilities.
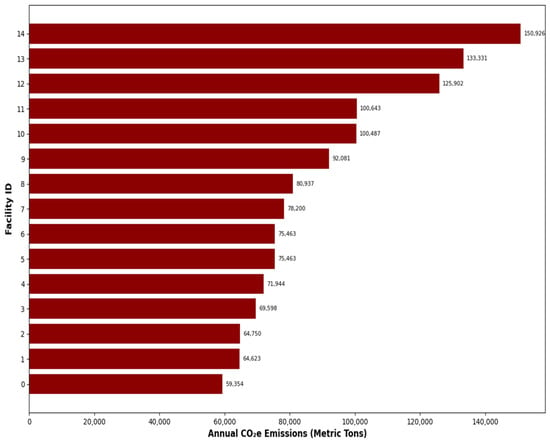
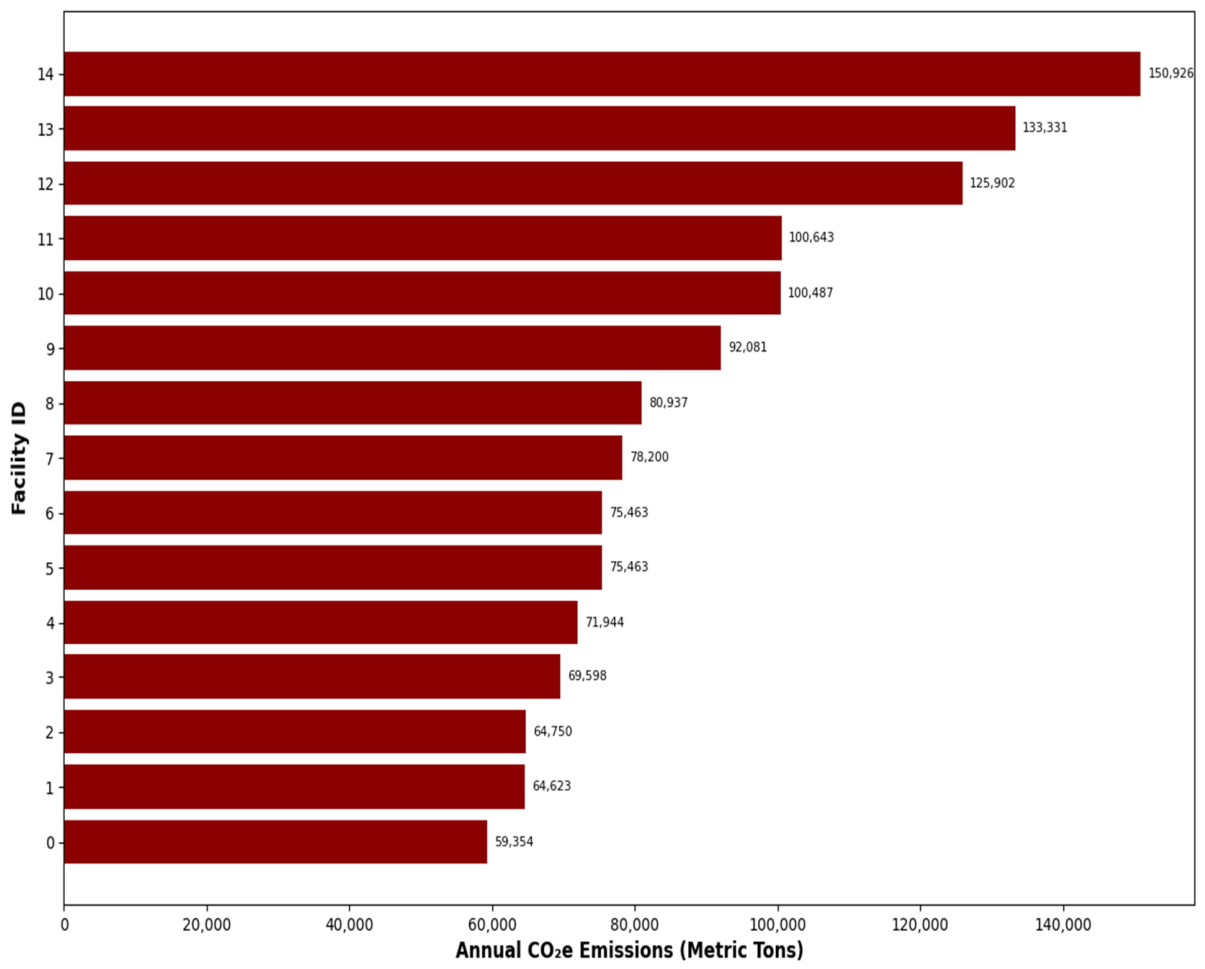
Figure 1 presents a horizontal bar chart ranking the 15 highest-emitting data center facilities in the NYC metropolitan region in descending order of annual CO2e emissions. Emissions among the top facilities range from 59,354 to 150,926 metric tons CO2e per year. The largest emitter, DC26, produces 150,926 MT CO2e annually, followed by DC6 (133,331 MT), DC29 (125,902 MT), and DC23 (100,643 MT). The fifth-highest emitter, DC17, contributes 100,487 MT CO2e, with emissions declining gradually across subsequent facilities rather than exhibiting a sharp drop-off. Altogether, the top five facilities contribute 611,289 MT CO2e annually, representing a substantial share of total regional emissions. This indicates a moderate concentration pattern, where large facilities play a significant role, but emissions remain distributed across multiple sites.
Figure 1.
Top 15 Data Center Facilities by Estimated Carbon Emissions.
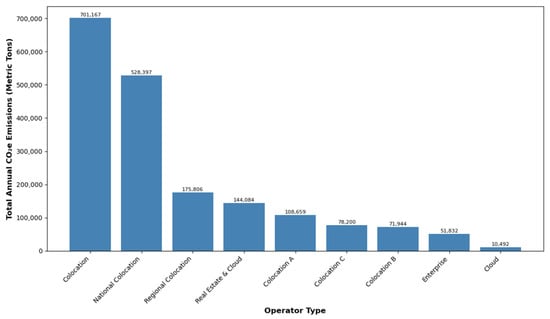
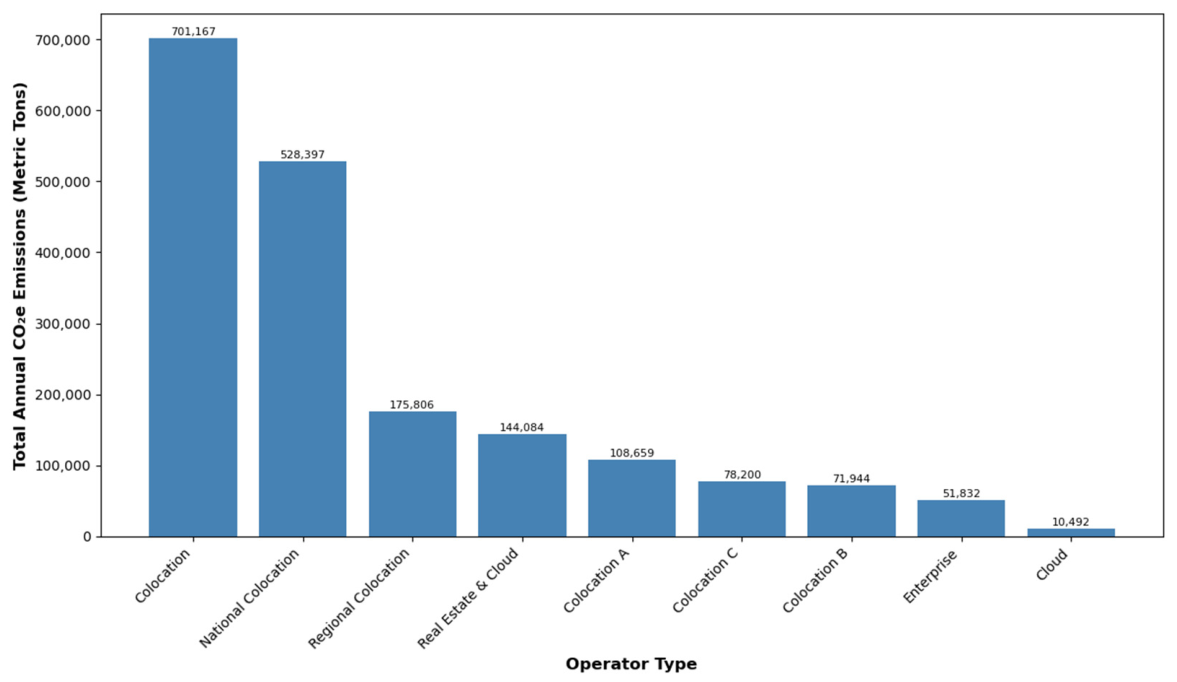
Figure 2 displays total emissions aggregated by operator type. Colocation facilities collectively account for many emissions (88.9% of the regional total), reflecting both their prevalence (28 of 35 facilities, 80%) and the presence of large-scale colocation centers. The single cloud hyperscale facility (DC-10) contributes only 10,492 MT CO2e (0.6% of total), despite having a medium size category (50,000 sq ft). This disproportionately low emission intensity is attributable to its superior PUE (1.09) compared to the colocation average (1.45), a finding consistent with industry reports on cloud provider efficiency [19]. Enterprise and Real Estate & Cloud facilities contribute approximately 2.8% and 7.7% of total emissions, respectively.
Figure 2.
Carbon Emissions by Operator Type.(each number indicate corresponding operator type.
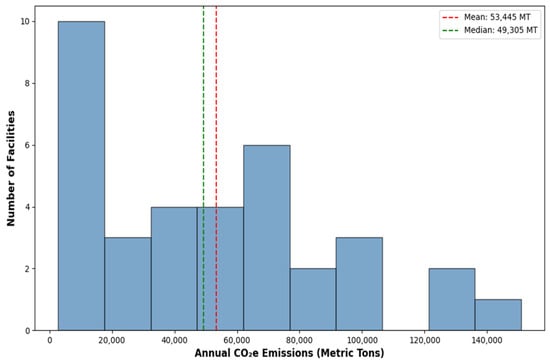
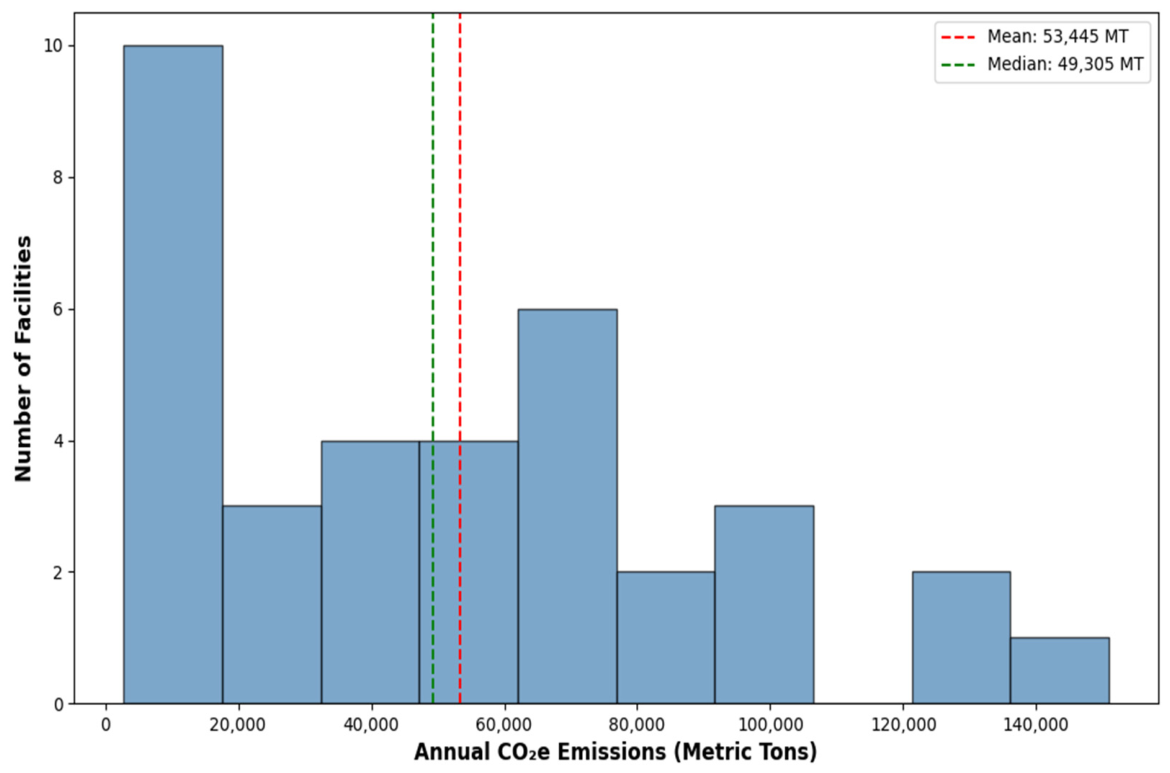
Figure 3 displays the distribution of annual CO2e emissions across 35 NYC-metro data centers. The distribution is right-skewed (skewness = 1.6, 95% CI: [0.9–2.3]), indicating that a small number of very high-emitting facilities form a long right tail, while most facilities emit at moderate or relatively low levels. Consistent with this skew, the mean (53,445 MT) is slightly higher than the median (49,305 MT), reflecting the upward pull of the highest-emitting sites. In the figure, the red dashed line marks the mean, and the green dashed line marks the median. This right-skewed distribution indicates that a subset of higher-emitting facilities contributes disproportionately to total emissions, a common pattern in infrastructure systems.
Figure 3.
Distribution of Carbon Emissions Across 35 NYC Data Centers.
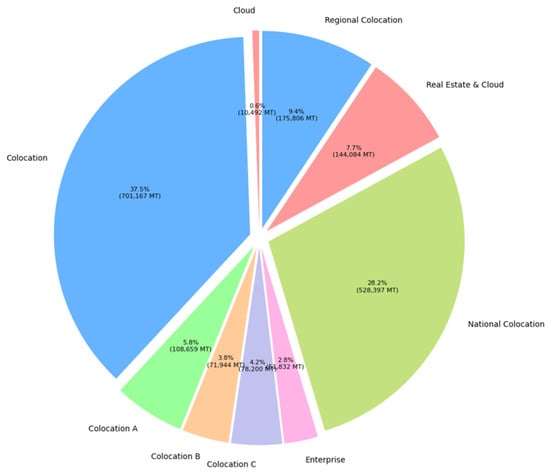
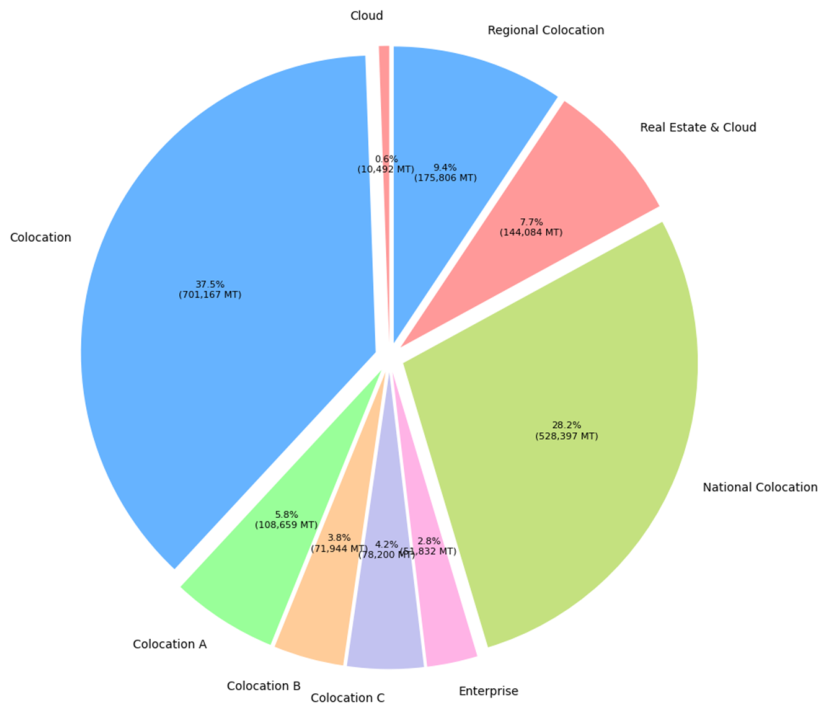
Figure 4 visualizes the proportional contribution of each operator type to total emissions as a pie chart. Colocation facilities dominate the regional carbon footprint (88.9%), while Real Estate & Cloud (7.7%), Enterprise (2.8%), and Cloud (0.6%) contribute to smaller shares. This figure reinforces the findings from Figure 2, providing a visual representation of emissions concentration by operator category. The dominance of colocation facilities in our sample reflects both their numerical majority and their average facility size, which tends to be larger than enterprise or cloud facilities in the dataset.
Figure 4.
Distribution of Total Carbon Emissions by Operator Type.
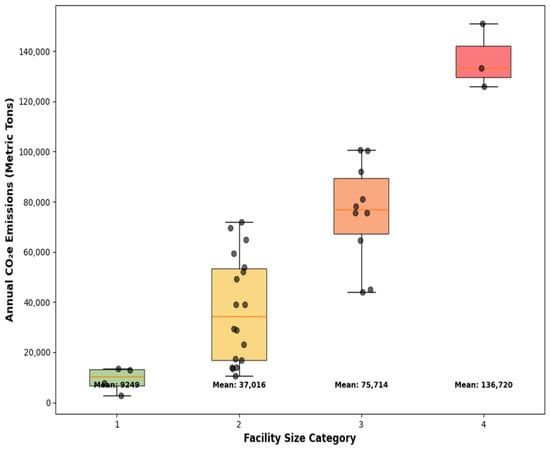
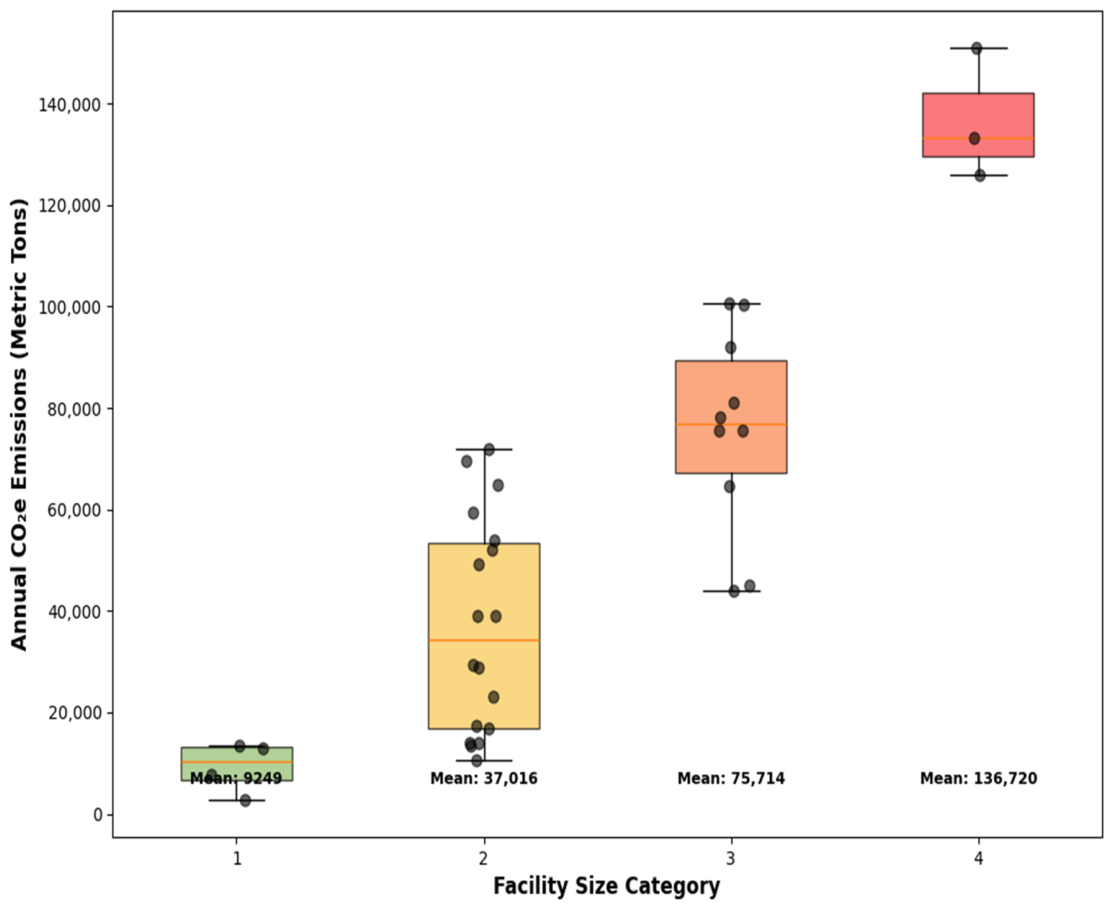
Figure 5 presents box plots of annual CO2e emissions for 35 NYC-metro data centers grouped into four size categories (Small, Medium, Large, Extra Large).
Figure 5.
Distribution of Carbon Emissions by Facility Size Category.
Boxes show interquartile range (IQR), horizontal lines indicate medians, whiskers extend to 1.5 × IQR, and jittered points show individual facility emissions. Mean values are annotated below each category. Medium facilities (n = 18) display a wide distribution relative to their median (~40,000 MT). This within-category variation likely reflects differences in power usage effectiveness (PUE)—ranging from 1.09 for the single cloud facility to 1.40–1.50 for colocation facilities—as well as variation in actual utilization rates (vs. the assumed 0.7 factor), cooling technology (air-cooled vs. liquid-cooled), facility age, and equipment efficiency. In contrast, the Small (n = 4), Large (n = 10), and Extra Large (n = 3) categories show narrower relative spreads, suggesting greater operational homogeneity within those size groupings. Extra Large facilities (n = 3) exhibit the highest median emissions (≈130,000 MT CO2e), consistent with their substantially greater operational scale. Large facilities (n = 10) also show elevated emissions, with values spanning roughly 40,000–100,000 MT. Small facilities (n = 4) have the lowest emissions overall, reflecting their smaller physical and energy footprints, though some variation is still present.
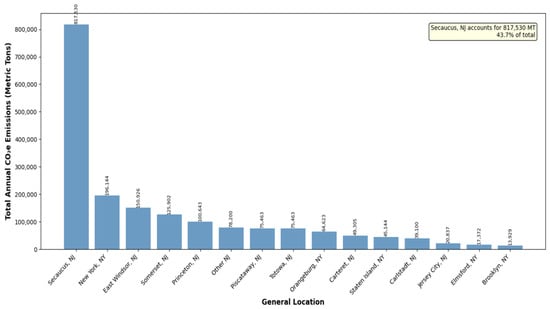
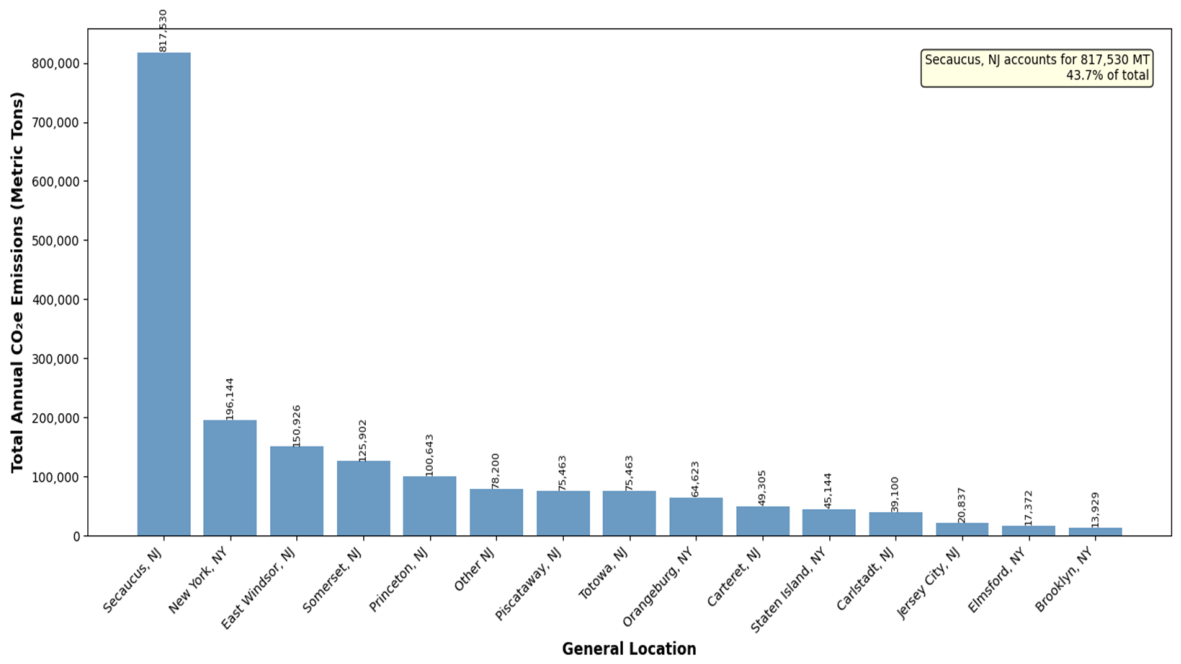
Figure 6 displays total estimated CO2e emissions aggregated by general geographic location, with facility counts (n) shown above each bar. Facilities located in Secaucus, New Jersey, account for 11 of 35 facilities (31%) and contribute approximately 44% of total regional emissions. This concentration appears to be driven by the clustering of large colocation facilities in this area, which historically developed as a major connectivity hub for the NYC metropolitan region due to its proximity to Manhattan and favorable tax and energy policies in New Jersey [23]. New York City data centers (Manhattan, Brooklyn, Staten Island) collectively account for approximately 22% of total emissions, while data centers in other New Jersey locations (Carteret, Princeton, East Windsor, Piscataway, Somerset, Totowa, Carlstadt) contribute about 34%.
Figure 6.
Carbon Emissions by Geographic Location.
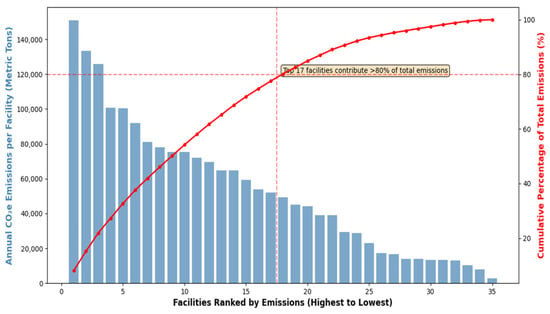
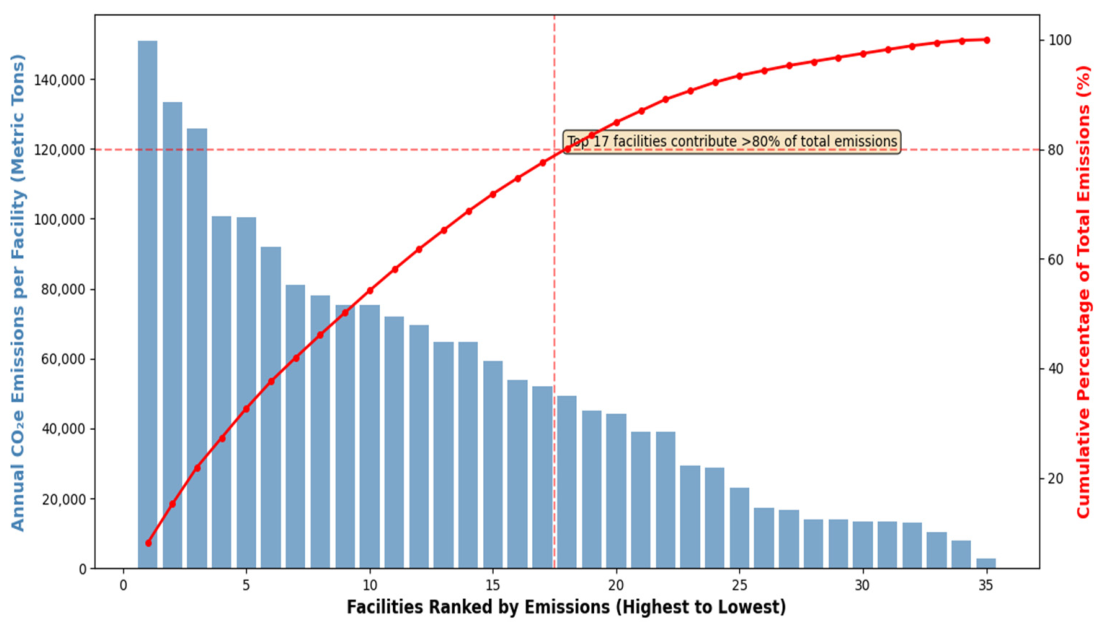
Figure 7 presents a Pareto analysis of annual CO2e emissions across 35 NYC metro data centers. Individual facility emissions are shown as descending blue bars (left axis), while the red line represents the cumulative percentage contribution to total emissions (right axis). The horizontal dashed line marks the 80% cumulative threshold, and the vertical dashed line indicates the facility rank at which this threshold is reached. Unlike a highly skewed Pareto distribution, the cumulative curve increases steadily rather than sharply. The 80% threshold is reached at approximately the 18th ranked facility, indicating that roughly 17 out of 35 facilities (~49%) are responsible for 80% of total emissions. The top four facilities are indeed the largest individual emitters, but together they contribute only a modest fraction of total emissions (~25%), not 80%. This indicates that emissions are distributed across a broader subset of facilities, rather than being dominated by a very small number of extreme sources. This pattern deviates from the classic 80/20 Pareto principle as the top 17 facilities (49%) account for 80% of emissions, compared to the 20% expected under a classic Pareto distribution, indicating a moderately concentrated emissions profile where nearly half of facilities account for 80% of total emissions. It underscores the need for distributed intervention rather than focusing solely on a few large sources.
Figure 7.
Pareto Analysis.
3.2. Random Forest Prediction Results
To evaluate model performance and stability, we used 5-fold cross-validation (CV) on the full dataset of 35 facilities. The Random Forest achieved mean CV R2 = 0.960 ± 0.022 and CV MAE = 2431 ± 739 MT CO2e (Table 4). We also compared the Random Forest against alternative models, including Ridge regression, Gradient Boosting, Polynomial Ridge, and Support Vector Regression (Table 5). Ridge regression achieved the highest CV R2 (0.995 ± 0.004), followed by SVR (Linear) (0.994 ± 0.004) and Gradient Boosting (0.973 ± 0.016), with Random Forest at 0.960 ± 0.022. This comparison demonstrates that multiple ML approaches produce consistent results, and the choice of algorithm has limited impact on performance in this dataset.
Table 4.
Random Forest model performance metrics.
Table 5.
Model Comparison.
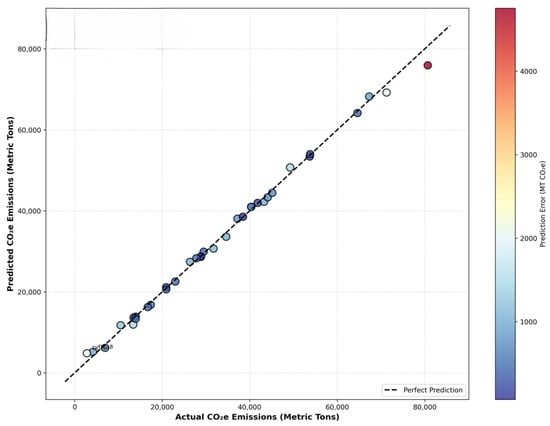
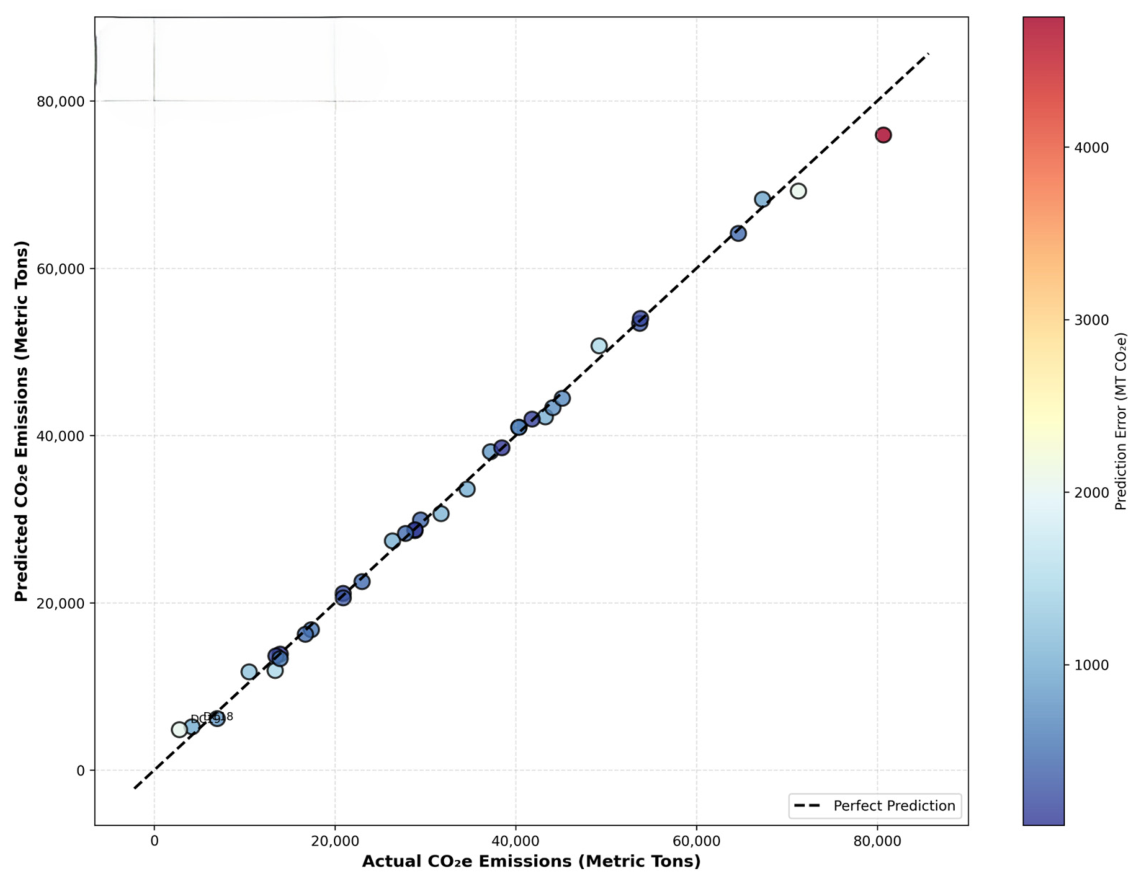
Figure 8 presents the Random Forest model’s performance across 35 data centers by comparing predicted versus calculated CO2e emissions. Calculated emissions are shown on the x-axis and model predictions on the y-axis. The dashed diagonal line represents perfect prediction, where predicted emissions equal calculated emissions. Across the full emissions range (approximately 0–90,000 MT), the model demonstrates strong agreement between predicted and calculated values. Most facilities fall close to the 1:1 line, indicating accurate predictions. Prediction error is represented by color shading, with darker blue indicating smaller errors and lighter or reddish tones indicating larger errors. The high cross-validated (CV) R2 (0.960 ± 0.022) and low MAE (2431 MT CO2e) confirm that the Random Forest model captures the underlying relationship between facility characteristics and emissions. Overall, the plot shows that the model generalizes well and provides reliable emissions estimates, supporting its use for regional emissions estimation when measured data are unavailable.
Figure 8.
Random Forest Model Performance.
3.3. Feature Importance Analysis
Feature importance analysis informs that facility size category was the dominant predictor of estimated emissions in our sample, accounting for 79.7% of the total feature importance (Table 6). General location contributed 13.6%, while operator type contributed 6.6%. Location contributed 13.6% of feature importance, reflecting the geographic concentration of large facilities in Secaucus, NJ, which accounts for 11 of the 35 facilities (31%) and approximately 44% of total calculated emissions in this sample.
Table 6.
Feature importance from Random Forest model (grouped by category).
These percentages sum to 100%, representing the relative contribution of each feature category to the model’s predictive power. This ranking indicates that, within the NYC metropolitan region, emissions scale nearly linearly with facility size. The minor contribution of location suggests that, once size is accounted for, grid carbon intensity differences between utility territories and geographic clustering effects have limited additional explanatory power. In other words, the apparent geographic concentration of emissions in Secaucus (Figure 6) is largely explained by the fact that Secaucus contains a concentration of large data centers, not by unique characteristics of the Secaucus location itself. The finding that operator type contributes only 6.6% reflects two factors. First, colocation facilities (which represent 80% of facilities, 28 of 35) have relatively homogeneous PUE values (1.40–1.50). Second, the single cloud facility (DC-10) has a much lower PUE (1.09) but is only one facility; its influence on the overall importance score is diluted by the sample size imbalance. With only 35 facilities, feature importance values may be unstable and sensitive to sampling. In a larger dataset with more cloud facilities, operator type might emerge as a more important predictor.
4. Discussion
4.1. Summary of Key Findings
This pilot study developed an ML-driven methodology to estimate carbon emissions for 35 data centers in the NYC metropolitan area using only publicly available facility characteristics. The Random Forest model achieved strong performance in producing calculated emissions (CV R2 = 0.960 ± 0.022, CV MAE = 2431 ± 739 MT CO2e) across 5-fold cross-validation, confirming that facility characteristics alone can serve as reliable inputs for the surrogate modeling framework. Analysis of feature importance informed that facility size was the dominant predictor (79.7%), while location (13.6%) and operator type (6.6%) played comparatively minor roles.
A reasonable critique of this study is that facility size emerges as the dominant predictor of calculated emissions. This finding is intuitive, as emissions scale with physical infrastructure. However, the scientific contribution is not the discovery that size matters, but the demonstration that publicly available facility characteristics can serve as a computationally efficient surrogate for detailed emissions modeling. The practical value lies in: (1) Accessibility, the framework uses open data sources; (2) scalability, the same methodology can be applied to other metropolitan regions; (3) rapid assessment, it provides “good enough” estimates for regional screening; and (4) transparency, the framework is fully reproducible. The cross-validation results (Table 5) confirm that the methodology is stable across different data partitions, with multiple ML models producing consistent performance (CV R2 ≈ 0.960–0.995), reinforcing the robustness of the surrogate modeling approach.
Several descriptive findings merit discussion. First, total estimated emissions for the 35 facilities reached 1,870,581 MT CO2e annually. However, contrary to a classic Pareto distribution, the cumulative emissions curve increased steadily, with the top 17 facilities (approximately 49%) contributing 80% of total emissions (Figure 7). This indicates a moderate concentration pattern rather than extreme domination by a very small number of facilities. Emissions reductions will therefore require interventions across a broader set of facilities rather than focusing exclusively on a few extreme emitters. Second, colocation facilities dominate the regional carbon footprint (88.9% of total emissions) in our sample, reflecting both their numerical majority (28 of 35 facilities) and their larger average size. The single cloud facility (DC-10) demonstrated substantially lower emission intensity (PUE = 1.09 vs. colocation average of 1.45), consistent with industry reports on hyperscale efficiency [19]. Third, geographic analysis showed that Secaucus, NJ, accounts for 11 of 35 facilities (31%) and approximately 44% of total emissions (Figure 6). This concentration appears to be driven by the clustering of large colocation facilities in the area, which historically developed as a major connectivity hub for the NYC metropolitan region due to its proximity to Manhattan, access to fiber infrastructure, and lower land costs compared to urban districts [23]. These patterns suggest that data center emissions are shaped by existing infrastructure and economic factors, not solely by engineering specifications. Although data centers operate outside the public eye, their cumulative emissions can rival those of traditional industries, underscoring the environmental consequences of growing AI workloads and digital activity.
4.2. Interpretation of Feature Importance
The finding that facility size is the dominant predictor (79.7%) is intuitive but important to quantify. The box plot (Figure 5) visually confirms this relationship: emissions increase monotonically across size categories (Small → Medium → Large → Extra Large). However, the substantial spread within the Medium category (n = 18, ranging from approximately 10,000 to 70,000 MT CO2e) and overlap between Medium and Large categories indicates that size alone does not fully determine emissions. Operational factors, including PUE, cooling configuration, utilization rates, and equipment age, contribute to within-category variation. The minor contribution of location (13.6%) suggests that, once size is accounted for, grid carbon intensity differences between NYISO Zone J (New York City) and PJM (New Jersey) have limited additional explanatory power within this region. The observed geographic concentration in Secaucus (Figure 6) is therefore largely explained by the presence of large facilities in that area rather than by unique characteristics of the location itself. Operator type contributed only 6.6%, reflecting the homogeneity of PUE values among colocation facilities (1.40–1.50) and the small number of cloud facilities in the dataset (n = 1). With a larger dataset that includes more cloud facilities, operator type could emerge as a more important predictor. The Random Forest framework is well-suited to capture such shifts as additional data become available. These insights could inform future strategies for reducing data center carbon emissions.
4.3. Limitations and Future Studies
This pilot study has several important limitations that should be considered when interpreting the results. First, all emissions are calculated using standard industry assumptions, not measured from actual energy meters. The absolute values (total 1,870,581 MT CO2e) should be interpreted as estimates rather than precise measurements. The accuracy of the estimates depends on the validity of the assumptions (150 W/ft2 power density, 70% utilization factor, assigned PUE values). Actual emissions for individual facilities may differ substantially depending on specific IT equipment, cooling technology, renewable energy purchases, real-time utilization, and operational practices [24].
Second, the carbon intensity factors applied in this study are specific to the current grid mix. The NYISO Zone J factor (0.209 MT CO2e/MWh) corresponds to the 2024–2029 Local Law 97 compliance period and will expire in 2029, with projected reductions of approximately 50% by 2030 under the Climate Leadership and Community Protection Act [9]. Similarly, the PJM grid is undergoing decarbonization, with increasing renewable energy penetration expected to reduce its carbon intensity over time [21]. This temporal fluidity reflects the broader challenge of carbon accounting in a decarbonizing grid, where emission factors change as the grid mix evolves. Future work should incorporate time-varying carbon intensity factors to capture the dynamic nature of grid emissions. However, the location-specific factors used in this study (NYISO Zone J: 0.209 MT CO2e/MWh; PJM: 0.391 MT CO2e/MWh) accurately reflect the current regional grid differences between New York and New Jersey, ensuring that the absolute emissions estimates for each facility are consistent with its actual utility territory.
Third, the dataset is limited to 35 facilities, representing a sample rather than an exhaustive census of the NYC metropolitan region (which contains over 100 facilities). Data centers in Secaucus, NJ (11 of 35 facilities, 31%) and colocation facilities (28 of 35 facilities, 80%) are overrepresented in the sample. Consequently, the estimated geographic concentration of emissions (Figure 6) and the importance for location and operator type should be interpreted with this sampling bias in mind. While 35 facilities are appropriate for a case study, the Random Forest model’s performance on other metropolitan regions or larger datasets is unknown. Fourth, the high R2 (CV R2 = 0.960 ± 0.022) reflects the model’s ability to reproduce the calculated emissions from facility characteristics. This calculation follows a deterministic formula based on industry assumptions. Validation against measured energy data was beyond the scope of this study and remains an important direction for future research. Fifth, while 5-fold cross-validation provides stable performance estimates, a larger dataset would enable even more precise performance estimates and narrower confidence intervals.
These limitations point to several directions for future work, building on the surrogate modeling framework we have established here:
- We will obtain measured energy data. The most direct next step is to validate our modeled emissions against actual metered data. Access to utility bills or on-site measurements from operators would allow us to test our assumptions and, ideally, train models on real emissions rather than calculated estimates. This would move the approach from a computational approximation toward a more empirically grounded tool.
- We will expand the dataset across regions. Adding data centers from other major hubs like Northern Virginia, Silicon Valley, or Chicago would help determine whether the approach generalizes or captures region-specific patterns. A dataset of 100–200 facilities would also improve the stability of our performance estimates and allow us to include additional features that the current sample size cannot support.
- We will incorporate time-varying grid emission factors. While we currently apply location-specific factors for NYISO and PJM, future work should track how these factors change hourly, daily, or seasonally as the grid mix evolves. This would improve accuracy by capturing the dynamic nature of grid emissions, particularly as renewable energy usage increases and carbon intensity becomes more variable.
- We will incorporate additional facility-level characteristics. There is more we could include if the data were available: facility age (a proxy for PUE and cooling efficiency), cooling technology type (air-cooled, liquid-cooled, free cooling), renewable energy procurement, and IT equipment generation. These details would help us better understand what drives emissions beyond square footage and operator type.
5. Conclusions
This pilot study demonstrates that surrogate modeling using publicly available data can model carbon emissions for 35 NYC-area data centers, with the Random Forest model achieving high performance in reproducing the deterministic calculation formula. Data center size overwhelmingly drives emissions in the modeled calculations (79.7% feature importance), while operator type (6.6%) and location (13.6%) play comparatively minor roles. Emissions are moderately concentrated, with 17 facilities accounting for 80% of the modeled regional footprint, and colocation sites dominating overall impacts. These findings indicate that effective decarbonization will require upgrades across a broad set of large colocation data centers rather than targeting only a few extreme emitters. As a localized, preliminary feasibility study, the reproducible methodology can be applied to other metropolitan regions, though the generalizability of the findings requires further validation with larger, more representative datasets and, ideally, measured emissions data.
Supplementary Materials
The following supporting information can be downloaded at https://www.mdpi.com/article/10.3390/aieng1020007/s1, Dataset S1: Complete facility-level data for 35 NYC metro data centers (nyc_datacenter_35_facilities.csv). The underlying dataset linking anonymized IDs to facility names is available from the corresponding author upon reasonable request; Code S1: Python script for generating figures; Code S2: Python script for 5 CV; Results S1: All figures.
Author Contributions
Conceptualization, J.K.; methodology, J.K.; software, J.J.S.; validation, J.J.S.; formal analysis, J.K.; investigation, J.J.S.; resources, J.J.S.; data curation, J.J.S.; writing—original draft preparation, J.K.; writing—review and editing, J.K. and J.J.S.; visualization, J.J.S.; supervision, J.K. All authors have read and agreed to the published version of the manuscript.
Funding
This research received no external funding.
Institutional Review Board Statement
Not applicable.
Informed Consent Statement
Not applicable.
Data Availability Statement
The original dataset linking anonymized facility identifiers (DC-01 through DC-35) to specific operator names and exact addresses cannot be made publicly available due to commercial sensitivity and confidentiality concerns. However, the fully anonymized dataset (including general location, operator type, square footage, calculated energy, and calculated CO2e emissions) is provided as Supplementary Materials (Dataset S1). The anonymized facility identifiers allow replication of all analyses in this paper without disclosing proprietary information. All Python code used for data processing, statistical analysis, figure generation (Figure 1, Figure 2, Figure 3, Figure 4, Figure 5, Figure 6, Figure 7 and Figure 8), and Random Forest modeling and Cross validation are provided as Supplementary Materials (Codes S1–S3). Requests for additional data should be directed at the corresponding author.
Acknowledgments
During the preparation of this manuscript, the authors used GitHub Copilot (version 1.2.0) and Claude (Anthropic, version 3.5 Sonnet) for assistance with Python code generation, including the Random Forest model implementation and figure generation scripts (Figure 1, Figure 2, Figure 3, Figure 4, Figure 5, Figure 6, Figure 7 and Figure 8). The authors have reviewed and edited all code output and take full responsibility for the content of this publication.
Conflicts of Interest
The authors declare no conflicts of interest.
Abbreviations
The following abbreviations are used in this manuscript:
| AI | Artificial Intelligence |
| CI | Confidence Interval |
| CO2e | Carbon dioxide emission |
| CV | Cross-validation |
| DC | Data Center |
| IQR | Interquartile Range |
| IT | Information Technology |
| kW | kilowatts |
| MAE | Mean Absolute Error |
| ML | Machine Learning |
| MT | Metric Tons |
| NJ | New Jersey |
| NY | New York |
| NYC | New York City |
| NYISO | New York Independent System Operator |
| PJM | Pennsylvania-New Jersey-Maryland |
| PSE&G | Public Service Electric and Gas Company |
| PUE | Power Usage Effectiveness |
| RBF | Radial Basis Function |
| RMSE | Root Mean Square Error |
| SD | Standard Deviation |
| SVR | Support Vector Regression |
| XGBoost | eXtreme Gradient Boosting |
References
- Mytton, D.; Ashtine, M. Sources of data center energy estimates: A comprehensive review. Joule 2022, 6, 2032–2056. [Google Scholar] [CrossRef] [Scilit]
- Alben, J. Computing in the Era of Generative AI. In Proceedings of the 2024 IEEE International Solid-State Circuits Conference (ISSCC), San Francisco, CA, USA, 18–22 February 2024; IEEE: New York, NY, USA, 2024; Volume 67, pp. 26–28. [Google Scholar] [CrossRef] [Scilit]
- Aljbour, J.; Wilson, T.; Patel, P. Powering Intelligence: Analyzing Artificial Intelligence and Data Center Energy Consumption. Electric Power Research Institute, May 2024. Available online: https://www.epri.com/research/products/000000003002028905 (accessed on 10 May 2026).
- Allsup, M. Microsoft Says Georgia May Be Overestimating Data Center Load Growth. Latitude Media, 12 April 2024. Available online: https://www.latitudemedia.com/news/microsoft-says-georgia-may-be-overestimating-data-center-load-growth (accessed on 10 May 2026).
- International Energy Agency. Data Centres and Data Transmission Networks; IEA: Paris, France, 16 April 2026; Available online: https://www.iea.org/energy-system/buildings/data-centres-and-data-transmission-networks (accessed on 5 May 2026).
- Strubell, E.; Ganesh, A.; McCallum, A. Energy and Policy Considerations for Deep Learning in NLP. arXiv 2019, arXiv:1906.02243. [Google Scholar] [CrossRef] [Scilit]
- Sim, T.; Ryu, S.; Lee, D.; Lee, S.; Chun, C.J.; Moon, H. A machine learning ensemble framework based on a clustering algorithm for improving electric power consumption performance. Sci. Rep. 2025, 15, 40172. [Google Scholar] [CrossRef] [Scilit] [PubMed]
- Yang, B.; Gül, M.; Chen, Y. Comparative analysis of deep learning and tree-based models in power demand prediction: Accuracy, interpretability, and computational efficiency. J. Build. Phys. 2025, 49, 127–169. [Google Scholar] [CrossRef] [Scilit] [PubMed]
- The New York Climate Leadership and Community Protection Act. Available online: https://climate.ny.gov/ (accessed on 5 May 2026).
- The New Jersey Energy Master Plan. Available online: https://www.nj.gov/emp/ (accessed on 10 May 2026).
- MDPI. AI for Engineering: Special Issue: Machine Learning Applications for Sustainable Infrastructure and Hydrological Modeling. 2026. Available online: https://www.mdpi.com/journal/aieng/special_issues/4Y9YO6G4P8 (accessed on 26 April 2026).
- CBR. North America Data Center Trends H1 2025. CBRE Research. Available online: https://www.cbre.com/insights/reports/north-america-data-center-trends-h1-2025 (accessed on 10 May 2026).
- Shehabi, A.; Smith, S.J.; Horner, N.; Azevedo, I.; Brown, R.; Koomey, J.; Masanet, E.; Sartor, D.; Herrlin, M.; Lintner, W. United States Data Center Energy Usage Report; Lawrence Berkeley National Laboratory: Berkeley, CA, USA, 2016. [Google Scholar]
- Koomey, J.G. Growth in Data Center Electricity Use 2005 to 2010; Analytics Press: Oakland, CA, USA, 2011; Available online: https://www.scribd.com/document/379045320/koomeydatacenterelectuse2011finalversion (accessed on 26 April 2026).
- Power Usage Effectiveness (PUE). Available online: https://www.azuraconsultancy.com/power-usage-effectiveness-pue-trends-in-data-centers/ (accessed on 12 May 2026).
- Brady, G.; Kapur, N.; Summers, J.L.; Thompson, H.M. A case study and critical assessment in calculating power usage effectiveness for a data centre. Energy Convers. Manag. 2013, 76, 155–161. [Google Scholar] [CrossRef] [Scilit]
- Cader, T. Green Grid Data Center Power Efficiency Metrics: Pue and Dcie. Available online: https://www.thegreengrid.org/resources/library-and-tools (accessed on 12 May 2026).
- The Green Grid. Carbon Usage Effectiveness (CUE): A Green Grid Data Center Sustainability Metric. Available online: https://www.nlyte.com/blog/understanding-and-calculating-carbon-usage-effectiveness-cue-in-data-centers/ (accessed on 10 May 2026).
- Google. Google Environmental Report 2025. Google Data Centers. Available online: https://sustainability.google/reports/google-2025-environmental-report/ (accessed on 12 May 2026).
- New York City Department of Buildings. Local Law 97 of 2019: Compliance Guidelines for Data Centers; NYC DOB: New York, NY, USA; Available online: https://accelerator.nyc/ll97 (accessed on 12 May 2026).
- PJM Interconnection (Pennsylvania-New Jersey-Maryland). Available online: https://www.ferc.gov/industries-data/electric/electric-power-markets/pjm (accessed on 12 May 2026).
- Breiman, L. Random forests. Mach. Learn. 2001, 45, 5–32. [Google Scholar] [CrossRef] [Scilit]
- Data Center Map: New York Metro Area. Available online: https://www.datacentermap.com/usa/new-york/new-york/ (accessed on 12 May 2026).
- Masanet, E.; Shehabi, A.; Lei, N.; Smith, S.; Koomey, J. Recalibrating global data center energy-use estimates. Science 2020, 367, 984–986. [Google Scholar] [CrossRef] [Scilit] [PubMed]

Disclaimer/Publisher’s Note: The statements, opinions and data contained in all publications are solely those of the individual author(s) and contributor(s) and not of MDPI and/or the editor(s). MDPI and/or the editor(s) disclaim responsibility for any injury to people or property resulting from any ideas, methods, instructions or products referred to in the content. |
© 2026 by the authors. Licensee MDPI, Basel, Switzerland. This article is an open access article distributed under the terms and conditions of the Creative Commons Attribution (CC BY) license.