Article

Transforming Spent Railroad Ties into High-Value Biochar: A Sustainable Solution for Phosphorus and Nitrate Removal in Water Treatment

by
Shariat Mobasser
1,2,3,
Tosin O. Olanrewaju
2,3,
Chad T. Jafvert
1,4,5,
Cliff Johnston
1,6 and
Abigail S. Engelberth
1,2,3,*
1
Institute for a Sustainable Future, Purdue University, West Lafayette, IN 47907, USA
2
Department of Agricultural and Biological Engineering, Purdue University, West Lafayette, IN 47907, USA
3
Laboratory of Renewable Resources Engineering, Purdue University, West Lafayette, IN 47907, USA
4
Lyles School of Civil Engineering, Purdue University, West Lafayette, IN 47907, USA
5
School of Sustainability Engineering & Environmental Engineering, Purdue University, West Lafayette, IN 47907, USA
6
Department of Agronomy, Purdue University, West Lafayette, IN 47907, USA
*
Author to whom correspondence should be addressed.
Bioresour. Bioprod. 2025, 1(1), 5; https://doi.org/10.3390/bioresourbioprod1010005
Submission received: 1 August 2025 / Revised: 19 September 2025 / Accepted: 20 September 2025 / Published: 23 September 2025

Abstract

The growing challenge of managing end-of-life creosote-treated railroad ties, along with the increasing demand for effective water treatment solutions, has highlighted the potential of converting railroad tie biomass into functional biochar through pyrolysis. Pyrolysis temperatures ranging from 250 °C to 700 °C were evaluated to determine their influence on biochar yield, physicochemical properties, and adsorption performance for nitrate and phosphate. The findings revealed that increasing pyrolysis temperature enhanced biochar surface area and porosity, reaching 454.9 m2/g at 700 °C. Elemental analyses showed maximum carbonization at 550 °C, with carbon content peaking at 80%, reflecting the development of more stable aromatic structures. SEM and FTIR analyses confirmed these structural changes, including the emergence of extensive pore networks and aromatic frameworks. Biochar produced at 600 °C demonstrated high nitrate (80%) and phosphate (79%) removal efficiencies, following Freundlich isotherm models. Magnesium-modified biochar further improved nitrate adsorption, reaching 90% removal at 5 ppm. Importantly, polycyclic aromatic hydrocarbons in the biochar decreased significantly at higher temperatures, ensuring environmental safety. This work demonstrates the dual environmental benefits of converting hazardous railroad tie waste into value-added biochar for nutrient removal in water treatment applications, offering a sustainable and scalable solution for circular waste management.

Graphical Abstract

1. Introduction

Railroad ties, also known as crossties or sleepers, are fundamental structural components of railway tracks. They play an essential role in maintaining the track gauge, supporting the rail infrastructure, and ensuring stability and alignment [1]. Railroad ties also bear the loads imposed by passing trains to the underlying ballast and subgrade [1]. As such, railroad ties are integral to the structural integrity and performance of rail systems. In the United States alone, over 90% of about 680 million crossties are made of wood, particularly hardwoods treated with creosote [2]. These ties typically have a service life of 2–3 decades, though in favorable environmental conditions, particularly arid climates, their lifespan may extend up to 5 decades [3]. Despite the durability, many ties are often replaced before reaching their maximum lifespan due to operational demands and environmental degradation [4]. Annually, over 20 million creosote-treated wooden railroad ties are decommissioned after decades of service, contributing to a growing stockpile of chemically treated lignocellulosic waste [5].
Creosote, widely used as a waterproofing agent and wood preservative, is a mixture of organic compounds known as polycyclic aromatic hydrocarbons (PAHs), which are considered to be environmentally harmful. Each tie is impregnated with 40 to 175 kg/m3 of creosote to ensure effectiveness over its service life [6]. A portion of the compound may leach into the surrounding environment during service, contaminating soil and groundwater over time. At the end-of-life, significant quantities remain in the wood, presenting a major challenge for environmentally responsible disposal and reuse [7]. Traditionally, spent ties are either incinerated for energy recovery or disposed of in landfills, both of which raise concerns due to air emissions, leachate contamination, and growing environmental restrictions. Consequently, there is an urgent need for sustainable and environmentally responsible strategies to manage this chemically treated lignocellulosic waste stream [7].
In parallel, the emerging bioeconomy faces dual challenges of maximizing resource utilization while minimizing environmental impacts. One critical area of focus is the management of carbon-rich waste streams, requiring sustainable practices that convert waste into valuable materials. End-of-life railroad ties, an underutilized biomass, can be valorized through thermochemical processes such as pyrolysis, offering an effective path to mitigate environmental issues associated with their disposal. The pyrolysis process, characterized by heating biomass in oxygen-limited conditions, effectively transforms these waste materials into biochar, a stable, carbon-rich solid that can serve various roles, including soil amendment and environmental remediation [8,9,10].
Pyrolysis offers multiple advantages for the sustainable reuse of creosote-treated railroad ties, offering both environmental and resource recovery benefits. When ties are pyrolyzed, the creosote is volatized and is condensed into liquid fuel (“bio-oil” or creosote distillate), while the remaining solid biochar retains very little of the original polycyclic aromatic hydrocarbons PAHs [11]. Gonzalez et al. [11] found that pyrolysis at approximately 700 °C reduced extractable PAHs in the solid residue by over 99% compared to the untreated ties, effectively detoxifying the material. The resulting bio-oil has a high energy content, making it suitable as a standalone fuel or as a blend with conventional fuels. The carbon-rich biochar is chemically stable and has many beneficial uses. In fact, biochar produced from pyrolyzed creosote-treated railroad ties under these conditions may meet the criteria for “basic” biochar as defined by the European Biochar Certificate [11]. Thus, pyrolysis not only enables the safe recovery of creosote but also transforms hazardous wood waste into value-added, environmentally friendly biochar.
Biochar is a black carbon produced by heating organic, carbon-rich material to temperatures between 200 °C and 900 °C in an oxygen-limited environment [12]. It possesses a highly porous structure, a large specific surface area, and abundant surface functional groups, including hydroxyl (–OH) and carbonyl (–C=O) groups [13]. These properties allow biochar to adsorb a wide range of contaminants from aqueous environments, including toxic metals and organic pollutants, contributing to its uses as a cost-effective sorbent [14,15,16]. Specifically, biochar often exhibits enhanced cation exchange capacity, which further augments its versatility in environmental applications [17]. Due to these favorable physicochemical properties, biochar has gained significant attention as a sustainable and cost-effective material for water and wastewater treatment [14,15]. Its adsorption capability is strongly influenced by its physicochemical characteristics, which allow for effective retention of dissolved and particulate pollutants [18,19]. While most applications have focused on the removal of organic pollutants, biochar has also demonstrated potential in nutrient removal, specifically targeting nitrogen and phosphorus. Additionally, it is increasingly recognized, particularly as eutrophication stemming from agricultural runoff continues to pose environmental concern [18,19].
However, pristine biochar typically exhibits limited efficiency in adsorbing anionic species such as nitrate (NO3) and phosphate (PO43−), owing to its generally negative surface charge, which inhibits effective adsorption of negatively charged ions [20]. To address these limitations, biochar is frequently modified through chemical or physical methods, such as metal salt impregnation, surface oxidation, or composite formation [21,22]. It introduces positively charged sites that enhance its interaction with anionic contaminants [21,22]. The choice of feedstock, pyrolysis temperature, and subsequent modification processes significantly influence the resulting biochar’s pore structure, surface chemistry, and adsorption performance [22,23]. For instance, the pyrolysis conditions can dictate the porosity and surface area of biochar. Higher-temperature processes yield more hydrophobic and reactive surface characteristics suitable for organic pollutant removal, while lower temperatures result in properties more favorable for inorganic contaminants like nutrients [14,19].
The mechanism underlying nutrient adsorption by biochar is influenced by both the physicochemical properties of the biochar and the surrounding aqueous environment. Adsorption processes typically proceed through three primary stages: (i) physical adsorption, where contaminants are held by van der Waals forces on the biochar surface; (ii) precipitation and complexation, where ions react with functional groups or impregnated metal species; and (iii) pore filling, where contaminants condense within the micropores of the biochar matrix [12]. Comparatively, although other adsorbents such as zeolites, alumina, and polymeric resins have been studied for nutrient removal, biochar presents a more sustainable, low-cost alternative with the added benefit of carbon sequestration [15].
Building on these established adsorption mechanisms, recent research emphasizes the importance of tailoring biochar’s surface characteristics to target specific contaminants under certain environmental conditions. Both chemical and physical modifications have been shown to significantly enhance anionic nutrients like nitrate and phosphate. These advances are particularly promising when applied to waste-derived biochars, which provide a dual environmental benefit by addressing both environmental impact and biomass waste management. In this regard, the valorization of end-of-life materials such as creosote-treated railroad ties through pyrolysis presents an opportunity to convert this waste stream into functional and beneficial sorbent material.
In light of the environmental burden posed by creosote-treated railroad ties and the concurrent need for effective nutrient remediation technologies, this study explores the dual-purpose valorization of end-of-life railroad ties. The specific objectives of this study are to:
(1)
recover creosote and generate an environmentally benign biochar from end-of-life railroad ties using pyrolysis, and
(2)
increase the adsorption capacity of the produced biochar for removing anionic contaminants, specifically nitrate and phosphate, through chemical modification prior to pyrolysis.
By integrating waste management with water and soil pollution control, this work aims to demonstrate a scalable, circular-economy solution to both railroad tie disposal and nutrient pollution in agricultural systems.

2. Materials and Methods

2.1. Biochar Production

In this study, railroad tie biomass was subjected to pyrolysis under controlled, anaerobic conditions. The process yields three primary products, including biochar, a carbon-rich solid; bio-oil, a dark, viscous liquid rich in oxygenated organic compounds; and syngas, a mixture of non-condensable gases.
A programmable tube furnace (Across International, Livingston, NJ USA; STF1200 (1200C Max. Split Tube Furnace with 50 × 600 mm Quartz Tube)), equipped with precise temperature control, was employed for all pyrolysis experiments. To minimize tar condensation on the sample surfaces during thermal treatment, a customized heating profile was developed and applied. Figure 1 outlines the overall experimental workflow, beginning with the collection and size reduction of railroad ties. The biomass was initially chopped into lengths of 1–5 cm and then further milled to a particle size range of 5–10 mm before pyrolysis.
During the pyrolysis, the tube furnace was used as a reactor. Nitrogen gas was introduced at a flow rate of 550 mL/min to purge oxygen before heating. After 2 min of vacuuming, the temperature was increased from 20 °C to 200 °C at a flow rate of 10 °C/min. The temperature was then increased to the target maximum temperature (400, 500, 600, or 700 °C), held for one hour, and subsequently cooled to 200 °C.
Biochar yield is highly dependent on pyrolysis conditions, including temperature, heating rate, and heating time. A temperature ramping study was carried out to assess trade-offs between char and oil production as a function of temperature while also evaluating the release of volatile compounds. Seven grams of shredded railroad ties was added to a ceramic boat and pyrolyzed at 5 °C min−1: heated to 200 °C (held for 40 min), ramped to target maximum temperature (400, 500, 600, or 700 °C) and held for 60 min, then cooled to 200 °C. The temperature ramping study was used to calculate biochar yield, which is an important variable for process efficiency. As the temperature increases, syngas and bio-oil are also produced.
Each condition was tested in one independent pyrolysis run using a separately prepared dry feedstock charge. Because n = 1, results are presented descriptively, and standard error was not computed. Within a run, duplicate weighing were taken to verify balance stability. These were averaged and not treated replication.

2.2. Reagent Preparation

Analytical grade potassium nitrate (KNO3) and potassium dihydrogen phosphate (KH2PO4, MW = 136.09 g/mol) were used as nitrate and phosphate sources, respectively. Both salts were dried at 105 °C for 24 h before use to remove residual moisture. For nitrate stock solution, a 1.6 g of dried KNO3 was weighed and dissolved in deionized (DI) water in a 1 L volumetric flask to obtain 1000 ppm nitrate stock solution. From this, a 100 ppm medium stock solution was prepared by diluting 25 mL of the stock to 250 mL with DI water. Working standards of 1, 2, 4, 6, 8 and 10 ppm were then prepared by serial dilution using the dilution formula. In preparing phosphate stock solution, 0.72 g of dried KH2PO4 was weighed and dissolved in DI water to a final volume of 500 mL, yielding a 500 ppm phosphate stock solution.

2.3. Proximate Analysis Method

Biochar samples were ground and sieved to a particle size range of 100–500 µm. Crucibles and covers were pre-treated by heating at 750 °C for 6 h in a muffle furnace (Lindberg/Blue M 1100, Thermo Fisher Scientific, Ashville, NC, USA), cooled to 105 °C, and stored in a desiccator until use. Proximate analysis of the biochar, including Volatile Matter Content, Ash Content, and Fixed Carbon, was conducted using a modified American Society for Material and Testing (ASTM D1762-84) protocol [24,25].

2.3.1. Moisture Content Method

A crucible containing a known mass of prepared biochar was placed in an oven maintained at 105 °C for 18 h. After heating, the crucible was cooled in a desiccator to room temperature, and the mass of the dried biochar and crucible was recorded. The moisture percentage was calculated using Equation (1):
Moisture % = ( Weight   as   received Weight   after   dryingat   105   ° C ) Weight   as   received × 100

2.3.2. Volatile Matter Content

The muffle furnace was pre-heated to 950 °C. A crucible containing biochar that had been previously dried at 105 °C was placed in the pre-heated furnace and maintained at 950 °C for 10 min. The rapid heating to a high temperature promoted the devolatilization of the organic components in the biochar. After 10 min, the crucible was removed, cooled in a desiccator to room temperature, and weighed. The volatile matter content, VC (%), was calculated using Equation (2) below according to ASTM D1762-84:
VC % = Weight   after   drying     at   105   ° C Weight   after   heating   at   950   ° C Weight   after   drying     at   105   ° C × 100

2.3.3. Ash Content

The same crucible containing the partially combusted biochar was placed back in the muffle furnace and heated at 750 °C for 6 h. This extended heating at a high temperature ensures the complete combustion of all remaining organic material, leaving behind only the inorganic ash residue. After heating, the crucible was cooled in a desiccator to room temperature, and the mass of the residual ash was recorded. The ash percentage, Ash (%), was evaluated using Equation (3):
Ash % = Weight   residues   after   750   ° C Weight   after   drying   at   105   ° C × 100

2.3.4. Fixed Carbon

The fixed carbon content, FC (%), was calculated by difference, representing the non-volatile carbon remaining after accounting for moisture, volatile matter, and ash. The Fixed Carbon content was estimated using Equation (4):
FC % = Weight   after   drying   at   105   ° C Weight   after   heating   at   950   ° C Weight   of   residue   after   heating   at   750   ° C Weight   after   drying   at   105   ° C × 100

2.4. Determining Particle Size Distribution

Sieve analysis was conducted to determine the particle size distribution of the produced biochar following the standards established by the International Biochar Initiative (IBI). A 175 g biochar sample was placed on a stacked series of standard sieves, No 7 (<2.83), 10 (2.83–2), 18 (2–1), 30 (1–0.5), 60 (0.5–0.25), 100 (0.25–0.15), and 200 (0.15–0.075), with a collection pan for <0.075 mm. The stack was agitated on a mechanical shaker, and the material retained on each sieve and in the pan was weighed. The percentage of biochar in each size fraction was estimated relative to the initial sample weight.

2.5. Characterization of Physicochemical Properties

2.5.1. Bulk Density Analysis

The bulk density of the biochar was measured using a Micromeritics AccuPyc II 1340 pycnometer located at Flex Lab, Purdue University, West Lafayette, IN, USA. The analysis was conducted following the standard method ASTM D5550-06 [26]. This method involves using helium gas to determine the volume of a known mass of the biochar sample. The bulk density is then calculated by dividing the mass of the sample by its measured volume.

2.5.2. Elemental Analysis

The elemental composition of the biochar samples was determined using Inductively Coupled Plasma Optical Emission Spectrometry (ICP-OES), ICAP7400 ICP-OES Duo Spectrometer (Thermo Fisher Scientific, Bremen, Germany) following the method described by Singh et al. [24]. Dried and ground samples (200 mg) were acid digested with nitric acid, followed by hydrogen peroxide oxidation. After near-dry evaporation, the digestate was filtered, diluted, and analyzed for elemental concentrations. All equipment were pre-cleaned to avoid contamination, and calibration standards followed to ensure measurement accuracy.
The carbon (C) and nitrogen (N) content of the biochar samples was determined using a FlashEA 1112 Nitrogen and Carbon Analyzer for Soils, Sediments, and Filters (Thermo Fisher Scientific, Milan, Italy). For each biochar sample, approximately 2 mg was weighed and analyzed in triplicate (n = 3) following the instrument’s standard operating procedures.

2.5.3. Brunauer–Emmett–Teller (BET) Surface Area

The specific surface area and pore structure of the biochar were determined using a Micromeritics Brunauer–Emmett–Teller (BET) analyzer (Micromeritics Instrument Corp., Norcross, GA, USA). Prior to the analysis, the biochar was ground to the minimum possible particle size to maximize surface area exposure. A known mass of the ground biochar was then placed in the sample tubes of the analyzer. For samples with an estimated specific surface area greater than 130 m2/g, a degassing step was performed at a mantel temperature of 250 °C with a heating rate of 10 °C/min for 18 h under vacuum. The specific surface area was determined using the Brunauer–Emmett–Teller (BET) method based on the adsorption of nitrogen gas at 77 K, following the guidelines of ASTM Test Method D6556-10 [27] for carbon materials with surface areas exceeding 130 m2/g.

2.5.4. Electrical Conductivity

The electrical conductivity (EC) of the biochar was evaluated using an electrical conductivity meter. The measurements were performed on the same biochar–water suspensions that were prepared for the pH measurements: 1:5, 1:10, and 1:20 ratios after 1 h of shaking, and 1:20 ratio after 24 h of shaking. The EC meter was calibrated using a standard conductivity solution before taking the measurements.

2.5.5. Scanning Electron Microscopy (SEM)

The surface morphology of the biochar produced at different pyrolysis temperatures was observed using both a NOVA SEM (FEI, Hillsboro, OR, USA) and a Teneo SEM (FEI, Hillsboro, OR, USA). The SEM analysis was performed at appropriate accelerating voltages to obtain high-resolution micrographs of the biochar surface. Images were captured at various magnifications to visualize the overall morphology and the detailed surface features, including pore structure and particle shape. All SEM micrographs were prepared with a 100-micrometer scale bar to provide a reference for the size of the observed features.

2.5.6. Functional Group Analysis

The functional groups present on the surface of the biochar samples were identified using a Nicolet 6700FTIR spectrometer (Thermo Fisher Scientific, Madison, WI, USA) equipped with a medium-band liquid nitrogen-cooled MCT Detector and a KBr (Potassium Bromide) Beamsplitter. The Fourier Transform Infrared Spectroscopy (FTIR) spectra were collected over a spectral range of 4000 to 400 cm−1 with a spectral resolution of 4 cm−1. For each sample, 64 scans were obtained, with each scan requiring approximately 34 s. The experiment was conducted according to the method described in the biochar book “A Guide for Analytical Methods” [24]. The FTIR spectrum of the pellet was recorded, and the obtained spectra were analyzed to identify characteristic absorption bands corresponding to different functional groups present on the biochar surface.

2.5.7. Polycyclic Aromatic Hydrocarbon (PAH)

The extraction of polycyclic aromatic hydrocarbons (PAHs) from the biochar samples was performed according to EPA Method 3540C using a mixture of toluene and ethanol in a 1:1 (v/v) ratio as the extraction solvent. Biochar sample was placed in a Soxhlet apparatus and extracted with the solvent mixture for 24 h. The extract was then concentrated, and the prepared biochar extracts were analyzed using a GC Agilent 7820A (Agilent Technologies, Santa Clara, CA, USA). gas chromatograph equipped with a flame ionization detector (FID). A capillary column (Agilent J&W Factor Four VF-17 ms, 30 m × 0.25 mm ID, df = 0.25 µm + 10 m EZ-Guard; Agilent Technologies, Santa Clara, CA, USA) was used for the separation of the PAH compounds. The GC oven temperature program was optimized to ensure separation of the 76 PAH components included in the Restek Mega Mix Standard. The detector temperature was set at 70 °C with a heating rate of 20 °C/min to 280 °C at the rate of 8 °C/min, and to 320 °C at 4 °C/min. A series of calibration standards were prepared from the mixed PAH standard at different concentration levels to allow for the quantification of individual PAH compounds in the biochar extracts. Bio-oil samples, diluted 1:100 with a solvent mixture of DCM and acetone (1:1, v/v), were also analyzed using the same GC-FID method to determine the PAH content in the liquid product of pyrolysis.

2.5.8. Adsorption Isotherm Determination

The adsorption isotherms for the removal of phosphate and nitrate from aqueous solutions by the produced biochar were investigated through a series of batch experiments. For each adsorbate (phosphate and nitrate), different dosages of biochar (0.1, 0.2, 0.3, 0.4, 0.5, and 1 g) were added to separate bottles containing 25 mL of phosphate or nitrate solutions with different initial concentrations (0.2, 0.5, 1, 2, 5, and 10 parts per million (ppm)) at room temperature (25 °C). The bottles were placed on a reciprocating shaker and shaken for 24 h to ensure that the adsorption process reached equilibrium. After shaking, the samples were filtered through 0.45 µm membrane filters to separate the biochar from the aqueous solution. The concentration of phosphate or nitrate remaining in the filtered solution was determined using a Metrohm-Ion chromatograph (Model 940 professional IC Vario two/SeS, Metrohm USA, Riverview, FL, USA). IC sample tubes purchased from Grainger (Lake Forest, IL, USA) were used for this study. Calibration standards for phosphate and nitrate were prepared from custom anion standards purchased from Metrohm (Riverview, FL, USA). The amount of phosphate or nitrate adsorbed by the biochar at equilibrium was calculated based on the difference between the initial and final concentrations of the adsorbate. The adsorption data were then simulated using the Langmuir, Freundlich, and Temkin isotherm models to determine the maximum adsorption capacity and the nature of the adsorption process. The linearized Freundlich adsorption isotherm, as described by El-Assar et al. [28], is given in Equation (5):
ln q e =   ln K F + 1 n ln C e
The linearized Langmuir adsorption isotherm as presented by Unlu and Ersoz [29] is given in Equation (6):
C e q e =   1 α β   + ( 1 β ) C e
The Temkin isotherm Equation as expressed by Sebastian et al. [30] is given by Equation (7):
q e = R T b T   ln A T C e
where qe is the equilibrium adsorption capacity (mg/g), Ce is the equilibrium concentration of the adsorbate (ppm), KF and n are Freundlich constants, α and β are Langmuir affinity constant and theoretical maximum adsorption capacity, R is the gas constant (8.314 J/mol·K), T is the temperature (K), bT is the Temkin constant related to the heat of adsorption, and AT is the Temkin isotherm constant. The parameters of each isotherm model were evaluated from the experimental data using linear regression analysis.

2.5.9. Biochar Modification with Magnesium

Magnesium-enriched biochar was synthesized via wet impregnation followed by pyrolysis. Biomass sourced from railroad ties was air-dried and milled to a particle size of <2 mm using a mechanical grinder. Aqueous solutions of magnesium chloride hexahydrate (MgCl2·6H2O) were prepared at concentrations of 20, 200, 2000, and 20,000 ppm in deionized water (DIW). For each treatment, a known mass of milled biomass was immersed in the respective MgCl2 solution under continuous stirring and allowed to soak overnight at ambient temperature. After impregnation, the mixtures were oven-dried at 80 °C until complete water evaporation was achieved. The dried Mg-treated biomass was then subjected to pyrolysis in a tube furnace (Across International, STF 1200 °C) under a nitrogen atmosphere (flow rate: 550 mL/min). The furnace temperature was ramped at 10 °C/min to a final temperature of 600 °C and maintained for 1 h. The resulting Mg-modified biochars were gently crushed and sieved into two particle size fractions: <0.5 mm and 0.5–1 mm. Selected fractions were repeatedly rinsed with DIW to remove unbound magnesium salts, then oven-dried at 80 °C and stored in sealed containers for subsequent characterization and adsorption experiments.

3. Results and Discussion

3.1. Results of Proximate Analysis

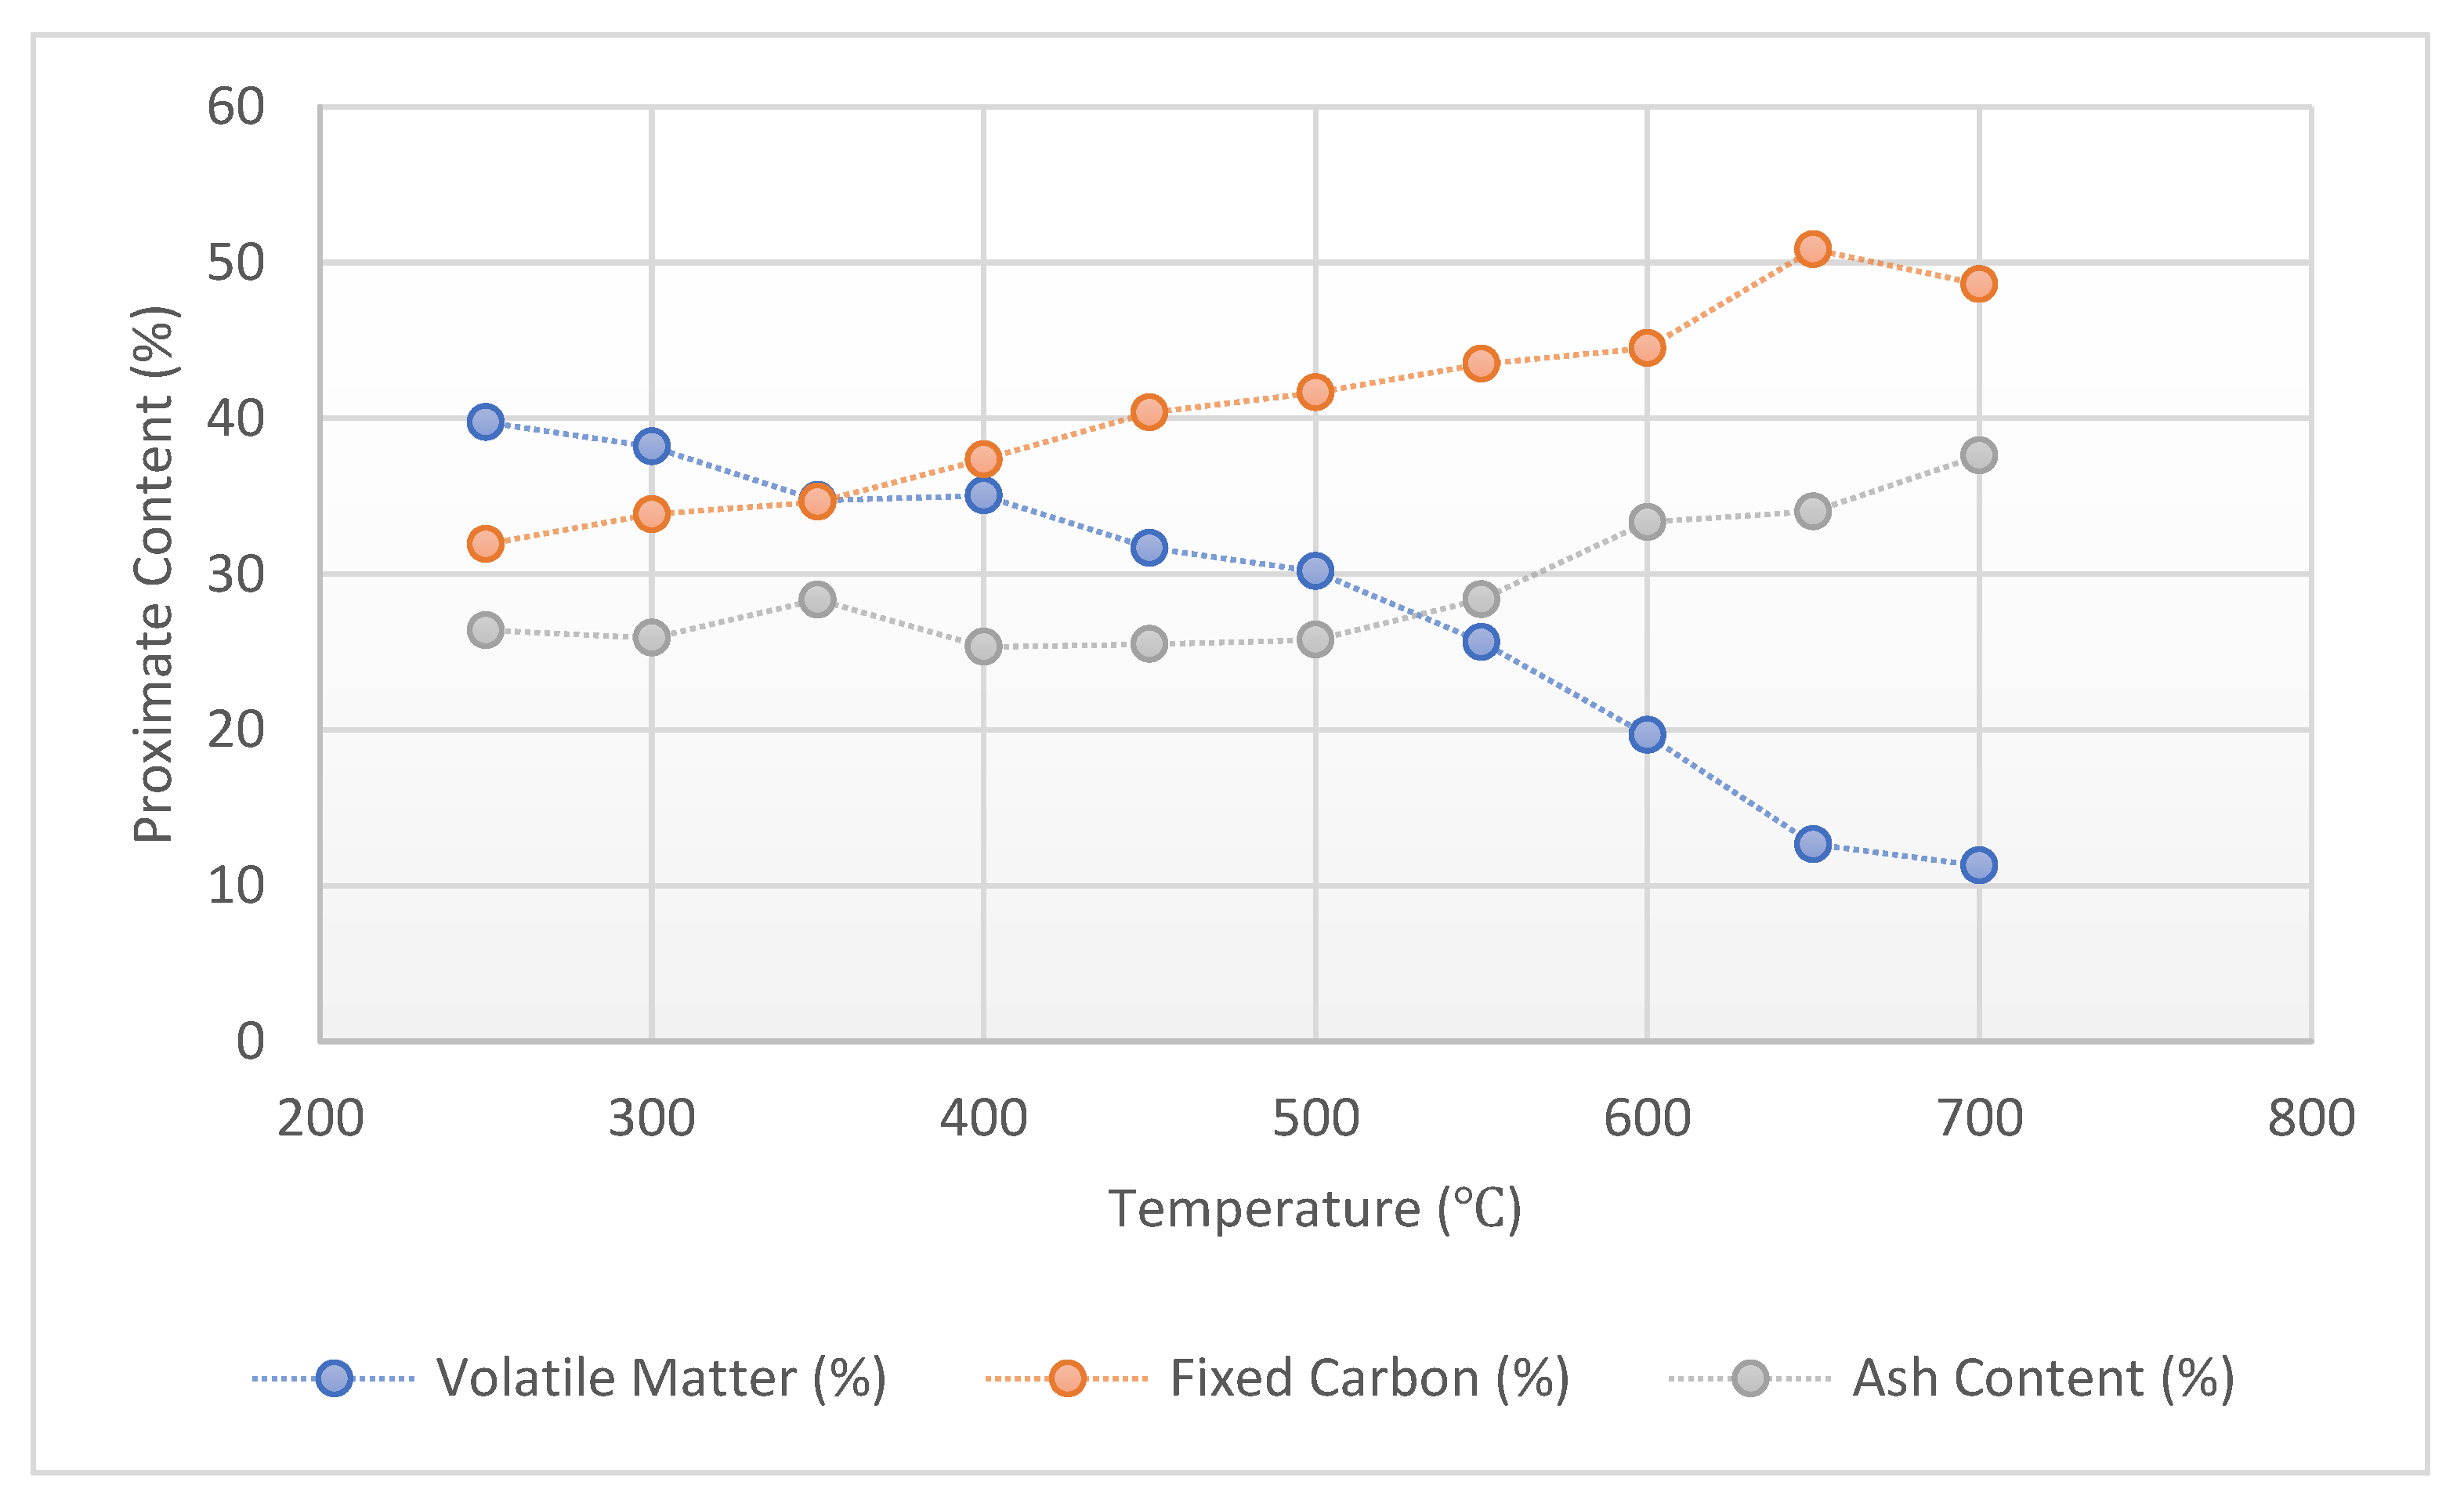
The proximate analysis of railroad tie-derived biochar is presented in Figure 2. As pyrolysis temperature increased from 250 °C to 700 °C, the fixed carbon content also increased from 31.92% to 48.60%, while ash content increased from 26.39% to 37.61%. Concurrently, the proportion of volatile matter decreased significantly. These observations are consistent with established thermochemical behavior during pyrolysis, where elevated temperatures promote devolatilization and moisture loss, thereby enriching the solid residue in fixed carbon and inorganic minerals. Chatterjee et al. [31], for example, reported significantly higher fixed carbon and ash contents, alongside markedly reduced volatile matter, in biochars produced at 600–700 °C. Similarly, Tu et al. [32] observed a consistent decline in volatile matter and char yield, with a corresponding increase in ash content as pyrolysis temperature increased from 300 °C to 700 °C in both straw and wood-derived biochars. Ahn et al. [33] also confirmed this trend, noting that higher pyrolysis temperatures consistently led to reductions in volatile content and enhancements in both fixed carbon and ash. These findings are also corroborated by the review by Tomczyk et al. [34], which summarizes that across various biomass feedstocks, elevated pyrolysis temperatures consistently yield biochars with higher fixed carbon and ash fractions. Collectively, the results indicate that increasing pyrolysis temperature enhances carbonization and mineral concentration in biochar while reducing the presence of thermally labile components.

3.2. Resulting Particle Size Distribution

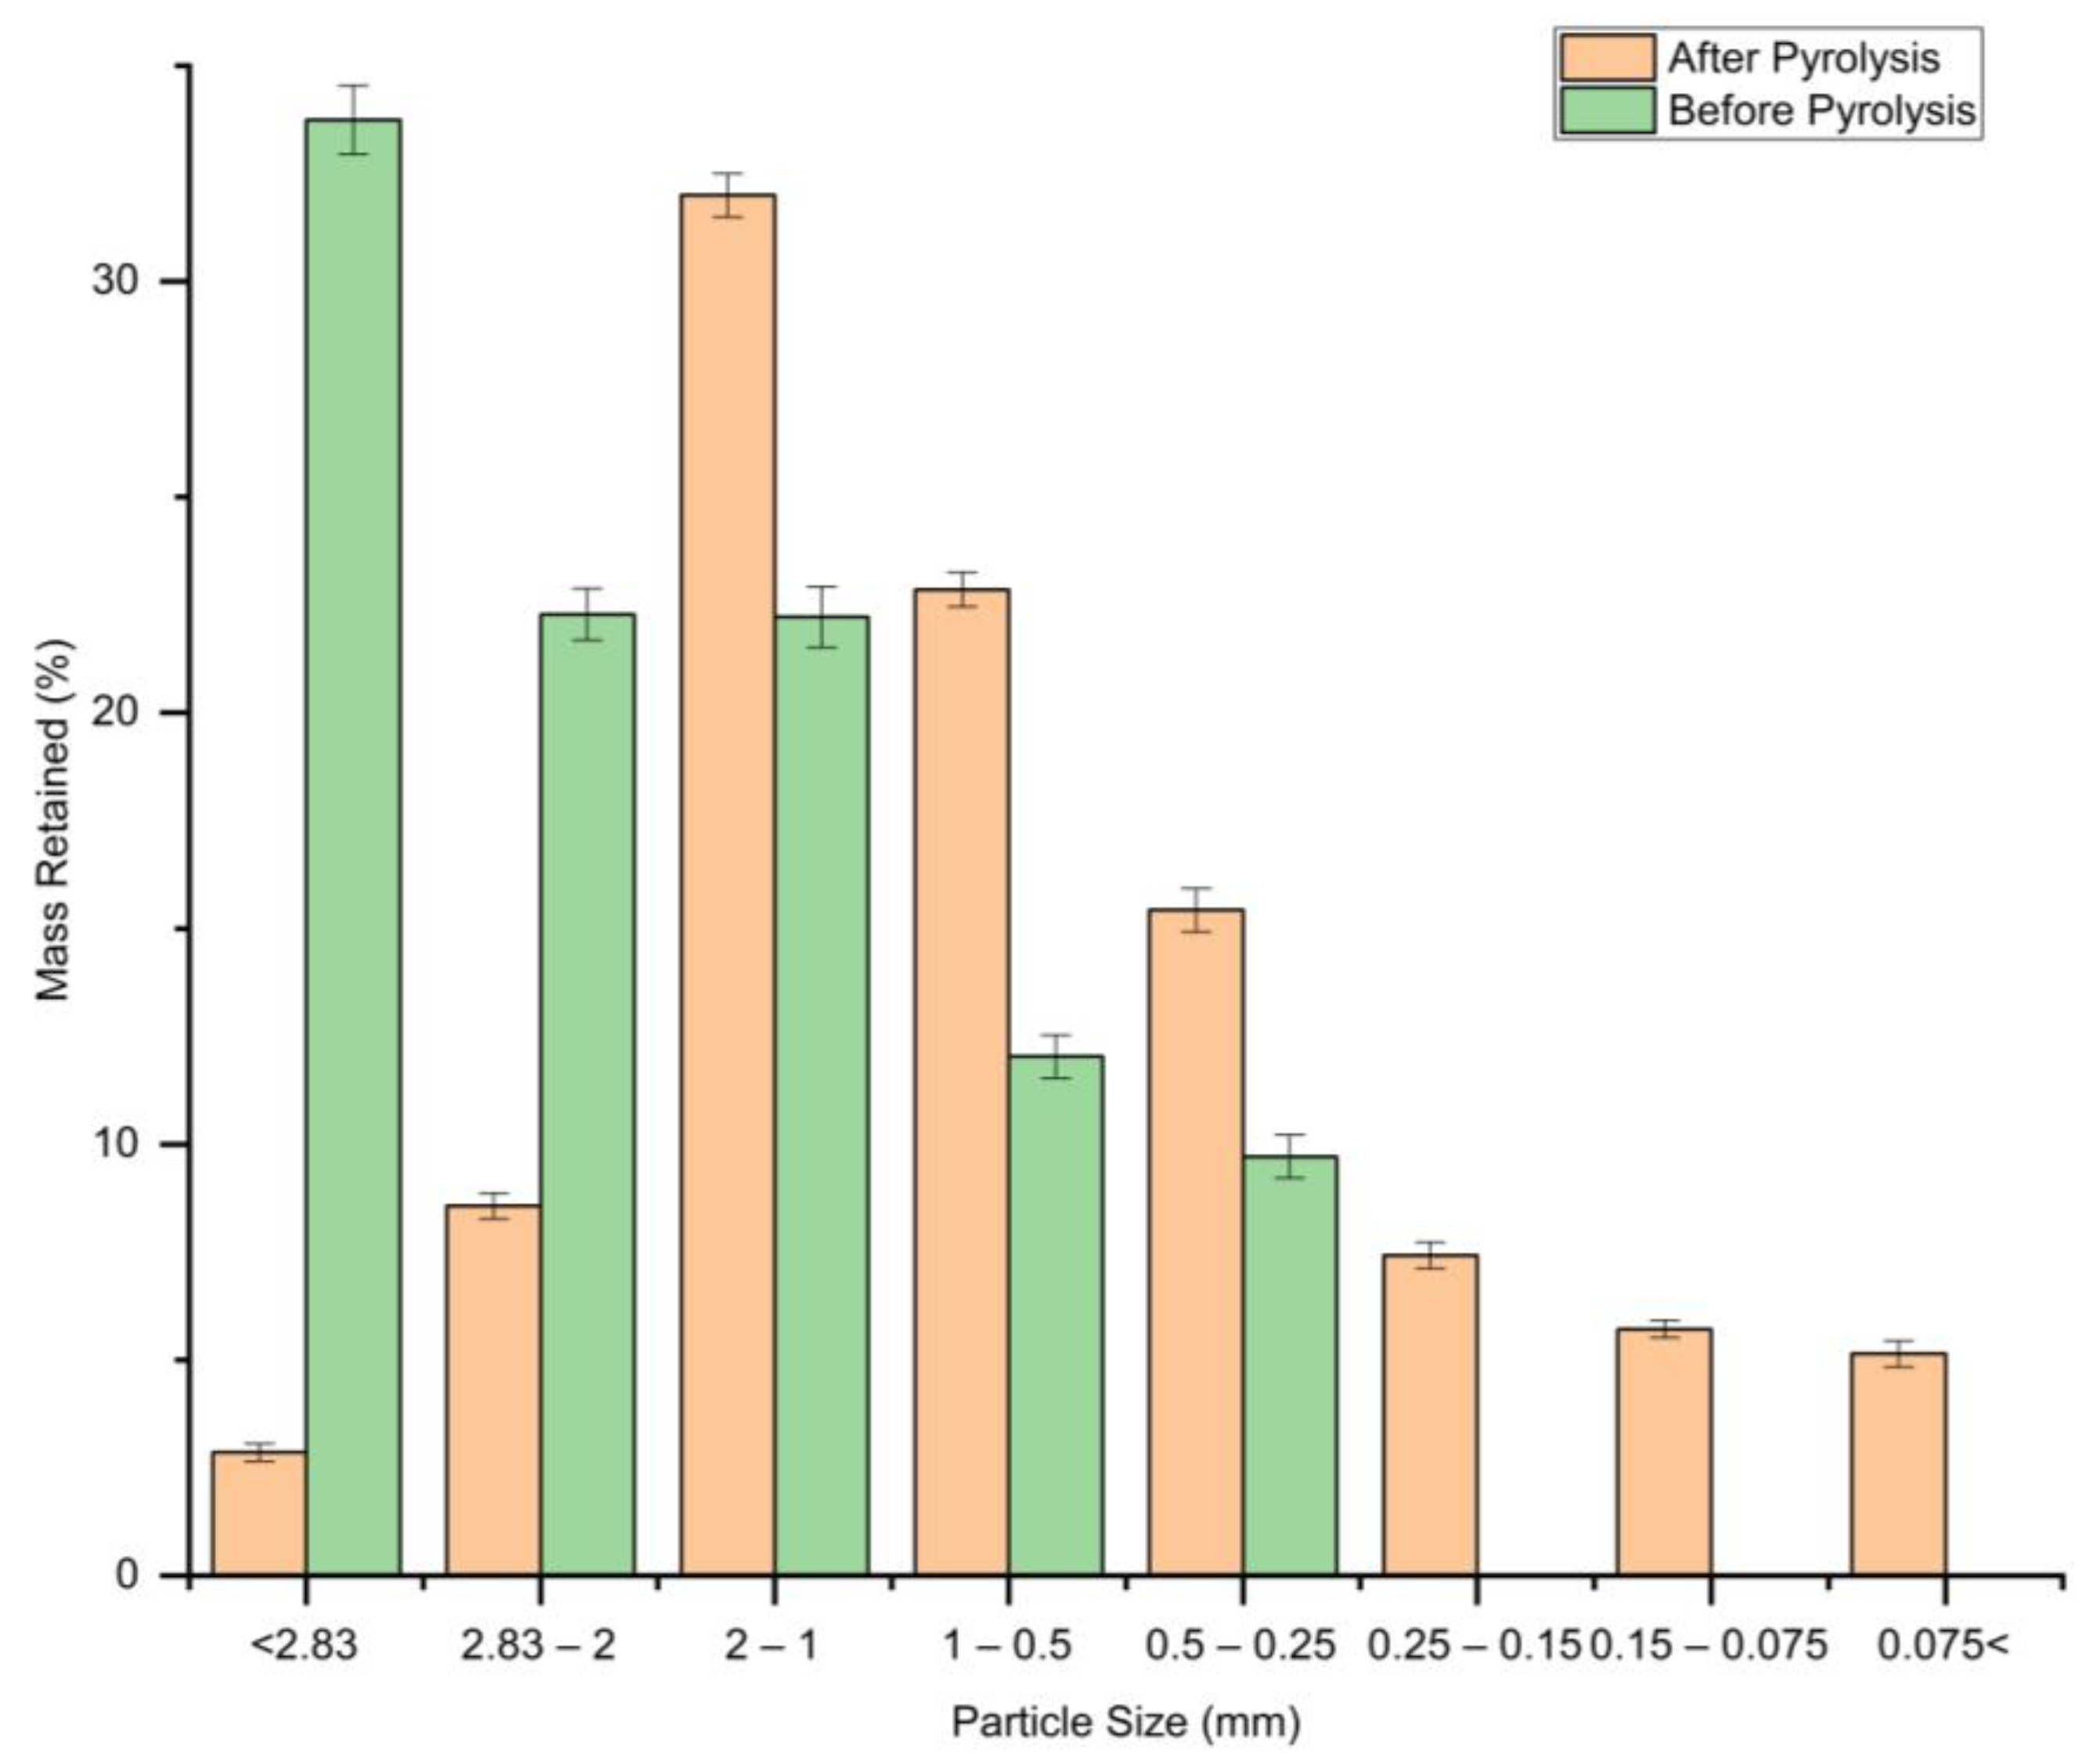
The effect of pyrolysis on particle size distribution is illustrated in Figure 3. Before pyrolysis, the majority of the material (33.74%) was retained on the sieve with the largest mesh size (<2.83 mm), indicating a coarser particle distribution. In contrast, after pyrolysis, a significant shift toward finer particles was observed. The peak mass retention (32.00%) was recorded in the 2.00–1.00 mm size range, suggesting that the biochar underwent considerable fragmentation. Notably, particles smaller than 0.25 mm were completely absent before pyrolysis but emerged in substantial quantities after the process. Specifically, 7.43%, 5.71%, and 5.14% of the total mass were retained in the 0.25–0.15 mm, 0.15–0.075 mm, and <0.075 mm size fractions, respectively, after-pyrolysis. This indicates that pyrolysis, combined with grinding, effectively produced finer particles. This shift in particle size distribution confirms that pyrolysis and subsequent mechanical grinding enhance material brittleness and reduce particle size. The increased presence of fine particles suggests a higher surface area, which is advantageous for applications such as adsorption or soil amendment. The optimized particle size distribution achieved through this two-step pretreatment process (pyrolysis followed by grinding) supports the generation of biochar with improved physicochemical properties for further utilization.
This aligns with results from Tang et al. [35], who assert that post processing treatments like grinding and sieving markedly alter the physical properties of biochar, including porosity and water hold capacity.

3.3. Resulting Physicochemical Properties

The physicochemical properties of biochar varied significantly with the pyrolysis temperature as shown in Table 1.

3.3.1. Resulting Moisture Content

As shown in Table 1, the moisture content of the biochar increased slightly from 1.94% at 250 °C to 2.50% at 550–700 °C. While this trend is generally counterintuitive, it could be a reflection of the hygroscopic nature of high-temperature chars, which can absorb moisture during cooling or storage due to their increased porosity and surface area.

3.3.2. Resulting Bulk Density

Bulk density of the biochar increased steadily from 0.176 g/cm3 at 250 °C to 0.356 g/cm3 at 700 °C as illustrated in Table 1. This can be attributed to the thermal compaction of the biomass structure and increased fixed carbon content, which densifies the material. Higher bulk density at elevated temperatures indicates the formation of more condensed carbon structures, potentially enhancing material handling and storage properties.

3.3.3. Elemental Composition

The elemental composition of biochar (Table 1) is fundamentally altered by pyrolysis temperature, and this reflects the complex chemical transformations occurring during thermal degradation.
  • Carbon (C)
The percentage of carbon in the biochar initially increased with pyrolysis temperature, reaching a maximum of 80% at 550 °C, and then declined to 71% at 700 °C. This suggests maximum carbonization efficiency occurs at intermediate temperatures. As reported by Liu et al. [36], the carbon content of biochar consistently increases significantly with increasing temperature, as seen from 250 to 550 °C.
  • Nitrogen (N)
Nitrogen content remained low across all temperatures (0.44–0.70%), decreasing slightly at higher temperatures, which is typical as nitrogenous compounds are thermally labile and prone to volatilization. This variability aligns with contrasting literature reports, indicating a complex interplay of factors beyond just temperature. Some studies report a decrease in N content [36], while others indicate an increase [37]. One even suggests that N content is not statistically different [38]. This observed variability strongly suggests that nitrogen transformation during pyrolysis is highly complex and is significantly influenced by factors such as the initial form of nitrogen present in the feedstock, the specific pyrolysis conditions (e.g., heating rate, holding time), and potential re-condensation reactions [36].
Elemental analysis of biochar produced at 400 °C and 600 °C (Table 2) showed that all heavy metal concentrations were below the IBI standard reportable limits. Notably, elements such as arsenic decreased from 0.03 ppm at 400 °C to 0.02 ppm at 600 °C, while some elements (e.g., Pb, Cd) remained constant across both temperatures. This confirms the environmental safety of the biochar produced at both temperatures, consistent with prior studies [39].

3.3.4. Surface Area

Temperature can have a marked effect on the resulting surface area of the biochar. The surface area of the char is an indicator for adsorption capacity; the greater the surface area, the greater the potential for adsorption. Low-surface-area biochars generally do not perform well for remediation efforts. As shown in Table 3, the surface area of railroad tie biochar increased with pyrolysis temperature. For 1–5 cm feedstock, the surface area increased from 0.61 m2/g at 300 °C to 378 m2/g at 700 °C. The 5–10 mm feedstock particles showed greater surface area reaching 454.9 m2/g at 700 °C. It is evident that particles size has an impact on surface area and that a smaller grind does increase the surface area of the char. The results suggest that pyrolysis should be performed at temperatures ≥600 °C to achieve the desired surface area.
These findings are consistent with previous studies. Kumar et al. [40] reported that biochars produced at temperatures ≥ 600°C exhibited significantly enhanced surface areas and pore development, attributes essential for applications involving nutrient retention, carbon sequestration, and pollutant immobilization. Similarly, Wystalska & Kwarciak-Kozłowska [41] observed that increasing pyrolysis temperature across multiple lignocellulosic feedstocks resulted in a marked increase in soil surface area due to intensified devolatilization and pore formation mechanisms. The thermal decomposition of organic constituents at higher temperatures promotes the formation of micro- and mesopores, which are central to the functional properties of biochar in environmental systems.

3.3.5. Scanning Electron Microscopy

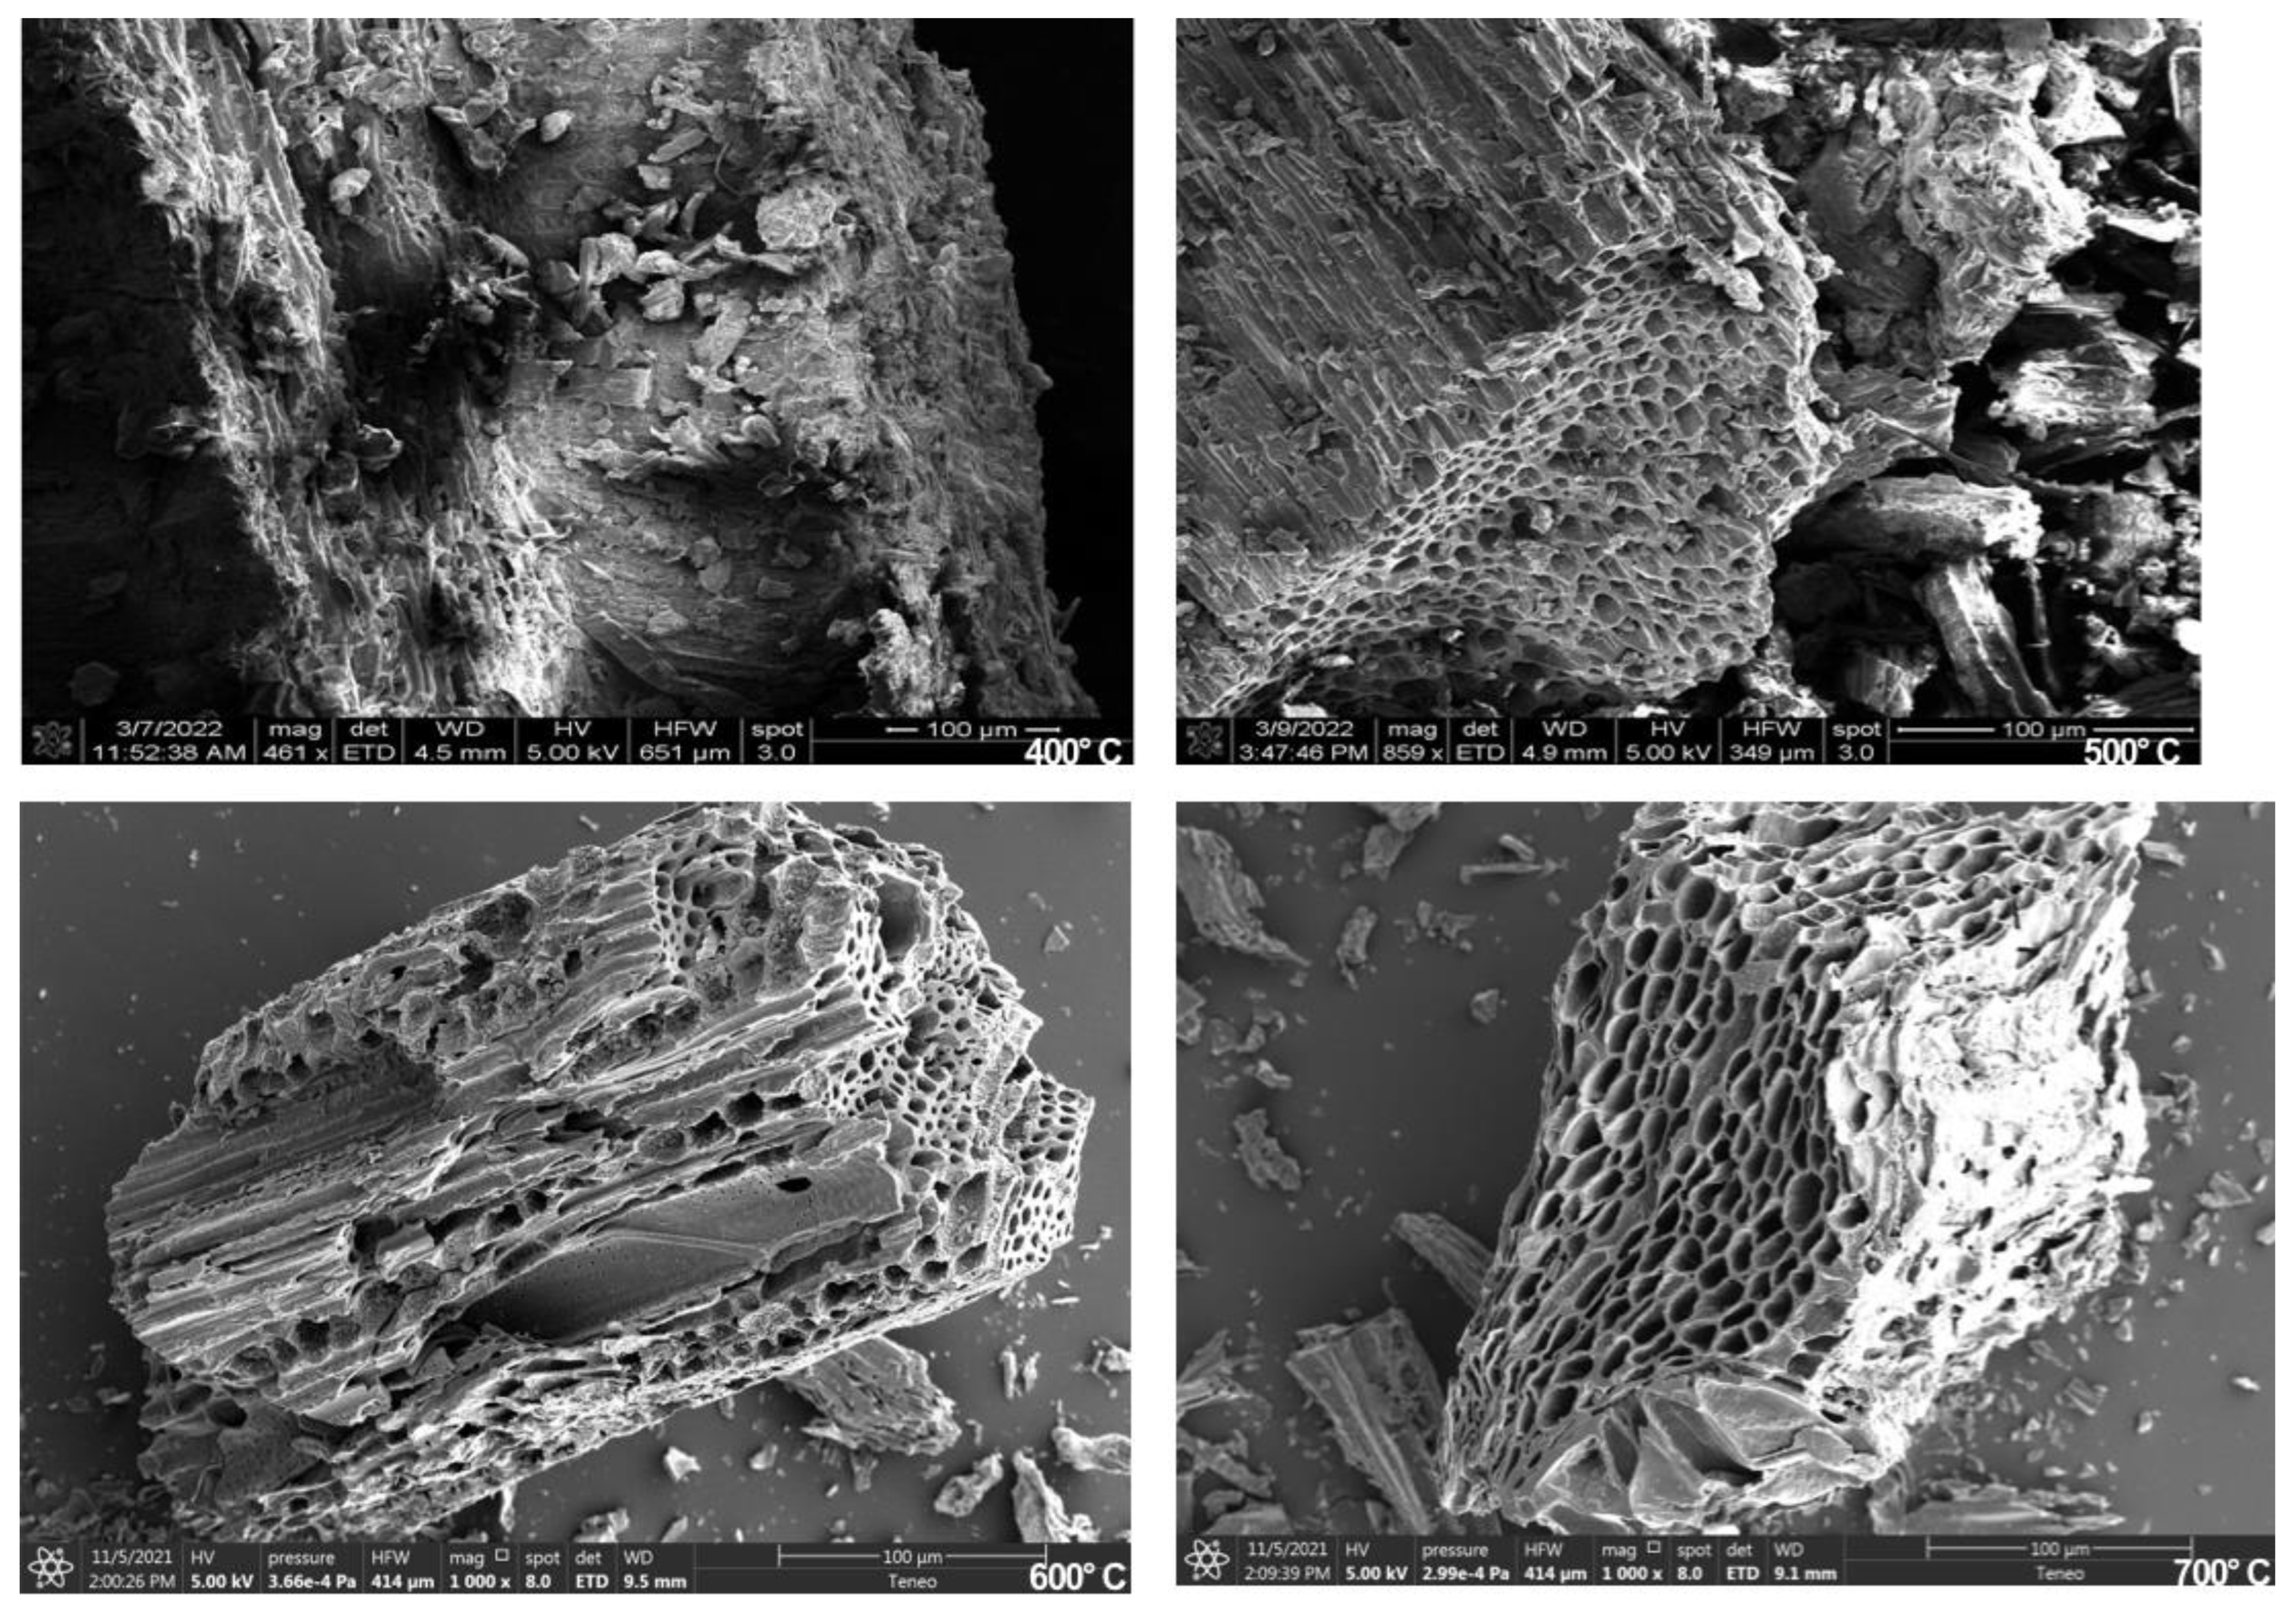
The surface morphology of biochar was characterized using Scanning Electron Microscopy (SEM), which provides detailed insights into the structural features that influence adsorption performance. SEM imaging revealed a heterogeneous distribution of micropores and mesopores, indicating significant potential for the physical adsorption of environmental pollutants such as nitrate, phosphate, and ammonium. As shown in Figure 4, the minimum observed particle size was approximately 20 μm. SEM micrographs of biochar samples produced at different pyrolysis temperatures (Figure 4) reveal substantial differences in pore development and surface roughness. Notably, the surface becomes increasingly porous with rising pyrolysis temperature, with the formation of a more defined honeycomb-like structure. This morphological evolution enhances the surface area and provides an abundance of active sites suitable for ion exchange and adsorption. The porous architecture observed at higher temperatures is likely a result of the increased release of volatile matter during carbonization [42]. This phenomenon contributes to the formation of internal cavities, cracks, and channels, thereby increasing the overall porosity and reducing bulk density. These findings are consistent with prior studies reporting that higher pyrolysis temperatures results in biochar with greater porosity and more complex pore networks [43].
This SEM analysis underscores the strong relationship between thermal processing conditions and biochar surface properties. The emergence of an extensively cracked and rough surface in high-temperature samples confirms that temperature plays a key role in tuning the material’s adsorptive characteristics. This structural transformation is critical for enhancing biochar’s functionality in environmental applications, particularly for pollutant sorption and soil remediation.

3.3.6. Polycyclic Aromatic Hydrocarbon

The PAH remaining in the biochar after pyrolysis is an indicator that some creosote or another volatile compound remains. A goal of pyrolyzing the railroad ties is to release the volatile compounds from the solid into the gas or liquid phase. Varying the final temperature during pyrolysis not only gave insight as to how temperature impacted surface area and char versus oil production, but it also provided insight as to how volatiles were released at each temperature. Table S1, in the supplementary file, shows the volatile compounds present in both the solid and the oil for various temperatures. Most of the volatile compounds were removed from the char at the highest temperature tested. As expected, there were many more volatile compounds present in the oil as compared to the char. The majority of the volatile compounds in creosote are phenolic in nature, depending on the source of the creosote, and Table S1 shows that many phenols are recovered in the oil. The presence of 1-Methylnaphthalene in the char is not a major concern as this product is naturally released when wood and wood products are burned.

3.3.7. Resulting Adsorption Isotherms

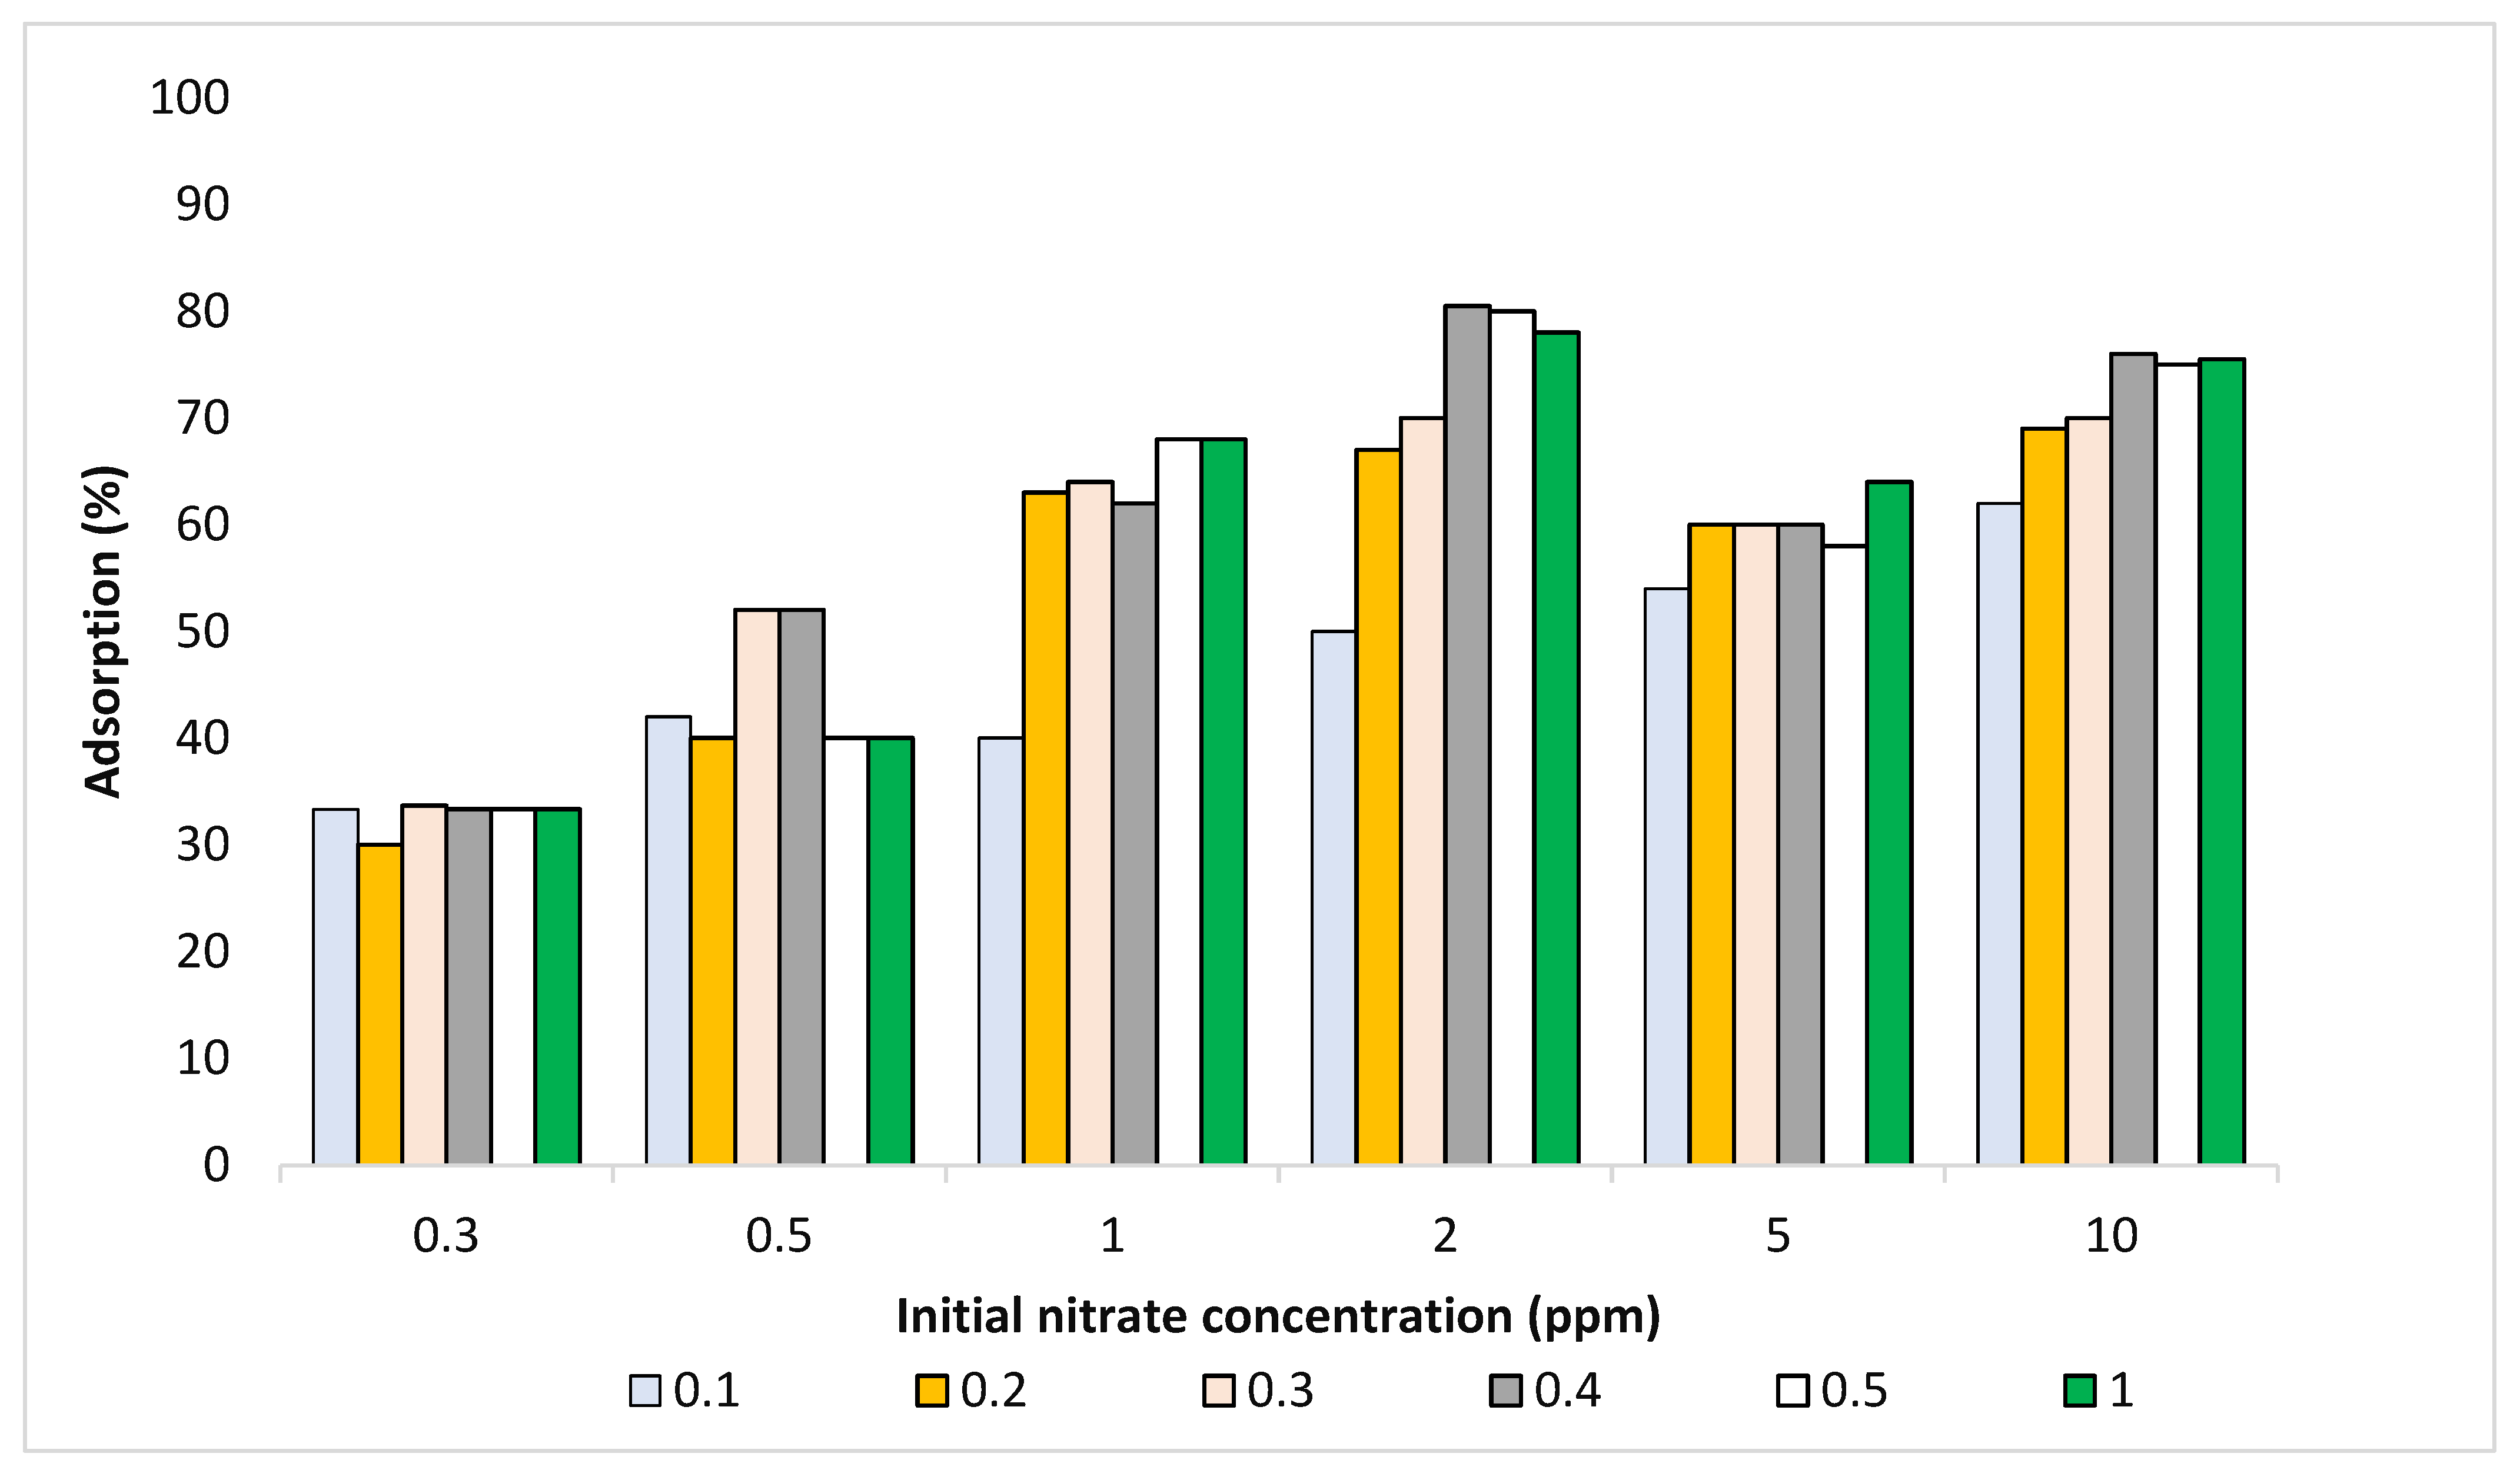
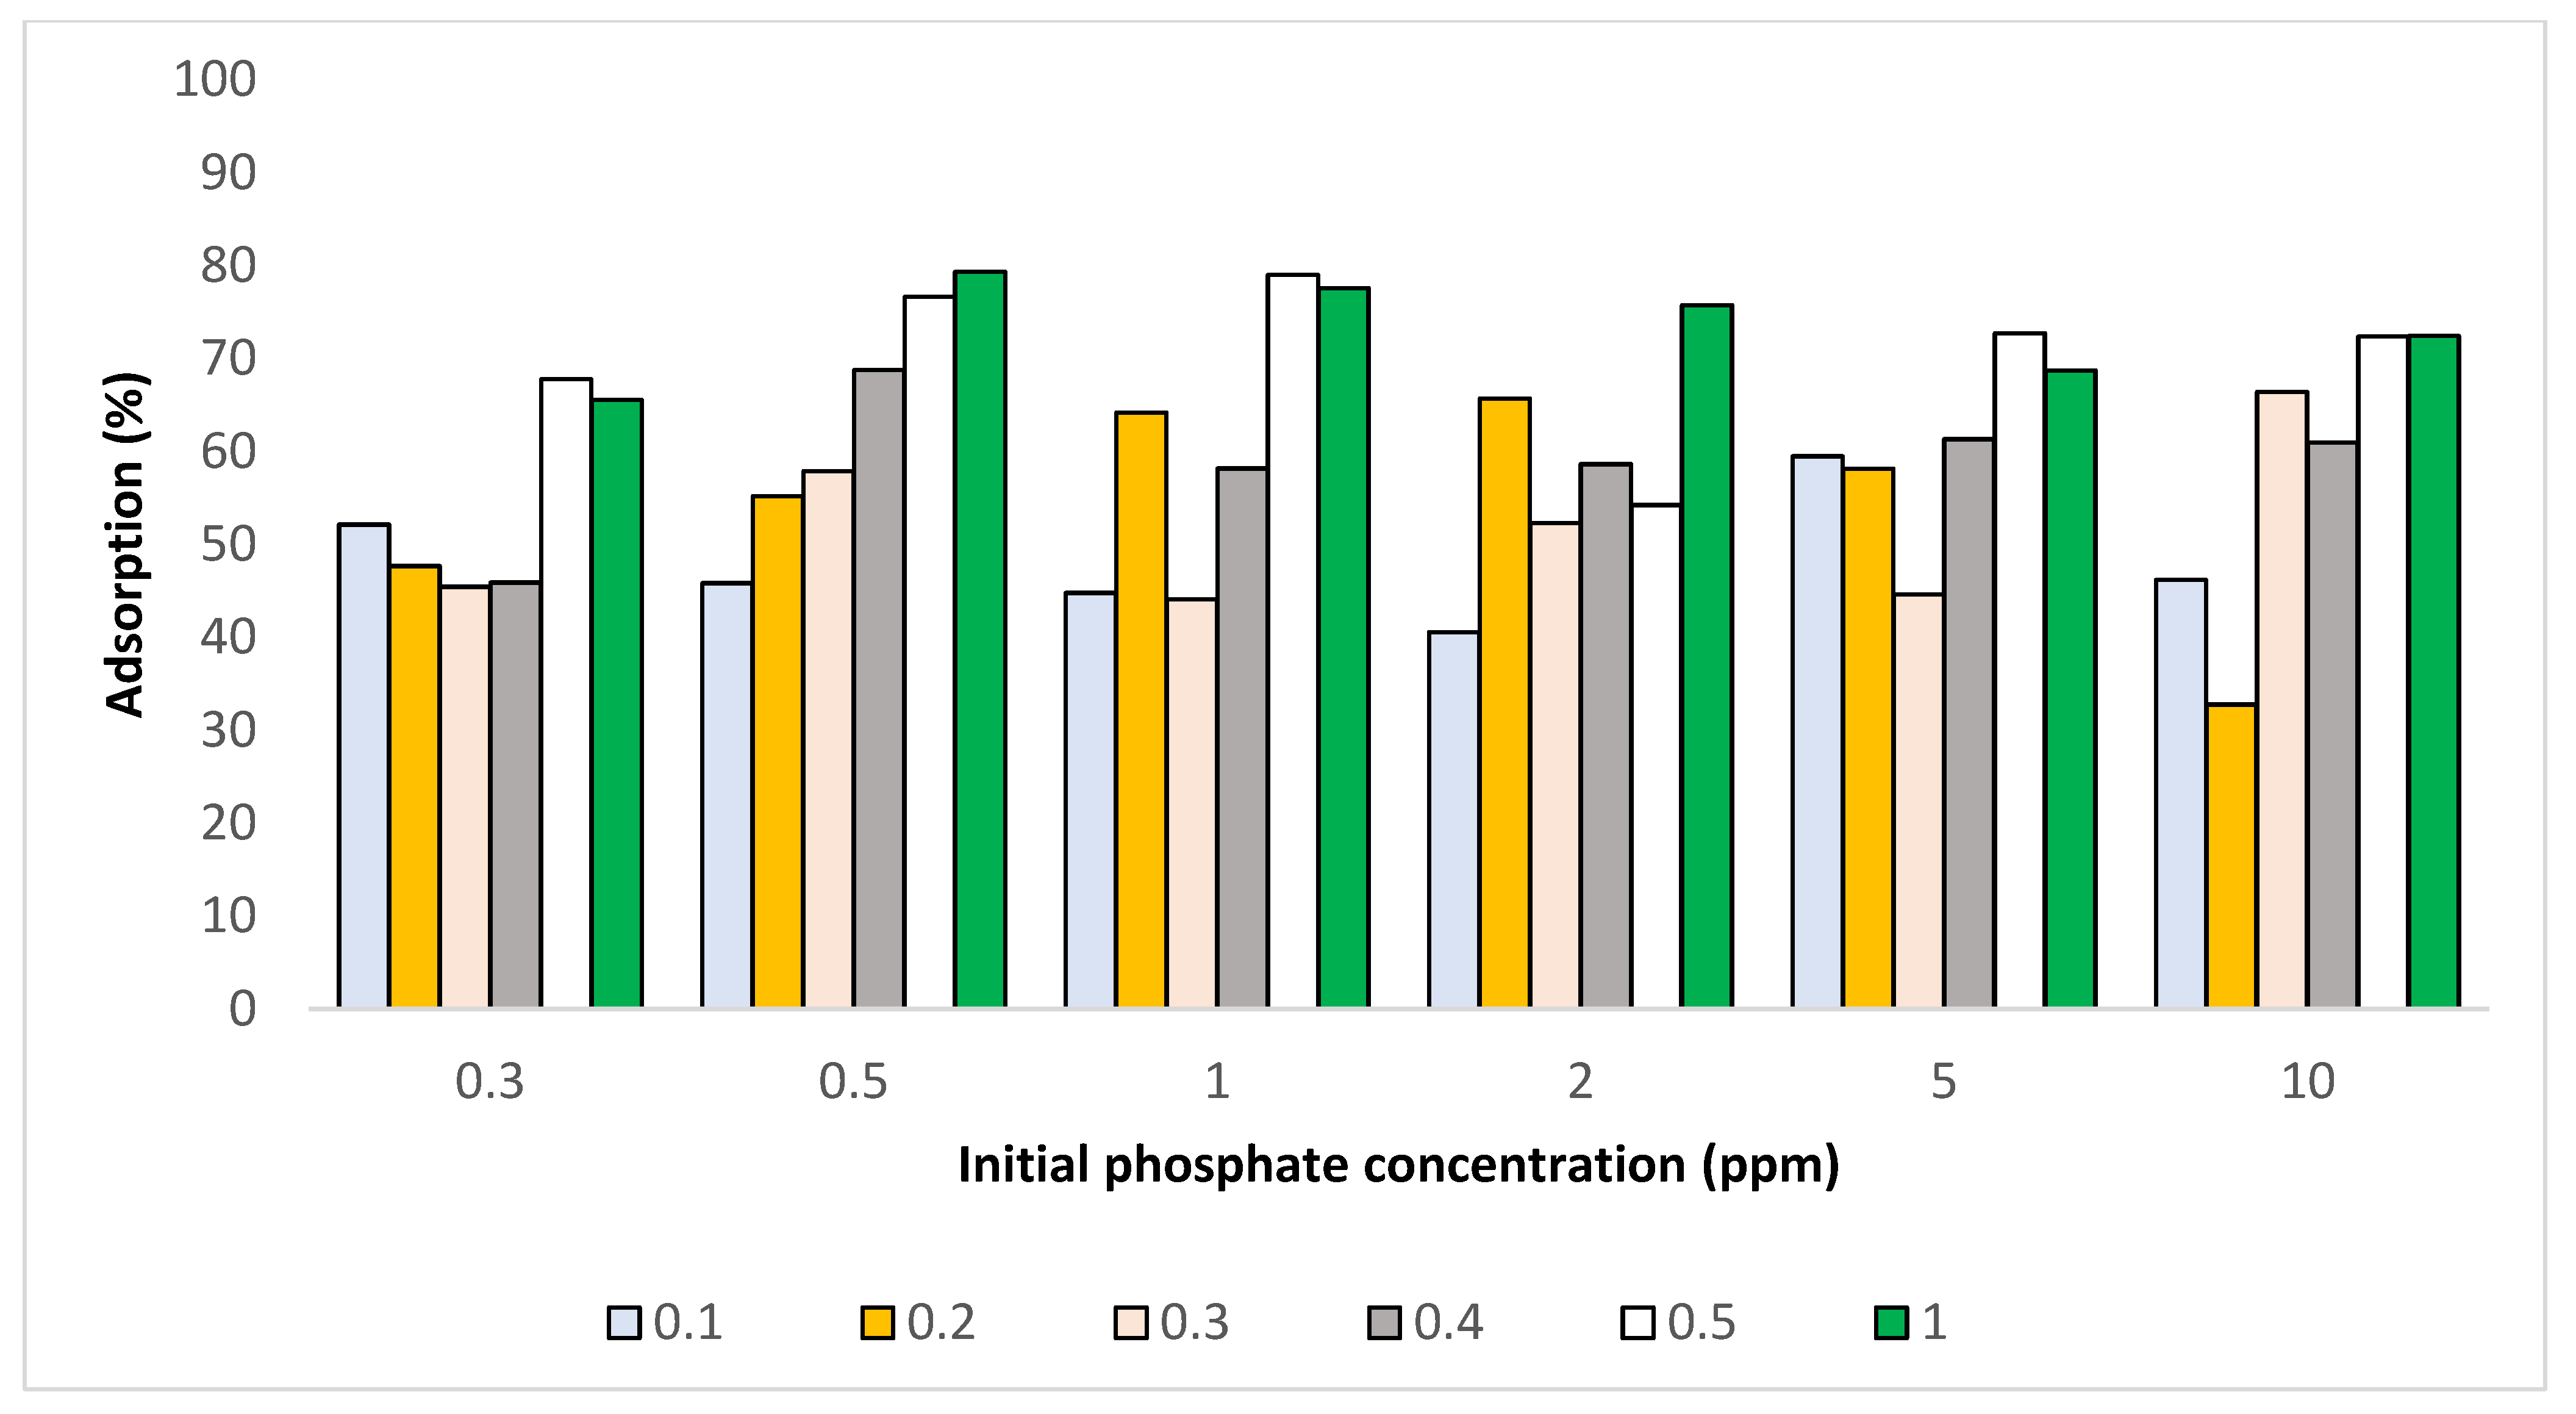
An adsorption isotherm study was conducted using biochar produced at 600 °C to evaluate its capacity for removing nitrate and phosphate from aqueous solutions. The results demonstrated that increasing the mass of biochar significantly enhanced adsorption efficiency for both anions, with nitrate showing consistently higher adsorption than phosphate across all tested conditions. Figure 5 and Figure 6 illustrate the relationship between biochar dosage (0.1–1.0 g) and contaminant concentration (0.3–10 ppm). At the highest biochar dose (1.0 g), removal efficiencies approached 80% for both nitrate and phosphate, underscoring the biochar’s potential as an effective adsorbent for water remediation.
For nitrate (Figure 5), adsorption efficiency increased with both biochar mass and decreasing contaminant concentration. At 10 ppm nitrate, removal efficiencies were 62%, 69%, 70%, 76%, 75%, and 75% for 0.1, 0.2, 0.3, 0.4, 0.5, and 1.0 g of biochar, respectively. Maximum removal (80%) was observed at 2 ppm nitrate using 0.4–0.5 g of biochar. This trend highlights the influence of available surface area and active binding sites on adsorption capacity.
Phosphate adsorption (Figure 6) followed a similar trend, with increased biochar dosage correlating with higher removal. At 1 ppm phosphate, adsorption efficiencies ranged from 44.7% with 0.1 g to 79% with 0.5 g and 77% with 1.0 g of biochar. The highest phosphate removal also occurred at intermediate biochar loadings, suggesting saturation effects at higher doses.
Overall, these findings confirm that biochar produced at 600 °C possesses strong affinity for nitrate and moderate affinity for phosphate. The high adsorption efficiencies, particularly at low contaminant concentrations, support its applicability in nutrient recovery and water purification systems.
  • Langmuir and Freundlich Adsorption Isotherm
To evaluate the adsorption of nitrogen (N) and phosphorus (P) on the studied adsorbent, two isotherm models (Langmuir and Freundlich) were applied to the experimental data. Figures S5 and S6 illustrate that the nitrate adsorption isotherm (0.3–10 ppm) on varying amounts of adsorbent (0.1–1 g) fits well with the Freundlich isotherm (R2 > 0.80). This indicates that the adsorption capacity does not increase with higher amounts of adsorbate. The constant qe represents the adsorption capacity, which corresponds to the amount adsorbed when the concentration (Ce) equals one, while n is a dimensionless parameter related to surface heterogeneity. When the isotherm is plotted on log-log coordinates, the slope is equal to n. A higher value of n, or a larger slope, suggests a more homogeneous surface [44]. With n values greater than one, the adsorption is favorable. If n is less than one, the adsorption bond weakens. The data align well with the Freundlich isotherm, indicating that the adsorption process is favorable under the conditions of this study and that the adsorbent is effective for removing the adsorbate. According to Table S2 (see Figures S1–S6, in the Supplementary File), the maximum adsorption capacities of biochar for nitrate and phosphorus with 0.1 g of biochar are 13.5 mg/kg and 34.5 mg/kg, respectively.
As seen in Table S2, the qe parameter (adsorption capacity) of nitrate and phosphorus on one gram of biochar is 4.30 mg/kg and 2.5 mg/kg, respectively. The n parameter of nitrate and phosphorus on one gram of biochar is more than 1 unit, which confirms that the adsorption is favorable. The nitrate adsorption data showed a strong fit to the Freundlich isotherm, with R2 = 0.99 at 0.1 g biochar and R2 > 0.80 for other dosages. Similarly, phosphate adsorption also fit well with the Freundlich model (R2 > 0.90). Compared to other studies on ammonium adsorption, which typically followed Langmuir isotherms (R2 > 0.80), this highlights the favorable multilayer adsorption behavior of the Purdue biochar for nitrate and phosphate. Additionally, Purdue biochar exhibited a higher surface area (454.9 m2/g) and better yield (37% at 600 °C) compared to other woody biochars (244–373 m2/g, yields < 30% at 500–550 °C), demonstrating its superior performance and suitability for environmental applications.

3.3.8. Functional Group

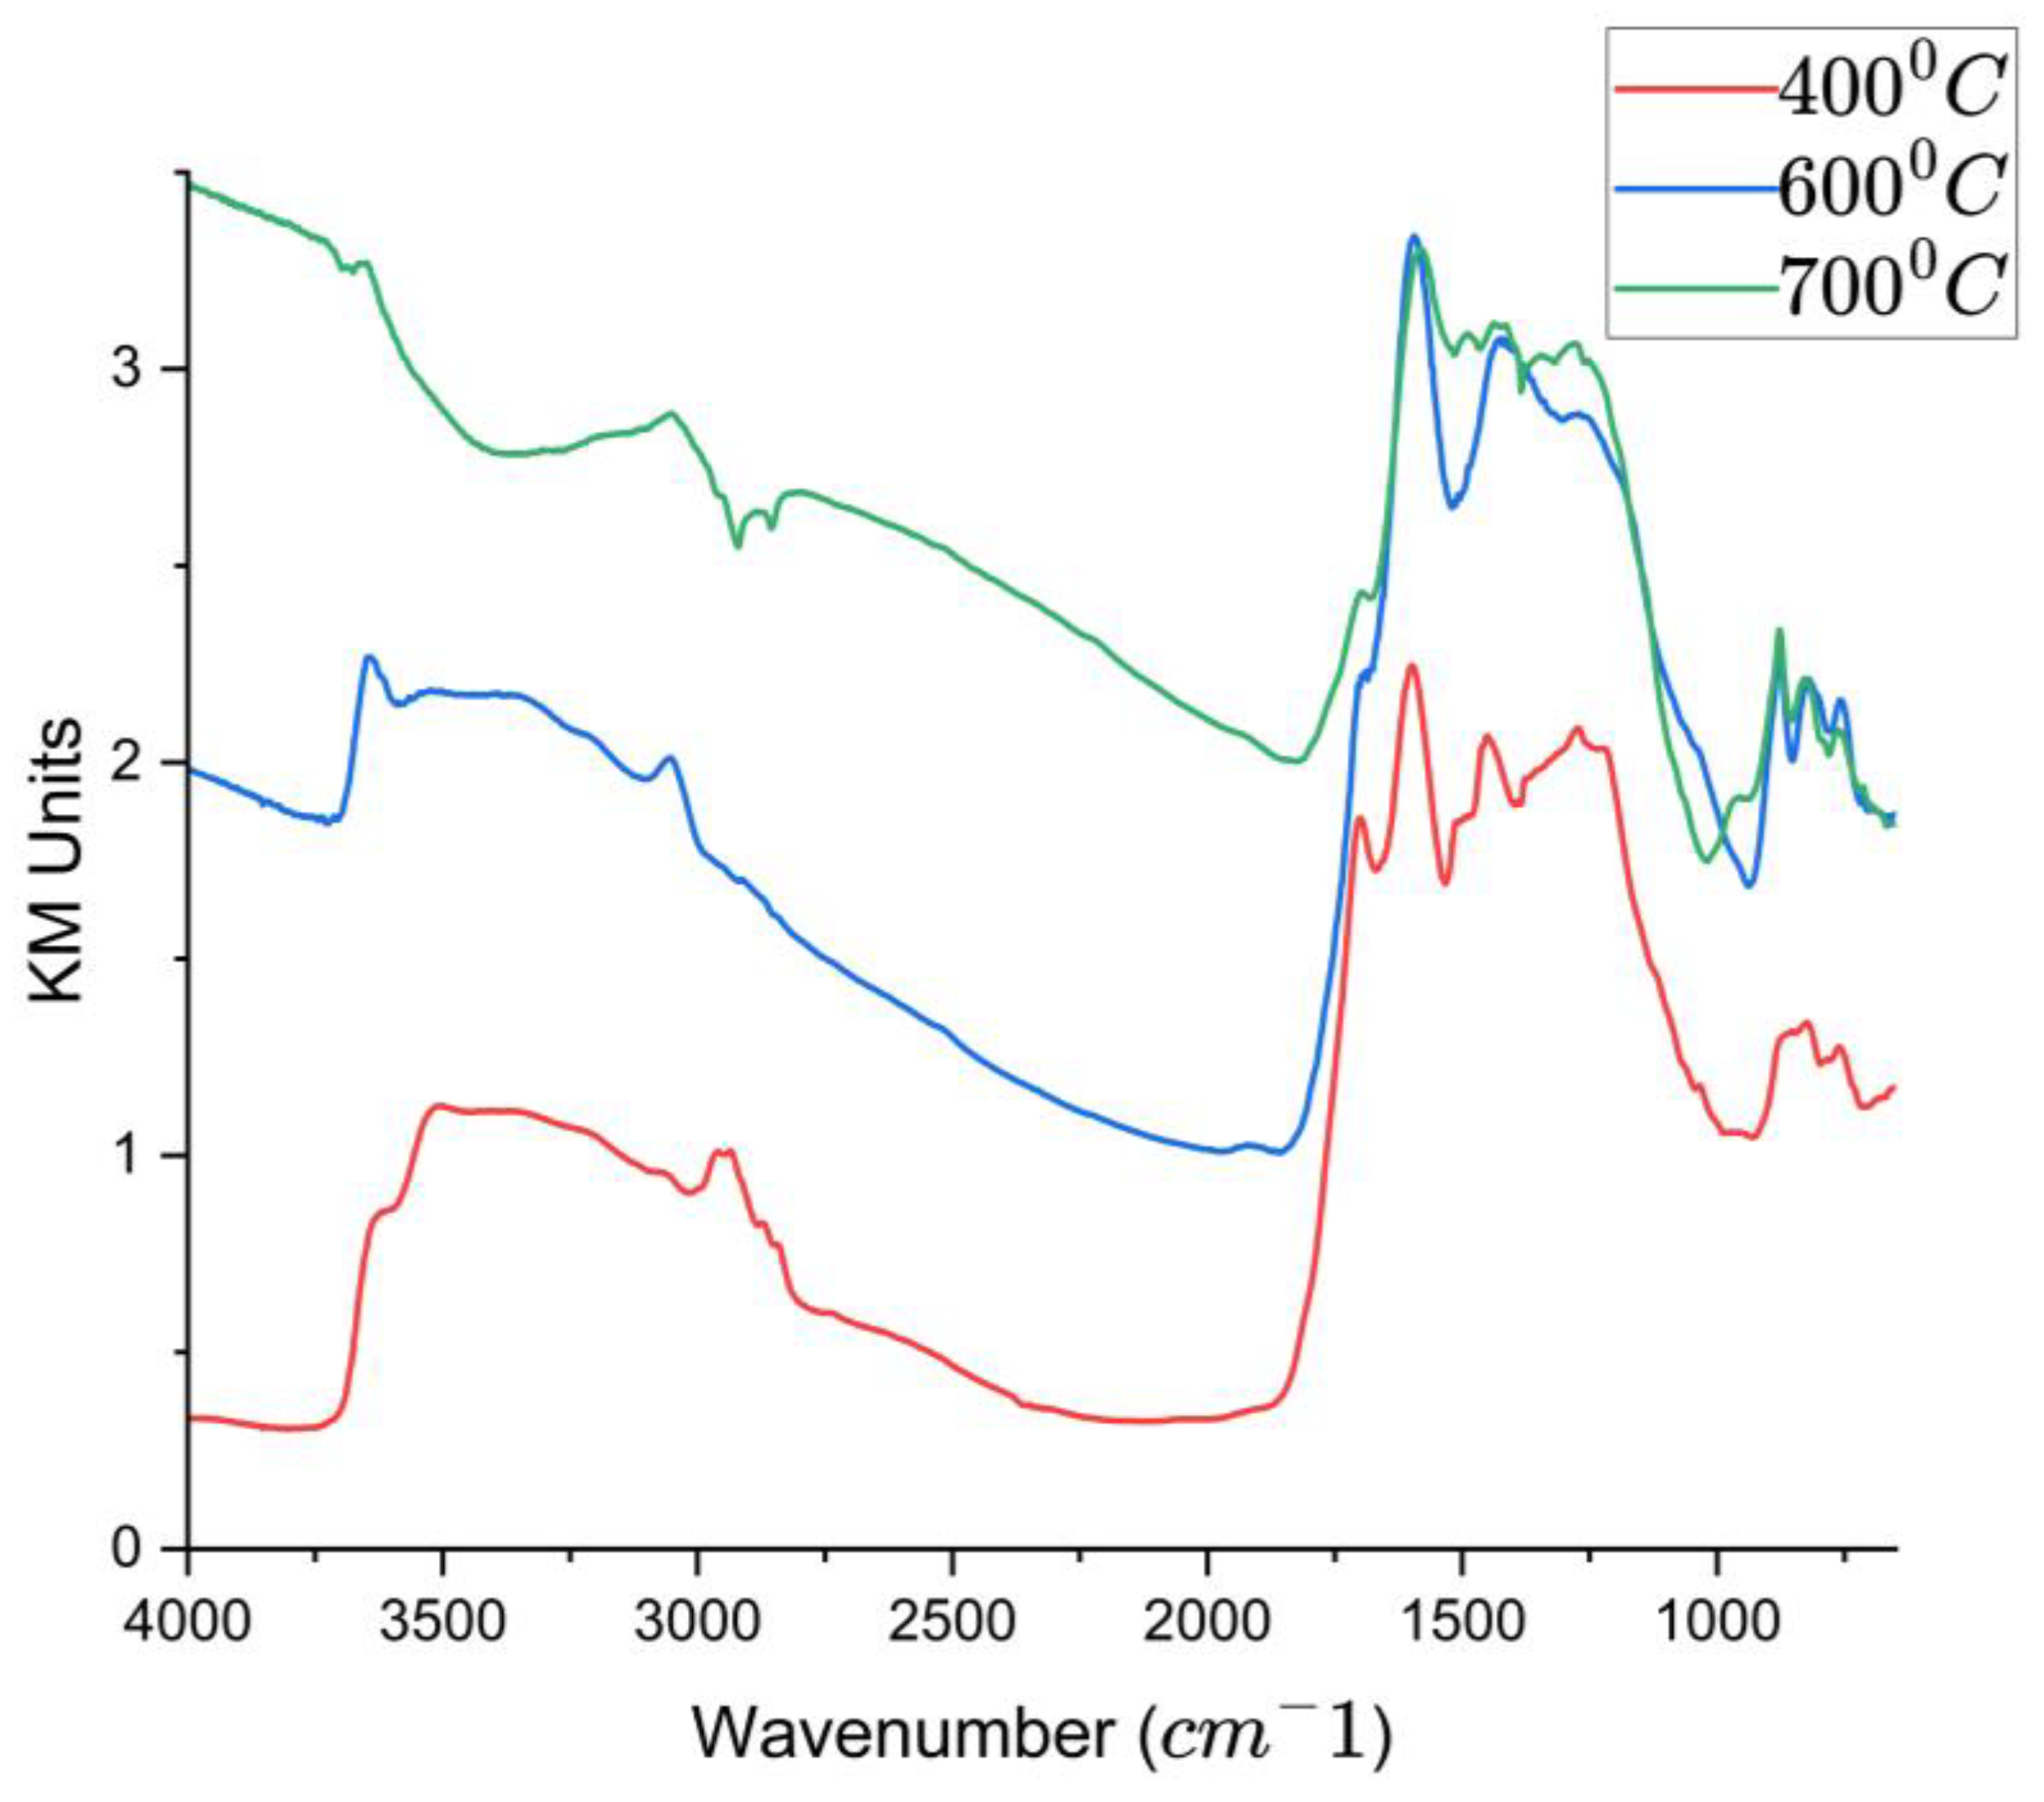
The FTIR spectra of biochar samples produced at 400, 600, and 700 °C are presented in Figure 7, and the FTIR spectra of biochar produced at 700 °C can be found in Figures S1–S3. These spectra reveal significant transformations in surface chemistry as pyrolysis temperature increases. Particularly, there is a progressive decline in the intensity and number of functional group peaks with rising temperature, indicating the thermal degradation and volatilization of oxygen-containing moieties.
A broad absorption band centered around 3454 cm−1 was observed in samples produced at 400 °C, corresponding to –OH stretching vibrations typically associated with hydroxyl or carboxylic structure [45]. The peaks in the 1000–1100 cm−1 region are attributed to C–O stretching and O–H bending, commonly present in alcohols, phenols, and polysaccharides [46]. The intensity of these bands diminishes markedly at 600 and 700 °C, reflecting the decomposition of labile oxygenated structures.
In contrast, prominent peaks indicative of stable carbonaceous structures emerge more clearly in biochars produced at higher temperatures. These include increased aromatic C=C stretching bands in the region of 1580–1600 cm−1 and decreased aliphatic C–H signals, suggesting progressive carbonization and aromatization. The emergence of these features confirms the transition from functionalized biomass to more condensed aromatic carbon frameworks.
These findings are consistent with the elemental and compositional analyses, which showed declining O/C ratios and higher fixed carbon content at elevated temperatures. Collectively, the FTIR data confirm that higher pyrolysis temperatures promote the development of thermally stable, carbon-rich biochar with fewer polar functional groups, characteristics favorable for long-term stability and use in applications like soil amendment and pollutant sorption.

3.3.9. Modification to Alter Adsorption

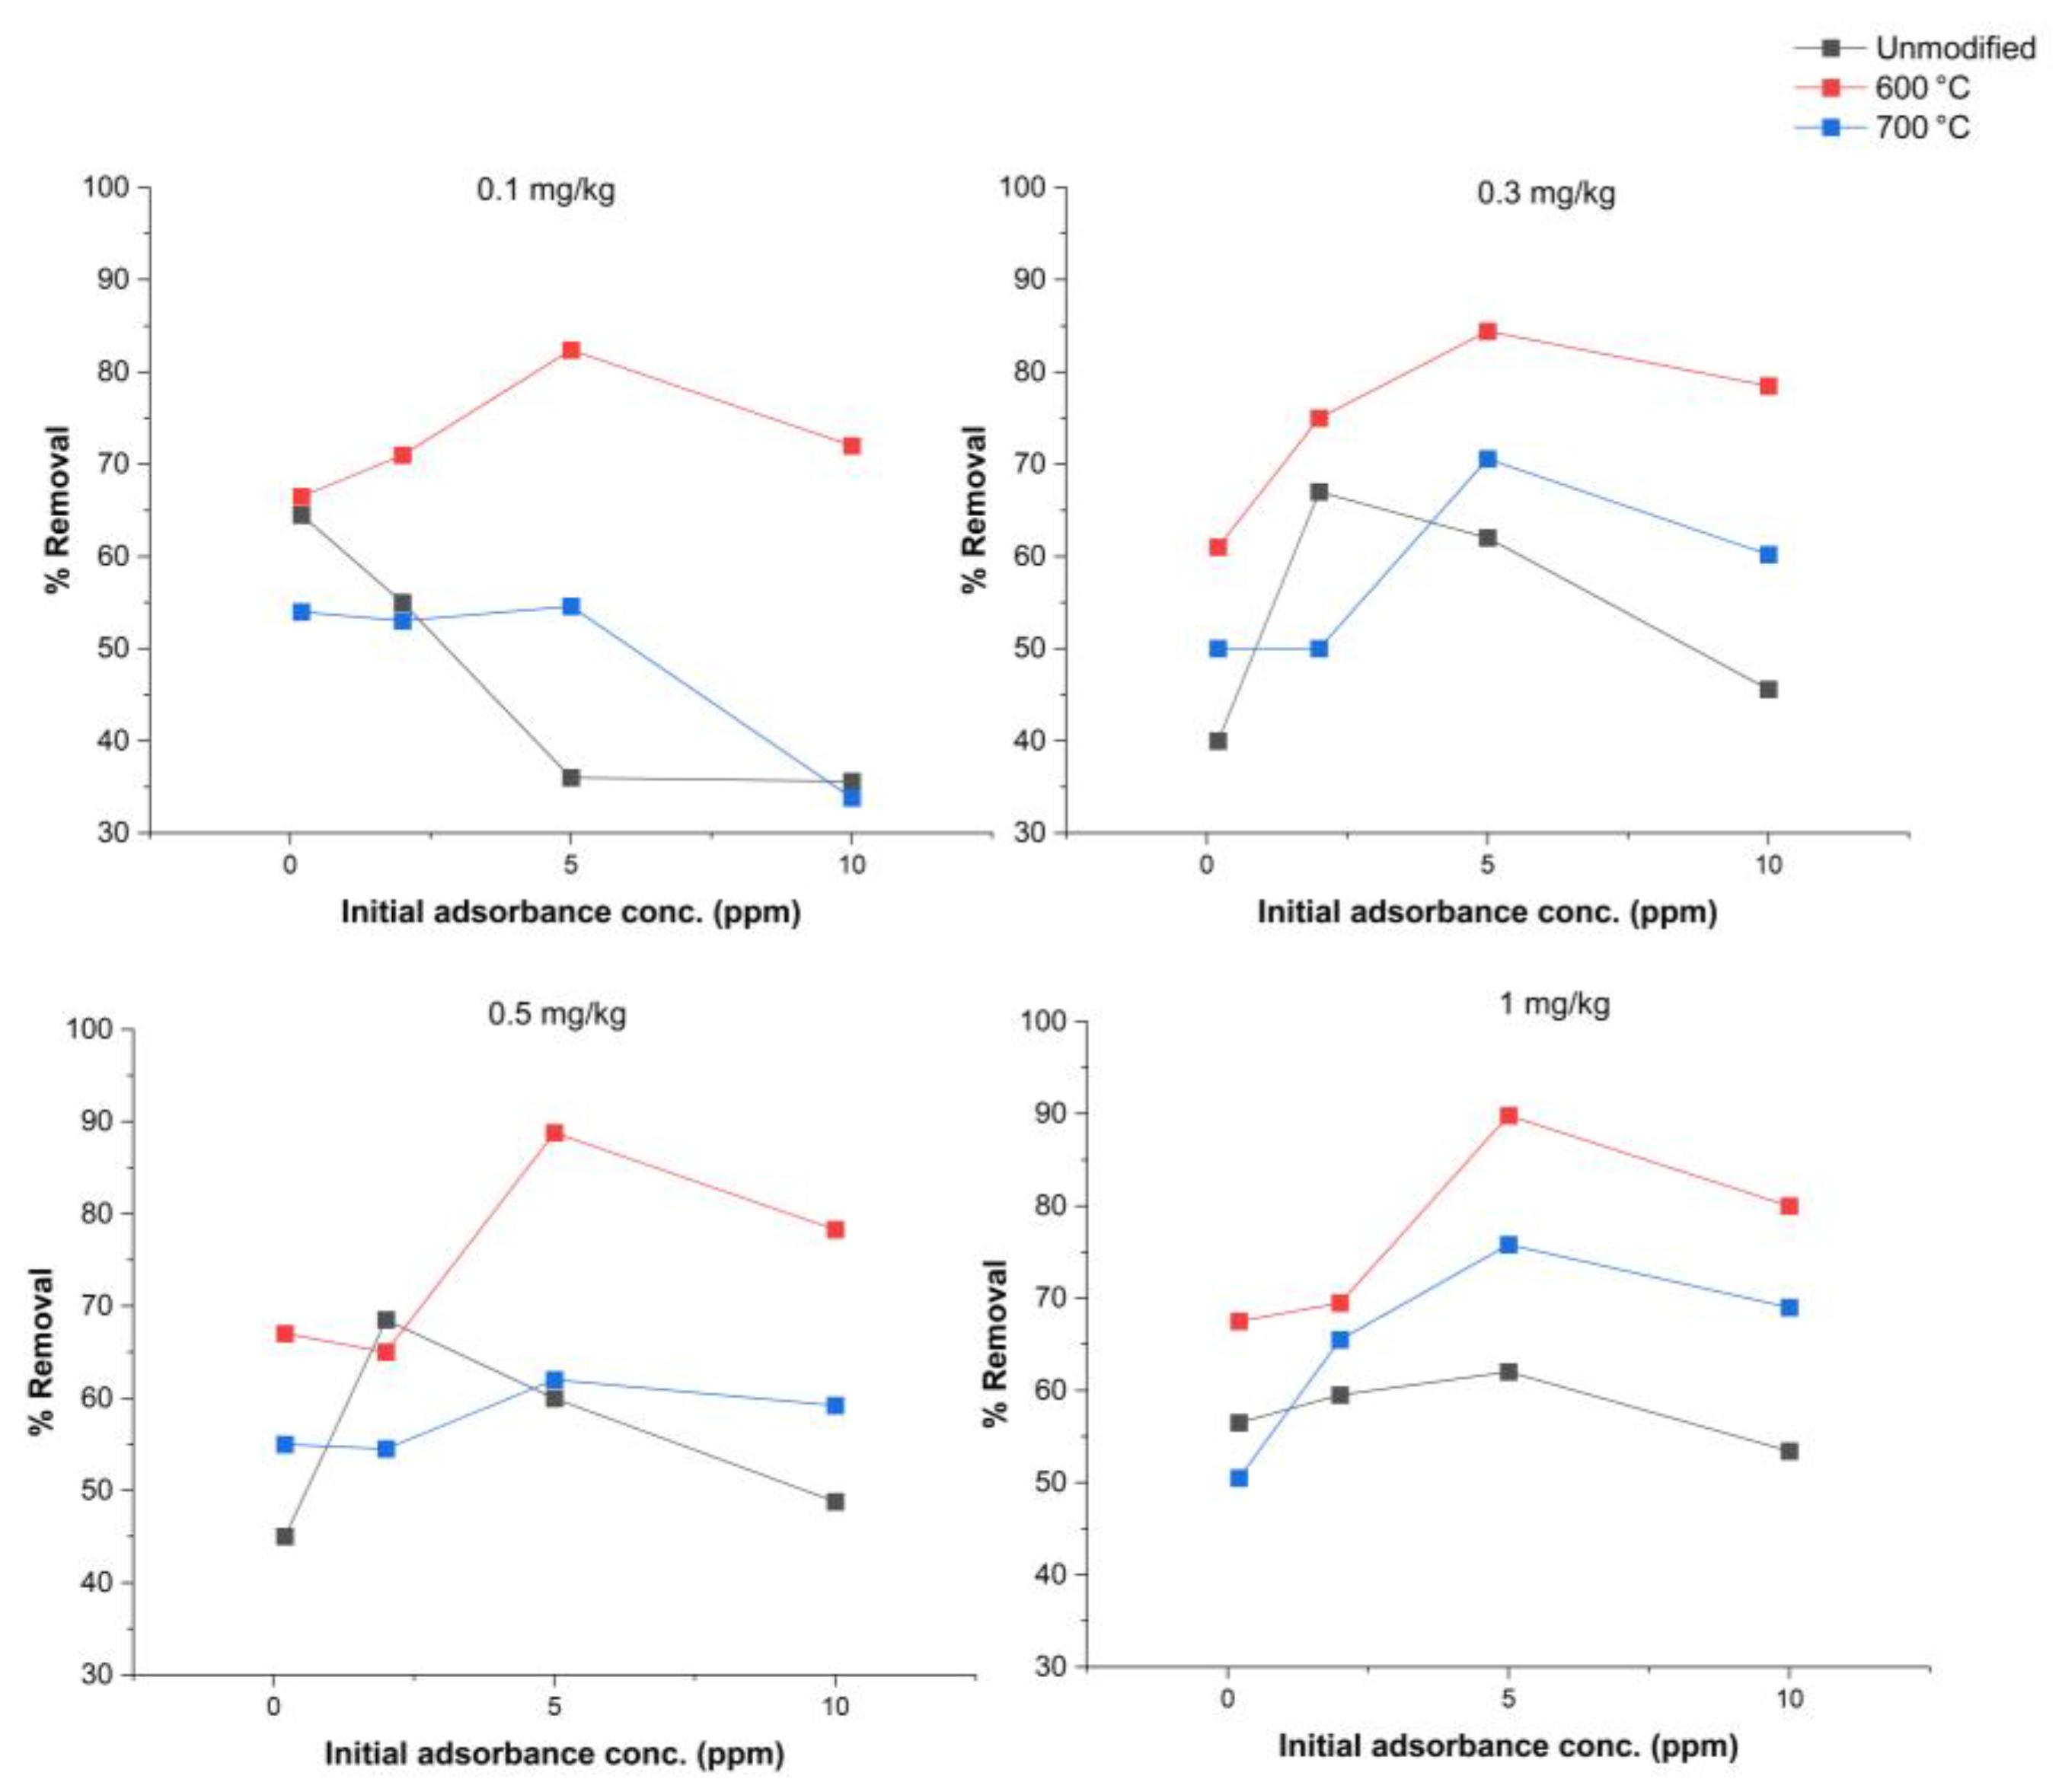
A chemical modification step was performed to enhance the adsorption capacity of the biochar. The railroad ties were soaked in magnesium chloride (MgCl2) prior to pyrolysis. The resulting biochar was then subjected to the same adsorption study as the unmodified biochar. Only nitrate was tested on the modified biochar. Two pyrolysis temperatures were tested, 600 and 700 °C. The concentration of MgCl2 varied from 2 to 20,000 ppm. Figure S4, in the Supplementary File, shows how the nitrate adsorbed differed based on biochar amount, initial nitrate concentration, and MgCl2 concentration prior to pyrolysis. There is a noticeable difference in the adsorption for the two temperatures, and it is evident that the lower temperature during pyrolysis produces a biochar that more readily adsorbs the nitrate. The higher concentration of MgCl2 can modify the biochar to adsorb more nitrate, but there is not a marked difference between a soaking concentration of 2000 and 20,000 ppm.
It is also important to compare the modified with the unmodified biochar. Figure 8 shows how the modified biochar outperforms the unmodified biochar in the adsorption of nitrate from an aqueous solution. The modified biochar can adsorb almost 90% of the nitrate at an initial concentration of 5 ppm. This comparison indicates that the chemical modification of the railroad ties prior to pyrolysis can enhance adsorption. The enhanced performance is attributed to increased surface area, improved porosity, and greater availability of reactive functional groups introduced through magnesium modification and controlled pyrolysis. These findings are consistent with previous studies showing that magnesium enrichment enhances nitrate binding through mechanisms such as electrostatic attraction, ion exchange, and surface complexation [47,48].
Other modifications and modification techniques can be explored to determine how the biochar may be useful for a variety of environmental contaminants.

4. Conclusions

This study shows the effective conversion of end-of-life railroad ties into functional biochar through pyrolysis. It offers a more practical way of managing hazardous waste from railroads while creating environmentally friendly products. The high fixed carbon content of railroad ties highlights their potential as renewable substitutes for fossil fuels and as feedstock for carbon-based materials. The bio-oil fraction requires further upgrading before it can serve as fuel. The results show how pyrolysis temperature and the particle size of feedstock influence biochar yield, surface areas, and the release of volatile compounds, thereby creating a tradeoff between the biochar and bio-oil. Additionally, a high pyrolysis temperature reduced the biochar yield but enhanced its stability, surface area, and porosity. It also reduced hazardous polycyclic aromatic hydrocarbons, producing biochar with improved adsorption properties. Physicochemical and proximate analyses showed that a higher temperature enhanced the development of a porous architecture and the removal of oxygen-containing functional groups. Unmodified biochar produced at 600 °C achieved up to 80% removal efficiency for nitrate and phosphate ions, with potential for better enhancement through chemical modification. This work highlights the dual benefit of converting hazardous railroad ties into biochar that addresses waste challenges and serves as a valuable material for soil improvement, water treatment, and circular economy applications.

Supplementary Materials

The following supporting information can be downloaded at: https://www.mdpi.com/article/10.3390/bioresourbioprod1010005/s1, Figure S1: FTIR spectrum of biochar produced at 300 °C; Figure S2: FTIR spectrum of biochar produced at 300 °C, showing major functional group peaks in the low-frequency region (4000–2500 cm−1); Figure S3: FTIR spectrum of biochar produced at 300 °C, showing major functional group peaks in the high-frequency region (4000–2500 cm−1); Figure S4: Adsorption of nitrate onto biochar soaked in MgCl2 prior to pyrolysis. Initial mass of biochar was varied from 0.1 to 1 g, while the concentration of the nitrate in the aqueous solution varied from 0.3 to 10 ppm. The results indicate that at the highest levels of both, the biochar is able to adsorb the contaminants.; Figure S5: Langmuir adsorption isotherm of nitrate on biochar; Figure S6: Freundlich adsorption isotherm of nitrate on biochar; Table S1: Volatile compounds in both the char and the oil after pyrolysis. Most of the volatiles are in the oil phase, thus rendering the biochar a potentially safe-to-use product; Table S2: Adsorption Isotherm parameters.

Author Contributions

Conceptualization, A.S.E. and S.M.; methodology, S.M.; formal analysis, A.S.E., S.M., and T.O.O.; investigation, S.M.; resources, A.S.E., C.J. and C.T.J.; writing—original draft preparation, S.M. and A.S.E.; writing—review and editing, T.O.O. and A.S.E.; supervision, A.S.E., C.J. and C.T.J.; project administration, A.S.E.; funding acquisition, A.S.E., C.J. and C.T.J. All authors have read and agreed to the published version of the manuscript.

Funding

This research was funded through a consortia comprised of the Indiana Rail Road Company, CSX Transportation, Inc., Koppers Recovery Resources LLC, and Stella-Jones Corporation.

Institutional Review Board Statement

Not applicable.

Informed Consent Statement

Not applicable.

Data Availability Statement

Data is available upon request.

Acknowledgments

The authors would like to acknowledge the Institute for a Sustainable Future (ISF), Purdue University. The authors are also thankful to the Laboratory of Renewable Resources Engineering (LORRE) at Purdue University.

Conflicts of Interest

The authors declare no conflicts of interest. The funders had no role in the design of the study; in the collection, analyses, or interpretation of data; in the writing of the manuscript; or in the decision to publish the results.

Abbreviations

The following abbreviations are used in this manuscript:
PAHPolycyclic Aromatic Hydrocarbon
FTIRFourier Transform Infrared Spectroscopy
ASTMAmerican Society for Materials and Testing
SEMScanning Electron Microscopy
BETBrunauer–Emmett–Teller
ICP-OESInductively Coupled Plasma Optical Emission Spectrometry
DIWDeionized Water
ICIon Chromatography
IBIInternational Biochar Initiative
ADAnaerobically Digested
ppmParts Per Million
w/vWeight per Volume
v/vVolume per Volume
R2Coefficient of Determination (used in isotherm model fits)
NANot Applicable

References

  1. Qiao, P.; Davalos, J.F.; Zipfel, M.G. Modeling and Optimal Design of Composite-Reinforced Wood Railroad Crosstie. Compos. Struct. 1998, 41, 87–96. [Google Scholar] [CrossRef]
  2. Smith, S.T. 2018 Railroad Tie Survey. J. Transp. Technol. 2019, 9, 276–286. [Google Scholar] [CrossRef][Green Version]
  3. Litchholt, B.; Zhang, A.; Mittelman, A.; Simon, M.C. Qualitative Lifecycle Analysis of Rail Tie Materials; Department of Transportation, Federal Railroad Administration: Washington, DC, USA, 2024.[Green Version]
  4. Lovett, A.H.; Dick, C.T.; Ruppert, C.; Barkan, C.P.L. Cost and Delay of Railroad Timber and Concrete Crosstie Maintenance and Replacement. Transp. Res. Rec. J. Transp. Res. Board 2015, 2476, 37–44. [Google Scholar] [CrossRef]
  5. Smith, S.T. 2014 Railroad Ties Survey for Railway Tie Association (RTA), Association of American Railroads (AAR), and American Short Line and Regional Railroad Association (ASLRRA). 2015. Available online: https://www.rta.org/assets/docs/RTASponsoredResearch/Environmental/ties%20survey%20report%206apr2015.pdf (accessed on 15 September 2025).
  6. Jung, S.-H.; Koo, W.-M.; Kim, J.-S. Fast Pyrolysis of Creosote Treated Wood Ties in a Fluidized Bed Reactor and Analytical Characterization of Product Fractions. Energy 2013, 53, 33–39. [Google Scholar] [CrossRef]
  7. Kim, P.; Taylor, A.; Lloyd, J.; Kim, J.-W.; Abdoulmoumine, N.; Labbé, N. Two-Step Thermochemical Process for Adding Value to Used Railroad Wood Ties and Reducing Environmental Impacts. ACS Sustain. Chem. Eng. 2017, 5, 9485–9493. [Google Scholar] [CrossRef]
  8. Kalina, M.; Sovova, S.; Hajzler, J.; Kubikova, L.; Trudicova, M.; Smilek, J.; Enev, V. Biochar Texture—A Parameter Influencing Physicochemical Properties, Morphology, and Agronomical Potential. Agronomy 2022, 12, 1768. [Google Scholar] [CrossRef]
  9. Khater, E.-S.; Bahnasawy, A.; Hamouda, R.; Sabahy, A.; Abbas, W.; Morsy, O.M. Biochar Production under Different Pyrolysis Temperatures with Different Types of Agricultural Wastes. Sci. Rep. 2024, 14, 2625. [Google Scholar] [CrossRef]
  10. Niedziński, T.; Łabętowicz, J.; Stępień, W.; Pęczek, T. Analysis of the Use of Biochar from Organic Waste Pyrolysis in Agriculture and Environmental Protection. J. Ecol. Eng. 2023, 24, 85–98. [Google Scholar] [CrossRef]
  11. Gonzalez, J.M.; Boddu, V.M.; Jackson, M.A.; Moser, B.; Ray, P. Pyrolysis of Creosote-Treated Railroad Ties to Recover Creosote and Produce Biochar. J. Anal. Appl. Pyrolysis 2020, 149, 104826. [Google Scholar] [CrossRef]
  12. Ahmad, M.; Rajapaksha, A.U.; Lim, J.E.; Zhang, M.; Bolan, N.; Mohan, D.; Vithanage, M.; Lee, S.S.; Ok, Y.S. Biochar as a Sorbent for Contaminant Management in Soil and Water: A Review. Chemosphere 2014, 99, 19–33. [Google Scholar] [CrossRef]
  13. Bolan, N.; Hoang, S.A.; Beiyuan, J.; Gupta, S.; Hou, D.; Karakoti, A.; Joseph, S.; Jung, S.; Kim, K.; Kirkham, M.B.; et al. Multifunctional Applications of Biochar Beyond Carbon Storage. Int. Mater. Rev. 2021, 67, 150–200. [Google Scholar] [CrossRef]
  14. Enaime, G.; Baçaoui, A.; Yaacoubi, A.; Lübken, M. Biochar for Wastewater Treatment—Conversion Technologies and Applications. Appl. Sci. 2020, 10, 3492. [Google Scholar] [CrossRef]
  15. Muoghalu, C.C.; Owusu, P.A.; Lebu, S.; Nakagiri, A.; Semiyaga, S.; Iorhemen, O.T.; Manga, M. Biochar as a Novel Technology for Treatment of Onsite Domestic Wastewater: A Critical Review. Front. Environ. Sci. 2023, 11, 1095920. [Google Scholar] [CrossRef]
  16. Schimmelpfennig, S.; Glaser, B. One Step Forward Toward Characterization: Some Important Material Properties to Distinguish Biochars. J. Environ. Qual. 2012, 41, 1001–1013. [Google Scholar] [CrossRef] [PubMed]
  17. Ippolito, J.A.; Cui, L.; Kammann, C.; Wrage, N.; Estavillo, J.M.; Fuertes-Mendizábal, T.; Cayuela, M.L.; Sigua, G.C.; Novak, J.M.; Spokas, K.A.; et al. Feedstock Choice, Pyrolysis Temperature and Type Influence Biochar Characteristics: A Comprehensive Meta-Data Analysis Review. Biochar 2020, 2, 421–438. [Google Scholar] [CrossRef]
  18. Nobaharan, K.; Bagheri Novair, S.; Asgari Lajayer, B.; van Hullebusch, E.D. Phosphorus Removal from Wastewater: The Potential Use of Biochar and the Key Controlling Factors. Water 2021, 13, 517. [Google Scholar] [CrossRef]
  19. Zhang, M.; Song, G.; Gelardi, D.L.; Huang, L.; Khan, E.; Mašek, O.; Parikh, S.J.; Ok, Y.S. Evaluating Biochar and Its Modifications for the Removal of Ammonium, Nitrate, and Phosphate in Water. Water Res. 2020, 186, 116303. [Google Scholar] [CrossRef]
  20. Mishra, B.; Remya, N.; Mohit, A. Production of Engineered Algal Biochar through Microwave Pyrolysis for Nutrient Recovery from Aqueous Solution. Environ. Qual. Manag. 2024, 33, 35–45. [Google Scholar] [CrossRef]
  21. Ayiania, M.; Garcia, A.; Haghighi Mood, S.; McEwen, J.-S.; Garcia-Perez, M. Novel Amorphous Carbons for the Adsorption of Phosphate: Part I. Elucidation of Chemical Structure of N-Metal-Doped Chars. ACS Omega 2022, 7, 14490–14504. [Google Scholar] [CrossRef]
  22. Ghassemi-Golezani, K.; Rahimzadeh, S. Biochar Modification and Application to Improve Soil Fertility and Crop Productivity. Agriculture 2022, 68, 45–61. [Google Scholar] [CrossRef]
  23. Gryta, A.; Skic, K.; Adamczuk, A.; Skic, A.; Marciniak, M.; Józefaciuk, G.; Boguta, P. The Importance of the Targeted Design of Biochar Physicochemical Properties in Microbial Inoculation for Improved Agricultural Productivity—A Review. Agriculture 2024, 14, 37. [Google Scholar] [CrossRef]
  24. Singh, B.; Camps-Arbestain, M.; Lehmann, J. Biochar: A Guide to Analytical Methods; Csiro Publishing: Victoria, Australia, 2017; ISBN 1-4863-0510-5. [Google Scholar]
  25. ASTM D1762-84; Standard Test Methods for Chemical Analysis of Wood Charcoal. ASTM International: West Conshohocken, PA, USA, 2013.
  26. ASTM D5550-06; Standard Test Method for Specific Gravity of Soil Solids by Gas Pycnometer. ASTM International: West Conshohocken, PA, USA, 2006.
  27. ASTM D6556-10; Standard Test Method for Carbon Black—Total and External Surface Area by Nitrogen Adsorption. ASTM International: West Conshohocken, PA, USA, 2010.
  28. El-Aassar, M.R.; Tamer, T.M.; El-Sayed, M.Y.; Omer, A.M.; Althobaiti, I.O.; Youssef, M.E.; Alolaimi, R.F.; El-Agammy, E.F.; Alruwaili, M.S.; Rabhy, O.O.; et al. Development of Azo Dye Immobilized Sulfonated Poly (Glycidyl Methacrylate) Polymer Composite as Novel Adsorbents for Water Treatment Applications: Methylene Blue Immobilization Isotherm, Kinetic, Thermodynamic, and Simulations Studies. Molecules 2022, 27, 8418. [Google Scholar] [CrossRef]
  29. Unlu, N.; Ersoz, M. Adsorption Characteristics of Heavy Metal Ions onto a Low Cost Biopolymeric Sorbent from Aqueous Solutions. J. Hazard. Mater. 2006, 136, 272–280. [Google Scholar] [CrossRef] [PubMed]
  30. Sebastian, S.; Mayadevi, S.; Beevi, B.S.; Mandal, S. Layered Clay-Alginate Composites for the Adsorption of Anionic Dyes: A Biocompatible Solution for Water/Wastewater Treatment. J. Water Resour. Prot. 2014, 06, 177–184. [Google Scholar] [CrossRef]
  31. Chatterjee, R.; Sajjadi, B.; Chen, W.-Y.; Mattern, D.L.; Hammer, N.; Raman, V.; Dorris, A. Effect of Pyrolysis Temperature on PhysicoChemical Properties and Acoustic-Based Amination of Biochar for Efficient CO2 Adsorption. Front. Energy Res. 2020, 8, 85. [Google Scholar] [CrossRef]
  32. Tu, P.; Zhang, G.; Wei, G.; Li, J.; Li, Y.; Deng, L.; Yuan, H. Influence of Pyrolysis Temperature on the Physicochemical Properties of Biochars Obtained from Herbaceous and Woody Plants. Bioresour. Bioprocess. 2022, 9, 131. [Google Scholar] [CrossRef]
  33. Ahn, K.-H.; Shin, D.-C.; Lee, Y.-E.; Jeong, Y.; Jung, J.; Kim, I.-T. Biochar Production and Demineralization Characteristics of Food Waste for Fuel Conversion. Molecules 2023, 28, 6114. [Google Scholar] [CrossRef]
  34. Tomczyk, A.; Sokołowska, Z.; Boguta, P. Biochar Physicochemical Properties: Pyrolysis Temperature and Feedstock Kind Effects. Rev. Environ. Sci. Biotechnol. 2020, 19, 191–215. [Google Scholar] [CrossRef]
  35. Tang, E.; Liao, W.; Thomas, S.C. Optimizing Biochar Particle Size for Plant Growth and Mitigation of Soil Salinization. Agronomy 2023, 13, 1394. [Google Scholar] [CrossRef]
  36. Liu, Z.; Niu, W.; Chu, H.; Zhou, T.; Niu, Z. Effect of the Carbonization Temperature on the Properties of Biochar Produced from the Pyrolysis of Crop Residues. BioResources 2018, 13, 3429–3446. [Google Scholar] [CrossRef]
  37. Wijitkosum, S. Influence of Pyrolysis Temperature and Time on Biochar Properties and Its Potential for Climate Change Mitigation. J. Hum. Earth Future 2023, 4, 472–485. [Google Scholar] [CrossRef]
  38. Li, X.; Liu, H.; Liu, N.; Sun, Z.; Fu, S.; Zhan, X.; Yang, J.; Zhou, R.; Zhang, H.; Zhang, J.; et al. Pyrolysis Temperature Had Effects on the Physicochemical Properties of Biochar. Plant Soil Environ. 2023, 69, 363–373. [Google Scholar] [CrossRef]
  39. Kujawska, J. Content of Heavy Metals in Various Biochar and Assessment Environmental Risk. J. Ecol. Eng. 2023, 24, 287–295. [Google Scholar] [CrossRef]
  40. Kumar, N.V.; Sawargaonkar, G.; Rani, C.S.; Pasumarthi, R.; Kale, S.B.; Prakash, T.R.; Triveni, S.; Singh, A.; Davala, M.S.; Khopade, R.; et al. Harnessing the Potential of Pigeonpea and Maize Feedstock Biochar for Carbon Sequestration, Energy Generation, and Environmental Sustainability. Bioresour. Bioprocess. 2024, 11, 5. [Google Scholar] [CrossRef]
  41. Wystalska, K.; Kwarciak-Kozłowska, A. The Effect of Biodegradable Waste Pyrolysis Temperatures on Selected Biochar Properties. Materials 2021, 14, 1644. [Google Scholar] [CrossRef] [PubMed]
  42. Wu, X.; Ren, L.; Zhang, J.; Peng, H. Effects of Zeolite and Biochar Addition on Ammonia-Oxidizing Bacteria and Ammonia-Oxidizing Archaea Communities During Agricultural Waste Composting. Sustainability 2020, 12, 6336. [Google Scholar] [CrossRef]
  43. Mensah, R.A.; Shanmugam, V.; Narayanan, S.; Razavi, N.; Ulfberg, A.; Blanksvärd, T.; Sayahi, F.; Simonsson, P.; Reinke, B.; Försth, M.; et al. Biochar-Added Cementitious Materials—A Review on Mechanical, Thermal, and Environmental Properties. Sustainability 2021, 13, 9336. [Google Scholar] [CrossRef]
  44. Taha, M.R.; Mobasser, S. Adsorption of DDT and PCB by Nanomaterials from Residual Soil. PLoS ONE 2015, 10, e0144071. [Google Scholar] [CrossRef]
  45. Joseph, S.; Kammann, C.I.; Shepherd, J.G.; Conte, P.; Schmidt, H.-P.; Hagemann, N.; Rich, A.M.; Marjo, C.E.; Allen, J.; Munroe, P.; et al. Microstructural and Associated Chemical Changes during the Composting of a High Temperature Biochar: Mechanisms for Nitrate, Phosphate and Other Nutrient Retention and Release. Sci. Total Environ. 2018, 618, 1210–1223. [Google Scholar] [CrossRef] [PubMed]
  46. Sanford, J.R.; Larson, R.A.; Runge, T. Nitrate Sorption to Biochar Following Chemical Oxidation. Sci. Total Environ. 2019, 669, 938–947. [Google Scholar] [CrossRef] [PubMed]
  47. Wang, T.; Zhang, D.; Fang, K.; Zhu, W.; Peng, Q.; Xie, Z. Enhanced Nitrate Removal by Physical Activation and Mg/Al Layered Double Hydroxide Modified Biochar Derived from Wood Waste: Adsorption Characteristics and Mechanisms. J. Environ. Chem. Eng. 2021, 9, 105184. [Google Scholar] [CrossRef]
  48. Feng, C.; Xing, Y.; Li, F.; Li, S.; Luo, Z. Enhancing Nitrogen Removal from Rainwater Runoff Using a Bioretention System with Magnesium-Modified Biochar as a Filler Amendment. J. Water Process Eng. 2024, 67, 106215. [Google Scholar] [CrossRef]
Figure 1. Process flow for the size reduction and pyrolysis of railroad tie biomass.
Bioresourbioprod 01 00005 g001
Figure 2. Proximate Analysis of Biochar at Different Temperatures.
Bioresourbioprod 01 00005 g002
Figure 3. Particle Size Distribution After and Before Pyrolysis. Error bars denote standard error of the mean (n = 2 independent runs).
Bioresourbioprod 01 00005 g003
Figure 4. Images from a scanning electron microscope (SEM) visually demonstrating how an increase in temperature results in enhanced surface area.
Bioresourbioprod 01 00005 g004
Figure 5. Effect of biochar dosage on nitrate adsorption efficiency at varying Initial Nitrate concentrations. Biochar produced at 600 °C was applied at dosages ranging from 0.1 to 1 g, while initial nitrate concentrations in solution varied from 0.3 to 10 ppm.
Bioresourbioprod 01 00005 g005
Figure 6. Effect of biochar dosage on phosphate adsorption efficiency at varying initial phosphate concentrations. Biochar produced at 600 °C was applied at dosages ranging from 0.1 to 1 g, while initial phosphate concentrations in solution varied from 0.3 to 10 ppm.
Bioresourbioprod 01 00005 g006
Figure 7. FTIR result of produced biochar at different temperature point.
Bioresourbioprod 01 00005 g007
Figure 8. Comparison of unmodified and magnesium-modified biochars (pyrolyzed at 600 °C or 700 °C) in the adsorption of nitrate at a concentration of 20,000 ppm. The modified biochars, especially the one treated at 600 °C, exhibited significantly higher adsorption capacities than the unmodified biochar, especially for nitrate at lower biochar concentrations (0.1–0.5 mg/kg).
Bioresourbioprod 01 00005 g008
Table 1. Physicochemical Properties of Biochar Produced at Different Pyrolysis Temperatures.
Temperature
(°C)
pH Bulk Density (g/cm3)Moisture (%)Organic Matter (%)Organic Carbon (%)C (%)N (%)
2506.04 ± 0.100.18 ± 0.001.94 ± 0.1273.61 ± 3.3443.42 ± 1.94680.44 ± 0.06
3006.00 ± 0.000.23 ± 0.032.10 ± 0.2174.10 ± 4.3243.08 ± 1.98730.56 ± 0.03
3505.67 ± 0.330.25 ± 0.002.29 ± 0.1271.65 ± 2.7841.66 ± 2.63 760.62 ± 0.02
4007.57 ± 0.120.32 ± 0.002.29 ± 0.1274.68 ± 6.3543.42 ± 2.51770.57 ± 0.03
4507.10 ± 0.100.32 ± 0.002.46 ± 0.0474.50 ± 5.5143.31 ± 2.43720.50 ± 0.06
5007.00 ± 0.000.28 ± 0.032.39 ± 0.1174.22 ± 4.2243.15 ± 1.51700.56 ± 0.07
5507.10 ± 0.200.30 ± 0.042.50 ± 0.0071.62 ± 4.2241.64 ± 1.62 800.62 ± 0.05
6009.57 ± 0.230.33 ± 0.002.50 ± 0.0066.67 ± 4.3938.76 ± 2.82750.61 ± 0.03
6508.99 ± 0.010.33 ± 0.002.50 ± 0.0065.98 ± 4.7938.36 ± 3.76700.70 ± 0.03
70010.27 ± 0.370.36 ± 0.022.50 ± 0.0062.39 ± 4.5236.28 ± 3.69710.66 ± 0.02
All values are presented as mean ± standard error (n = 3 independent runs).
Table 2. Total elemental concentrations (mg/kg, dry weight) in biochar produced at 400 °C and 600 °C, compared to IBI biochar standards (maximum allowed values). “NA” indicates below detection limit.
Element (ppm)Biochar Produced at 400 °CBiochar Produced at 600 °CIBI Reportable Limit
Mercury—HgN/AN/A1
Boron—B0.140.123.15
Arsenic—As0.030.0232
Chromium—Cr0.120.0832
Manganese—Mn1.61.4632
Cobalt—Co0.10.134
Copper—Cu0.30.0634
Tin—Sn0.0410.03436
Cadmium—Cd0.20.22
Nickel—Ni0.70.6330
Selenium—Se0.580.6136
Molybdenum—Mo0.010.0175
Lead—Pb0.040.04121
Zinc—Zn0.650.6200
Iron—Fe52.0549.91580
Sodium—Na6.916.7declaration
Table 3. Resulting surface area of railroad tie biochar at different final temperatures. Particle size does have an impact on surface area, and temperatures ≥600 °C should be employed.
Final Temperature During
Pyrolysis [°C]
Surface Area (m2/g) of Biochar
from 1–5 cm Pre-Pyrolysis *
Surface Area (m2/g) of Biochar from 5 to 10 mm Pre-Pyrolysis *
3000.6130.99
4000.772.6
5001.979.8
600373431.28
700378454.86
* pre-pyrolysis refers to feedstock size before pyrolysis.
Disclaimer/Publisher’s Note: The statements, opinions and data contained in all publications are solely those of the individual author(s) and contributor(s) and not of MDPI and/or the editor(s). MDPI and/or the editor(s) disclaim responsibility for any injury to people or property resulting from any ideas, methods, instructions or products referred to in the content.