Article

Impact of Mining and Processing of Critical Raw Materials on Water Quality—A Case Study of the Luda Yana River, Bulgaria


by
Kristina Gartsiyanova
National Institute of Geophysics, Geodesy and Geography, Bulgarian Academy of Sciences (NIGGG-BAS), Acad. G. Bonchev Str., bl. 3, 1113 Sofia, Bulgaria
Purification 2026, 2(3), 13; https://doi.org/10.3390/purification2030013
Submission received: 29 May 2026 / Revised: 2 July 2026 / Accepted: 21 August 2026 / Published: 25 August 2026

Abstract

This study investigates the impact of critical raw material mining and processing on surface water quality within a representative catchment area, using the Luda Yana River Basin in Southern Bulgaria as a case study. Water quality was evaluated using the Canadian Council of Ministers of the Environment Water Quality Index (CCME WQI), based on data collected from five monitoring stations. The analysis focused on key heavy metals, including Cu, Zn, Pb, Cd, Fe, Mn, Ni, and As, reflecting the influence of both active and historical mining activities in the region. Index values were calculated for the period 2008–2024 and revealed considerable temporal variability and pronounced spatial differences in water quality along the river course. This study provides one of the first long-term integrated assessments of heavy-metal-related water quality in a mining-impacted river basin in Bulgaria using the CCME WQI framework and offers new evidence on the cumulative effects of historical and ongoing mining activities on surface waters. The calculated CCME WQI values ranged from very low levels indicating poor conditions to moderate values corresponding to marginal and, occasionally, fair conditions. Overall, the predominant water quality categories were “poor” and “marginal.” The results demonstrate that the waters of the studied river basin remain below the thresholds for “fair” physicochemical status as defined by the European Water Framework Directive (2000/60/EC) and the corresponding Bulgarian legislation, including Regulation No. H-4/2012 on surface water characterization and the 2010 Ordinance on environmental quality standards for priority substances and certain pollutants. The findings highlight the persistent anthropogenic pressure exerted on the river system and emphasize the need for improved water management strategies. The study further underlines the importance of integrating environmental protection measures into the exploitation of critical raw materials in order to balance economic development with the sustainable management of water resources.

1. Introduction

Achieving the European Union’s environmental goals to reduce carbon emissions requires a fundamental shift in the use of the Earth’s resources. The European Green Deal (2019) aims to make Europe the first climate-neutral continent by 2050. Critical and strategic raw materials are essential to achieving this [1].
In recent decades, the growing demand for mineral resources associated with industrial development and the transition to a low-carbon economy has led to the expansion of mining and mineral-processing activities on both global and regional scales. These activities exert considerable pressure on environmental components, among which water resources are particularly vulnerable [2]. Additional investments are currently needed, in addition to researching and updating the assessment of Bulgaria’s extraction potential, reserves and resources, as well as conducting an environmental and water impact assessment [3].
Surface waters in areas affected by active or historical mining operations are exposed to contamination from both direct sources, such as process waters, waste streams, and tailings facilities, and diffuse sources, including surface runoff and infiltration processes [4]. These impacts alter the chemical composition of water bodies and may significantly deteriorate their ecological status. River water quality is of fundamental importance for the maintenance of aquatic ecosystems and for socio-economic activities such as drinking water supply, irrigation, and industrial use [5].
Bulgaria has a long-standing mining tradition, with intensive mining activities having been carried out for decades in several regions of the country [6]. The ongoing pollution of water bodies from decommissioned mines and mining waste facilities in Bulgaria is a serious problem, leading to a contamination of river waters with heavy metals [7,8,9].
One representative example is the Luda Yana River catchment, located in Southern Bulgaria within the Maritsa River Basin, where both active and historical mining sites are present.
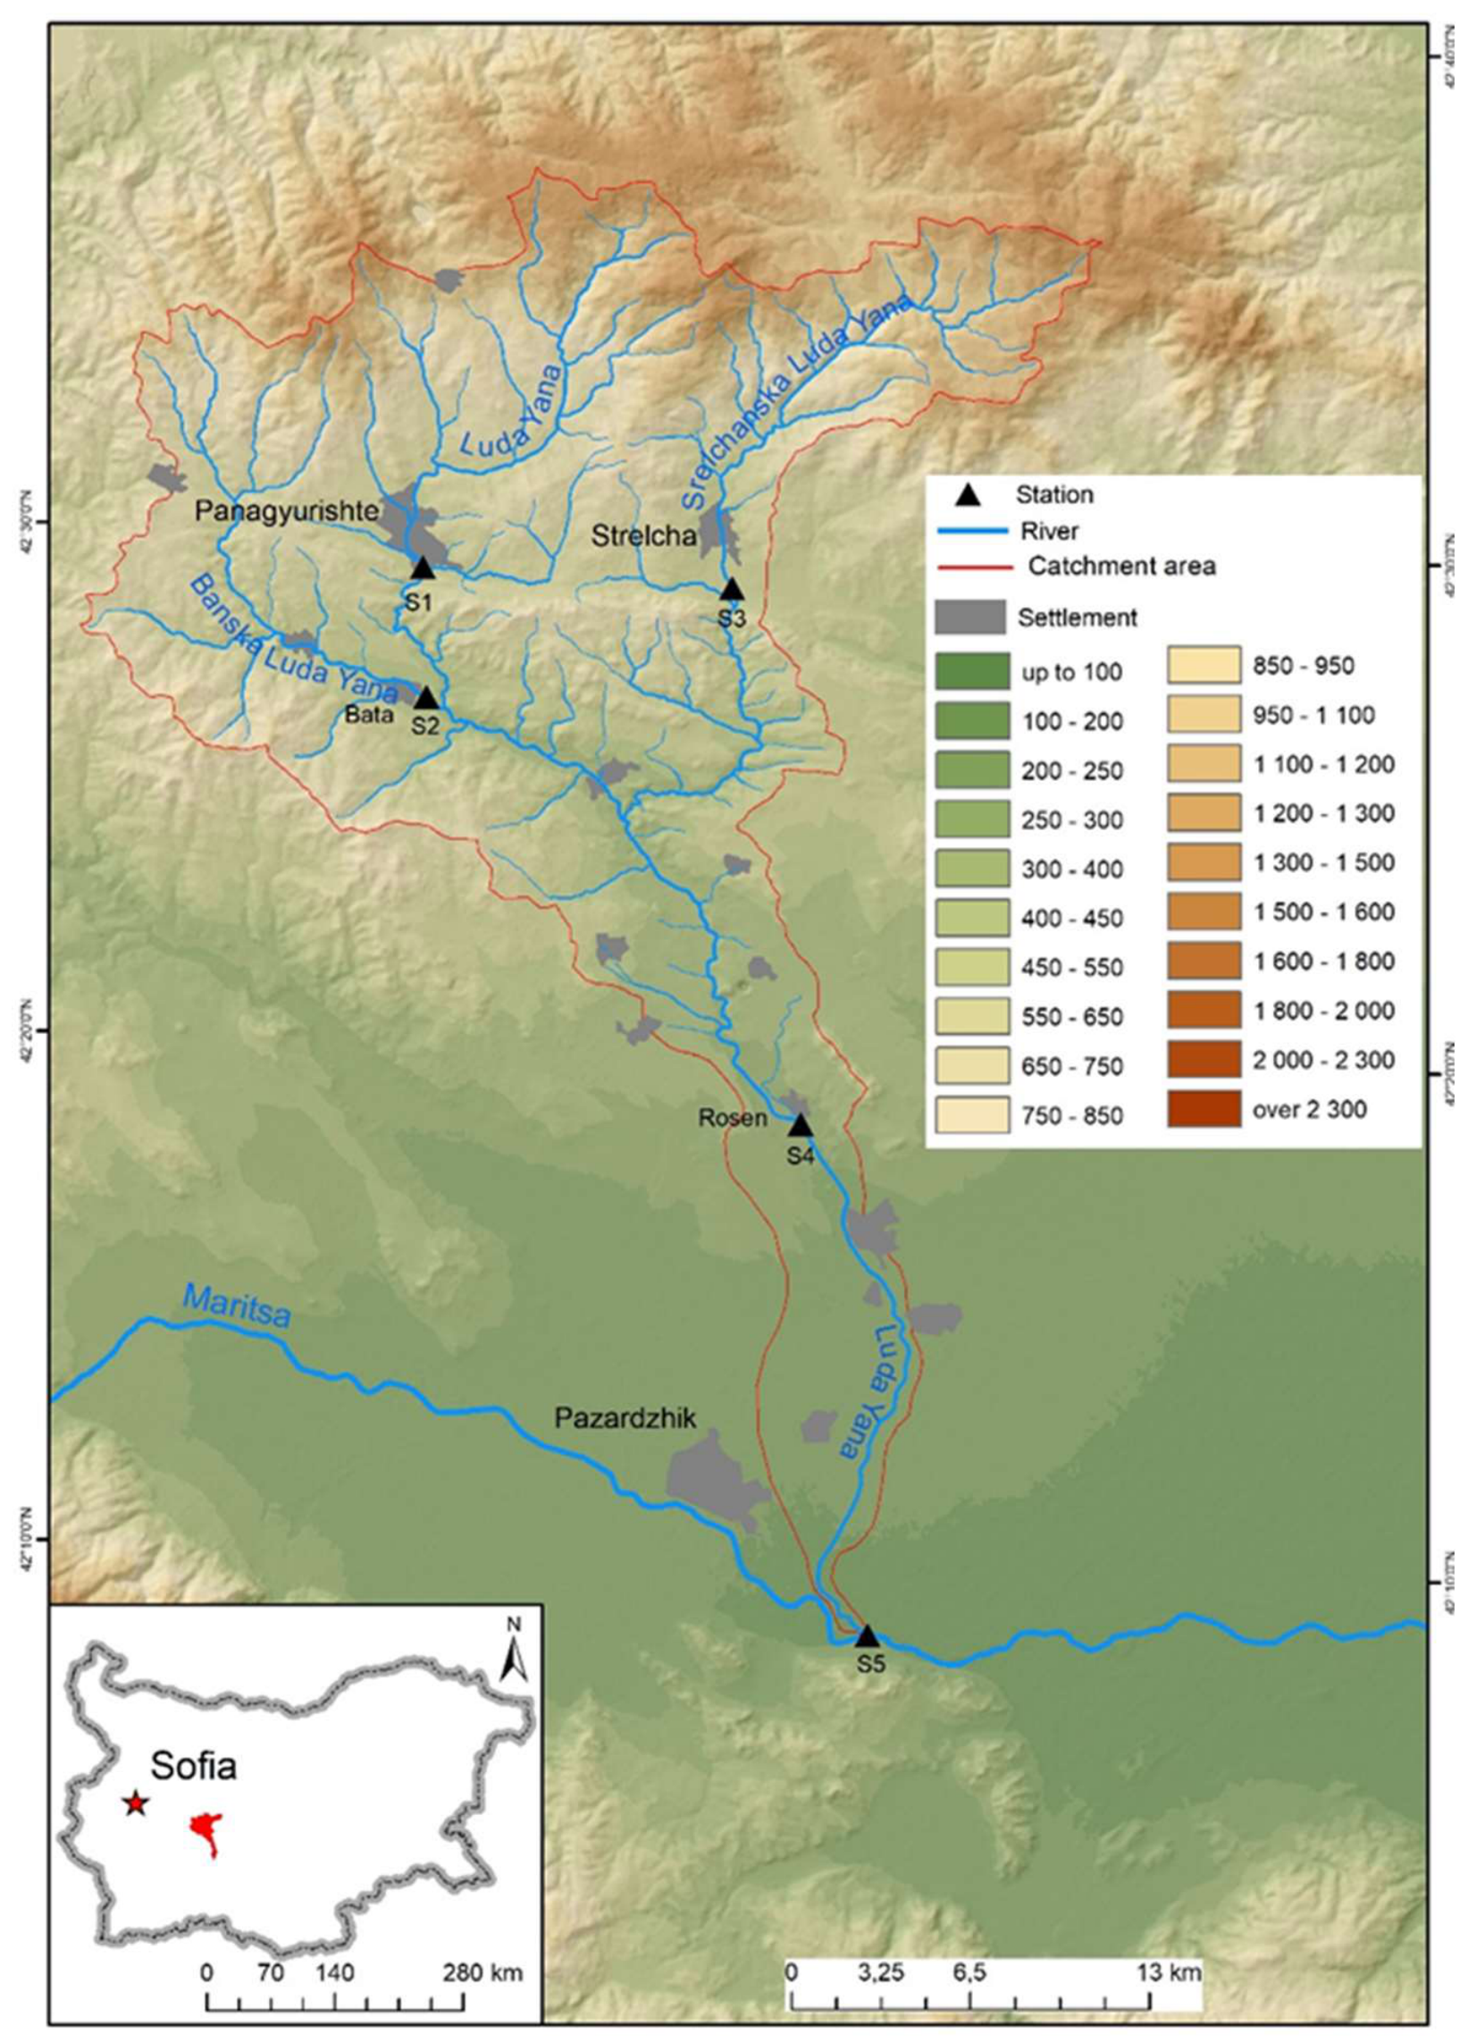
The primary objective of this study was to assess the water quality of the Luda Yana River by examining the spatial and temporal variations in heavy metal concentrations in relation to mining development within the region at selected monitoring points during the period 2008–2024 (Figure 1). In this context, integrated water quality assessment indices, such as the CCME Water Quality Index (CCME WQI) applied in this study, have proven to be effective tools for summarizing complex information derived from multiple physicochemical indicators into a single comprehensive assessment [10,11].
The obtained results may support decision-making processes related to water resource management and the mitigation of the negative environmental impacts of mining activities [12]. Furthermore, the study contributes to the broader scientific discussion regarding the applicability of integrated indices for assessing anthropogenic pressure on aquatic ecosystems through the presentation of a specific regional case study [13,14,15,16,17,18,19,20,21].
More broadly, increasing competition for water resources among industry, agriculture, and households, combined with the emerging consequences of climate change, has made the balance between the strategic need for access to critical raw materials and the protection of water bodies a key element of sustainable development.

2. Materials and Methods

2.1. Materials

2.1.1. Study Area

The Luda Yana River originates in the Sashtinska Sredna Gora Mountains and has a total length of 74 km, with a catchment area of 685 km2. It is a left tributary of the Maritsa River, while its principal tributary is the Strelchanska Luda Yana River [22]. The watershed of the Luda Yana River is subject to substantial anthropogenic pressure due to the concentration of industrial activities related to ore mining and non-ferrous metallurgy. In addition, intensive agriculture and significant municipal activities are developed within the basin [23]. Owing to the diversity and intensity of anthropogenic impacts, the Luda Yana River Basin is frequently identified as an ecological “hot spot.”

2.1.2. Monitoring Points, Chemical Elements and Period of the Study

This study utilized officially published surface water quality data provided by the Executive Environment Agency (ExEA) Sofia, Bulgaria under the Ministry of Environment and Water (MOEW) [24]. The selected monitoring stations were chosen based on three criteria: (i) continuous data availability for the study period, (ii) spatial representativeness along the river course, and (iii) their proximity to areas affected by mining, industrial, and urban activities. Stations with substantial data gaps were excluded from the analysis. Based on the spatial distribution of monitoring sites and the completeness of available datasets, five monitoring points were selected for analysis (Table 1).
The analysis and integrated assessment of river water quality were based on the concentrations of selected priority substances and specific pollutants, namely As, Cu, Zn, Fe, Mn, Pb, Cd, and Ni. The selected heavy metals (As, Cu, Zn, Fe, Mn, Pb, Cd, and Ni) were chosen because they are among the most common contaminants associated with ore extraction and processing in the Panagyurishte mining region and are included in national monitoring programmes and environmental quality standards. The present assessment focuses on heavy metals because they are the most characteristic pollutants associated with mining activities in the study area and are included among the priority substances monitored under the national water quality monitoring programme.
The obtained results are considered representative because, according to the national monitoring programmes implemented in Bulgaria, the investigated indicators are measured at least four times annually or once per season. The monitoring frequency (at least four measurements annually) corresponds to the official national monitoring programme and provides sufficient temporal coverage for long-term trend assessment while ensuring data consistency throughout the study period. Considering the availability of data and the absence of comparable studies, the period 2008–2024 was selected for analysis. The study period (2008–2024) was selected because it represents the longest continuous and sufficiently complete monitoring dataset available for the selected stations. The long-term perspective allows the identification of persistent pollution trends and the cumulative effects of historical and ongoing mining activities on river water quality.

2.1.3. Regulations

The study is based on the provisions of the Water Framework Directive 2000/60/EC (WFD), whose principal objective is the achievement of “fair” ecological status for all water bodies. The Directive has been transposed into Bulgarian legislation through Regulation No. H-4/2012 on surface water characterization and the 2010 Ordinance on environmental quality standards for priority substances and certain pollutants) [25,26,27].

2.2. Methods

To evaluate the overall level of heavy metal contamination, the Canadian Council of Ministers of the Environment Water Quality Index (CCME WQI) was applied. The CCME WQI was selected because it is one of the most flexible and internationally recognized water quality indices. Unlike many traditional indices, CCME WQI allows the incorporation of different environmental standards and can effectively integrate multiple pollutants with varying monitoring frequencies. This makes it particularly suitable for long-term datasets and for assessing water bodies affected by complex anthropogenic pressures such as mining activities. The index assessment is based on three components characterizing anthropogenic impacts on water quality:
F1 (Scope)—expresses the proportion of water quality variables that fail to meet the established regulatory standards;
F2 (Frequency)—represents the frequency with which measured concentrations exceed permissible limits;
F3 (Amplitude)—indicates the magnitude by which failed test values exceed the corresponding guideline values.
After determining the values of the three components, the integrated CCME WQI is calculated using the standard formula:
W Q I =   100     F 1 2 + F 2 2 + F 3 2 1.732
The divisor 1.732 normalizes the index values to a range between 0 and 100, where 0 represents the worst possible water quality and 100 the “best” possible condition. According to the CCME WQI classification system, water quality is categorized as follows: “Poor” 0–44; “Marginal” 45–64; “Fair” 65–79; “Good” 80–94, and “Excellent” 95–100 [10,11]. The interpretation of water quality status presented in the manuscript is based on the established classification framework of the CCME Water Quality Index, which constitutes the methodological basis of the study. The reported status categories are derived directly from the calculated index values and their corresponding classification thresholds.
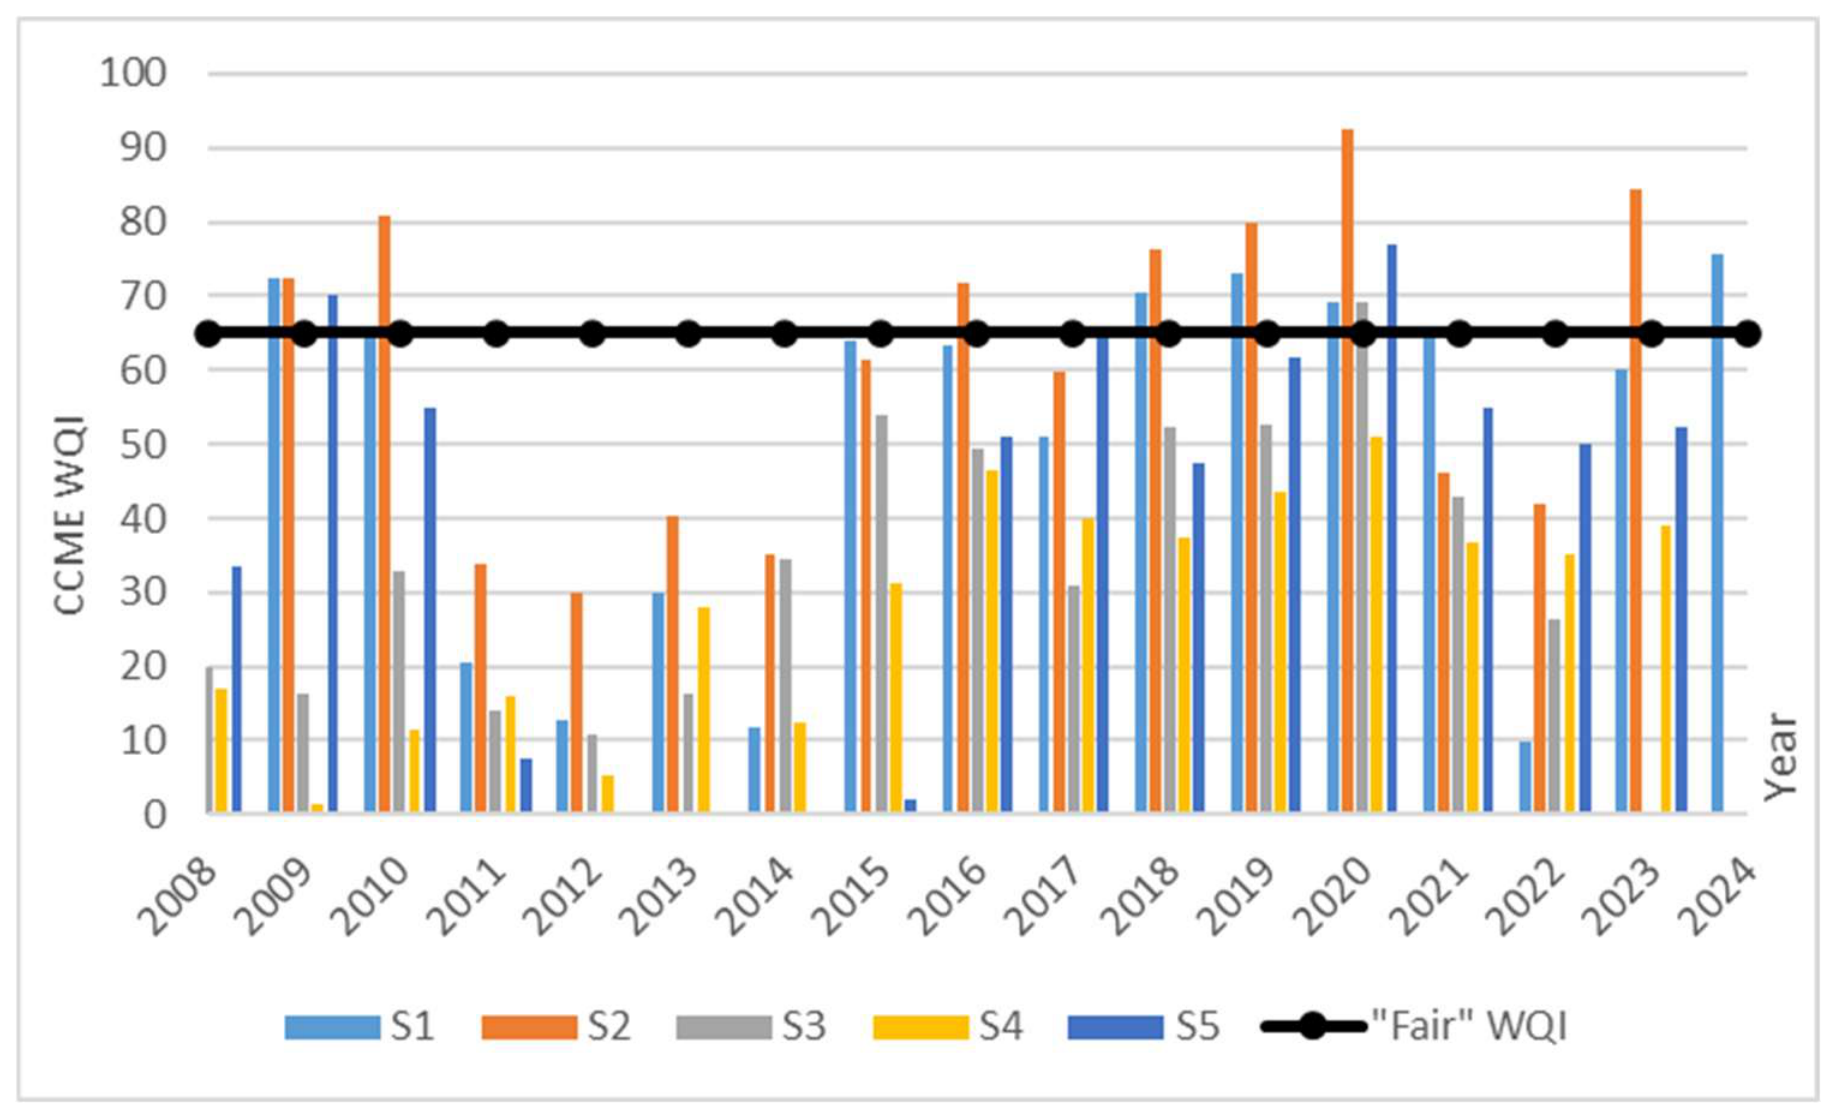
According to the EU WFD and its harmonisation with Bulgarian legislation, the physicochemical status of river waters is based on 3 categories—moderate, good and very good. In hydrological studies in the country, CCME-WQI is established as the most effective in accordance with national legislation. In this regard, it is necessary to clarify that the relevant water quality classes in national legislation are—Very good 80–100, Good 65–79 and Moderate 0–64, which correspond to Excellent (95–100) and Good (80–94), Fair (65–79), Marginal (45–64) and Poor (0–44) of CCME WQI. The value required to meet the quality criteria needs to fall within the range 65–79. Figure 2 shows the minimum value of 65 as a quality standard.

3. Results

Figure 2 presents the results obtained from the application of the WQI for the study period and monitoring points. For monitoring point S1, the CCME WQI values vary considerably, ranging approximately from 10 to 75, which reflects substantial variability in aquatic environmental conditions. According to the CCME WQI classification system, the calculated values fall predominantly within the “poor” and “marginal” categories, with only occasional values corresponding to “fair” conditions. These results indicate frequent exceedances of regulatory threshold values and compromised water quality.
Analysis of the index components (F1, F2, and F3) further confirms this trend. The F1 component indicates that a significant proportion of the monitored parameters fail to comply with regulatory requirements, suggesting the presence of multiple pollution sources. The F2 values demonstrate frequent exceedances over time, reflecting persistent pressure on the water body. The greatest contribution to the reduction in overall index values is associated with F3, which reflects substantial deviations from permissible concentrations.
At monitoring point S2, CCME WQI values range from low to moderate levels, with “fair” and “marginal” categories predominating. Although episodic improvements in water quality are observed, the overall condition remains unstable. The values of F1 indicate that a considerable proportion of the studied parameters exceed regulatory standards, while the relatively high F2 values suggest frequent exceedances over time. The dominant influence of F3 demonstrates the occurrence of substantial deviations from permissible concentrations.
At point S3, CCME WQI values corresponding to the “poor” and “marginal” categories predominate, indicating persistently degraded river water quality. The F1 component remains relatively high, while F2 and F3 continue to exert a significant influence on the formation of low CCME WQI values.
Similarly, water quality at point S4 is characterized mainly by “marginal” and “fair” conditions. The index values indicate substantial anthropogenic pressure on the water body, while the combined influence of F1, F2, and F3 reflects a markedly deteriorated environmental state with continued exceedances of quality standards.
At the downstream monitoring point S5, a relative stabilization of water quality is observed, with more frequent values within the “fair” category and fewer instances of “poor” conditions. This trend may be attributed to natural dilution, sedimentation, and self-purification processes. Nevertheless, deviations from regulatory standards remain evident, indicating that pollutant impacts persist throughout the river system. At this point, the lowest F1, F2, and F3 values are recorded compared to the upstream sites, resulting in relatively higher WQI values and comparatively improved water quality.
The detailed annual values of CCME WQI and its components (F1, F2 and F3) are provided in Table 2, Table 3, Table 4, Table 5 and Table 6.
The combined influence of the three CCME WQI components results overall in low index values, characterizing the river waters as ecologically unstable. The observed fluctuations in index values suggest episodic pollution events likely associated with anthropogenic activities in the Panagyurishte region, including industrial and domestic sources. Overall, the water quality of the Luda Yana River ranges from poor to fair, with unfavorable categories predominating, thereby emphasizing the need for enhanced monitoring and the implementation of effective pollution mitigation measures.
Because Figure 2 presents annual CCME WQI values calculated from multiple monitoring observations, error bars are not directly applicable. However, a supplementary table containing annual index values has been added to provide additional information regarding temporal variability.

4. Discussion

The comparative analysis of river water quality with respect to heavy metal concentrations reveals pronounced spatial variability. Seasonal hydrological variability may influence the observed concentrations through dilution during high-flow periods and concentration effects during low-flow conditions. In addition, increasing temperatures and more frequent drought events associated with climate change may further affect pollutant transport and accumulation. Although mining and mineral-processing activities are considered the dominant sources of heavy metal contamination in the basin, other anthropogenic pressures, including agricultural runoff, municipal wastewater discharges, and urban development, may also contribute to the observed deterioration of water quality.
At nearly all investigated monitoring points (S1 and S3–S5), with the exception of S2 near the village of Bata, extremely low CCME WQI values were recorded during individual years, indicating severely degraded water quality and persistent anthropogenic pressure. These conditions are likely associated with localized pollution sources originating from both historical and contemporary mining activities in the Panagyurishte region, as well as from industrial and urban influences.
At points S1, S3, S4, and S5, the components F1, F2, and F3 exhibit consistently high values, indicating that the majority of analysed parameters exceed regulatory standards, with both frequent exceedances and substantial deviations from permissible concentrations. In the middle reaches of the river (S3 and S4), no period was identified during which WQI values reached the “fair” category.
The best overall water quality conditions were observed at point S2, although the recorded values still remained outside optimal environmental limits. At this location, both the frequency and amplitude of exceedances decrease, resulting in comparatively higher WQI values.
Overall, the results do not indicate a clear long-term trend toward improvement in water quality along the river course. Minor improvements observed within certain temporal and spatial intervals may be attributed to the natural self-purification capacity of the river system. The analysis of CCME WQI values for the period 2008–2024 demonstrates the presence of persistent and intensive anthropogenic pressure associated with elevated concentrations of heavy metals classified as priority pollutants under European legislation.
Despite the relatively improved conditions observed at the river mouth (S5), water quality generally remains below the threshold required for “fair” ecological status throughout most of the study period. In areas characterized by intensive historical and current mining and industrial activities, the results indicate persistent exceedances of regulatory standards and strong anthropogenic influence.
The observed deterioration of water quality in the upper and middle reaches of the river is likely related to the long-term influence of the copper mining complex and associated waste disposal facilities. Previous studies have reported elevated concentrations of Cu, Zn, As, and other metals in streams affected by mining activities in the Panagyurishte region. Elevated concentrations of arsenic, cadmium, and lead may pose significant risks to human health through direct water consumption, irrigation, and bioaccumulation within aquatic food chains. Long-term exposure to arsenic has been associated with carcinogenic effects, while cadmium and lead may affect renal, neurological, and cardiovascular functions. Therefore, maintaining low concentrations of these pollutants is essential for protecting both ecosystem and human health.
Similar degradation of water quality associated with elevated heavy metal concentrations has been reported in several mining-affected river basins worldwide, including the Rio Tinto Basin (Spain), mining regions in Serbia and Romania, and other European mining districts. Although site-specific factors differ, these studies likewise demonstrate persistent anthropogenic pressure and difficulties in achieving good ecological status in rivers affected by mining activities.
These findings highlight the urgent need for effective pollution control measures in the upper reaches of the river basin, which exert a decisive influence on the overall ecological condition of the river system.

4.1. Policies and Management Decisions for Treatment

In accordance with the Water Framework Directive, programmes of measures should aim to identify significant anthropogenic pressures, including mining activities, and achieve long-term reductions in pollution by hazardous substances.
First, improved treatment of wastewater generated during the extraction and processing of metal ores is necessary, particularly with regard to the removal of heavy metals such as Cu, Zn, Pb, and Cd. This requires the implementation of advanced treatment technologies, including sorption, membrane filtration, and chemical treatment methods, to reduce pollutant discharge into aquatic environments.
Second, monitoring and control of both point and diffuse pollution sources should be strengthened, particularly in the Panagyurishte region where industrial activities are concentrated. The implementation of early warning systems and more frequent monitoring campaigns would improve risk assessment and management efficiency.
Finally, sustainable management strategies for critical raw materials should be promoted in order to balance the economic benefits of mining activities, especially copper extraction, with environmental protection requirements. This necessitates the integration of environmental standards into all stages of mining planning, operation, and post-closure management.

4.2. Limitations and Future Research

Several limitations should be acknowledged in the present study. Although the dataset covers a relatively long period, potential inconsistencies and gaps in monitoring practices may affect the comparability of results. Furthermore, the assessment focuses primarily on physicochemical parameters, particularly heavy metal concentrations, which may be considered a limitation because biological and ecological indicators were not included.
Although the CCME WQI is a useful tool for aggregating complex environmental data into a single index, it may partially mask the variability of individual parameters and does not explicitly account for synergistic or cumulative effects among pollutants. Nevertheless, the primary objective of the study was to provide an integrated assessment of overall water quality trends rather than a detailed toxicological evaluation.
Biological quality elements such as macrozoobenthos, phytobenthos, or fish communities were not included in the present study. Future research should integrate ecological indicators with physicochemical assessments to provide a more comprehensive evaluation of river ecosystem health.
Future research should incorporate multidisciplinary approaches, differentiated pollutant assessments, and more detailed analyses of pollution source distribution within the river basin.

5. Conclusions

This study provides a baseline assessment of the water quality status of the Luda Yana River during the period 2008–2024 through the application of the CCME Water Quality Index.
The study contributes to the existing literature by presenting a long-term assessment of a mining-impacted river basin using an integrated index-based approach. These findings provide a scientific basis for future monitoring strategies and management decisions aimed at improving water quality within the catchment.
The findings demonstrate that the Luda Yana River generally remains below the threshold corresponding to the “fair” category according to the CCME WQI classification.
The analysis of the Luda Yana River as a representative case study enables the formulation of practical recommendations aimed at balancing economic development with environmental sustainability in the context of the growing importance of critical raw materials. The study highlights the necessity of adopting an integrated approach to water resource management, in which the extraction of critical raw materials, particularly copper, is conducted in strict compliance with environmental standards to ensure the achievement of “fair” environmental status in accordance with the European regulatory framework. The scientific contribution of this study lies in providing a long-term integrated assessment of river water quality in a mining-affected region using the CCME Water Quality Index. The observed results may support future monitoring strategies and management decisions aimed at improving water quality within the catchment.

Funding

This work has been carried out in the framework of the National Science Program “Critical and strategic raw materials for a green transition and sustainable development”, approved by the Resolution of the Council of Ministers № 508/18.07.2024 and funded by the Ministry of Education and Science (MES) of Bulgaria.

Data Availability Statement

The data used in this study were obtained from the Executive Environment Agency (ExEA), Bulgaria, within the framework of the National Environmental Monitoring System. The datasets are publicly available through the official information resources and monitoring reports of the Agency. Additional information can be provided by the corresponding author upon reasonable request.

Conflicts of Interest

The author declares no conflicts of interest.

References

  1. Toteva, A.; Vatseva, R.; Katsarov, M.; Dinkov, D.; Peneva, A.; Ivanov, Y. Designing and structuring of a database for critical and strategic raw materials in Bulgaria. Rev. Bulg. Geol. Soc. 2025, 86, 95–98. [Google Scholar] [CrossRef] [Scilit]
  2. Georgiev, S. Critical and strategic raw materials in Bulgaria: An outline of the new National Scientific Program. Rev. Bulg. Geol. Soc. 2024, 85, 15–18. [Google Scholar] [CrossRef] [Scilit]
  3. Sofronieva, A. Availability of critical and strategic metals in Bulgaria in the context of international priorities. Ann. Univ. Min. Geol. “St. Ivan Rilski” 2025, 68, 317–323, (In Bulgarian with English abstract). [Google Scholar] [CrossRef]
  4. Rabadjieva, D.; Tepavitcharova, S.; Todorov, T.; Dassenakis, M.; Paraskevopoulou, V.; Petrov, M. Chemical speciation in mining affected waters: The case study of Asarel-Medet mine. Environ. Monit. Assess. 2009, 159, 353–366. [Google Scholar] [CrossRef] [Scilit]
  5. Simova, I.; Velichkova, R.; Pavlova, Y.; Zelenakova, M. Environmental and social aspects of the mining water in Bulgaria. In E3S Web of Conferences 638—International Conference on Electronics, Engineering Physics and Earth Science (EEPES 2025), Alexandroupolis, Greece, 18–20 June 2025; EDP Sciences: Les Ulis, France, 2025; pp. 1–11. [Google Scholar] [CrossRef] [Scilit]
  6. Seymenov, K. Evaluation of water contamination in a crossborder river catchment affected by mining activities (a case study between Republics of Serbia and Bulgaria). Forum Geogr. 2023, XXII, 144–150. [Google Scholar] [CrossRef] [Scilit]
  7. Vladimirova, M.; Kirova, L.; Traykov, I. Phytotoxicological assessment of AMD affected river waters in “Sredna Gora”, Bulgaria to Lepidium sativum L. In IOP Conference Series: Earth and Environmental Science 1305—International Conference: Kliment’s Days 2023—60 years Faculty of Biology, Sofia, Bulgaria, 9–11 November 2023; IOP Publishing: Bristol, UK, 2023; pp. 1–12. [Google Scholar] [CrossRef] [Scilit]
  8. Zaharieva, P.; Kirin, D.; Zaharieva, R. Hydrobiological Monitoring of Two Rivers From the Maritsa River Basin Based on a Biological Quality Element Macrozoobenthos. Sci. Pap. Ser. D Anim. Sci. 2024, LXVII, 660–667. [Google Scholar]
  9. Gartsiyanova, K.; Kitev, A.; Varbanov, M.; Georgieva, S.; Genchev, S. Water quality assessment and conservation of the river water in regions with various anthropogenic activities in Bulgaria: A case study of the catchments of Topolnitsa and Luda Yana Rivers. Int. J. Conserv. Sci. 2022, 13, 733–742. [Google Scholar]
  10. Canadian Council of Ministers of the Environment (CCME). CanadianWater Quality Guidelines for the Protection of Aquatic Life; Canadian Water Quality Index 1.0 Technical Report; Canadian Council of Ministers of the Environment: Winnipeg, MB, Canada, 2001; Available online: https://unstats.un.org/unsd/envaccounting/ceea/archive/Water/CCME_Canada.PDF (accessed on 4 May 2026).
  11. Canadian Council of Ministers of the Environment. Synthesis of Research and Application of the CCME WQI. 2017. Available online: https://ccme.ca/en/res/synthesis-of-research-and-application-of-the-ccme-water-quality-index-2017.pdf (accessed on 4 May 2026).
  12. Kolcheva, K. Water Policy and Management of Water Resources in the World and in Bulgaria; Paisii Hilendarski University Publishing House: Plovdiv, Bulgaria, 2020. (In Bulgarian) [Google Scholar]
  13. Amils, R.; Fernández-Remolar, D.; The IPBSL Team. Río Tinto: A Geochemical and Mineralogical Terrestrial Analogue of Mars. Life 2014, 4, 511–534. [Google Scholar] [CrossRef] [Scilit]
  14. Atakhanova, Z.; Meirambayeva, M.; Baigaliyeva, M. Mine Water Use in Kazakhstan: Data Issues, Risks, and Regulations. Sustainability 2024, 16, 2456. [Google Scholar] [CrossRef] [Scilit]
  15. Gvozdić, V.; Vidosavljević, M.; Venus, M.; Puntarić, D.; Užarević, Z.; Puntarić, E.; Begović, M.; Danolić, D.; Vidosavljević, D. Analysis of Selected Elements in Rivers and Streams of Papuk Nature Park, Croatia. Water 2025, 17, 902. [Google Scholar] [CrossRef] [Scilit]
  16. Zhalmagambetova, U.; Assanov, D.; Neftissov, A.; Biloshchytskyi, A.; Radelyuk, I. Implications of Water Quality Index and Multivariate Statistics for Improved Environmental Regulation in the Irtysh River Basin (Kazakhstan). Water 2024, 16, 2203. [Google Scholar] [CrossRef] [Scilit]
  17. Stevanović, Z.; Kovačević, R.; Marković, R.; Gardić, V.; Vulpe, B.C.; Boros, B.; Menghiu, G. State of the Surface Waters in Cross Border Region of Eastern Serbia and Caraș-Severin County—Moldova Noua in Romania. Stud. Univ. Babeș-Bolyai Chem. 2021, 66, 309–328. [Google Scholar] [CrossRef] [Scilit]
  18. Milijašević, D.; Milanović, A.; Brankov, J.; Radovanović, M. Water Quality Assessment of the Borska Reka River Using the WPI (Water Pollution Index) Method. Arch. Biol. Sci. 2011, 63, 819–824. [Google Scholar] [CrossRef] [Scilit]
  19. Glevitzky, M.; Bostan, R.; Varvara, S.; Corcheş, M.-T.; Dumitrel, G.-A.; Popa, M. Impact of Mining on River Water Quality in Roșia Montană Area, Romania, and the Use of Zeolites for Acid Mine Drainage Remediation. Clean Technol. 2025, 7, 41. [Google Scholar] [CrossRef] [Scilit]
  20. Diamantopoulou, E.; Pavlides, A.; Steiakakis, E.; Varouchakis, E.A. Geostatistical Analysis of Groundwater Data in a Mining Area in Greece. Hydrology 2024, 11, 102. [Google Scholar] [CrossRef] [Scilit]
  21. Filimon, M.N.; Popescu, R.; Horhat, F.G.; Voia, O.S. Environmental Impact of Mining Activity in Bor Area as Indicated by the Distribution of Heavy Metals and Bacterial Population Dynamics in Sediment. Knowl. Manag. Aquat. Ecosyst. 2016, 417, 30. [Google Scholar] [CrossRef] [Scilit]
  22. Hristova, N. River Waters of Bulgaria; Tip Top Press: Sofia, Bulgaria, 2012. (In Bulgarian) [Google Scholar]
  23. River Basin Management Plan for the East Aegean Region for the Period 2022–2027. The Ministry of Environment and Water. 2024. Available online: https://earbd.bg/indexdetails.php?menu_id=966&sys_lang=bg (accessed on 4 May 2026).
  24. Executive Environmental Agency (ExEA) to theMinistry of Environmental Protection and Water (MOEW) of the Republic of Bulgaria. Available online: https://eea.government.bg/water-mn (accessed on 4 May 2026).
  25. European Parliament; Council of the European Union. Directive 2000/60/EC of the European Parliament and of the Council establishing a framework for Community action in the field of water policy. Off. J. Eur. Union 2000, 327, 1–73. [Google Scholar]
  26. Ordinance N-4/2012 for Characterisation of Surface Waters. State Gazette 2013, 22, 9–46. Available online: https://legislation.apis.bg/doc/1003915/0 (accessed on 4 May 2026). (In Bulgarian)
  27. Regulation on Environmental Quality Standards for Priority Substances and Certain Other Pollutants; State Gazette of the Republic of Bulgaria: Sofia, Bulgaria, 2010; 88/2010; 97/2015.
Figure 1. Map of the study area.
Purification 02 00013 g001
Figure 2. Change in WQI values calculated for Luda Yana River in the period 2008–2024.
Purification 02 00013 g002
Table 1. Monitoring points—basic information.
Monitoring Point-Coordinates (x/y)Monitoring Point CodeMap Code
Luda Yana River—after the town of PanaguyirishteBG3MA00745MS1010S1
42.48429/24.1901
Luda Yana River—at village of BataBG3MA07443MS0980S2
42.45661/24.15892
Luda Yana River—after the town of StrelchaBG3MA07425MS0950S3
42.49767/24.32536
Luda Yana River—at village of RosenBG3MA07425MS0930S4
42.3129/24.36475
Luda Yana River—at the mouthBG3MA00741MS0920S5
42.16216/24.38103
Table 2. Annual values of CCME WQI and F1, F2 and F3 at monitoring point S1.
YearF1F2F3CCME WQI
200816.716.783.549.9
200942.914.016.572.3
201050.021.429.364.3
2011100.075.058.020.4
2012100.087.571.612.9
2013100.050.047.729.8
2014100.0100.058.411.7
201542.910.244.064.1
201650.020.033.663.3
201762.526.850.551.1
201837.524.125.470.4
201925.024.131.173.1
202025.025.939.769.0
202150.025.024.864.7
2022100.0100.066.79.7
2023
202425.025.022.975.7
Table 3. Annual values of CCME WQI and F1, F2 and F3 at monitoring point S2.
YearF1F2F3CCME WQI
200825.028.664.756.7
200916.721.439.172.5
201025.011.918.380.8
2011100.050.o24.034.0
20120.00.00.030.0
2013100.025.08.740.3
2014100.033.338.535.2
201516.76.764.361.5
201637.010.529.771.7
201750.014.346.459.8
201825.06.331.676.4
201925.07.923.379.8
202012.53.60.892.5
202150.028.173.846.0
20220.00.00.042.0
202314.35.722.284.4
20240.00.00.00.0
Table 4. Annual values of CCME WQI and F1, F2 and F3 at monitoring point S3.
YearF1F2F3CCME WQI
200875.075.089.319.9
200983.383.384.216.4
201080.065.053.433.0
2011100.0100.047.413.9
2012100.0100.062.510.7
2013100.075.073.716.2
2014100.050.020.234.4
201566.716.740.753.9
201660.030.056.649.3
201780.060.065.630.9
201860.045.035.052.2
201960.045.033.952.5
202040.033.312.669.1
202150.057.163.642.8
2022100.075.026.126.3
2023
2024
Table 5. Annual values of CCME WQI and F1, F2 and F3 at monitoring point S4.
YearF1F2F3CCME WQI
200883.371.892.916.9
2009100.0100.095.91.3
2010100.080.084.411.4
2011100.071.478.315.9
2012100.0100.083.05.3
2013100.050.055.028.1
2014100.087.573.212.4
201557.150.092.131.1
201650.018.276.146.4
201762.518.881.139.9
201857.126.987.837.5
201950.016.482.543.5
202037.514.374.950.9
202162.525.086.836.6
20220.00.00.035.0
202357.134.681.539.1
20240.00.00.00.0
Table 6. Annual values of CCME WQI and F1, F2 and F3 at monitoring point S5.
YearF1F2F3CCME WQI
200850.036.197.333.5
20090.00.00.070.0
201033.342.956.354.9
2011100.0100.075.07.6
20120.00.00.00.0
20130.00.00.00.0
20140.00.00.00.0
2015100.0100.094.11.9
201657.117.160.550.9
201728.69.652.065.3
201842.932.073.747.4
201937.514.952.761.7
202025.08.329.777.1
202137.522.964.854.8
20220.00.00.050.0
202342.929.064.052.5
202425.015.646.968.0
Disclaimer/Publisher’s Note: The statements, opinions and data contained in all publications are solely those of the individual author(s) and contributor(s) and not of MDPI and/or the editor(s). MDPI and/or the editor(s) disclaim responsibility for any injury to people or property resulting from any ideas, methods, instructions or products referred to in the content.