Article

Enhanced Heparin Adsorption from Porcine Mucosa Using Beta Zeolites: Optimization and Kinetic Analysis

1
Department of Physical and Environmental Sciences, Texas A&M University-Corpus Christi, Corpus Christi, TX 78412, USA
2
Department of Chemistry, University of Cincinnati, Cincinnati, OH 45221, USA
3
Department of Chemistry, Isfahan University of Technology, Isfahan 84156-83111, Iran
*
Author to whom correspondence should be addressed.
These authors contributed equally to this work.
Purification 2025, 1(2), 6; https://doi.org/10.3390/purification1020006 (registering DOI)
Submission received: 6 November 2024 / Revised: 3 June 2025 / Accepted: 22 August 2025 / Published: 30 August 2025

Abstract

Heparin, an essential plasma-derived therapy, acts as a naturally occurring anticoagulant and is essential in various physiological processes. Due to its complex structure, repeating units of sulfated glycosaminoglycan, it attracts attention in the field of commercial pharmaceuticals. In recent decades, significant advancements have been made in the development of economical adsorbents designed especially for the extraction of heparin from the intestinal mucosa of pigs, as evidenced by investments from various pharmaceutical industries. This requirement arises from the demand for efficient, scalable extraction methods for natural sources. In this study, we investigated the application of beta zeolites to increase the recovery of heparin from real porcine mucosa samples, emphasizing materials with greater adsorption surfaces, higher thermal stability, and increased porosity. According to our research, the zeolite CP814E’s macropores and huge surface area allow it to adsorb up to 20.6 mg·g−1 (39%) of heparin from actual mucosa samples. We also investigated the adsorbent’s surface conditions, which are essential for efficient heparin recovery, and adjusted temperature and pH to enhance heparin uptake. These findings demonstrate that zeolite-based adsorbents can enhance the extraction of heparin effectively for use in medicinal applications.

1. Introduction

In 2024, the coronary artery disease (CAD) segment held the largest revenue share of 23.4%, reflecting its significant impact as the most common heart disease involving the narrowing of coronary arteries and reduced blood flow to the heart [1]. CAD is a leading cause of mortality in the U.S., requiring interventions like heparin to prevent blood clots and manage acute events. Plasma-derived common therapy heparin is a heterogeneous, sulfur-enriched polysaccharide biopolymer characterized by a range of molecular weights [2]. The pharmaceutical industry’s growing reliance on plasma-derived products, such as heparin, is expected to drive market demand. For instance, Takeda’s investment of approximately USD 754 million in a new plasma therapy manufacturing facility in Japan highlights the sector’s commitment to meeting rising treatment needs [1,3]. Innovations in heparin production and aggressive market strategies, including mergers and acquisitions by major players like Pfizer and GlaxoSmithKline, contribute to market expansion. The global heparin market, valued at USD 7.56 billion in 2023, is projected to grow at a CAGR of 2.7% from 2024 to 2030, driven by the increasing prevalence of chronic diseases and demand for blood transfusions [1]. Innovations in heparin production, including bioengineered alternatives and advanced purification techniques, highlight the market’s dedication to enhancing efficacy and safety [2,4,5,6].
Usually, heparin is extracted from an organic mixture that accumulates in the intestinal mucosa of pigs or cattle [7]. The production process begins with the enzymatic digestion of these animal tissues using the alkali protease enzyme, subtilisin, resulting in a complex mixture that includes heparin, proteins, nucleic acids, and various other biochemicals. Recovering heparin involves a series of intricate adsorption–desorption cycles, making the procedure both labor-intensive and complex [2,8,9,10,11,12,13]. Enzymatic digestion of natural tissue yields heparin in very low concentrations (0.01% by weight) [14]. To overcome these limitations, scientists and researchers have focused on creating advanced adsorbents specifically designed to selectively isolate heparin from biological fluids, simplifying the recovery process and increasing yield. This targeted approach seeks to simplify the extraction process and maximize heparin yield. Cost-effective adsorbents have been developed using state-of-the-art materials and innovative techniques to achieve these objectives. These advancements have significantly improved the adsorbents’ adsorption capacity and selectivity, thereby enhancing their overall performance in the separation and purification of heparin. Currently, mass-produced adsorbent resin beads, such as DEAE, Amberlite, Dowex, and Lewatit, are used to extract heparin from animal tissues [9,10,15,16]. Although these commercial adsorbents are useful, they have considerable drawbacks, especially in their ability to selectively capture large quantities of heparin, and they often come with high costs. To address these issues, various alternative adsorbents have been developed. Researchers have investigated options such as polymer cross-linked network structures [17], metal–organic frameworks (MOFs) [18], and modified [11]. These adsorbents typically rely on anion exchange resins that use quaternary ammonium salts as their main functional groups. The quaternary ammonium groups enhance heparin adsorption through ionic interactions [11,12,13]. An effective adsorbent design requires more than just functional groups; critical factors include controlling porosity, hydrophilicity/hydrophobicity, and the degree of cross-linking specific to the application [11]. Porosity is especially important because it determines the resin’s surface area, and thus, its adsorption capacity. Additionally, heparin adsorbents must be non-toxic and inert to avoid contaminating the recovered heparin, which is an active pharmaceutical ingredient [13,19].
Given the very low concentration of heparin in biological samples (~0.01% by weight) and the presence of competing substances such as nucleic acids, proteins, and other glycosaminoglycans (GAGs) like dermatan sulfate (DS) and chondroitin sulfate (CS), careful engineering of adsorbent materials is crucial. This involves optimizing the adsorbent’s porosity, surface chemistry, surface area, and chemical and thermodynamic stability to enhance the selectivity and efficiency of heparin extraction amidst these competing substances [20]. An effective heparin adsorbent must have substantial surface area to accommodate the sizable heparin molecules. Specifically, the pores should be engineered to facilitate the diffusion and binding of heparin while maintaining high accessibility. Additionally, improving the surface area not only enhances the number of active sites that are susceptible to the adsorption of heparin, but also raises the adsorbent’s total capacity and potency. Optimizing these factors is effective for achieving the selective separation of heparin from complex biological mixture [20,21,22,23].
Zeolites are made up of silicon or aluminum atoms present in their core and interlinked chains of oxygen atoms occupy the corners [24,25]. These materials, which can be natural or synthetic, have a few special qualities that make them useful in the environmental and medicinal domains, including water absorbency, ionic exchangeability, and molecular sieve structure [26]. Zeolites are biocompatible and non-toxic, with applications ranging from food additives like Clinoptilolite, which provides essential minerals and protects against toxins, to medical research where zeolites’ properties support the growth and proliferation of human bone marrow stromal cells. Their structure allows for the adsorption of toxic materials and the separation of molecules based on size [24,25,27,28,29,30,31,32,33,34,35]. The growing scientific interest in zeolite tailored biological behaviors underscores their potential across various domains [36,37].
In this investigation, we focused on heparin adsorption utilizing zeolites with higher pore diameters, choosing beta zeolite CP814E for in-depth analysis. To evaluate the impact of pore size on selective adsorption, we compared its heparin adsorption capacity with that of a medium pore size zeolite, specifically using synthetic ferrierite CP914C. We improved heparin adsorption by methodically changing multiple factors, such as pH levels, adsorbent dosage, process temperature, and interaction time. Our objective was to improve zeolite-based adsorbents’ overall performance in isolating heparin from complex biological mixtures by adjusting these variables to increase efficiency and selectivity in heparin adsorption. Our findings further demonstrated that heparin recovery using CP814E reached a stable performance after five regeneration cycles. Additionally, we conducted anticoagulant activity assays using sheep plasma to compare the efficacy of CP814E with the commercial resin Amberlite FPA98 Cl. The results confirmed the strong potential of beta zeolite as an effective material for heparin adsorption in biomedical applications.

2. Materials and Methods

We sourced zeolites from Zeolyst International, Conshohocken, PA, USA, and obtained calcium chloride, heparin sodium salt (analytical grade), hydrochloric acid (37%), methanol, sheep plasma, sodium hydroxide, and ethanol, from VWR, Radnor, PA, USA. Every chemical was utilized as is. Milli-Q water was used in sample preparation for adsorption experiments. Locally sourced intestinal mucosa contained approximately 1300 mg/L of heparin. Subtilisin enzyme was procured from STERM Company, San Francisco, CA, USA. The Heparin ELISA kits and commercial Amberlite FPA98 Cl resin were sourced from My Biosource, San Diego, CA, USA and Dow Chemical, Midland, MI, USA, respectively.
To determine the concentration of heparin in both pure and complex samples, we employed SPECTRO star nano microplate reader (BMG LABTECH, Cary, NC, USA). The adsorption of heparin sodium salt on the microporous zeolites were characterized using a Shimadzu IRAffinity-1 FT-IR instrument. X-ray diffraction (XRD) measurements were performed using a Bruker D8 Advance Eco powder diffractometer. The analysis was performed at 40 kV with a Cu radiation source, a slit width of 0.6 mm, and an increment of 0.01.

Experimental

A 1000 ppm heparin stock solution was created in Milli-Q water, and the plasma of sheep and ELISA heparin kits were used to assess the efficacy and capacity of heparin adsorption by utilizing Equations (1) and (2) in the intestinal mucosa of pigs. This process is documented in a prior article [11,12].
Heparin stock solution (1000 ppm) was prepared in Milli-Q water. Sheep plasma and heparin ELISA kits were employed to evaluate the efficiency and adsorption capacity of heparin using Equations (1) and (2) in pig intestinal mucosa, as outlined in a previous study [11,12].
A d s o r p t i o n   e f f i c i e n c y   ( % ) = ( C 0 C e ) C 0 × 100
A d s o r p t i o n   c a p a c i t y   ( q e ) = ( C 0 C e ) m × V
Here, C0 and Ce (mg L−1) represent the initial and equilibrium concentrations of heparin (determined using the ELISA kit), mass of the employed adsorbent is m (g) and the volume of mucosa solution utilized for heparin adsorption is V (L).
The intrinsic viscosity ([η]) of heparin was determined through measurements conducted in a dilute deionized water (DI) solution at 40 °C. These measurements were performed using a Minivisc 3000 series instrument (Spectro Scientific, Chelmsford, MA, USA) and followed a standardized method for determining relative viscosity η rel = η sample η DI   water . The Kraemer equation ( Ln η rel C   =   η K η 2 C ) was applied to the data [38]. A plot of ( Ln η rel C ) versus the concentration (C) allowed for the calculation of the intrinsic viscosity. Using the intrinsic viscosity, the molecular weight (Mw) of heparin was estimated through the Mark–Houwink–Sakurada equation ( η   =   K . M w α ) [39], where ( K ) and ( α ) are constants specific to heparin in water at 40 °C, reported as 3.16 × 10⁻⁵ and 0.88, respectively.
For evaluating zeolites adsorption abilities, the following experimental procedure was conducted: Initially, 250 mg CP814E and CP914C were added to 25 mL solutions of heparin sodium (concentration: 1000 ppm). These mixtures were incubated and agitated for 3 h at a constant temperature (55 °C). After the incubation period, 5 mL aliquots from individual solution were removed and filtered using a syringe filter to separate the supernatant. The supernatant’s heparin concentration was measured using the spectrophotometric method assisted by methylene blue (MB). MB is a cationic metachromatic dye, chosen for its strong affinity for heparin [40,41]. For this method, 1 mL of MB solution (10 mg L−1) and heparin-containing supernatant were mixed. To ensure a complete reaction between heparin and MB, this mixture was rapidly stirred with a vortex mixer for 10 min. A spectrophotometric plate reader [42] was then used to measure the mixture absorbance at a wavelength of 663 nm, which is equivalent to unbound MB. Heparin and MB combine to form complexes, which reduces the concentration of free MB and the absorbance intensity at 663 nm. After adsorption, the amount of heparin that remained in the solution was measured using a standard calibration curve that had been previously created.
The anticoagulant effectiveness of the final heparin samples extracted from CP814E and Amberlite FPA98 Cl adsorbents was evaluated by comparing their ability to delay the clotting of citrated sheep plasma with that of a reference standard of heparin sodium (heparin sodium RS), which is calibrated according to the United States Pharmacopeia (USP). A known concentration of heparin sodium RS (225 units/mg) was dissolved in a 0.9% NaCl solution to establish a precise number of USP units per milliliter. Eluted heparin samples underwent a similar preparation. Varying volumes of each solution were then mixed with 1.0 mL of chilled citrated sheep plasma and 0.8 mL of 0.25% CaCl2 solution and allowed to equilibrate at 37 °C for 60 min. After this incubation period, the clotting of the citrated sheep plasma was assessed by visual observation. The semiclotting point of each sample (either heparin sodium RS or the extracted samples) was determined by the volume added to achieve plasma clotting. The anticoagulant potency of the extracted heparin samples was calculated using the following formula (Equation (3)):
Potency   of   sample   ( Units mL )   =   potency   of   RS   ( Units mL ) ×   semi - clotting   point   of   RS   ( μ L ) semi - clotting   point   of   sample   ( μ L ) .

3. Results and Discussion

3.1. Adsorption Studies of Heparin

In this study, heparin is adsorbed onto an adsorbent under ideal biological conditions to start our process. To obtain pure heparin, the resultant molecule must desorb after this process. Initial adhesion screens employed pure heparin solutions to set baseline performance parameters, which aided in determining the most effective zeolite adsorbent based on its adsorption ability in pure heparin solutions. The chosen zeolite was then used to adsorb heparin from real biological samples. The dosage, pH parameters, temperature, and contact time were systematically moderated to develop an optimized technique of adsorption for heparin recovery from porcine mucosa, which contains a diverse array of biomolecules and enzymes. All experiments were performed in triplicate to ensure statistical robustness. Further investigations focused on evaluating the reusability of the adsorbent to assess its commercial viability. In addition, kinetic and thermodynamic analyses were performed for elucidation of underlying adsorption mechanisms, providing valuable insights into the factors influencing adsorption efficiency and selectivity. Zeolites CP814E and CP914C were added separately in the amount of 0.5 g each into the aqueous solutions containing heparin with as concentration of 1000 mg L−1 and stirred in an incubator for 5 h at 55 °C. Following this, methylene blue method was applied to measure the rate of heparin adsorption [11,12]. In pure heparin solutions, CP814E showed an adsorption efficiency of 71%, outperforming CP914C, which had an efficiency of 42%. Typically, ferrierite zeolites have medium pores (5.3 × 5.6 Å), while beta zeolites are macroporous (5.7 × 7.5 Å). Notably, CP814E has a much larger surface area ~1.7 times greater than CP914C (680 m2/g vs. 400 m2/g). These differences in pore size and surface area are key to CP814E’s superior heparin adsorption capacity. With more active sites, CP814E captures heparin molecules more effectively [43,44]. Consequently, the larger surface area of CP814E enables a more effective capture of heparin molecules from the solution compared to CP914C, which is corroborated by the observed higher degree of heparin adsorption efficacy by CP814E. Therefore, CP814E was analyzed further for adhesion of heparin in the live blend of mucosa obtained off pig’s intestine, which is described in Section 3.1.1, Section 3.1.2, Section 3.1.3, Section 3.1.4, Section 3.1.5 and Section 3.1.6.
Heparin adsorption from an aqueous solution of pure heparin onto the surface of CP814E was investigated further using Fourier Transform Infrared (FTIR) spectroscopy (Figure 1). Comparative FTIR spectra were obtained for both the commercial sodium salt of heparin and the CP814E-heparin adduct. The presence of C=O asymmetric and symmetric stretching vibrations at 1611 cm−1 and 1417 cm−1 respectively in the FTIR spectrum of the C814E-heparin adduct distinctly confirms the successful adsorption of heparin onto the CP814E surface [45,46,47,48].
For heparin adsorption elemental composition of zeolite CP814E and CP914C has been investigated using X-Ray Diffraction (XRD) [49] (Figure 2). Comparative XRD spectra were obtained for both CP814E, and CP914C. The relative crystallinity of both samples were calculated [50] by assuming a 100% crystallinity with the summed areas of the two most intense diffraction peaks at 2θ = 9.3 and 25.2°. The elemental compositions of the Si/Al molar ratios in CP814E are more than those of CP914C. Thus, it is evident from the C814E-heparin FTIR spectrum that heparin was successfully adsorbed onto the CP814E surface [51].

3.1.1. Adsorption Dosage Optimization

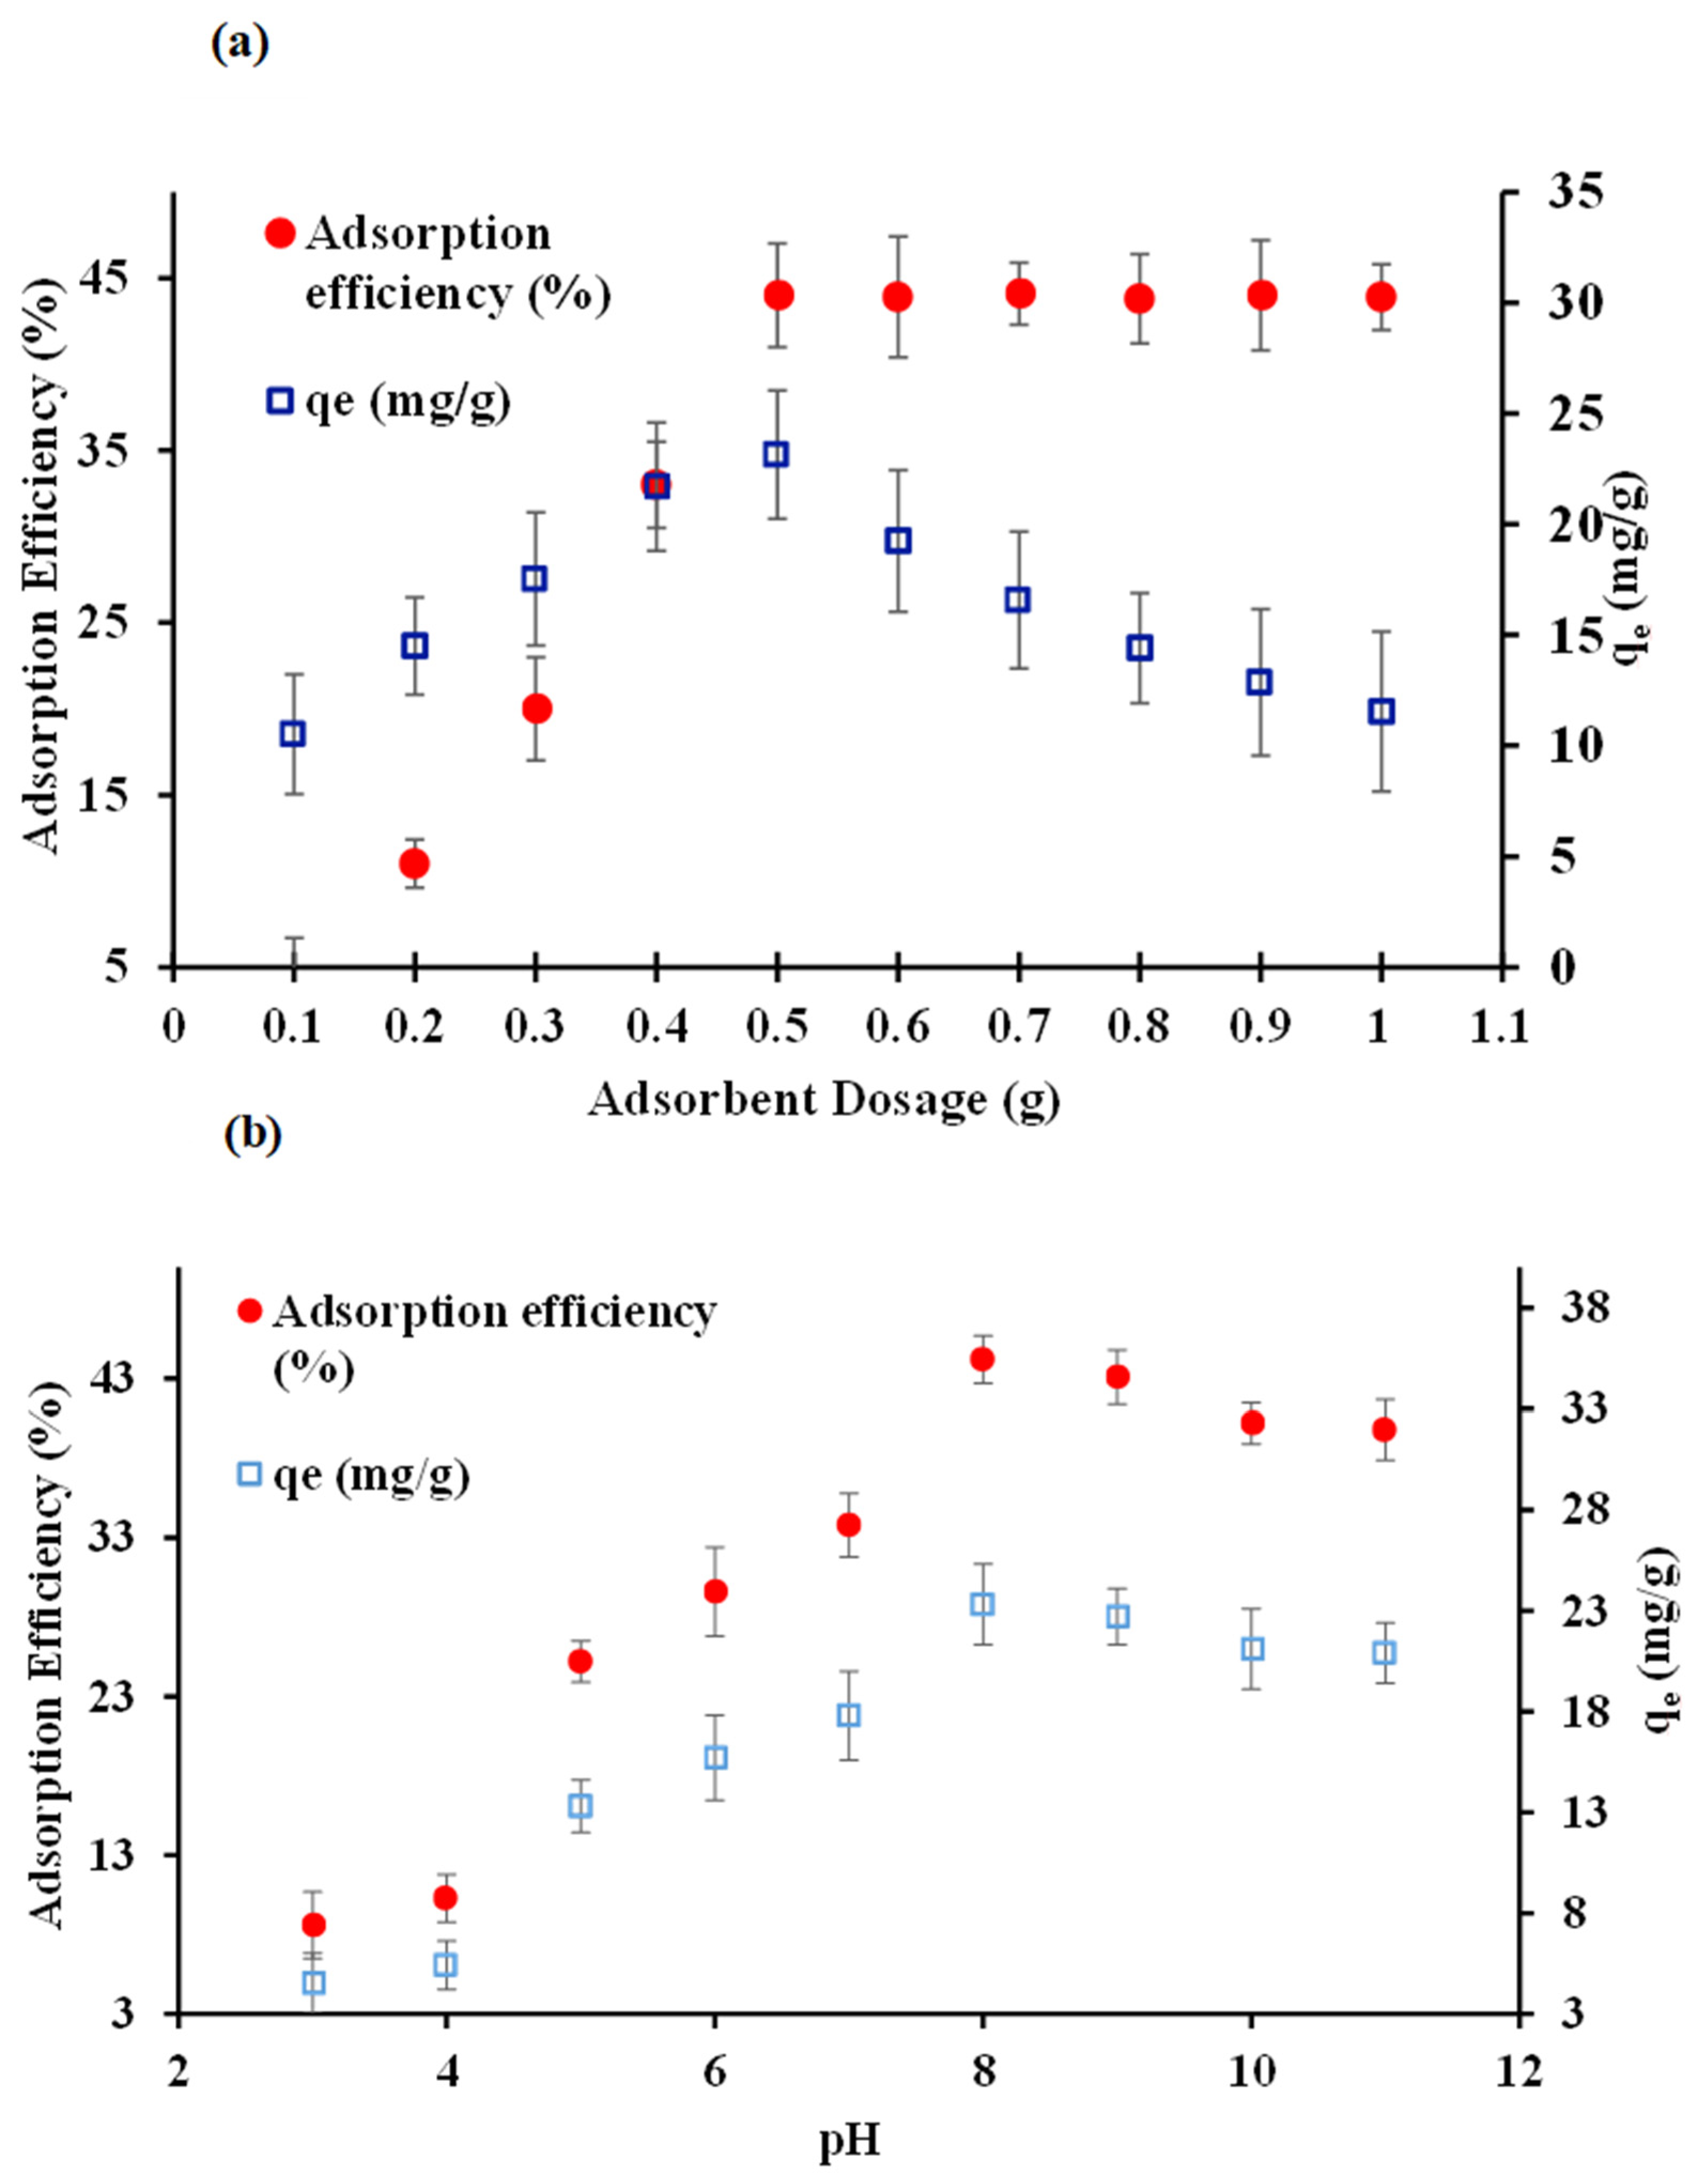
An investigation of adsorbent dosage’s impact on the consumption of heparin in real mucosa samples from pigs’ intestine was conducted by varying the concentration of CP814E between 100 and 1000 mg. The adsorption capacity reached a maximum of 20.6 mg g−1 with an increase in CP814E dosage to 500 mg (Figure 3a). At this dosage, the adsorption efficiency peaked at 39%. However, as the adsorbent dosage was further increased beyond 500 mg, the rate of adsorption remained closely constant, while the adsorption capacity began to decline. The initial adsorption capacity surge can be attributed to the increased surface area with active sites on the beta zeolite surface. Molecules such as chondroitin and dermatan sulfate in live samples of mucosa may interfere with heparin by competing for adsorption sites. This competitive binding can reduce the efficiency of adsorption at larger dosages. Additionally, an adsorption capacity decreases from 20.6 to 10.4 mg·g−1 at higher dosage (1 g) could be due to the increased mass (m) as per Equation (2).

3.1.2. pH Optimization

The medium’s pH significantly impacts the adsorption properties of beta zeolite [52]. In this study, mucosa obtained from the intestine of pigs represented the live biological sample that was utilized for conducting experiments aimed at optimizing the adsorption rate of heparin by CP814E. This optimization was achieved by modulating the pH of the sample solution within the range of 3 to 11. The amount of heparin adsorbed by CP814E was quantified using an ELISA kit assay and/or a sheep plasma test.
Results demonstrated that heparin adsorption increased with pH values ranging from 3 to 8 (Figure 3b). At an optimal pH of 8, the adsorption efficiency reached its peak at 39.1%, with an adsorption capacity of 20.6 mg·g−1. Beyond this pH, a slight decrease in adsorption was observed. This decline can be attributed to the deprotonation of heparin at higher pH levels, which enhances its negative charge and leads to repulsive interactions with the heparin molecules already adsorbed within the pores of the beta zeolite. Consequently, pH 8 was identified as the optimal condition for heparin uptake by CP814E.

3.1.3. Effect of Temperature and Duration on Heparin Uptake in Real Sample

The adhesion showcased by beta zeolite CP814E on heparin demonstrates a pronounced temporal increase as the heparin molecules diffuse from the solution, gradually occupying the pores of the zeolite structure. Over a contact duration of 240 min, this process culminates in a marked enhancement in the adsorption efficiency, reaching 39.2%, and adsorption capacity, attaining a value of 20.6 mg g−1. This upward trend is substantiated by the data illustrated in Figure 4a. Subsequently, the adsorption efficiency plateaus, indicating that the CP814E has achieved saturation under the specific experimental conditions.
The influence of temperature on the adsorption affinity was also investigated [53], given its critical role in modulating this relationship. A series of experimental repetitions in temperatures ranging between 25 °C and 75 °C were conducted. The findings, depicted in Figure 4b, indicate that the temperature increase to 55 °C resulted in peak adsorption efficiency and capacity, achieving values of 39% and 20.5 mg g−1, respectively. This enhancement can be attributed to the reduction in solution viscosity at elevated temperatures, which facilitates more rapid diffusion of heparin molecules within the solution, thereby promoting efficient zeolite interactions. The cause of decline beyond 55 °C is possibly the molecular decomposition of heparin in higher temperatures.

3.1.4. Adsorption Kinetics

The kinetics of the adsorption process provides essential insights into the rate and mechanism by which adsorbates are removed from the solution phase and adhere to the adsorbent surface [54]. Adsorption typically follows two distinct mechanisms: an initial rapid adsorption onto the external surface, followed by a slower stage involving intraparticle diffusion into the adsorbent’s internal pores. To analyze the adsorption kinetics, several kinetic models are employed, including the pseudo-first-order, pseudo-second-order, elovich, and intraparticle diffusion models. Each of these models offers valuable information regarding the adsorption mechanism and the rate-limiting steps in the process [55,56,57,58,59,60].
Pseudo-first-order Model
The pseudo-first-order kinetic model, described by Lagergren, is typically used to explain the initial phase of the adsorption process where rapid surface adsorption dominates. The linear form of the pseudo-first-order equation is given by (Equation (4)):
log q e q t = log q e k 1 2.303 t
where qe and qt (mg/g) are the amounts of adsorbate adsorbed at equilibrium and time t, respectively, and k1 is the rate constant. A plot of log (qe − qt) versus time t provides the values of k1 and qe. However, in many cases, this model is only applicable to the initial stages of adsorption, and discrepancies between calculated and experimental values of qe often indicate that the adsorption process does not strictly follow first-order kinetics.
Pseudo-second-order Model
The pseudo-second-order kinetic model is widely regarded as more accurate for representing adsorption over the entire duration of the process. The linear form of this model is expressed as (Equation (5)):
t q t = 1 k 2 q e 2 + t q e ,
where k2 (g/mg·min) is the rate constant of pseudo-second-order adsorption. By plotting graph between t/qt and t, values for qe and k2 can be obtained from the slope and intercept.
Elovich Model
Adsorption kinetics on heterogeneous surfaces can be studied by Elovich model [60], in which adsorption rate decreases as saturation increases due to the fluctuation in activation energy. The Elovich equation (Equation (6)) in linear form can be written as
q t = 1 β ln α β + 1 β ln t ,
where qt (mg/g) is the amount of adsorbate adsorbed at time t, α (mg/g·min) shows the initial adsorption rate, and β (g/mg) is associated with the extent of surface coverage and activation energy of the adsorption process. The plot of qt versus ln(t) yields a straight line, from which α and β can be calculated from the intercept and slope, respectively. The Elovich model is very helpful in those phenomena’s that incorporate chemisorption and gives important information about adsorption energy and surface heterogeneity.
Intraparticle Diffusion Model
Utilizing the intraparticle diffusion model, it is possible to determine if intraparticle diffusion is the rate-limiting step. The model is shown by Equation (7):
q t = k d i f f t 1 2 + C ,
where kdiff is the intraparticle diffusion rate constant and C describes the boundary layer thickness. If the plot of qt versus t1/2 yields a straight line passing through the origin, it suggests that intraparticle diffusion is the sole rate-controlling mechanism. However, in most cases, this plot does not pass through the origin, indicating that both surface adsorption and intraparticle diffusion contribute to the overall rate of adsorption.
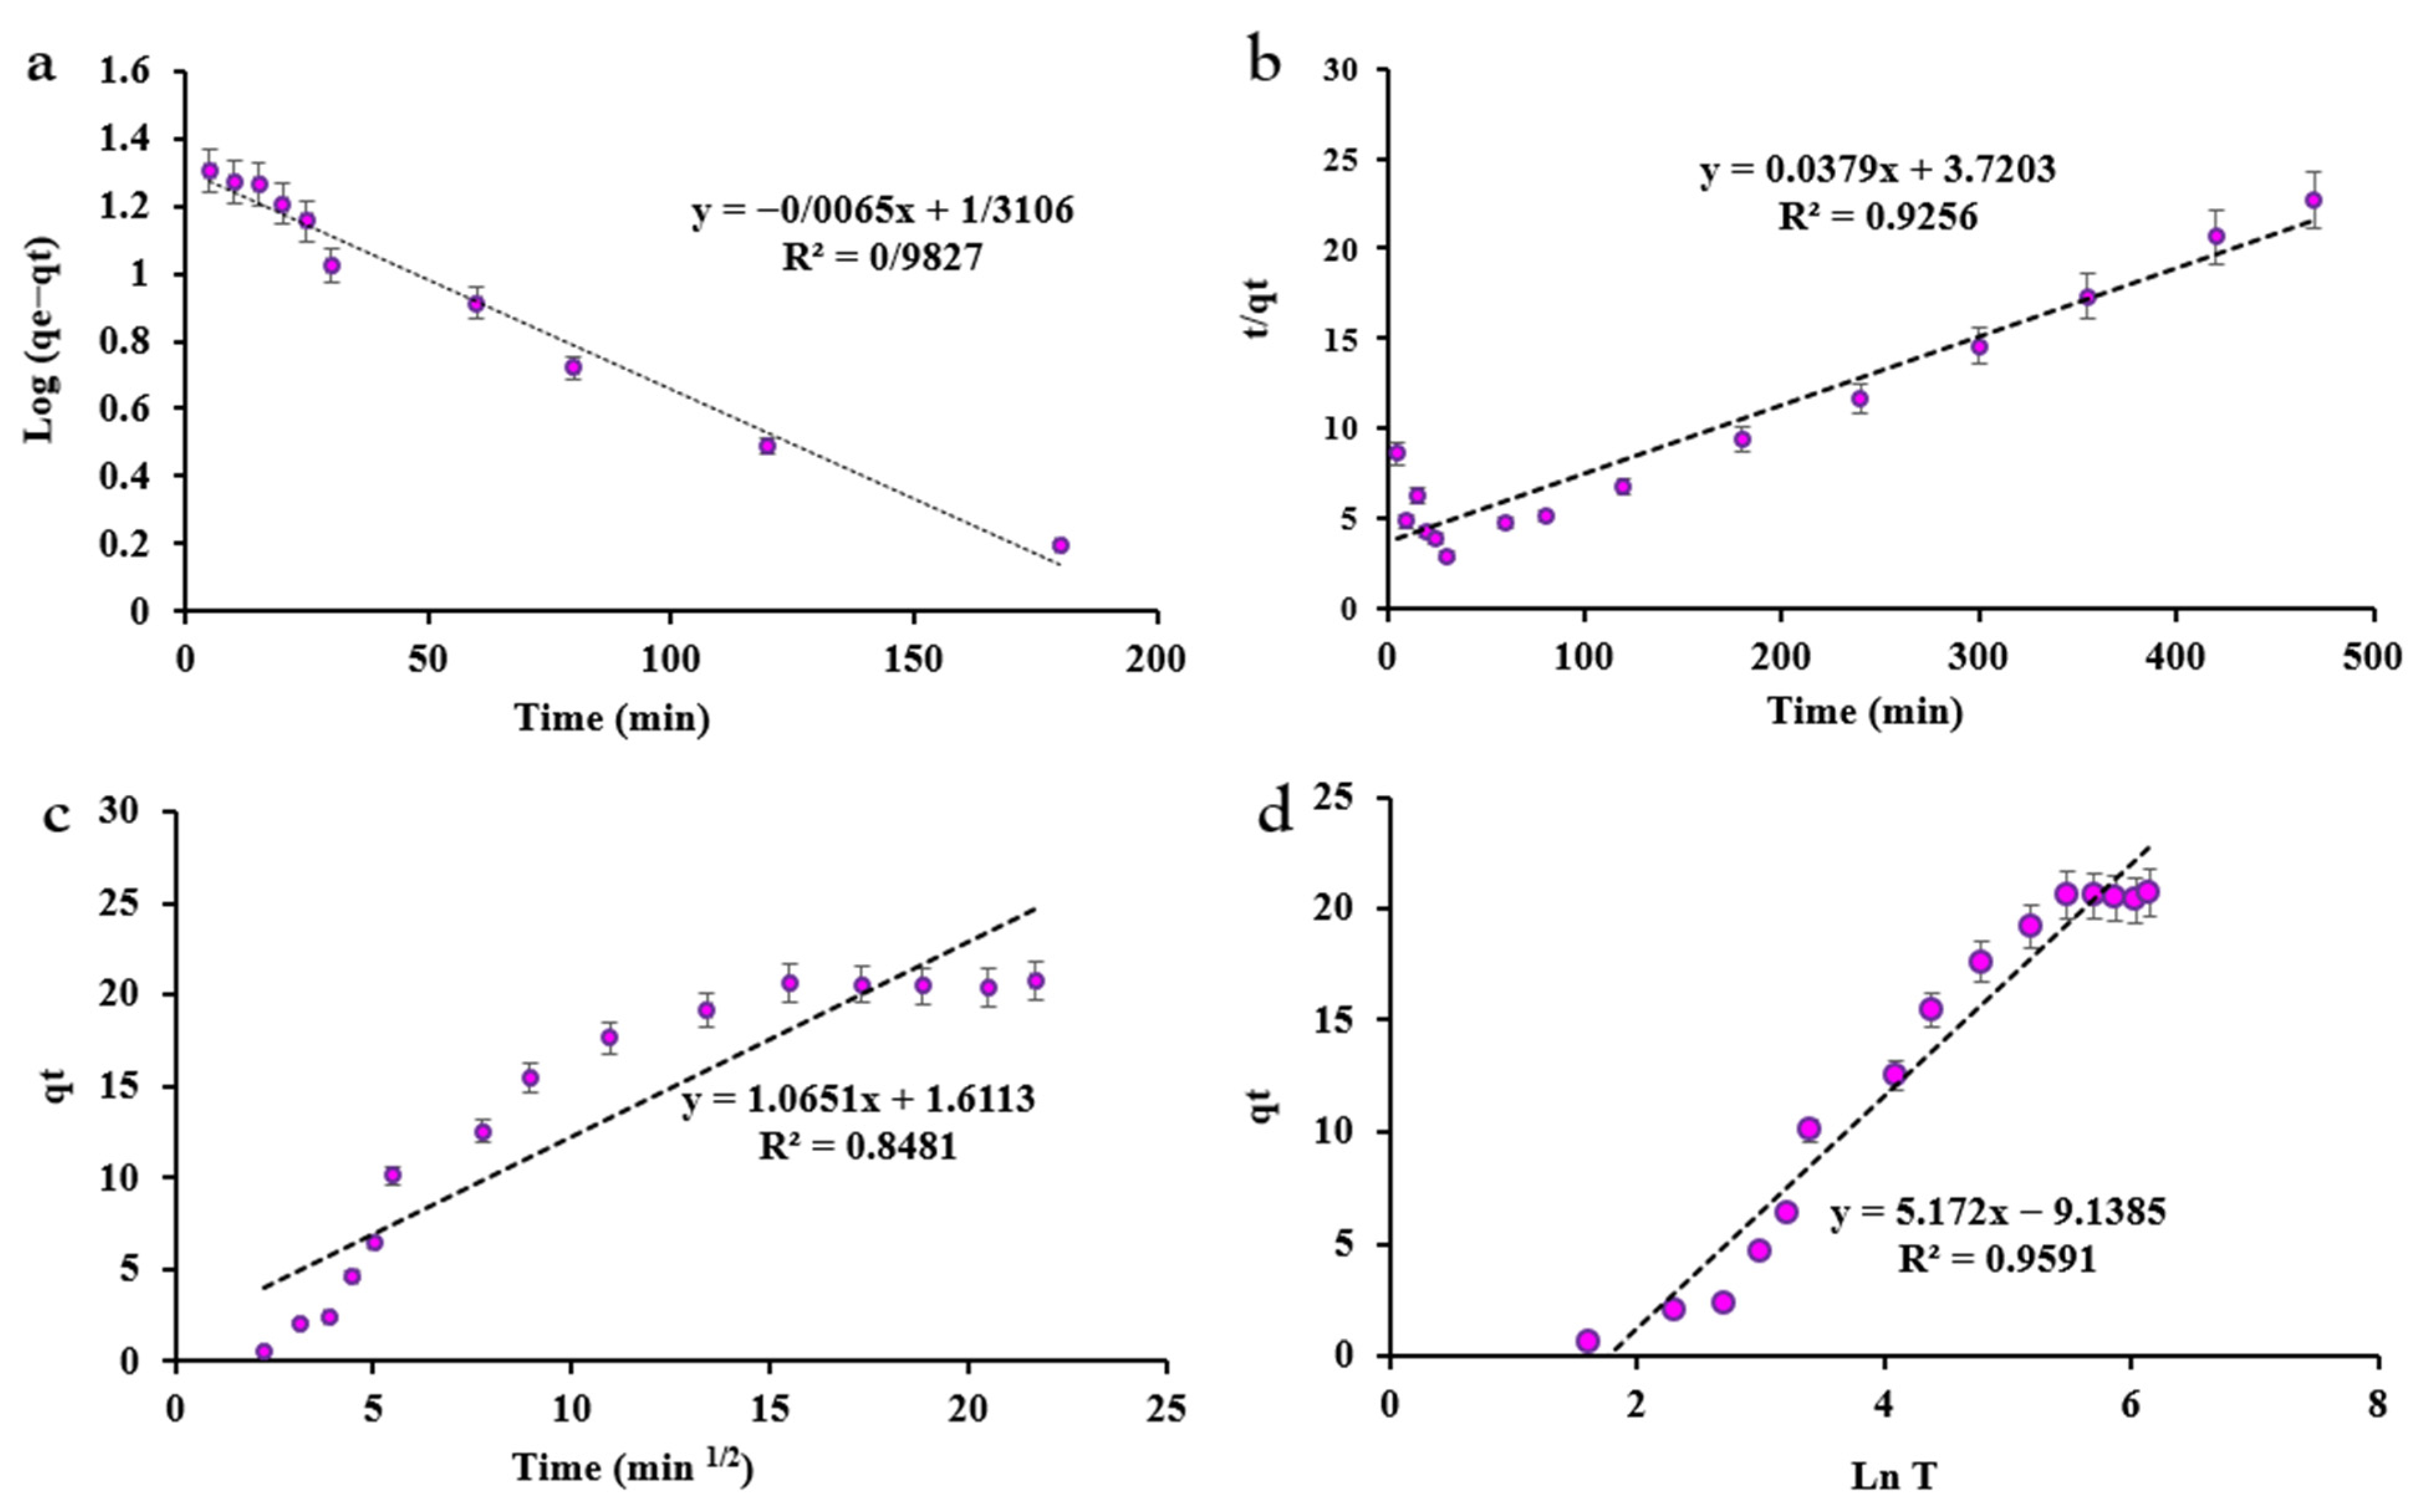
Based on the experimental results, the data related to the kinetic models were analyzed, and the results of the data fitting with the models were presented in Table 1 and Figure 5.
Based on the results obtained, the pseudo-first-order kinetic model with R2 equal to 0.9827 as shown in (Table 1) provides the best fit for the experimental data. According to the assumptions of this model, it can be concluded that the adsorption process is physical and the available active sites in CP814E are the most influential parameters on the speed and amount of absorption. Moreover, the relatively close agreement between the experimental and calculated qe values confirms the application of the pseudo-first-order model and identifies that the physical adsorption predominates over chemical adsorption for this system.

3.1.5. Thermodynamics of Heparin Adsorption

The thermodynamic parameters of the adsorption process, including entropy (ΔS°), enthalpy (ΔH°), and Gibbs free energy (ΔG°), were studied to examine the spontaneity, feasibility, and nature of heparin adsorption onto the adsorbent. These parameters were determined using the van’t Hoff equation and the adsorption equilibrium constants obtained at different temperatures. The Gibbs free energy change (ΔG°) was calculated using the following equation (Equation (8)):
Δ G ° = R T l n K c ,
where Kc is the equilibrium constant, R is the universal gas constant, and T is the temperature in Kelvin (K).
To further calculate the nature of the adsorption, the enthalpy (ΔH°) and entropy (ΔS°) changes were calculated from the slope and intercept of the linear plot of lnKc versus 1/T as shown in (Figure 6a), according to the van’t Hoff equation (Equation (9)):
l n K c = Δ H ° R × 1 T + Δ S ° R ,
As is evident from the obtained van’t Hoff plot (lnKc vs. 1/T), the adsorption process exhibits distinctly different behaviors across various temperature ranges. The positive ΔH° values observed below 318 K indicate an endothermic adsorption process, characteristic of monolayer chemisorption on the CP814 E surface. Temperature increase is favorable for endothermic processes and leads to enhanced adsorption capacity. Upon a further temperature increase to 348 K, the reaction ΔH° becomes negative, signaling a change in adsorption mechanism. The transition from positive to negative ΔH° value suggests the reaction becomes exothermic at higher temperatures. This phenomenon may arise from several factors including the following:
-
Shift from monolayer to multilayer adsorption;
-
Changes in adsorbent porosity at elevated temperatures;
-
Altered solubility of the adsorbate at higher temperatures.
Analysis of Gibbs free energy (ΔG°) values across all temperatures confirms the spontaneous and thermodynamically favorable adsorption process throughout the studied range. Furthermore, the initially positive ΔS° values reflect increased solid–liquid interfacial collisions during the early adsorption stages. However, as temperature increases and the system approaches saturation, ΔS° becomes negative due to the following:
-
Decreasing heparin concentration in the medium;
-
Reduced molecular collisions;
-
Established adsorption equilibrium.
Additionally, the activation energy (Ea) and sticking probability (S) were estimated using the following equations (Equations (10) and (11)):
l n ( 1 θ ) = l n S * + E a R T ,
θ = 1 C e C 0 .
The thermodynamic variables were determined at various temperatures (Figure 6b), and the resulting data are compiled in Table 2.

3.1.6. Sorbet Reusability

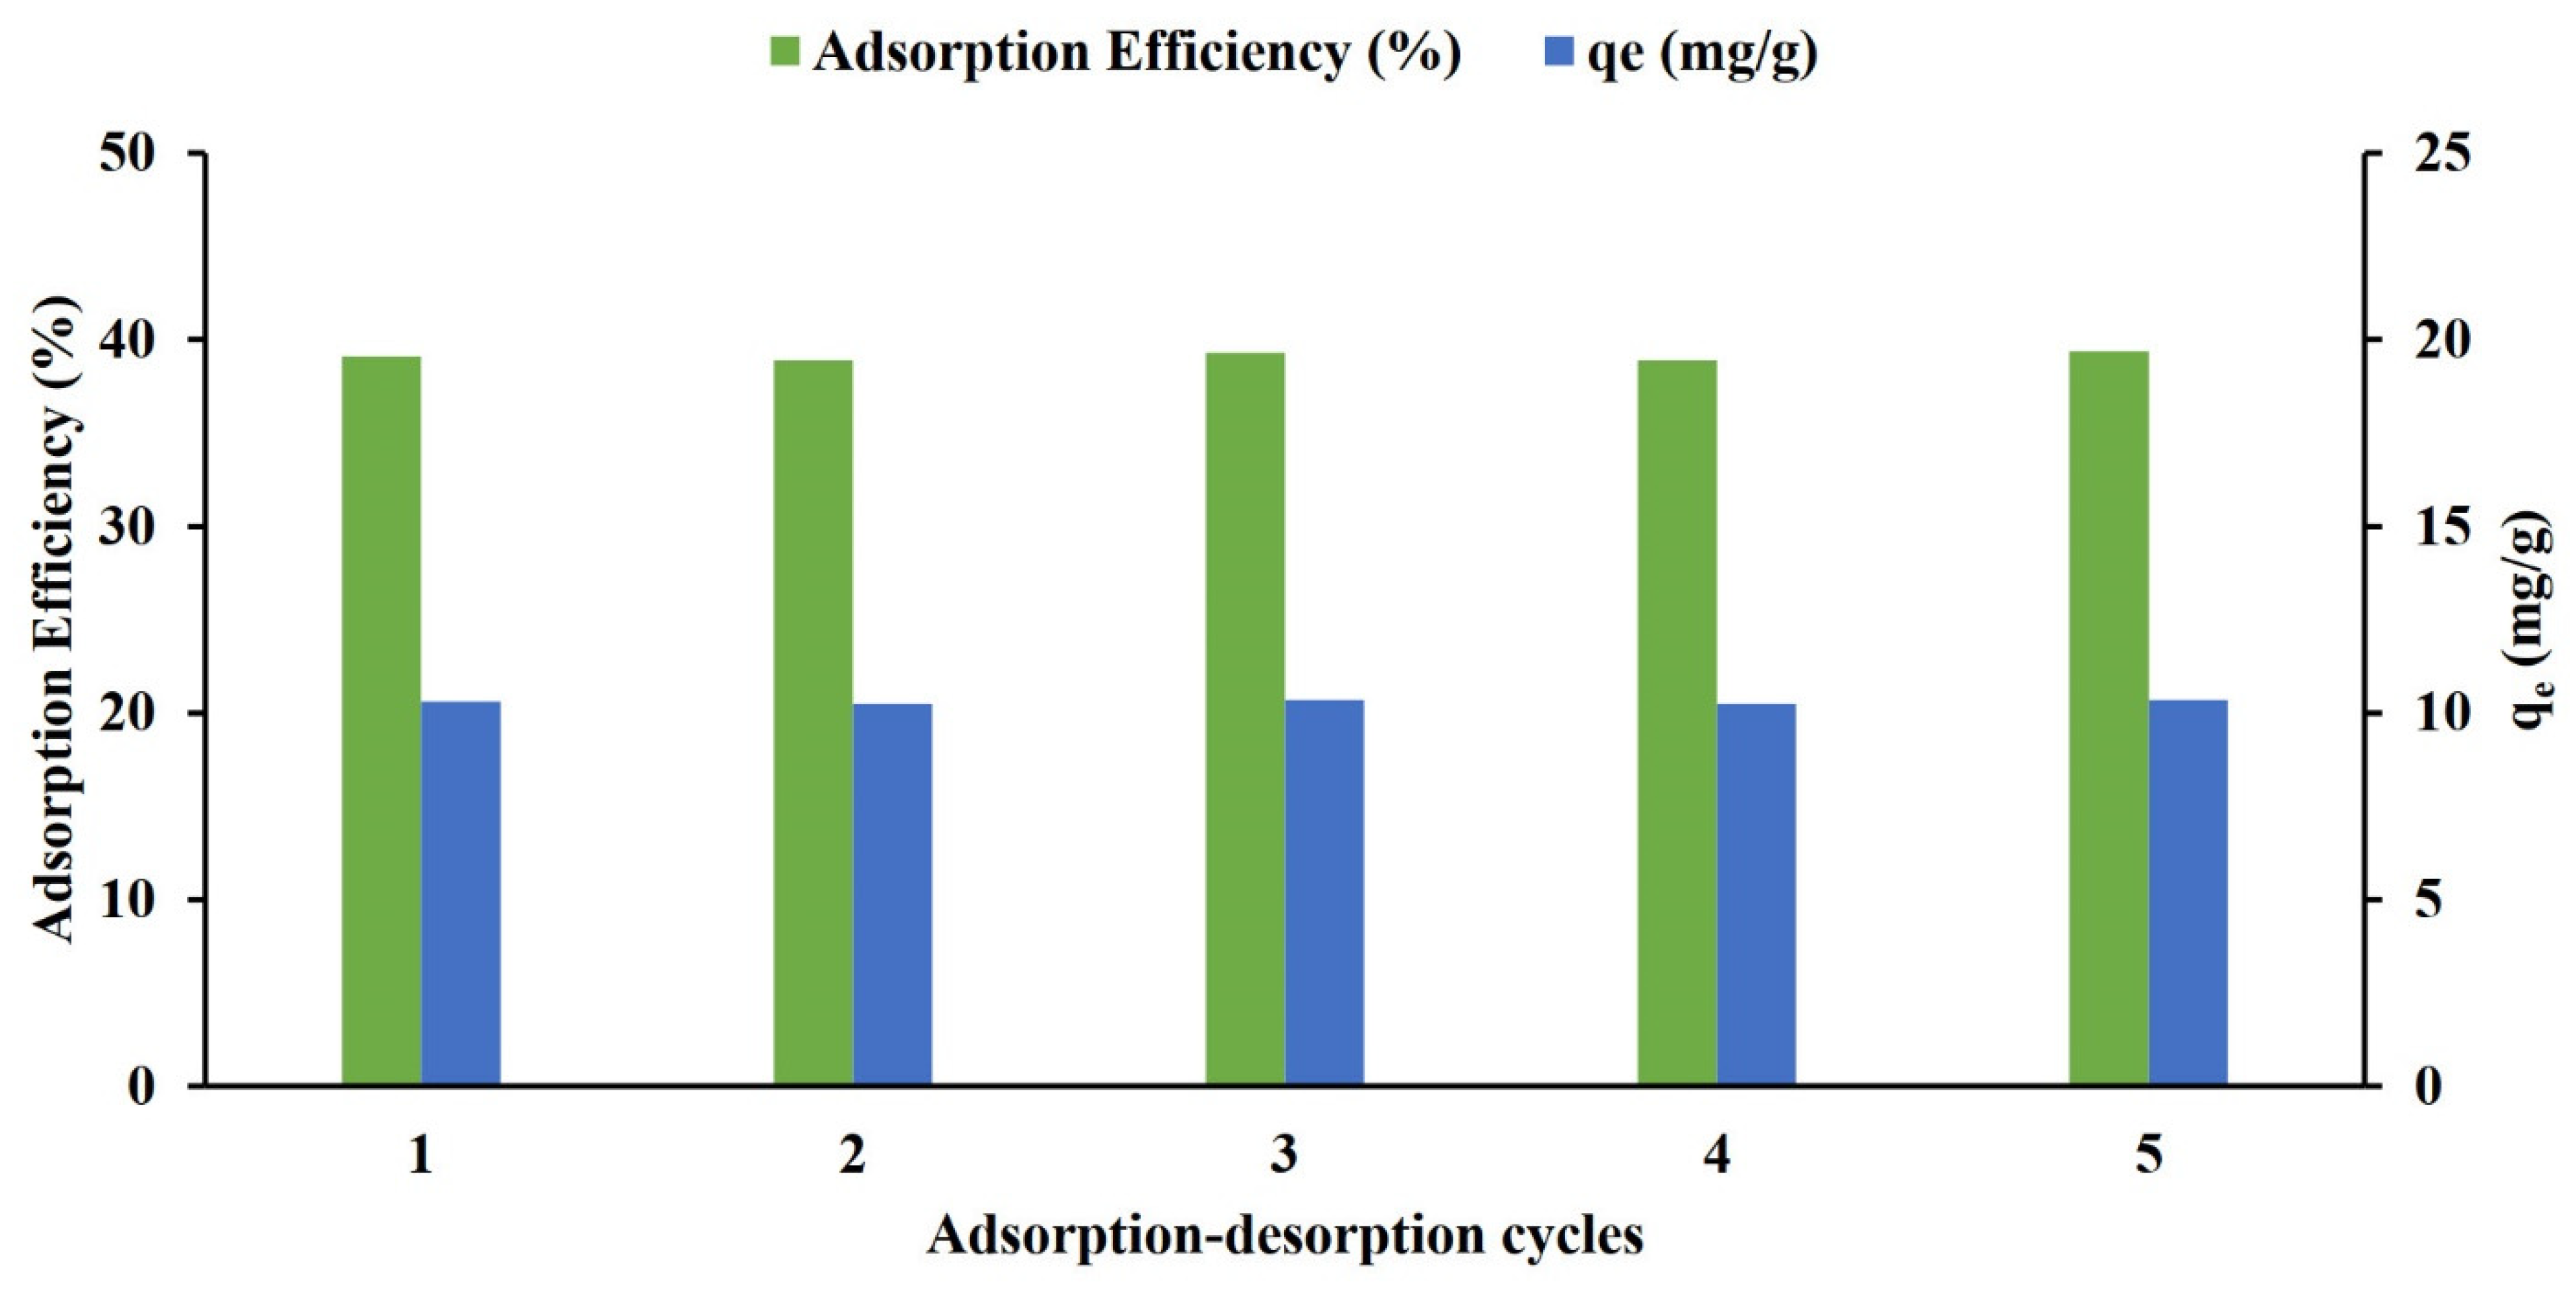
The performance of CP814E in biological samples was remarkable, achieving an adsorption efficiency of ~39.4% and a capacity of 20.7 mg g−1 under optimized pH, dosage, contact time, and temperature. To assess the industrial feasibility of CP814E, we subjected the adsorbent to five cycles of adsorption–desorption. Each cycle included a stringent regeneration procedure: a thorough Milli-Q water rinsing post and a three-hour saturated sodium chloride solution wash at 55 °C. The outcomes, as illustrated in Figure 7, show that CP814E is a highly efficient adsorbent with notable stability. Even after five rigorous adsorption–desorption cycles, beta zeolite retained its performance, indicating its potential for repeated use in practical applications.

3.1.7. Molecular Weight of the Extracted Heparin

Solutions with concentrations ranging from 0.05 to 0.3 g/mL were prepared using heparin extracted by CP814E in deionized water. The Kraemer equation was employed to calculate the intrinsic viscosity ([η]) of heparin, which was approximately 0.1594 dL/g. Heparin’s molecular weight derived from the Mark–Houwink–Sakurada equation was 16,134.998 g/mol. This estimate aligns closely with the molecular weight of commercial heparin, which is approximately 15,500 g/mol.

3.2. Sheep Plasma Clotting Assay

To assess the purity of heparin obtained with CP814E, we conducted a sheep plasma clotting assay. This test, carried out under carefully optimized conditions, allowed us to determine the anticoagulant potency of heparin. For comparison, we used amberlite FPA98 Cl resin as a baseline, following a previously established protocol [11,20,50,51]. The results revealed that the anticoagulant effectiveness of heparin purified using CP814E was quite comparable to that of the commercial amberlite FPA98 Cl resin, with values of 53 ± 2.6 and 57 ± 3.1 units per gram of mucosa, respectively. This study highlights the effectiveness of CP814E in yielding high-purity heparin with potency like those of established commercial standards.

4. Conclusions

In this study, the application of macroporous zeolites for heparin recovery was investigated. Our findings demonstrate how important pore size and surface area are for maximizing heparin adsorption. In contrast to the medium pore-sized CP914C, which has a surface area of 400 m2/g, the macroporous zeolite CP814E, which has a surface area of 680 m2/g, produced noticeably greater heparin recovery. This shows nearly a 1.7-fold increase in efficiency. Important parameters like temperature, pH, and adsorbent dosage have been modified to further improve heparin adhesion. As an aluminosilicate, CP814E features a particularly high silicon-to-aluminum ratio (SiO2:Al2O3 of 25:1), which enhances its adsorption capabilities. To assess its performance, we compared CP814E with previously reported silica-based adsorbents. For example, silica-based quaternized diatomaceous earth (QDADE) showed an adsorption efficiency of 31%, while quaternized silica-gel (QMASi) achieved 28%. Among the materials examined, zeolite CP814E demonstrated a significant heparin adsorption efficiency of 39%, outperforming several cationic silica-based adsorbents explored in earlier studies. This suggests that CP814E’s unique porous aluminosilicate structure contributes to its superior adsorption properties. Thermodynamic investigations have demonstrated that the adsorption process is both endothermic and spontaneous, suggesting that the energy absorbed during the process facilitates heparin binding. This aligns with the observation that higher temperatures enhance the adsorption capacity of the system. Kinetic analysis indicates that the process adheres to a pseudo-first-order kinetic model, implying that the rate of adsorption is proportional to the concentration of available adsorption sites. These insights highlight CP814E as a highly effective adsorbent for the recovery of heparin, underscoring its potential as a promising candidate for advancing more efficient and scalable extraction methods in the pharmaceutical industry. The ability of CP814E to function effectively under varied thermal conditions further supports its application in large-scale heparin purification processes, which are critical for meeting industrial demand. This advancement could significantly enhance the production of high-purity heparin, meeting the growing demand for medical applications.

Author Contributions

B.K.: supervision, conceptualization, methodology, validation, investigation, data curation, visualization, writing—original draft, writing—review and editing, funding acquisition. L.B.: investigation, data curation, writing—review and editing. A.D.: data analysis, writing—original draft, writing—review and editing, visualization, validation. A.T.: writing—review and editing, visualization, investigation. M.R.: data curation, visualization, investigation. All authors have read and agreed to the published version of the manuscript.

Funding

This research was funded by Welch Foundation grant number BT 0041.

Acknowledgments

B.K. would like to thank Texas A & M University-Corpus Christi, Department of Physical and Environmental Sciences (PENS) for their generous support. We would also like to acknowledge the Welch Foundation for their generous support through grant number BT 0041. This funding has been instrumental in advancing our research and enabling us to achieve significant progress. We would also like to thank Michael Enayati from the Center for Materials and Manufacturing Sciences (CMMS) at Troy University for his valuable feedback.

Conflicts of Interest

The authors state that there are no known conflicting financial interests or personal connections that could insinuate their influence on the work reported in this paper.

References

  1. Reid, K.R.; Tabibi, A.; Adami, P.; Karimi, B. Optimized heparin adsorption using macroporous zeolites: A comprehensive study. Heliyon 2025, 11, e41398. [Google Scholar] [CrossRef] [PubMed]
  2. Lee, M.S.; Kong, J. Heparin: Physiology, Pharmacology, and Clinical Application. RCM 2015, 16, 189–199. [Google Scholar] [CrossRef] [PubMed]
  3. Oduah, E.I.; Linhardt, R.J.; Sharfstein, S.T. Heparin: Past, Present, and Future. Pharmaceuticals 2016, 9, 38. [Google Scholar] [CrossRef]
  4. Atallah, J.; Khachfe, H.H.; Berro, J.; Assi, H.I. The Use of Heparin and Heparin-like Molecules in Cancer Treatment: A Review. Cancer Treat. Res. Commun. 2020, 24, 100192. [Google Scholar] [CrossRef] [PubMed]
  5. Scott, L.J.; Perry, C.M. Tramadol: A review of its use in perioperative pain. Drugs 2000, 60, 139–176. [Google Scholar] [CrossRef]
  6. Urbinati, C.; Milanesi, M.; Lauro, N.; Bertelli, C.; David, G.; D’Ursi, P.; Rusnati, M.; Chiodelli, P. HIV-1 tat and heparan sulfate proteoglycans orchestrate the setup of in cis and in trans cell-surface interactions functional to lymphocyte trans-endothelial migration. Molecules 2021, 26, 7488. [Google Scholar] [CrossRef]
  7. Barrowcliffe, T. History of heparin. Heparin-A Century Prog. 2012, 207, 3–22. [Google Scholar]
  8. Anderson, J.; Saenko, E. Editorial I: Heparin Resistance; Oxford University Press: Oxford, UK, 2002; Volume 88, pp. 467–469. [Google Scholar]
  9. Flengsrud, R.; Larsen, M.L.; Ødegaard, O.R. Purification, characterization and in vivo studies of salmon heparin. Thromb. Res. 2010, 126, e409–e417. [Google Scholar] [CrossRef]
  10. Vreeburg, J.; Baauw, A. Method for Preparation of Heparin from Mucosa. Patent No. WO2010/110654 A, 26 February 2010. [Google Scholar]
  11. Karimi Abdolmaleki, M.; Das, A.; Khambhati, D.P.; Shafiee, A.; Dimas, K.; Velazquez, C.A.; Davachi, S.M.; Choubtarash Abardeh, S. Efficient and economic heparin recovery from porcine intestinal mucosa using quaternary ammonium-functionalized silica gel. Bioengineering 2022, 9, 606. [Google Scholar] [CrossRef]
  12. Das, A.; Khambhati, D.P.; Longoria, N.D.; Tabibi, A.; Davachi, S.M.; Dimas, K.; Laurencin, Y.; Carmona, L.; Avalos, P.Z.; Karimi Abdolmaleki, M. Modified diatomaceous earth in heparin recovery from porcine intestinal mucosa. Molecules 2023, 28, 7982. [Google Scholar] [CrossRef]
  13. Karimi Abdolmaleki, M.; Ganta, D.; Shafiee, A.; Velazquez, C.A.; Khambhati, D.P. Efficient heparin recovery from porcine intestinal mucosa using zeolite imidazolate framework-8. Molecules 2022, 27, 1670. [Google Scholar] [CrossRef] [PubMed]
  14. Van der Meer, J.-Y.; Kellenbach, E.; Van den Bos, L.J. From farm to pharma: An overview of industrial heparin manufacturing methods. Molecules 2017, 22, 1025. [Google Scholar] [CrossRef]
  15. Hoke, D.E.; Carson, D.D.; Höök, M. A heparin binding synthetic peptide from human HIP/RPL29 fails to specifically differentiate between anticoagulantly active and inactive species of heparin. J. Negat. Results Biomed. 2003, 2, 1–10. [Google Scholar] [CrossRef]
  16. Linhardt, R.J.; Ampofo, S.A.; Fareed, J.; Hoppensteadt, D.; Folkman, J.; Mulliken, J.B. Isolation and characterization of human heparin. Biochem. J. 1992, 31, 12441–12445. [Google Scholar] [CrossRef] [PubMed]
  17. Yang, X.; Wang, Q.; Zhang, A.; Shao, X.; Liu, T.; Tang, B.; Fang, G. Strategies for sustained release of heparin: A review. Carbohydr. Polym. 2022, 294, 119793. [Google Scholar] [CrossRef]
  18. Ryu, U.; Jee, S.; Rao, P.C.; Shin, J.; Ko, C.; Yoon, M.; Park, K.S.; Choi, K.M. Recent advances in process engineering and upcoming applications of metal–organic frameworks. Coord. Chem. Rev. 2021, 426, 213544. [Google Scholar] [CrossRef]
  19. Haley, R.A.; Ringo, J.M.; Hopgood, H.; Denlinger, K.L.; Das, A.; Waddell, D.C. Graduate student designed and delivered: An upper-level online course for undergraduates in green chemistry and sustainability. J. Chem. Educ. 2018, 95, 560–569. [Google Scholar] [CrossRef]
  20. Eskandarloo, H.; Godec, M.; Arshadi, M.; Padilla-Zakour, O.I.; Abbaspourrad, A. Multi-porous quaternized chitosan/polystyrene microbeads for scalable, efficient heparin recovery. J. Chem. Eng. 2018, 348, 399–408. [Google Scholar] [CrossRef]
  21. Gu, H.; Liu, Y.; Wang, L.; Zhang, B.; Yin, D.; Zhang, Q. Monolithic macroporous hydrogels prepared from oil-in-water high internal phase emulsions for high-efficiency purification of Enterovirus 71. J. Chem. Eng. 2020, 401, 126051. [Google Scholar] [CrossRef]
  22. Welzel, P.B.; Grimmer, M.; Renneberg, C.; Naujox, L.; Zschoche, S.; Freudenberg, U.; Werner, C. Macroporous starPEG-heparin cryogels. Biomacromolecules 2012, 13, 2349–2358. [Google Scholar] [CrossRef] [PubMed]
  23. Aw, M.S.; Simovic, S.; Yu, Y.; Addai-Mensah, J.; Losic, D. Porous silica microshells from diatoms as biocarrier for drug delivery applications. Powder Technol. 2012, 223, 52–58. [Google Scholar] [CrossRef]
  24. Serati-Nouri, H.; Jafari, A.; Roshangar, L.; Dadashpour, M.; Pilehvar-Soltanahmadi, Y.; Zarghami, N. Biomedical applications of zeolite-based materials: A review. Mater. Sci. Eng. C. 2020, 116, 111225. [Google Scholar] [CrossRef]
  25. Bacakova, L.; Vandrovcova, M.; Kopova, I.; Jirka, I. Applications of zeolites in biotechnology and medicine–a review. Biomater. Sci. 2018, 6, 974–989. [Google Scholar] [CrossRef]
  26. Rubio-Martinez, M.; Avci-Camur, C.; Thornton, A.W.; Imaz, I.; Maspoch, D.; Hill, M.R. New synthetic routes towards MOF production at scale. Chem. Soc. Rev. 2017, 46, 3453–3480. [Google Scholar] [CrossRef] [PubMed]
  27. Boer, D.G.; Langerak, J.; Pescarmona, P.P. Zeolites as selective adsorbents for CO2 separation. ACS Appl. Energy Mater. 2023, 6, 2634–2656. [Google Scholar] [CrossRef]
  28. Efe, C.; van der Wielen, L.A.; Straathof, A.J. High silica zeolites as an alternative to weak base adsorbents in succinic acid recovery. Ind. Eng. Chem. Res. 2010, 49, 1837–1843. [Google Scholar] [CrossRef]
  29. Wang, L.; Ozawa, K.; Komatsu, T.; Ikeda, T. Ca2+-exchanged ferrierite: Quasi one-dimensional zeolite for highly selective and stable formation of light alkenes in catalytic cracking of n-octane. Appl. Catal. A Gen. 2011, 407, 127–133. [Google Scholar] [CrossRef]
  30. Kirdeciler, S.K.; Soy, E.; Öztürk, S.; Kucherenko, I.; Soldatkin, O.; Dzyadevych, S.; Akata, B. A novel urea conductometric biosensor based on zeolite immobilized urease. Talanta 2011, 85, 1435–1441. [Google Scholar] [CrossRef]
  31. Ninan, N.; Muthiah, M.; Park, I.-K.; Elain, A.; Wong, T.W.; Thomas, S.; Grohens, Y. Faujasites incorporated tissue engineering scaffolds for wound healing: In vitro and in vivo analysis. ACS Appl. Mater. Interfaces 2013, 5, 11194–11206. [Google Scholar] [CrossRef]
  32. Moshoeshoe, M.; Nadiye-Tabbiruka, M.S.; Obuseng, V. A review of the chemistry, structure, properties and applications of zeolites. Am. J. Mater. Sci. 2017, 7, 196–221. [Google Scholar]
  33. Matsui, M.; Kiyozumi, Y.; Mizushina, Y.; Sakaguchi, K.; Mizukami, F. Adsorption and desorption behavior of basic proteins on zeolites. Sep. Purif. Technol. 2015, 149, 103–109. [Google Scholar] [CrossRef]
  34. Halasz, I.; Kim, S.; Marcus, B. Uncommon adsorption isotherm of methanol on a hydrophobic Y-zeolite. J. Phys. Chem. B 2001, 105, 10788–10796. [Google Scholar] [CrossRef]
  35. Zhang, X.; Sun, J.; Liu, J.; Xu, H.; Dong, B.; Sun, X.; Zhang, T.; Xu, S.; Xu, L.; Bai, X. Label-free electrochemical immunosensor based on conductive Ag contained EMT-style nano-zeolites and the application for α-fetoprotein detection. Sens. Actuators B Chem. 2018, 255, 2919–2926. [Google Scholar] [CrossRef]
  36. Vasconcelos, A.A.; Len, T.; de Oliveira, A.d.N.; Costa, A.A.F.d.; Souza, A.R.d.S.; Costa, C.E.F.d.; Luque, R.; Rocha Filho, G.N.d.; Noronha, R.C.R.; Nascimento, L.A.S.d. Zeolites: A theoretical and practical approach with uses in (bio) chemical processes. Appl. Sci. 2023, 13, 1897. [Google Scholar] [CrossRef]
  37. Souza, I.M.; García-Villén, F.; Viseras, C.; Pergher, S.B. Zeolites as ingredients of medicinal products. Pharmaceutics 2023, 15, 1352. [Google Scholar] [CrossRef] [PubMed]
  38. Nsengiyumva, E.M.; Heitz, M.P.; Alexandridis, P. Carboxymethyl hydroxypropyl guar gum physicochemical properties in dilute aqueous media. Int. J. Biol. Macromol. 2024, 262, 129775. [Google Scholar] [CrossRef] [PubMed]
  39. Rauschkolb, J.C.; Ribeiro, B.C.; Feiden, T.; Fischer, B.; Weschenfelder, T.A.; Cansian, R.L.; Junges, A. Parameter Estimation of Mark-Houwink Equation of Polyethylene Glycol (PEG) Using Molecular Mass and Intrinsic Viscosity in Water. Biointerface Res. Appl. Chem. 2021, 12, 1778–1790. [Google Scholar] [CrossRef]
  40. Rahmani, S.; Zeynizadeh, B.; Karami, S. Removal of cationic methylene blue dye using magnetic and anionic-cationic modified montmorillonite: Kinetic, isotherm and thermodynamic studies. Appl. Clay Sci. 2020, 184, 105391. [Google Scholar] [CrossRef]
  41. Jia, S.-X.; Chi, Q.-N.; Zhang, Y.; Liu, T.; Kou, X.; Wang, F.; Qi, Y.-K.; Du, S.-S.; Xing, X.-H. Binding ability of methylene blue with heparin dependent on its sulfate level rather than its sulfation location or basic saccharide structure. Glycoconj. J. 2021, 38, 551–560. [Google Scholar] [CrossRef]
  42. Bergua, J.F.; Alvarez-Diduk, R.; Idili, A.; Parolo, C.; Maymó, M.; Hu, L.; Merkoçi, A. Low-cost, user-friendly, all-integrated smartphone-based microplate reader for optical-based biological and chemical analyses. Anal. Chem. 2022, 94, 1271–1285. [Google Scholar] [CrossRef]
  43. Jiang, N.; Shang, R.; Heijman, S.G.; Rietveld, L.C. Adsorption of triclosan, trichlorophenol and phenol by high-silica zeolites: Adsorption efficiencies and mechanisms. Sep. Purif. Technol. 2020, 235, 116152. [Google Scholar] [CrossRef]
  44. Kim, K.-J.; Ahn, H.-G. The effect of pore structure of zeolite on the adsorption of VOCs and their desorption properties by microwave heating. Micropor. Mesopor. Mater. 2012, 152, 78–83. [Google Scholar] [CrossRef]
  45. Dinda, A.K.; Tripathy, D.R.; Das, A.; Dasgupta, S. Comparison of the ribonucleolytic activity of the dityrosine cross-linked Ribonuclease A dimer with its monomer in the presence of inhibitors. Int. J. Biol. Macromol. 2014, 63, 107–113. [Google Scholar] [CrossRef]
  46. Grant, D.; Long, W.; Moffat, C.F.; Williamson, F.B. Infrared spectroscopy of chemically modified heparins. Biochem. J. 1989, 261, 1035–1038. [Google Scholar] [CrossRef]
  47. Das, A.; Lao, E.A.; Gudmundsdottir, A.D. Photoenolization of o-Methylvalerophenone Ester Derivative. Photochem. Photobiol. 2016, 92, 388–398. [Google Scholar] [CrossRef]
  48. Pandey, A.; Dalal, S.; Dutta, S.; Dixit, A. Structural characterization of polycrystalline thin films by X-ray diffraction techniques. J. Mater. Sci. Mater. Electron. 2021, 32, 1341–1368. [Google Scholar] [CrossRef]
  49. Mongkolsuttirat, K.; Buajarern, J. Uncertainty evaluation of crystallite size measurements of nanoparticle using X-Ray Diffraction analysis (XRD). J. Phys. Conf. Ser. 2021, 1719, 012054. [Google Scholar] [CrossRef]
  50. Li, J.; Gao, M.; Yan, W.; Yu, J. Regulation of the Si/Al ratios and Al distributions of zeolites and their impact on properties. Chem. Sci. 2023, 14, 1935–1959. [Google Scholar] [CrossRef] [PubMed]
  51. Zhang, R.; Meng, B.; Wang, X.; Liu, Y.; Zeng, J.; Weng, G.; Xu, J.; Xiang, J.; Song, Y.; Jin, L. Quaternized Fe3O4@ chitosan nanoparticles for efficient and selective isolation of heparin. Int. J. Biol. Macromol. 2025, 293, 139368. [Google Scholar] [CrossRef]
  52. Aumeier, B.M.; Augustin, A.; Thönes, M.; Sablotny, J.; Wintgens, T.; Wessling, M. Linking the effect of temperature on adsorption from aqueous solution with solute dissociation. J. Hazard. Mater. 2022, 429, 128291. [Google Scholar] [CrossRef]
  53. Wang, J.; Guo, X. Adsorption kinetics and isotherm models of heavy metals by various adsorbents: An overview. Crit. Rev. Environ. Sci. Technol. 2023, 53, 1837–1865. [Google Scholar] [CrossRef]
  54. Ho, Y.-S.; McKay, G. Pseudo-second order model for sorption processes. Process Biochem. 1999, 34, 451–465. [Google Scholar] [CrossRef]
  55. Simonin, J.-P. On the comparison of pseudo-first order and pseudo-second order rate laws in the modeling of adsorption kinetics. Chem. Eng. J. 2016, 300, 254–263. [Google Scholar] [CrossRef]
  56. Das, A.; Thomas, S.S.; Garofoli, A.A.; Chavez, K.A.; Krause, J.A.; Bohne, C.; Gudmundsdottir, A.D. Steric Demand and Rate-determining Step for Photoenolization of Di-ortho-substituted Acetophenone Derivatives. Photochem. Photobiol. 2019, 95, 154–162. [Google Scholar] [CrossRef]
  57. Azizi, S.; Mahdavi Shahri, M.; Mohamad, R. Green synthesis of zinc oxide nanoparticles for enhanced adsorption of lead ions from aqueous solutions: Equilibrium, kinetic and thermodynamic studies. Molecules 2017, 22, 831. [Google Scholar] [CrossRef]
  58. Sarkar, S.K.; Gatlin, D.M.; Das, A.; Loftin, B.; Krause, J.A.; Abe, M.; Gudmundsdottir, A.D. Laser flash photolysis of nanocrystalline α-azido-p-methoxy-acetophenone. Org. Biomol. Chem. 2017, 15, 7380–7386. [Google Scholar] [CrossRef] [PubMed]
  59. Wu, F.-C.; Tseng, R.-L.; Juang, R.-S. Initial behavior of intraparticle diffusion model used in the description of adsorption kinetics. J. Chem. Eng. 2009, 153, 1–8. [Google Scholar] [CrossRef]
  60. Musah, M.; Azeh, Y.; Mathew, J.T.; Umar, M.T.; Abdulhamid, Z.; Muhammad, A.I. Adsorption kinetics and isotherm models: A review. Caliphate J. Sci. Technol. 2022, 4, 20–26. [Google Scholar] [CrossRef]
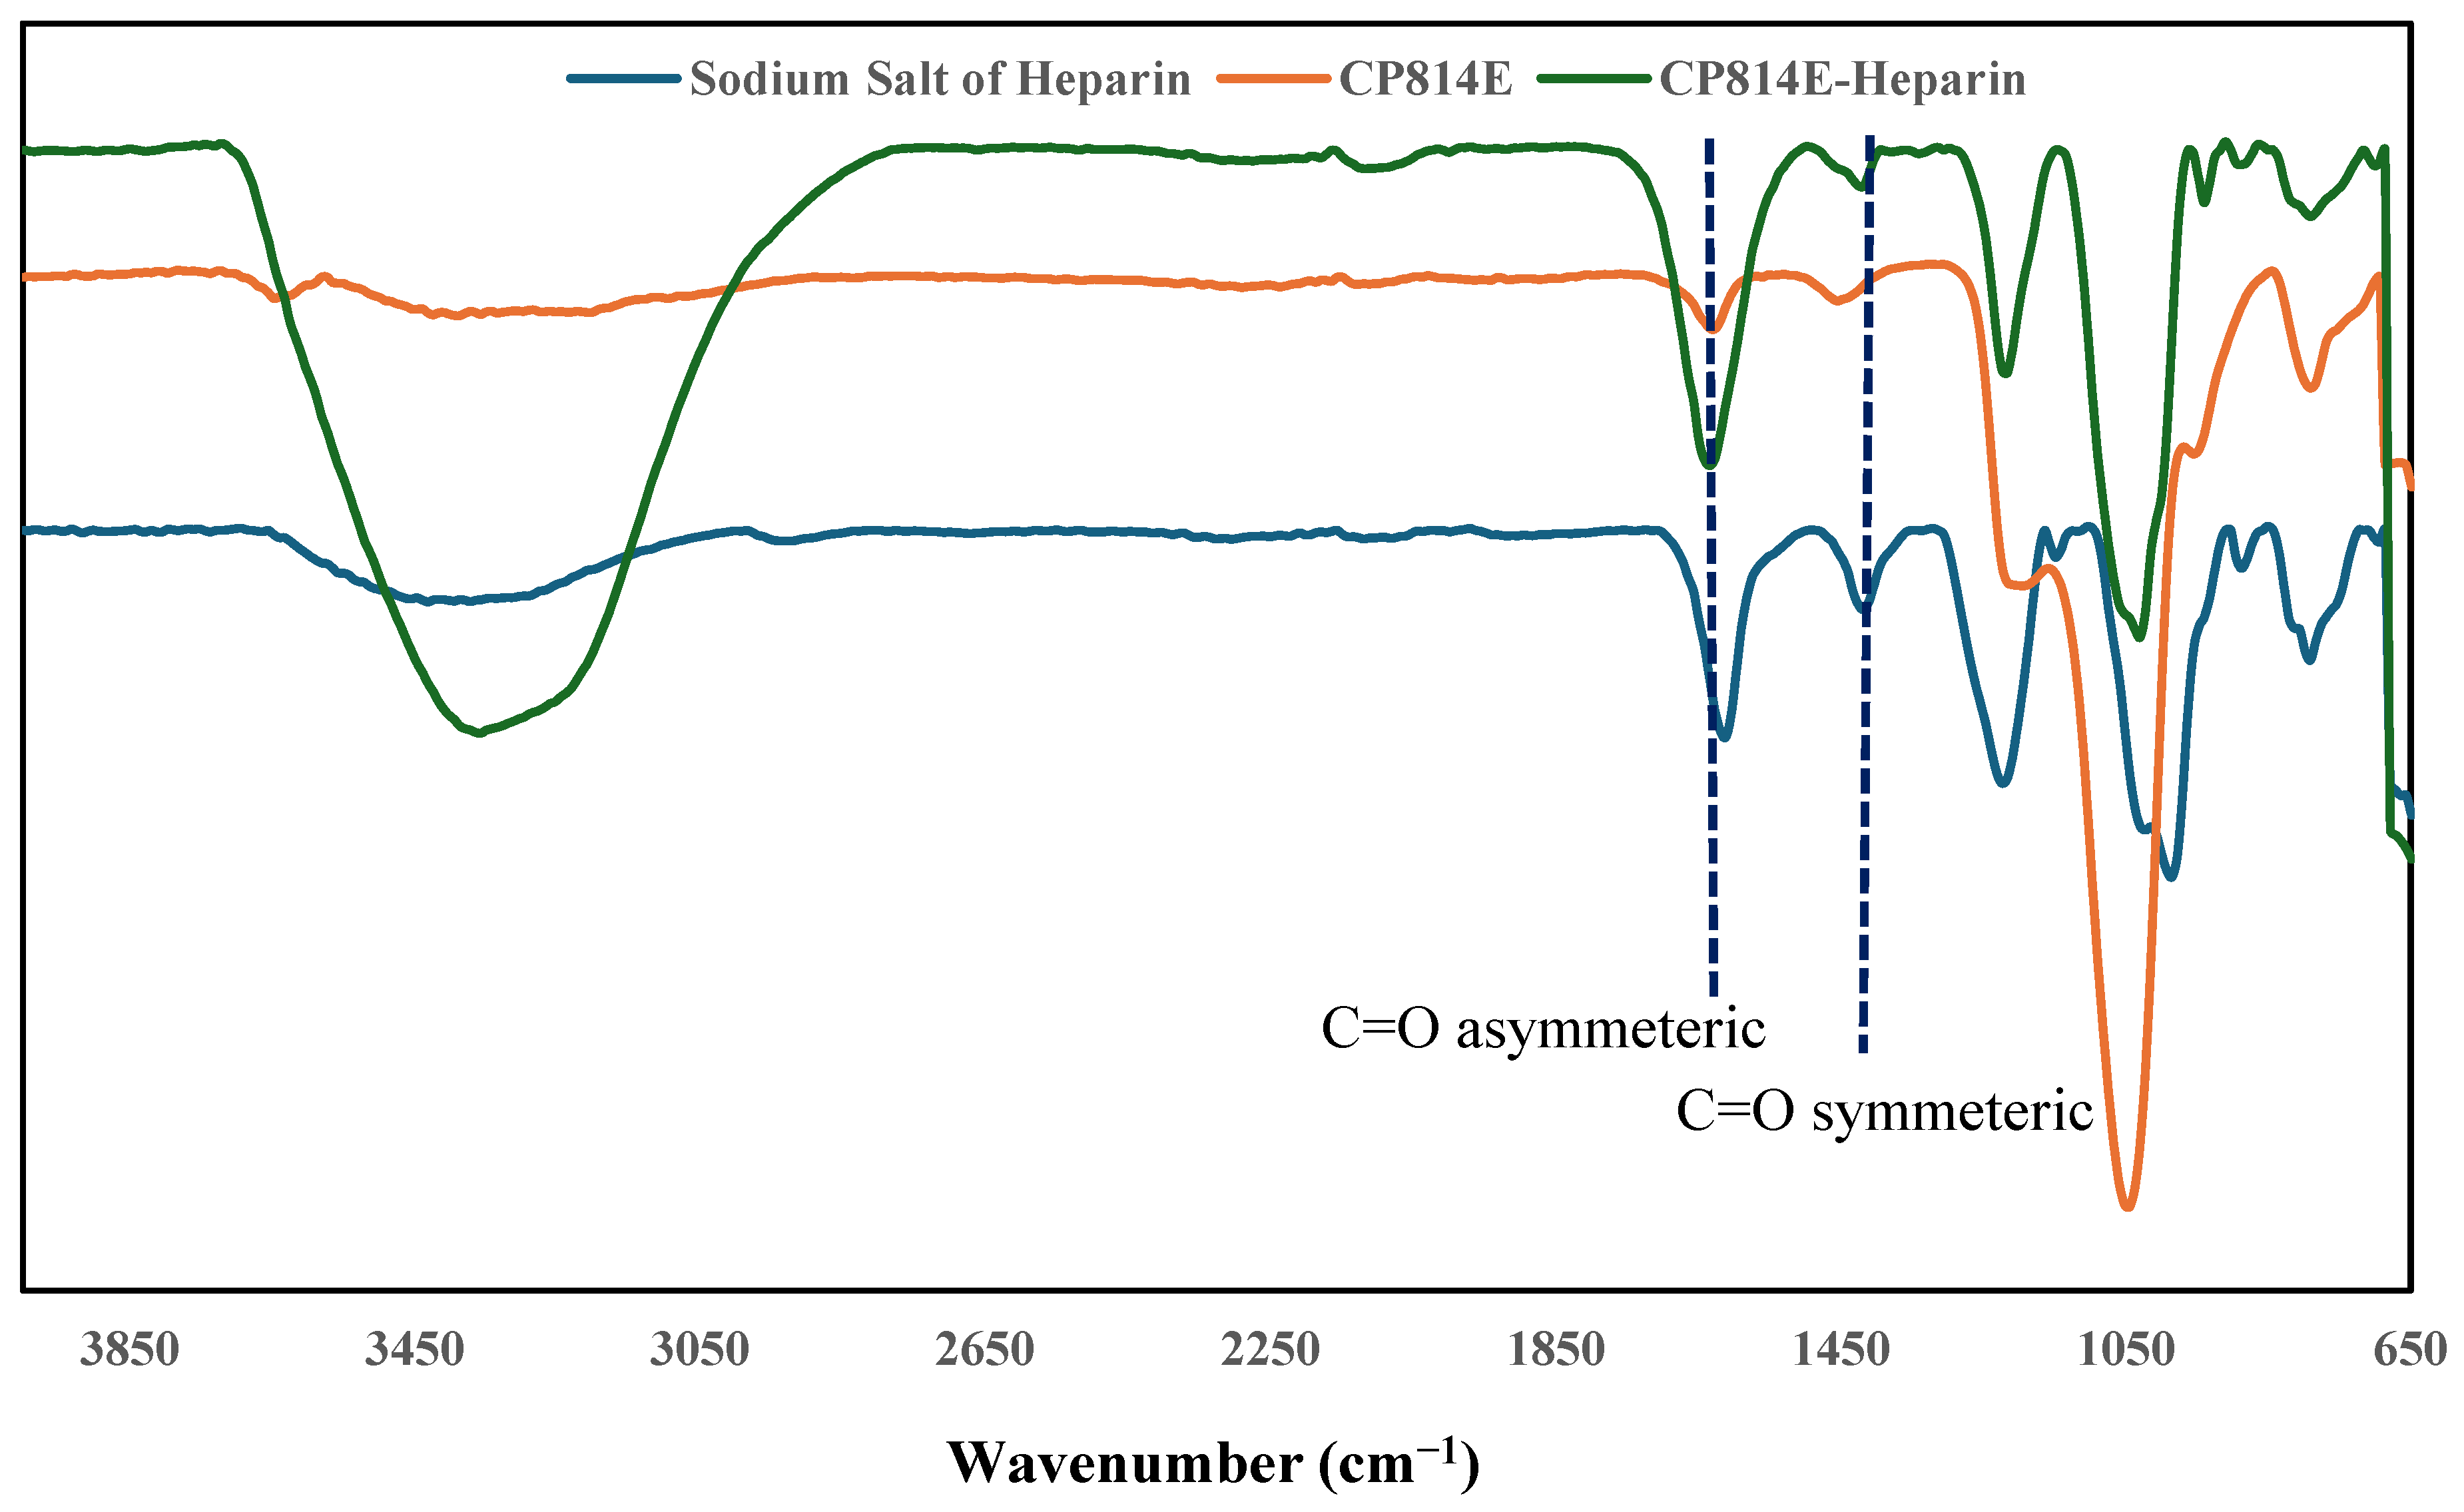
Figure 1. The IR spectra of store-bought heparin sodium salt, CP814E, and the pre-adsorbed heparin standard on CP814E.
Purification 01 00006 g001
Figure 2. The XRD spectra of two zeolites CP814E, and CP914C before adsorption of heparin.
Purification 01 00006 g002
Figure 3. The adsorption efficiency of heparin onto CP814E was optimized by adjusting (a) adsorbent dosage (process: 25 mL of a 1315 mg L−1 mucosa sample at pH 8, for 240 min of contact time at 55 °C) and (b) pH (process: 0.5 g of CP814E in 20 mL of a 1315 mg L−1 mucosa sample for 240 min of contact time at 55 °C).
Purification 01 00006 g003
Figure 4. The adsorption efficiency of heparin onto CP814E was optimized by adjusting (a) contact time (parameters: 0.5 g of CP814E in 25 mL of a 1315 mg L−1 porcine mucosa sample at pH 8 and 55 °C) and (b) temperature (parameters: 0.5 g of CP814E in 25 mL of a 1315 mg L−1 mucosa sample at pH 8 for 240 min of contact time).
Purification 01 00006 g004
Figure 5. The pseudo-first-order (a), pseudo-second-order (b), intraparticle diffusion (c), and Elovich (d) kinetic models for heparin adsorption by CP814E in the optimal conditions.
Purification 01 00006 g005
Figure 6. The van’t Hoff plot (a) and ln(1 − θ) versus 1/T plot (b) of heparin adhesion on CP814E.
Purification 01 00006 g006
Figure 7. Stability test of CP814E over five adsorption–desorption heparin recovery cycle.
Purification 01 00006 g007
Table 1. The calculated parameters of kinetic models for HEP adsorption on CP814E.
ModelParameterValue
Pseudo-first-orderK10.0149
qe (cal)20.4456
R20.9827
Pseudo-second-orderK20.0004
qe (cal)26.3852
R20.9256
Intraparticle DiffusionKdiff1.0651
C1.6113
R20.8481
Elovichβ0.1933
α0.8837
R20.9591
Table 2. The value of thermodynamic parameters for HEP adsorption on the CP814 E.
Temperature (K)
298.15303.15318.15328.15333.15338.15343.15348.15
∆H°
(kJ/mol)
53.8430−50.6528
∆S°
(kJ/mol. K)
0.1918−0.1272
Ea
(kJ/mol)
11.1055−14.2084
S*0.0105112.3480
∆G (KJ/mol)
−3.3273−4.2860−7.1623−8.9023−8.2661−7.6299−6.9938−6.3577
Disclaimer/Publisher’s Note: The statements, opinions and data contained in all publications are solely those of the individual author(s) and contributor(s) and not of MDPI and/or the editor(s). MDPI and/or the editor(s) disclaim responsibility for any injury to people or property resulting from any ideas, methods, instructions or products referred to in the content.