
What Are the Key Built Environment Features Associated with Heat-Related Health Risks Among Older People in High Income Countries?


Abstract
1. Introduction
2. Methods
2.1. Search Strategy
2.2. Inclusion and Exclusion Criteria
2.3. Evidence Selection and Data Extraction
2.4. Assessment of Quality of Evidence
3. Results
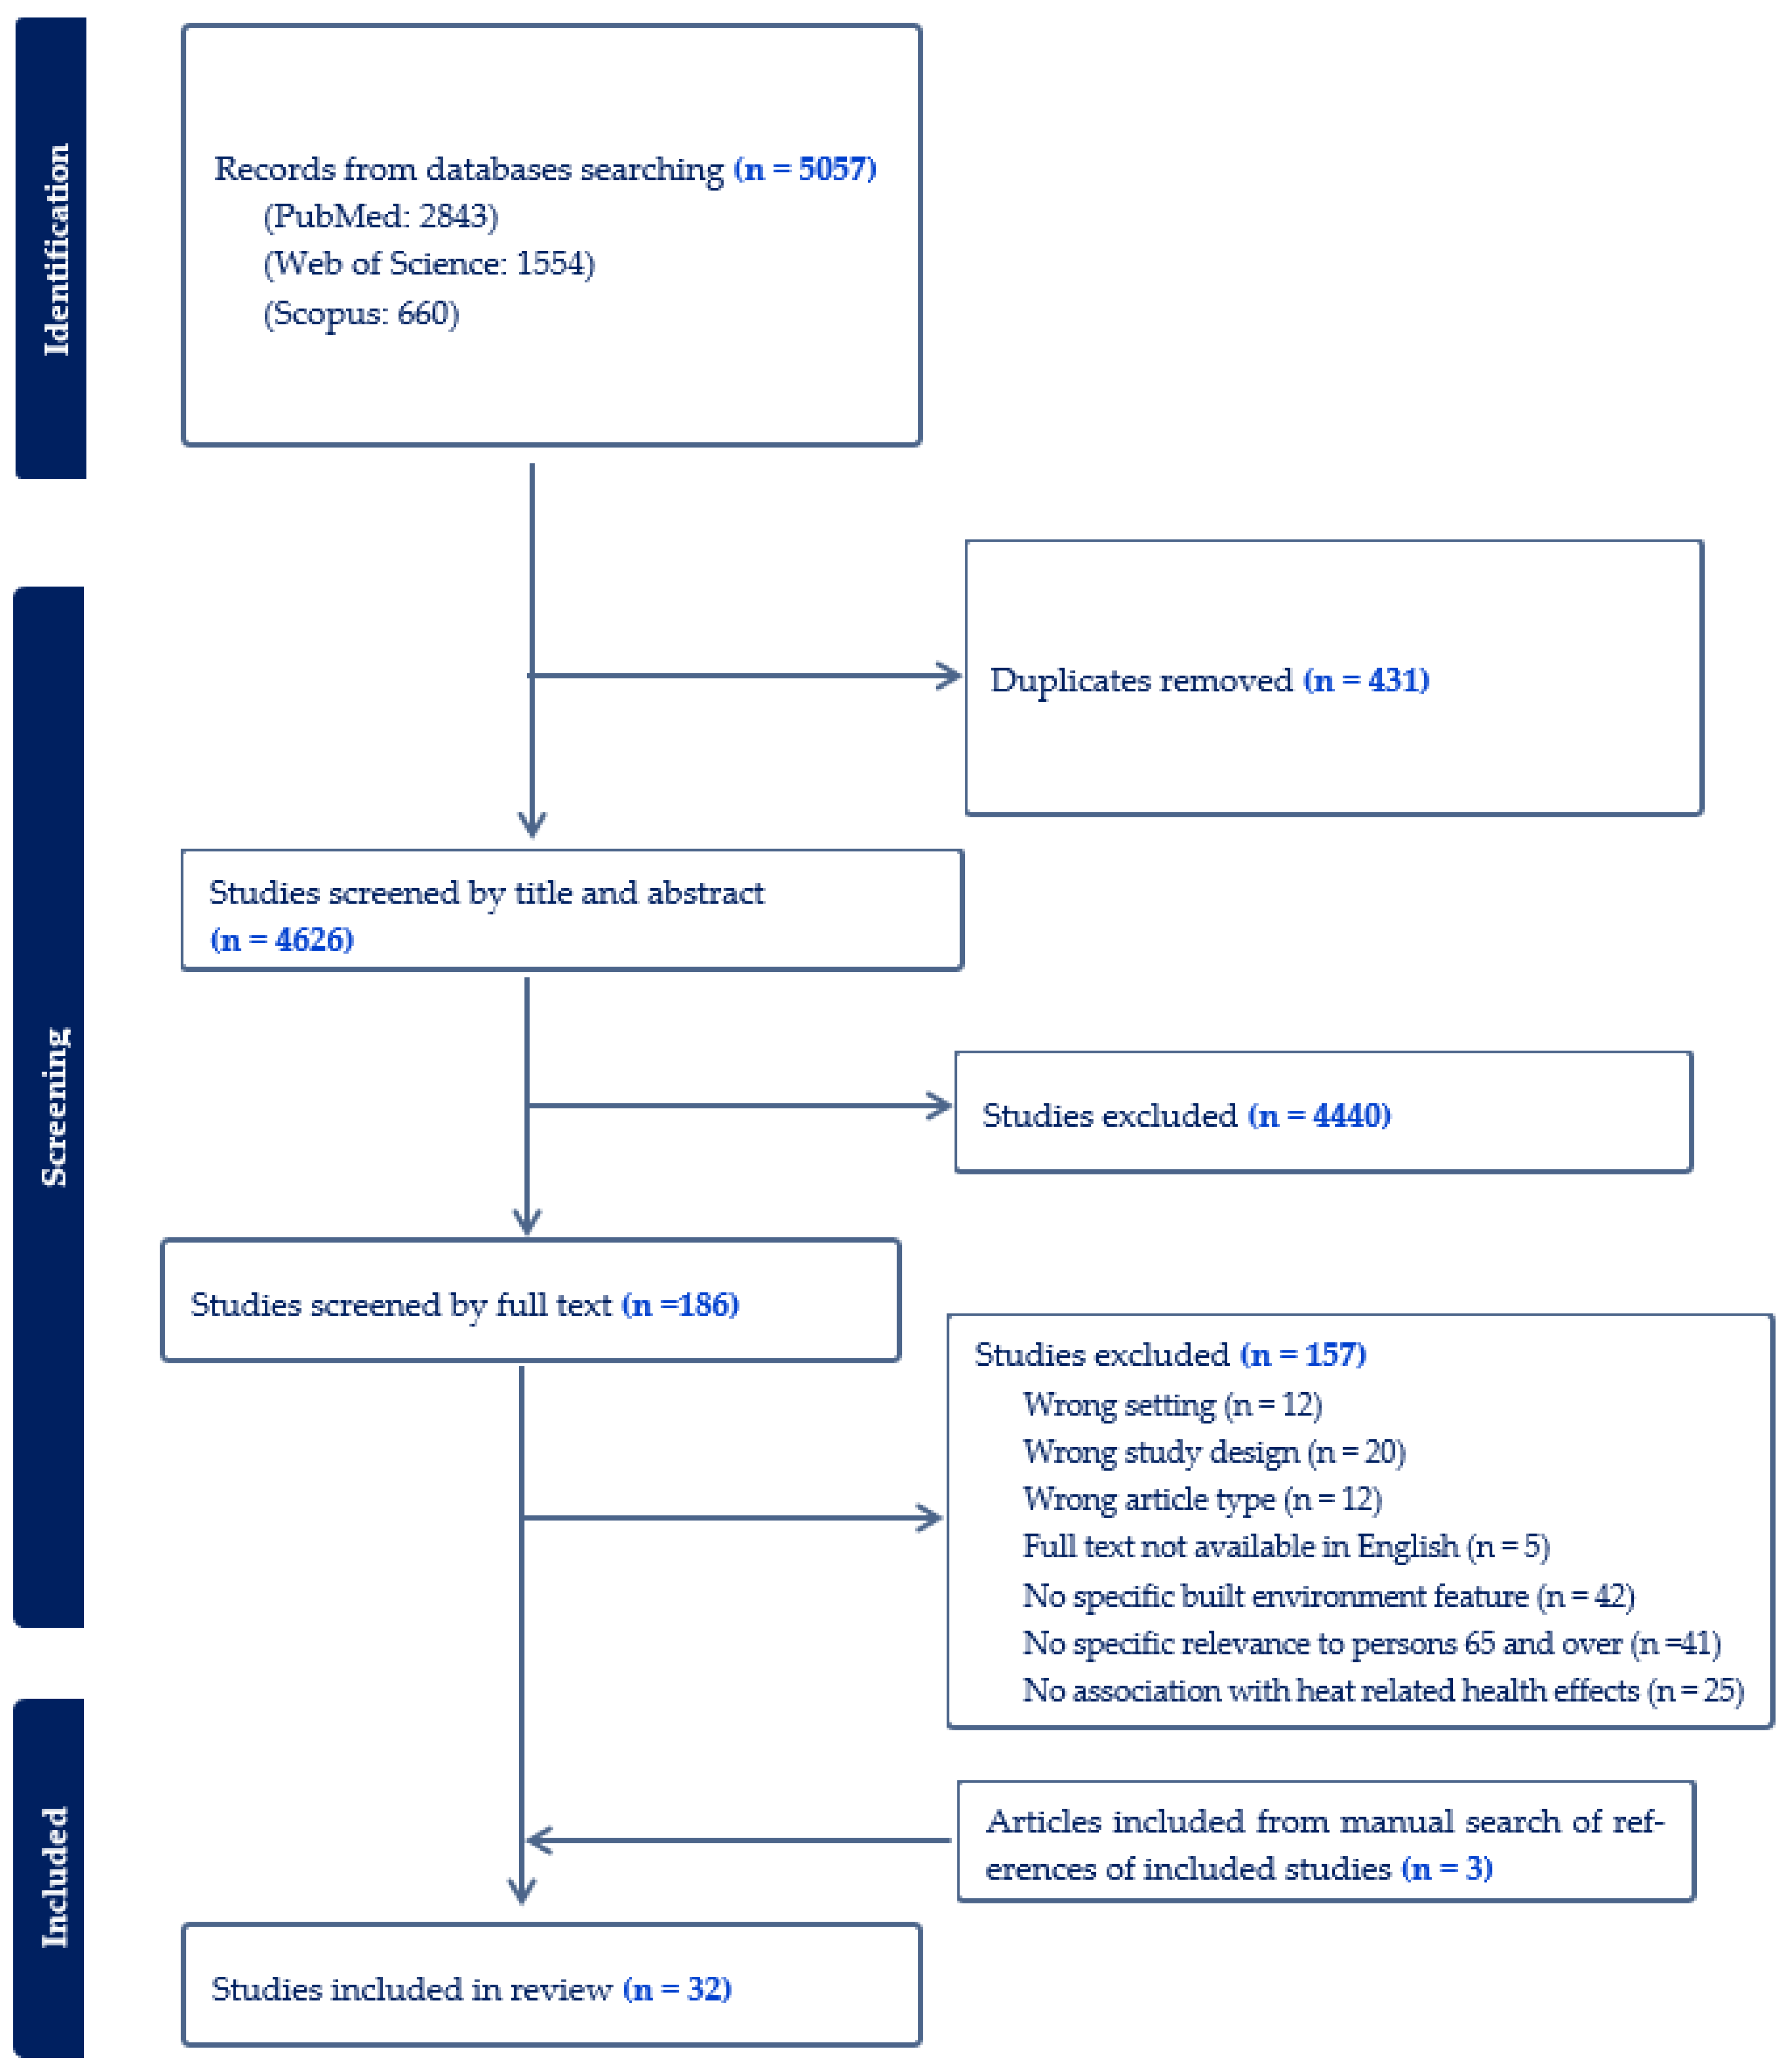
3.1. Search Results

| Author, Year of Publication | Study Site/s (Climate Zone) | Study Design | Study Period | Built Environment Features (Methods for Ascertaining) | Heat-Related Health Impacts |
|---|---|---|---|---|---|
| Alberini et al., 2011 [32] | Canada: Winnipeg, Windsor, Fredericton, Regina and Sarnia (Humid continental climate) | Observational—Cross-sectional | 2–18 September 2010 | Central or window air conditioning (AC) (Survey, objective measurement) | Morbidity and self-perceived health including dizziness, nausea, difficulty breathing, dehydration, mild and severe heat exhaustion, heat stroke, and other cardio- or cerebrovascular symptoms. |
| Bélanger et al., 2016 [33] | Canada: Quebec (Arctic, Subarctic, and Humid continental climate) | Observational—Cross-sectional | 2010–2011 | AC; thermal insulation of dwelling; walkability; green spaces (Survey, objective measurement) | Morbidity—Self-reporting of adverse physical health during very hot and very humid summer conditions. |
| Crank et al., 2024 [34] | USA: Houston, Phoenix, Los Angeles (Humid subtropical, Hot desert, and Mediterranean climate) | Observational—Cross-sectional | 2017 | AC; white roof; weatherisation (Survey, objective measurement) | Morbidity—Heat-related health symptoms. |
| Eisenman et al., 2016 [35] | USA: Maricopa County, including Phoenix, Arizona (Desert climate) | Observational—analytical | 2005–2010 | Walkable access (≤ 0.89 km) to publicly accessible cooled spaces; home AC; thermal protective properties of residential buildings and features contributing to thermal characteristics—wall materials (concrete block, wood frame), insulation thickness, windowpanes, attic insulation, roofing material, and size of home. (Census tract, objective measurement) | Mortality—All-cause and heat-related illness. |
| Fujimoto et al., 2023 [36] | Japan (Humid subtropical, Humid continental, Tropical rainforest climate) | Observational—Cross-sectional | 2018–2019 | AC (Survey, objective measurement) | Morbidity—Heatstroke |
| Gronlund et al., 2015 [37] | USA: Michigan (Humid continental climate) | Time-stratified case-crossover | May–September, 1990–2007 | Percent of homes built before 1940, 1940–1959, 1960–1979, and after 1979; green space. (Census tract, objective measurement) | Mortality—Primary causes of death coded as all-cause, heat-related, cardiovascular, and respiratory mortality. |
| Gronlund et al., 2016 [38] | USA (Semi-arid, Desert, Humid continental, Humid temperate, Humid subtropical, Mediterranean, Tropical, Oceanic, Subarctic, and Polar climate) | Observational—case-crossover | May–September, 1992–2006 | Pre-1940 housing; Land cover classifications and percent of area non-greenspace (not classified as open water, developed open space [mostly lawn grasses], forest, shrubland, scrub, agricultural, grasses or wetlands). (Census tract, objective measurement) | Morbidity—Hospitalisation for respiratory and renal/heat; including any contributing causes coded as heat-related illness. |
| Guirguis et al., 2018 [39] | USA: San Diego (Mediterranean climate) | Observational—Analytical | May–October 1999–2013 | AC (Survey, objective measurement) | Morbidity—Hospitalisation. Unscheduled at acute care facilities for all cardiovascular diseases (CVD) and respiratory diseases, acute renal failure, mental health, dehydration, and heat illness. |
| Hansen et al., 2022 [40] | Australia: Adelaide and suburbs, Iron Triangle; and Fleurieu Peninsula (Mediterranean climate) | Mixed methods—observational and simulation | May 2018; January to October 2019 | House and roof materials; insulation; presence/usage of AC (Survey, objective measurement) | Morbidity—Self-Perceived Health: Coronary disease, fatigue or tiredness, shortness of breath, sleeplessness, and dizziness. Diseases or symptoms found to affect thermal sensation, including asthma and other respiratory illnesses, renal diseases, dehydration, hypertension, and allergies. |
| Harlan et al., 2013 [41] | USA: Maricopa County, Arizona (Desert climate) | Observational—analytical | 2000–2008 | Vegetation (Satellite imaging, objective measurement) | Mortality—Exposure and effects of excessive natural heat; and underlying causes of death: heat exposure, exhaustion, sun, heat stress, heat stroke, hyperthermia. |
| Heo et al., 2021 [42] | USA: Connecticut, Pennsylvania, New Hampshire, New Jersey, New York, and Massachusetts (Humid continental, and Humid subtropical climate) | Observational—analytic | 2000–2016 | Greenspace (Satellite imaging, objective measurement) | Morbidity—Hospitalisations for all CVD and heatstroke. |
| Jang et al., 2020 [43] | South Korea: Seoul (Humid continental climate) | Observational—population-based time-series study | June to September 2011–2017 | Eight district-level land use/land cover (LULC) indicators: woodland, crop-field, building, road, green coverage, wetland, impervious area, and urban forest, as percentages of total km2 area; detached houses or apartments. (Satellite imaging, objective measurement) | Mortality—Heat-related mortality |
| Kim et al., 2020 [44] | South Korea (Humid subtropical and Humid continental climate) | Observational—time-series study | June to September 2008–2017 | Housing quality and density (Census tract, objective measurement) | Mortality—Heatwave-related mortality |
| Rosenthal et al., 2014 [45] | USA: New York City (Humid subtropical climate) | Observational—ecological | 1997–2006 | Housing conditions (dilapidated or deteriorating residential buildings, homes near structures rated good or excellent); AC ownership and usage; vegetation, impervious surfaces. (Survey, Census tract, and Satellite imaging, objective measurement) | Mortality—Heat-related mortality, hypertension diagnosis, diabetes, self-reported general health status of fair/poor, obese, and current asthmatics. |
| Larrieu et al., 2008 [46] | France: Gironde, Dordogne, Bordeaux, Dijon (Oceanic climate) | Cross-sectional nested in two prospective cohorts. | 1–15 August 2003 | Accommodation characteristics: number of rooms; floor level; possibility of ventilating; presence of AC and bedroom. (Survey, objective measurement) | Morbidity—Hospitalisation and Mortality Felt morbidity: whether subjects felt a deterioration of their health during the heat wave; and Objective morbidity: (occurrence of a morbid outcome—dizzy spell, fall, loss of balance during the heatwave). |
| Lee et al., 2022 [13] | USA: Cincinnati (Humid continental climate) | Observational—analytical | June to September 2016–2020 | Vegetation; surfaces; water bodies; urban structure (density, spatial structure [volume of the built-up area], normalized difference built-up index [NDBI] to measure the distribution of urban structure within the block groups); and percentage of pre-1939 houses. (Satellite imaging and Census tract, objective measurement) | Morbidity—Ambulance Call-outs and Mortality—Heat-related call-outs for breathing problems, cardiac or respiratory arrest and death, chest pain, headache, heat exposure, stroke and CVD, and unconsciousness and fainting. |
| López-Bueno et al., 2020 [47] | Spain: Madrid (Semi-arid and Mediterranean climate) | Observational—Ecological, longitudinal retrospective time series | January 2010 to December 2013 | AC; aggregations of green zones including gardens, and historic and forest parks. (Satellite imaging and Census tract, objective measurement) | Mortality—Heat-related mortality. |
| Madrigano et al., 2015 [48] | USA: New York City (Humid subtropical climate) | Observational—Case-only analysis | 2000–2011 | Built space; proportion covered by trees, grass/shrubs. (Census tract, objective measurement) | Mortality—Underlying causes of death, particularly CVD, Myocardial infarction (MI), congestive heart failure (CHF), and Chronic obstructive pulmonary disease (COPD). |
| Naughton et al., 2002 [49] | USA: Chicago (Humid continental climate) | Observational—Case-control study | July–August 1999 | Top floor location of dwelling; AC (Survey, objective measurement) | Mortality—Heart condition, heatstroke. |
| Ostro et al., 2010 [15] | USA: California (Mediterranean climate) | Time-stratified case-crossover | May–September 1999–2005 | AC ownership and usage (Survey, objective measurement) | Morbidity—Hospitalisation: Respiratory disease, Pneumonia, Asthma, COPD, CVD, Ischemic heart disease, Stroke, Ischemic stroke, MI, Heart failure, Dehydration, Heatstroke, Diabetes, Acute renal failure, Intestinal infection. |
| Schuster et al., 2017 [50] | Germany: Berlin (Oceanic climate) | Observational—Cross-sectional | August–September 2013 | Building type; living and bedroom orientation; apartment level; perceived amount of urban green in neighbourhoods; accessibility of parks and open water. (Survey, objective measurement) | Morbidity—Self-rated health, (medical) drug use, self-rated fitness. |
| Seong et al., 2022 [51] | USA: Austin (Humid subtropical climate) | Observational | May to September 2020 and 2021 | Impervious cover; tree canopy; pre-1980 housing; no AC; road density; water areas; and greenspace. (Satellite imaging and Census tract, objective measurement) | Morbidity—Heat-related ambulance call-outs. |
| Son et al., 2016 [52] | South Korea: Seoul (Humid continental climate) | Observational—analytical | May to September 2000–2009 | Urban vegetation (Satellite imaging, objective measurement) | Mortality—All-cause mortality. |
| Uejio et al., 2011 [53] | USA: Philadelphia and Phoenix (Humid subtropical and desert climate) | Ecological | Philadelphia: July–August 1999 Phoenix: June–September 2005 | Vegetation health and density; impervious surface (%); housing density (houses/km2); single-family detached homes (%); age of house. (Satellite imaging and Census tract, objective measurement) | Philadelphia: Mortality—extreme heat-related mortality, and Phoenix: Morbidity—Heat distress calls (ambulance call-outs). |
| Vandentorren et al., 2006 [14] | France: Paris, Tours, and Orleans (Oceanic climate) | Observational—Case-control | 8–13 August 2003 (peak of the heat wave) | Housing conditions (related to building type, particular dwelling unit, and principal rooms, especially bedroom); Heat-island (calculated from mean of the surface temperature within 200 m radius area around each home and vegetative cover); Lack of thermal insulation; bedroom on the top floor; cooling techniques including fan or AC. (Survey, Census tract and Satellite imaging, objective measurement) | Mortality—Cardiovascular or heat-related death (where the primary cause of death on certificates mentioned ‘dehydration’, ‘hyperthermia’ or ‘heat stroke’); Other causes included cancer, respiratory, and neurological diseases. |
| Vaneckova et al., 2010 [54] | Australia: Sydney (Humid subtropical climate) | Observational—analytical | 1 October–31 March for the period 1993–2004 | Percentage of vegetation; percentage of non-residential (built-up areas); percentage of non-typical dwellings. (Census tract, objective measurement) | Mortality—All-cause mortality. |
| Wang C, et al., 2021 [55] | USA: Maricopa County, Arizona (Desert climate) | Observational—analytical | 2012–2016 | Surface reflectance; Normalized Difference Vegetation Index (NDVI). (Satellite imaging, objective measurement) | Morbidity—Heat-related hospitalisation. |
| Wang Y, et al., 2016 [56] | USA (Semi-arid, Desert, Humid continental, Humid temperate, Humid subtropical, Mediterranean, Tropical, Oceanic, Subarctic, and Polar climate) | Ecological | 1999–2010 | AC; NDVI (Survey and Satellite imaging, objective measurement) | Morbidity—Heatstroke hospitalisation. |
| Williams et al., 2019 [57] | USA: Cambridge (Temperate climate) | Observational—Cross-sectional | 2015 | AC (Survey, objective measurement) | Morbidity—Sleep disruption, galvanic skin response, heart rate. |
| Xu et al., 2013 [58] | Spain: Barcelona (Mediterranean climate) | Time-stratified case-crossover | May–October 1999–2006 | AC; old building; surrounding greenness/tree cover (Satellite imaging and Census tract, objective measurement) | Mortality—All-cause mortality. |
| Zanobetti et al., 2012 [59] | USA (Semi-arid, Desert, Humid continental, Humid temperate, Humid subtropical, Mediterranean, Tropical, Oceanic, Subarctic, and Polar climate) | Cohort | 1985–2006 | Green surface (Satellite imaging, objective measurement) | Mortality—Heat-related mortality. |
| Zuurbier et al., 2021 [60] | Netherlands (Oceanic climate) | Observational—Cross-sectional | 2012 | Type of dwelling; year built; surface area; height; floor location; green area (Survey, objective measurement) | Morbidity—Self-perceived health. |
3.2. Characteristics of Included Studies
3.3. Built Environment Features Associated with Heat-Related Health Outcomes Among Older People
3.3.1. Vegetation and Urban Form
3.3.2. Housing Characteristics
3.3.3. Air Conditioning
3.4. Quality of Evidence Assessment
4. Discussion
5. Conclusions
Supplementary Materials
Author Contributions
Funding
Institutional Review Board Statement
Data Availability Statement
Acknowledgments
Conflicts of Interest
References
- IPCC. Summary for Policymakers. In Climate Change 2021: The Physical Science Basis. Contribution of Working Group I to the Sixth Assessment Report of the Intergovernmental Panel on Climate Change; Intergovernmental Panel on Climate Change: Cambridge, UK; New York, NY, USA, 2021. [Google Scholar]
- United Nations Department of Economic and Social Affairs. World Social Report 2023: Leaving No One Behind in an Ageing World; United Nations: New York, NY, USA, 2023. [Google Scholar]
- United Nations Department of Economic and Social Affairs Population Division. World Population Prospects 2022: Summary of Results 2022. Available online: https://www.un.org/development/desa/pd/sites/www.un.org.development.desa.pd/files/wpp2022_summary_of_results.pdf (accessed on 23 September 2023).
- United Nations Department of Economic and Social Affairs—Population Division. World Population Ageing 2017—Highlights. 2017. Available online: https://digitallibrary.un.org/record/3799351?ln=en&v=pdf (accessed on 12 December 2024).
- Coleman, S. Australia State of the Environment 2016: Built Environment, Independent Report to the Australian Government Minister for the Environment and Energy; Australian Government Department of the Environment and Energy: Canberra, Australia, 2017. [Google Scholar]
- Heaviside, C.; Macintyre, H.; Vardoulakis, S. The Urban Heat Island: Implications for Health in a Changing Environment. Curr. Environ. Health Rep. 2017, 4, 296–305. [Google Scholar] [CrossRef] [PubMed]
- Srinivasan, S.; O’fallon, L.R.; Dearry, A. Creating healthy communities, healthy homes, healthy people: Initiating a research agenda on the built environment and public health. Am. J. Public Health 2003, 93, 1446–1450. [Google Scholar] [CrossRef]
- Cissé, G.; McLeman, R.; Adams, H.; Aldunce, P.; Bowen, K.; Campbell-Lendrum, D.; Clayton, S.; Ebi, K.L.; Hess, J.; Huang, C.; et al. Health, Wellbeing, and the Changing Structure of Communities. Inter-governmental Panel on Climate Change, 2022 In Press. Report No. Available online: https://www.ipcc.ch/report/ar6/wg2/downloads/report/IPCC_AR6_WGII_Chapter07.pdf (accessed on 12 December 2024).
- Kaltsatou, A.; Kenny, G.P.; Flouris, A.D. The impact of heat waves on mortality among the elderly: A mini systematic review. J. Geriatr. Med. Gerontol. 2018, 4, 053. [Google Scholar]
- Havenith, G. Temperature Regulation, Heat Balance and Climatic Stress. In Extreme Weather Events and Public Health Responses; Kirch, W., Bertollini, R., Menne, B., Eds.; Springer: Berlin/Heidelberg, Germany, 2005; pp. 69–80. [Google Scholar]
- Jay, O.; Capon, A.; Berry, P.; Broderick, C.; de Dear, R.; Havenith, G.; Honda, Y.; Kovats, R.S.; Ma, W.; Malik, A.; et al. Reducing the health effects of hot weather and heat extremes: From personal cooling strategies to green cities. Lancet 2021, 398, 709–724. [Google Scholar] [CrossRef]
- Stevenson, M.; Thompson, J.; de Sá, T.H.; Ewing, R.; Mohan, D.; McClure, R.; Roberts, I.; Tiwari, G.; Giles-Corti, B.; Sun, X.; et al. Land use, transport, and population health: Estimating the health benefits of compact cities. Lancet 2016, 388, 2925–2935. [Google Scholar] [CrossRef] [PubMed]
- Lee, K.; Brown, R.D. Effects of Urban Landscape and Sociodemographic Characteristics on Heat-Related Health Using Emergency Medical Service Incidents. Int. J. Environ. Res. Public Health 2022, 19, 1287. [Google Scholar] [CrossRef]
- Vandentorren, S.; Bretin, P.; Zeghnoun, A.; Mandereau-Bruno, L.; Croisier, A.; Cochet, C.; Ribéron, J.; Siberan, I.; Declercq, B.; Ledrans, M. August 2003 heat wave in France: Risk factors for death of elderly people living at home. Eur. J. Public Health 2006, 16, 583–591. [Google Scholar] [CrossRef]
- Ostro, B.; Rauch, S.; Green, R.; Malig, B.; Basu, R. The effects of temperature and use of air conditioning on hospitalizations. Am. J. Epidemiol. 2010, 172, 1053–1061. [Google Scholar] [CrossRef]
- Thomson, H.; Simcock, N.; Bouzarovski, S.; Petrova, S. Energy poverty and indoor cooling: An overlooked issue in Europe. Energy Build. 2019, 196, 21–29. [Google Scholar] [CrossRef]
- Lomas, K.J. Summertime overheating in dwellings in temperate climates. Build. Cities 2021, 2, 487–494. [Google Scholar] [CrossRef]
- Clarke, J.F. Some effects of the urban structure on heat mortality. Environ. Res. 1972, 5, 93–104. [Google Scholar] [CrossRef] [PubMed]
- United Nations Department of Economic and Social Affairs. 68% of the World Population Projected to Live in Urban Areas by 2050, Says UN. 2018. Available online: https://www.un.org/development/desa/en/news/population/2018-revision-of-world-urbanization-prospects.html (accessed on 25 September 2024).
- Australian Bureau of Statistics. Population Projections, Australia. Population Projections. 2018. Available online: https://www.abs.gov.au/statistics/people/population/population-projections-australia/latest-release (accessed on 30 March 2024).
- Australian Institute of Health and Welfare. Older Australians; Australian Institute of Health and Welfare: Canberra, Australia, 2023. [Google Scholar]
- Balbus, J.M.; Malina, C. Identifying vulnerable subpopulations for climate change health effects in the United States. J. Occup. Environ. Med. 2009, 51, 33–37. [Google Scholar] [CrossRef]
- Baquero, M.T.; Forcada, N. Thermal comfort of older people during summer in the continental Mediterranean climate. J. Build. Eng. 2022, 54, 104680. [Google Scholar] [CrossRef]
- World Health Organisation. Connection Series: 3. The UN Decade of Healthy Ageing 2021–2030 in a Climate-Changing World. 14 January 2022. Report No. Available online: https://cdn.who.int/media/docs/default-source/decade-of-healthy-ageing/decade-connection-series-climatechange.pdf?sfvrsn=e926d220_1 (accessed on 12 December 2024).
- Molinsky, J.; Forsyth, A. Climate Change, Aging, and Well-being: How Residential Setting Matters. Hous. Policy Debate 2022, 33, 1029–1054. [Google Scholar] [CrossRef]
- Ritchie, H.; Rosado, P.; Roser, M. Access to Energy 2019. Available online: https://ourworldindata.org/energy-access (accessed on 12 April 2024).
- Boakye, K.; Bovbjerg, M.; Schuna, J.; Branscum, A.; Mat-Nasir, N.; Bahonar, A.; Barbarash, O.; Yusuf, R.; Lopez-Jaramillo, P.; Seron, P.; et al. Perceived built environment characteristics associated with walking and cycling across 355 communities in 21 countries. Cities 2023, 132, 104102. [Google Scholar] [CrossRef]
- Page, M.J.; McKenzie, J.E.; Bossuyt, P.M.; Boutron, I.; Hoffmann, T.C.; Mulrow, C.D.; Shamseer, L.; Tetzlaff, J.M.; Akl, E.A.; Brennan, S.E.; et al. The PRISMA 2020 statement: An updated guideline for reporting systematic reviews. BMJ 2021, 372, n71. [Google Scholar] [CrossRef]
- Organisation for Economic Cooperation and Development. Country Classification 2022—As of 3 August 2022. Available online: https://policycommons.net/artifacts/3823707/classement-des-pays-2022/4629623/ (accessed on 12 December 2024).
- Covidence Systematic Review Software. Melbourne, Australia: Veritas Health Innovation. Available online: www.covidence.org (accessed on 22 February 2023).
- National Institutes of Health. Study Quality Assessment Tools. 2021. Available online: https://www.nhlbi.nih.gov/health-topics/study-quality-assessment-tools (accessed on 25 June 2022).
- Alberini, A.; Gans, W.; Alhassan, M. Individual and Public-Program Adaptation: Coping with Heat Waves in Five Cities in Canada. Int. J. Environ. Res. Public Health 2011, 8, 4679–4701. [Google Scholar] [CrossRef]
- Bélanger, D.; Abdous, B.; Valois, P.; Gosselin, P.; Sidi, E.A.L. A multilevel analysis to explain self-reported adverse health effects and adaptation to urban heat: A cross-sectional survey in the deprived areas of 9 Canadian cities. BMC Public Health 2016, 16, 144. [Google Scholar] [CrossRef]
- Crank, P.J.; O’lenick, C.R.; Baniassadi, A.; Sailor, D.J.; Wilhelmi, O.; Hayden, M. Sociodemographic Determinants of Extreme Heat and Ozone Risk Among Older Adults in 3 Sun Belt Cities. J. Gerontol. Ser. A Biol. Sci. Med. Sci. 2024, 79, glae164. [Google Scholar] [CrossRef]
- Eisenman, D.P.; Wilhalme, H.; Tseng, C.-H.; Chester, M.; English, P.; Pincetl, S.; Fraser, A.; Vangala, S.; Dhaliwal, S.K. Heat Death Associations with the built environment, social vulnerability and their interactions with rising temperature. Health Place 2016, 41, 89–99. [Google Scholar] [CrossRef]
- Fujimoto, M.; Hayashi, K.; Nishiura, H. Possible adaptation measures for climate change in preventing heatstroke among older adults in Japan. Front. Public Health 2023, 11, 1184963. [Google Scholar] [CrossRef]
- Gronlund, C.J.; Berrocal, V.J.; White-Newsome, J.L.; Conlon, K.C.; O’neill, M.S. Vulnerability to extreme heat by socio-demographic characteristics and area green space among the elderly in Michigan, 1990–2007. Environ. Res. 2015, 136, 449–461. [Google Scholar] [CrossRef] [PubMed]
- Gronlund, C.J.; Zanobetti, A.; Wellenius, G.A.; Schwartz, J.D.; O’Neill, M.S. Vulnerability to renal, heat and respiratory hospital-izations during extreme heat among US elderly. Clim. Change 2016, 136, 631–645. [Google Scholar] [CrossRef]
- Guirguis, K.; Basu, R.; Al-Delaimy, W.K.; Benmarhnia, T.; Clemesha, R.E.S.; Corcos, I.; Guzman-Morales, J.; Hailey, B.; Small, I.; Tardy, A.; et al. Heat, disparities, and health outcomes in San Diego County’s diverse climate zones. GeoHealth 2018, 2, 212–223. [Google Scholar] [CrossRef]
- Hansen, A.; Williamson, T.; Pisaniello, D.; Bennetts, H.; van Hoof, J.; Martins, L.A.; Visvanathan, R.; Zuo, J.; Soebarto, V. The Thermal Environment of Housing and Its Implications for the Health of Older People in South Australia: A Mixed-Methods Study. Atmosphere 2022, 13, 96. [Google Scholar] [CrossRef]
- Harlan, S.L.; Declet-Barreto, J.H.; Stefanov, W.L.; Petitti, D.B. Neighborhood effects on heat deaths: Social and environmental predictors of vulnerability in Maricopa County, Arizona. Environ. Health Perspect. 2013, 121, 197–204. [Google Scholar] [CrossRef] [PubMed]
- Heo, S.; Chen, C.; Kim, H.; Sabath, B.; Dominici, F.; Warren, J.L.; Di, Q.; Schwartz, J.; Bell, M.L. Temporal changes in associations between high temperature and hospitalizations by greenspace: Analysis in the Medicare population in 40 U.S. northeast counties. Environ. Int. 2021, 156, 106737. [Google Scholar] [CrossRef] [PubMed]
- Jang, J.; Lee, W.; Choi, M.; Kang, C.; Kim, H. Roles of urban heat anomaly and land-use/land-cover on the heat-related mortality in the national capital region of South Korea: A multi-districts time-series study. Environ. Int. 2020, 145, 106127. [Google Scholar] [CrossRef]
- Kim, Y.-O.; Lee, W.; Kim, H.; Cho, Y. Social isolation and vulnerability to heatwave-related mortality in the urban elderly population: A time-series multi-community study in Korea. Environ. Int. 2020, 142, 105868. [Google Scholar] [CrossRef]
- Rosenthal, J.K.; Kinney, P.L.; Metzger, K.B. Intra-urban vulnerability to heat-related mortality in New York City, 1997–2006. Health Place 2014, 30, 45–60. [Google Scholar] [CrossRef]
- Larrieu, S.; Carcaillon, L.; Lefranc, A.; Helmer, C.; Dartigues, J.-F.; Tavernier, B.; Ledrans, M.; Filleul, L. Factors associated with morbidity during the 2003 heat wave in two population-based cohorts of elderly subjects: PAQUID and Three City. Eur. J. Epidemiol. 2008, 23, 295–302. [Google Scholar] [CrossRef]
- López-Bueno, J.; Díaz, J.; Sánchez-Guevara, C.; Sánchez-Martínez, G.; Franco, M.; Gullón, P.; Peiró, M.N.; Valero, I.; Linares, C. The impact of heat waves on daily mortality in districts in Madrid: The effect of sociodemographic factors. Environ. Res. 2020, 190, 109993. [Google Scholar] [CrossRef] [PubMed]
- Madrigano, J.; Ito, K.; Johnson, S.; Kinney, P.L.; Matte, T. A case-only study of vulnerability to heat wave–related mortality in New York City (2000–2011). Environ. Health Perspect. 2015, 123, 672–678. [Google Scholar] [CrossRef]
- Naughton, M.P.; Henderson, A.; Mirabelli, M.C.; Kaiser, R.; Wilhelm, J.L.; Kieszak, S.M.; Rubin, C.H.; McGeehin, M.A. Heat-related mortality during a 1999 heat wave in Chicago. Am. J. Prev. Med. 2002, 22, 221–227. [Google Scholar] [CrossRef] [PubMed]
- Schuster, C.; Honold, J.; Lauf, S.; Lakes, T. Urban heat stress: Novel survey suggests health and fitness as future avenue for research and adaptation strategies. Environ. Res. Lett. 2017, 12, 044021. [Google Scholar] [CrossRef]
- Seong, K.; Jiao, J.; Mandalapu, A. Evaluating the effects of heat vulnerability on heat-related emergency medical service incidents: Lessons from Austin, Texas. Environ. Plan. B Urban Anal. City Sci. 2022, 50, 776–795. [Google Scholar] [CrossRef]
- Son, J.-Y.; Lane, K.J.; Lee, J.-T.; Bell, M.L. Urban vegetation and heat-related mortality in Seoul, Korea. Environ. Res. 2016, 151, 728–733. [Google Scholar] [CrossRef]
- Uejio, C.K.; Wilhelmi, O.V.; Golden, J.S.; Mills, D.M.; Gulino, S.P.; Samenow, J.P. Intra-urban societal vulnerability to extreme heat: The role of heat exposure and the built environment, socioeconomics, and neighborhood stability. Health Place 2011, 17, 498–507. [Google Scholar] [CrossRef]
- Vaneckova, P.; Beggs, P.J.; Jacobson, C.R. Spatial analysis of heat-related mortality among the elderly between 1993 and 2004 in Sydney, Australia. Soc. Sci. Med. 2010, 70, 293–304. [Google Scholar] [CrossRef]
- Wang, C.; Solís, P.; Villa, L.; Khare, N.; Wentz, E.A.; Gettel, A. Spatial Modeling and Analysis of Heat-Related Morbidity in Maricopa County, Arizona. J. Urban Health-Bull. N. Y. Acad. Med. 2021, 98, 344–361. [Google Scholar] [CrossRef]
- Wang, Y.; Bobb, J.F.; Papi, B.; Wang, Y.; Kosheleva, A.; Di, Q.; Schwartz, J.D.; Dominici, F. Heat stroke admissions during heat waves in 1,916 US counties for the period from 1999 to 2010 and their effect modifiers. Environ. Health 2016, 15, 83. [Google Scholar] [CrossRef] [PubMed]
- Williams, A.A.; Spengler, J.D.; Catalano, P.; Allen, J.G.; Cedeno-Laurent, J.G. Building vulnerability in a changing climate: Indoor temperature exposures and health outcomes in older adults living in public housing during an extreme heat event in Cambridge, MA. Int. J. Environ. Res. Public Health 2019, 16, 2373. [Google Scholar] [CrossRef] [PubMed]
- Xu, Y.; Dadvand, P.; Barrera-Gómez, J.; Sartini, C.; Marí-Dell’Olmo, M.; Borrell, C.; Medina-Ramón, M.; Sunyer, J.; Basagaña, X. Differences on the effect of heat waves on mortality by sociodemographic and urban landscape characteristics. J. Epidemiol. Community Health 2013, 67, 519–525. [Google Scholar] [CrossRef]
- Zanobetti, A.; O’Neill, M.S.; Gronlund, C.J.; Schwartz, J.D. Summer temperature variability and long-term survival among elderly people with chronic disease. Proc. Natl. Acad. Sci. USA 2012, 109, 6608–6613. [Google Scholar] [CrossRef] [PubMed]
- Zuurbier, M.; van Loenhout, J.A.F.; le Grand, A.; Greven, F.; Duijm, F.; Hoek, G. Street temperature and building characteristics as determinants of indoor heat exposure. Sci. Total. Environ. 2021, 766, 144376. [Google Scholar] [CrossRef]
- Lin, J.; Zhang, H.; Chen, M.; Wang, Q. Socioeconomic disparities in cooling and warming efficiencies of urban vegetation and impervious surfaces. Sustain. Cities Soc. 2023, 92, 104464. [Google Scholar] [CrossRef]
- Meili, N.; Manoli, G.; Burlando, P.; Carmeliet, J.; Chow, W.T.; Coutts, A.M.; Roth, M.; Velasco, E.; Vivoni, E.R.; Fatichi, S. Tree effects on urban microclimate: Diurnal, seasonal, and climatic temperature differences explained by separating radiation, evapotranspiration, and roughness effects. Urban For. Urban Green. 2021, 58, 126970. [Google Scholar] [CrossRef]
- Buchin, O.; Hoelscher, M.-T.; Meier, F.; Nehls, T.; Ziegler, F. Evaluation of the health-risk reduction potential of countermeasures to urban heat islands. Energy Build. 2016, 114, 27–37. [Google Scholar] [CrossRef]
- Kearl, Z.; Vogel, J. Urban extreme heat, climate change, and saving lives: Lessons from Washington state. Urban Clim. 2023, 47, 101392. [Google Scholar] [CrossRef]
- Baldwin, C.; Matthews, T.; Byrne, J. Planning for Older People in a Rapidly Warming and Ageing World: The Role of Urban Greening. Urban Policy Res. 2020, 38, 199–212. [Google Scholar] [CrossRef]
- Wujeska-Klause, A.; Pfautsch, S. The Best Urban Trees for Daytime Cooling Leave Nights Slightly Warmer. Forests 2020, 11, 945. [Google Scholar] [CrossRef]
- Rötzer, T.; Moser-Reischl, A.; Rahman, M.; Hartmann, C.; Paeth, H.; Pauleit, S.; Pretzsch, H. Urban tree growth and ecosystem services under extreme drought. Agric. For. Meteorol. 2021, 308, 108532. [Google Scholar] [CrossRef]
- Stonem, B.; Hess, J.J.; Frumkin, H. Urban form and extreme heat events: Are sprawling cities more vulnerable to climate change than compact cities? Environ. Health Perspect. 2010, 118, 1425–1428. [Google Scholar] [CrossRef] [PubMed]
- Vardoulakis, S.; Dimitroulopoulou, C.; Thornes, J.; Lai, K.-M.; Taylor, J.; Myers, I.; Heaviside, C.; Mavrogianni, A.; Shrubsole, C.; Chalabi, Z.; et al. Impact of climate change on the domestic indoor environment and associated health risks in the UK. Environ. Int. 2015, 85, 299–313. [Google Scholar] [CrossRef]
- Porritt, S.M.; Shao, L.; Cropper, P.C.; Goodier, C.I. (Eds.) Occupancy patterns and their effect on interventions to reduce overheating in dwellings during heat waves Authors. In Proceedings of the Conference: Adapting to Change: New Thinking on Comfort, WINDSOR 2010, Windsor, UK, 9–11 April 2010. [Google Scholar]
- Lomas, K.J.; Kane, T. Summertime temperatures and thermal comfort in UK homes. Build. Res. Inf. 2013, 41, 259–280. [Google Scholar] [CrossRef]
- Porritt, S.M.; Cropper, P.C.; Shao, L.; Goodier, C.I. Heat wave adaptations for UK dwellings and development of a retrofit toolkit. Int. J. Disaster Resil. Built Environ. 2013, 4, 269–286. [Google Scholar] [CrossRef]
- Taylor, J.; Wilkinson, P.; Davies, M.; Armstrong, B.; Chalabi, Z.; Mavrogianni, A.; Symonds, P.; Oikonomou, E.; Bohnenstengel, S.I. Mapping the effects of urban heat island, housing, and age on excess heat-related mortality in London. Urban Clim. 2015, 14, 517–528. [Google Scholar] [CrossRef]
- Li, X.; Taylor, J.; Symonds, P. Indoor overheating and mitigation of converted lofts in London, UK. Build. Serv. Eng. Res. Technol. 2019, 40, 409–425. [Google Scholar] [CrossRef]
- Taylor, J.; Symonds, P.; Wilkinson, P.; Heaviside, C.; Macintyre, H.; Davies, M.; Mavrogianni, A.; Hutchinson, E. Estimating the Influence of Housing Energy Efficiency and Overheating Adaptations on Heat-Related Mortality in the West Midlands, UK. Atmosphere 2018, 9, 190. [Google Scholar] [CrossRef]
- Salamanca, F.; Georgescu, M.; Mahalov, A.; Moustaoui, M.; Wang, M. Anthropogenic heating of the urban environment due to air conditioning. J. Geophys. Res. Atmos. 2014, 119, 5949–5965. [Google Scholar] [CrossRef]
- Ebi, K.L.; Capon, A.; Berry, P.; Broderick, C.; de Dear, R.; Havenith, G.; Honda, Y.; Kovats, R.S.; Ma, W.; Malik, A.; et al. Hot weather and heat extremes: Health risks. Lancet 2021, 398, 698–708. [Google Scholar] [CrossRef] [PubMed]
| Built Environment Feature | Number of Studies | Main Findings |
|---|---|---|
| Vegetation and Urban Form (Surfaces, UHI, walkability to public cooling space) | 22 |
|
| Housing Characteristics—type, age, fabric, thermal properties, condition | 16 |
|
| Air conditioning (AC) | 17 |
|
Disclaimer/Publisher’s Note: The statements, opinions and data contained in all publications are solely those of the individual author(s) and contributor(s) and not of MDPI and/or the editor(s). MDPI and/or the editor(s) disclaim responsibility for any injury to people or property resulting from any ideas, methods, instructions or products referred to in the content. |
© 2025 by the authors. Licensee MDPI, Basel, Switzerland. This article is an open access article distributed under the terms and conditions of the Creative Commons Attribution (CC BY) license (https://creativecommons.org/licenses/by/4.0/).
Share and Cite
Strickland, S.; Tong, M. What Are the Key Built Environment Features Associated with Heat-Related Health Risks Among Older People in High Income Countries? Green Health 2025, 1, 2. https://doi.org/10.3390/greenhealth1010002
Strickland S, Tong M. What Are the Key Built Environment Features Associated with Heat-Related Health Risks Among Older People in High Income Countries? Green Health. 2025; 1(1):2. https://doi.org/10.3390/greenhealth1010002
Chicago/Turabian StyleStrickland, Susan, and Michael Tong. 2025. "What Are the Key Built Environment Features Associated with Heat-Related Health Risks Among Older People in High Income Countries?" Green Health 1, no. 1: 2. https://doi.org/10.3390/greenhealth1010002
APA StyleStrickland, S., & Tong, M. (2025). What Are the Key Built Environment Features Associated with Heat-Related Health Risks Among Older People in High Income Countries? Green Health, 1(1), 2. https://doi.org/10.3390/greenhealth1010002