Proceeding Paper

Assessing the Urban Heat Island (UHI) Effect Using Land Surface Temperature (LST) and Normalized Difference Built-Up Index (NDBI): A Case Study on Paphos, Cyprus †

by
Christodoulos Dimitriou
1,2,*,
Silas Michaelides
1,
Kyriacos Themistocleous
1,2,
Diofantos G. Hadjimitsis
1,2,
George Papadavid
3,
Ioannis Gitas
4 and
Nicholas Kyriakides
1,2
1
Eratosthenes Center of Excellence, Limassol 3012, Cyprus
2
Department of Civil Engineering and Geomatics, Cyprus University of Technology, Limassol 3036, Cyprus
3
Agricultural Research Institute, Ministry of Agriculture, Rural Development and Environment, Nicosia 1516, Cyprus
4
Faculty of Agriculture, Forestry and Natural Environment, Aristotle University of Thessaloniki, 541 24 Thessaloniki, Greece
*
Author to whom correspondence should be addressed.
Presented at the 17th International Conference on Meteorology, Climatology, and Atmospheric Physics—COMECAP 2025, Nicosia, Cyprus, 29 September–1 October 2025.
Environ. Earth Sci. Proc. 2025, 35(1), 65; https://doi.org/10.3390/eesp2025035065
Published: 6 October 2025

Abstract

The Urban Heat Island (UHI) effect is responsible for increased urban temperatures compared to rural areas due to heat-absorbing materials like concrete and asphalt, worsening climate change impacts and creating thermal discomfort for citizens. Limited green spaces reduce natural cooling, increasing health risks. This study examines UHI in Paphos (2015–2024) during significant infrastructure development, using Landsat-9 data to analyze Land Surface Temperature (LST), urban growth (NDBI), and vegetation (NDVI). The results reveal how development has affected the microclimate of Paphos compared with the limitation of green spaces through time series. This study also highlights remote sensing’s effectiveness in assessing UHIs.

1. Introduction

1.1. Remote Sensing and Urbanization

Urban expansion and its environmental consequences have become critical areas of research in the context of global climate change and rapid urbanization [1,2,3]. This study focuses on Paphos, Cyprus, a city that, in recent years, has experienced significant developmental changes due to tourism, infrastructure growth, and shifting land-use patterns. Over the decade spanning 2015 to 2024, Paphos underwent notable transformations in its built environment, affecting green coverage and thus thermal distribution in the city. Understanding these changes is essential for sustainable urban planning and mitigating efforts against climate change and the Urban Heat Island (UHI) effect. The primary objective of this research is to assess the spatial and temporal development of built-up areas, vegetation cover, and Land Surface Temperature (LST) in Paphos using remote sensing techniques. By leveraging satellite-derived indices, namely, the Normalized Difference Built-Up Index (NDBI), Normalized Difference Vegetation Index (NDVI), and Land Surface Temperature (LST), this study evaluates the interplay between urbanization structures, green spaces, and thermal distribution. These indices provide valuable insights into how urban growth influences microclimatic conditions, particularly in a region vulnerable to climate change and rising temperatures [4,5,6,7,8,9]. Remote sensing offers a powerful and cost-effective tool for monitoring urban dynamics over time [10]. The use of multispectral satellite imagery enables consistent, high-resolution analysis of land cover changes and thermal patterns. Furthermore, this research contributes to the broader discourse on sustainable urban development by highlighting the environmental impacts of building expansion and the importance of preserving or enriching green infrastructure. Given the increasing pressures of urbanization and climate variability, this study not only provides a localized assessment of the UHI effect in Paphos but also aligns with global efforts to create resilient, livable cities. The findings can aid policymakers, urban planners, and environmental researchers in developing strategies that balance urban growth with ecological preservation.

1.2. Urban Expansion

Paphos is a coastal city on the western side of Cyprus, as shown in Figure 1, which is characterized by its hilly terrain and Mediterranean climate. The city benefits from a cooling sea breeze that flows inland from the west, moderating temperatures along the coastal areas. In contrast, the northeastern sectors, situated at higher elevations, experience improved thermal comfort due to milder air currents and natural ventilation. However, the urban core and downtown districts face elevated humidity and temperature levels during the summer months, exacerbated by dense urban development and limited ventilation.
Administratively, the Municipality of Paphos is organized into five districts, each contributing to the city’s diverse urban and functional landscape. In recent years, Paphos has undergone extensive urban infrastructure development, with modern infrastructure projects including upgraded road networks, new public squares, green spaces, and mixed-use residential and commercial developments. Residential development expansion driven by private sector investment has been evident throughout Paphos in recent years. This growth pattern is closely tied to the city’s tourism industry, which continues to demonstrate strong economic potential and serves as a key driver for real estate development. The private sector’s focus on residential construction reflects both the increasing demand for tourist accommodation and the growing appeal of Paphos for international buyers and seasonal visitors. This comprehensive development has fundamentally transformed the city’s infrastructure and public spaces.
As a premier tourist destination, Paphos experiences a peak visitor season from April to November. The seasonal influx significantly intensifies urban activity, particularly in the downtown core and waterfront zones, drawing travellers to its UNESCO-listed archeological heritage and Mediterranean landscapes. However, this coincides with the summer’s peak thermal stress. The city centre often faces stifling heat and high humidity, exacerbating outdoor discomfort, while the areas located closer to the sea suffer from high levels of humidity, intensifying the uncomfortable thermal conditions during the summer.

2. Methodology

The methodology used in this research was focused on analyzing the relationship between urban temperature dynamics and spectral indices over a ten-year period (2015–2024). To achieve this, three key indices were utilized: the Normalized Difference Built-Up Index (NDBI), the Normalized Difference Vegetation Index (NDVI), and the Land Surface Temperature (LST). The NDBI applied to quantify urban expansion and built-up density, while the NDVI served as an indicator of vegetation health and green cover distribution. LST data was derived to assess thermal variations across the study area. By integrating these indices, the study aimed to evaluate how changes in urban infrastructure and vegetation influence surface temperature trends over time. The analysis was conducted using Landsat-8 satellite imagery, with a time series from every July, resampled from 100 m to 30 m resolution. Image processing and index calculations were performed using remote sensing software (ArcGIS Pro 3.5.3).

2.1. Normalized Difference Built-Up Index (NDBI)

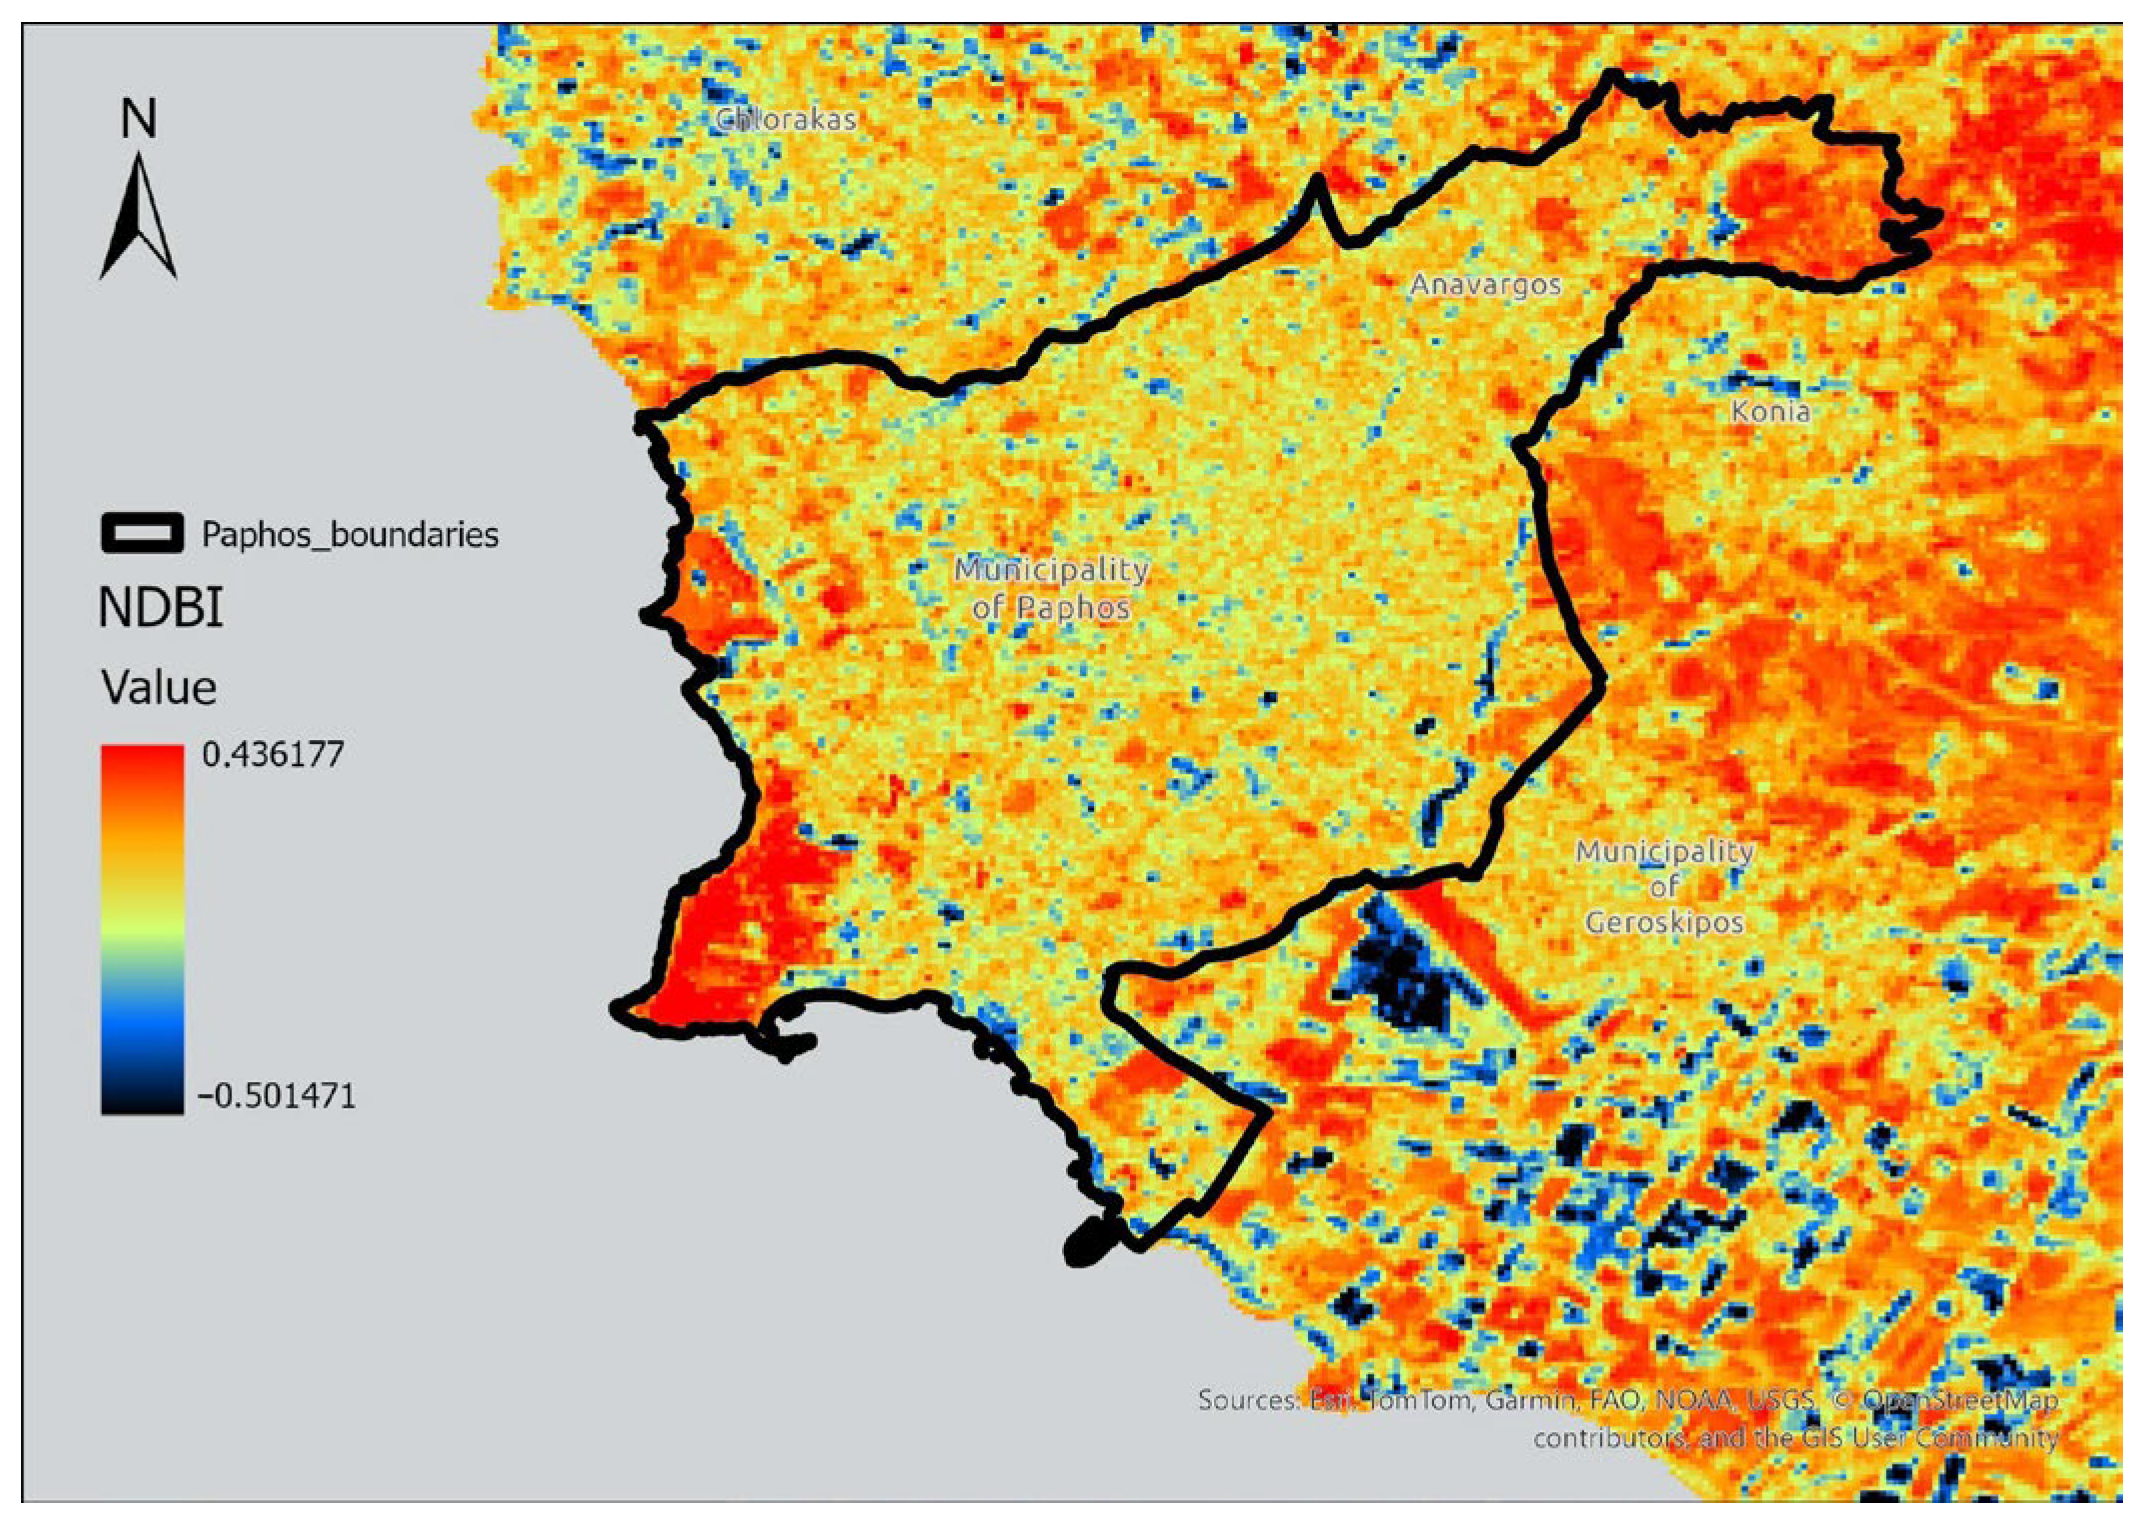
The Normalized Difference Built-Up Index (NDBI) is a remote sensing index used to identify and map built-up areas, particularly urban areas, from satellite imagery, as shown in Figure 2. It is calculated by using the ratio of shortwave infrared (SWIR) and near-infrared (NIR) bands, which highlights areas where SWIR reflectance is higher than NIR. NDBI values range from −1 to 1, with higher values indicating a greater density of built-up areas [11,12]:
N D B I = S W I R + N I R S W I R N I R
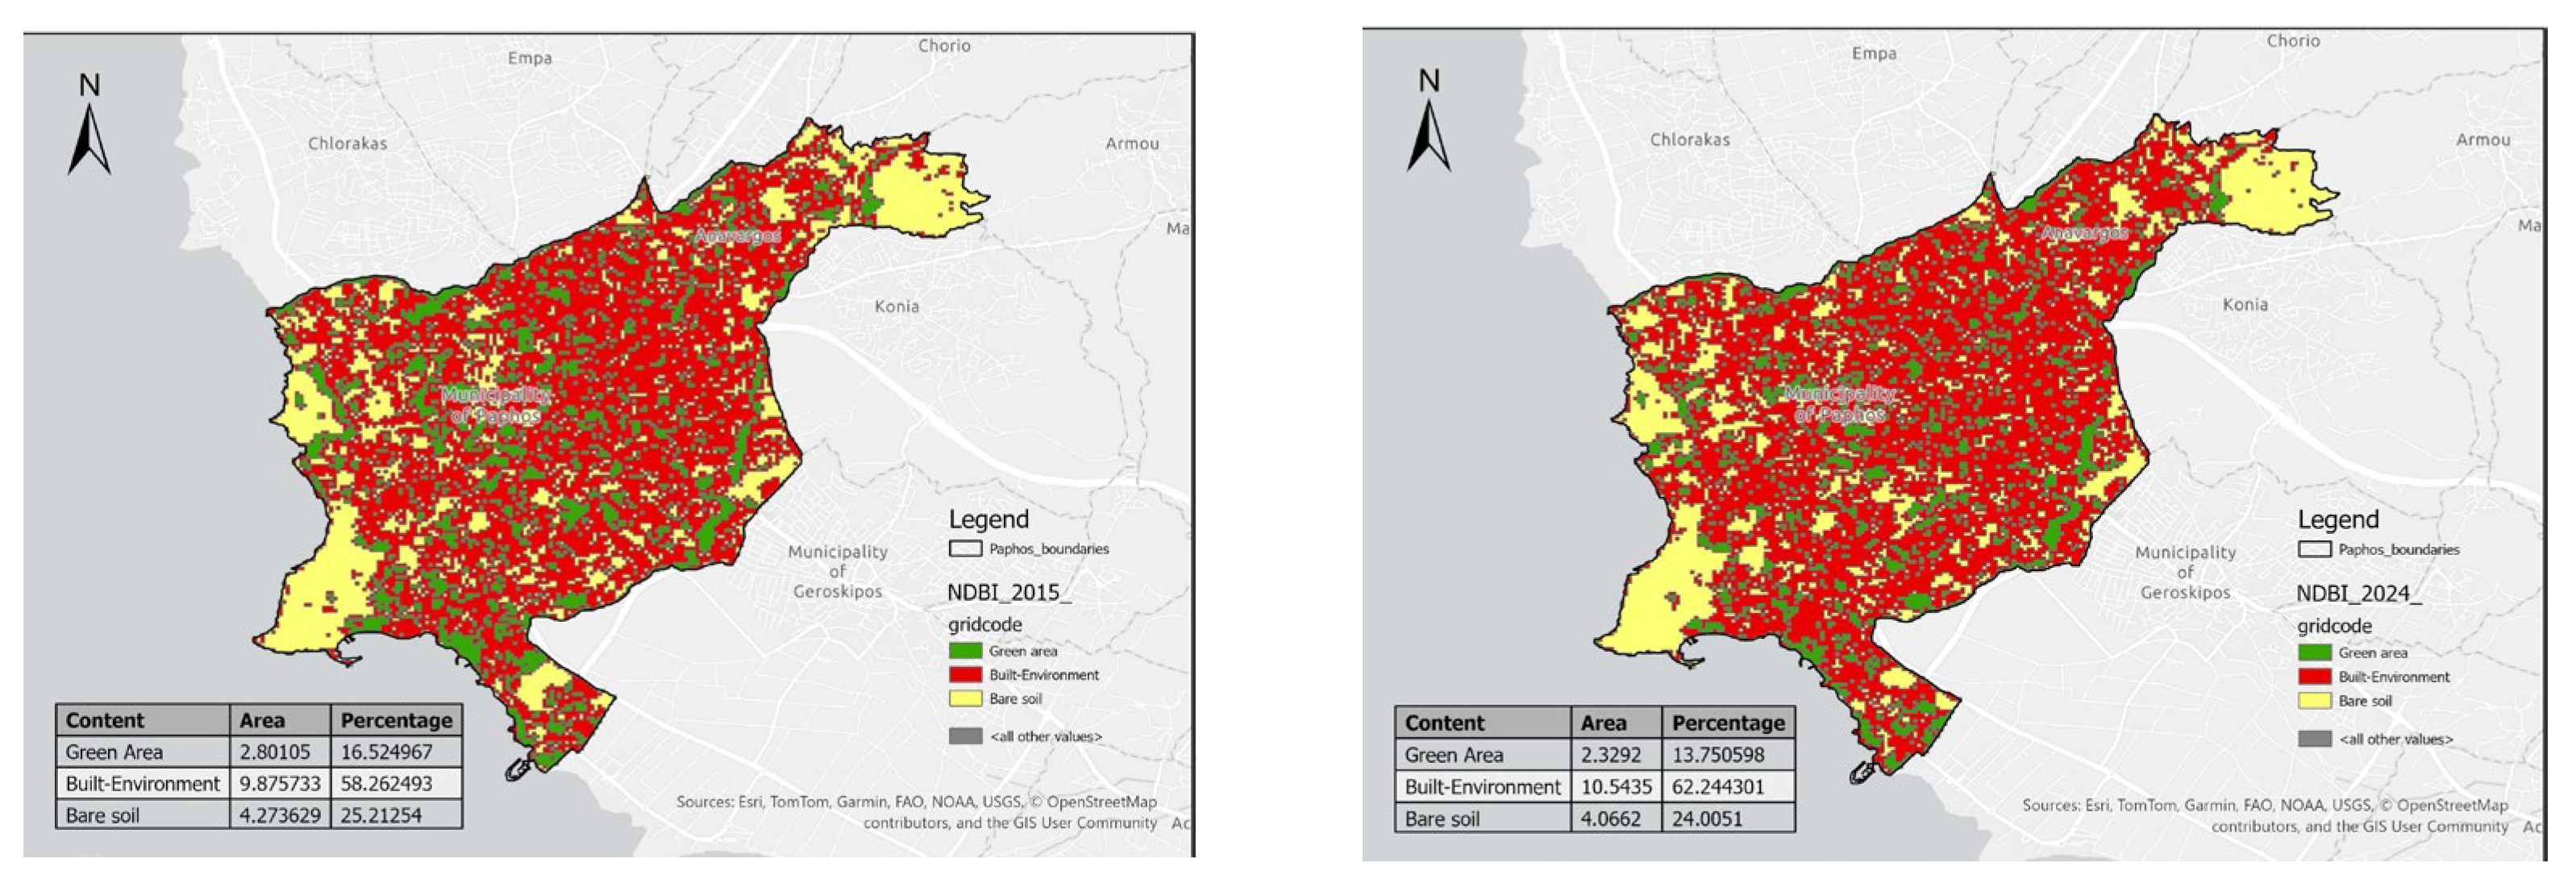
The range set up for values to assess the NDBI classification was −0.26 to −0.026 for green areas, −0.025 to 0.037 for the built environment, and 0.038 to +1 for bare soil. As observed in Figure 3, for the decade from 2015 to 2024, the relationship between green areas and the built environment was inversely proportional. Since 2015, green spaces have decreased by 2.77%, declining from 16.52% to 13.75%, while the built-up area of the city has increased by 3.98%, rising from 58.26% to 62.24%. It is worth noting that the remaining 1.21% reduction corresponds to bare soil.

2.2. Normalized Difference Vegetation Index (NDVI)

The NDVI is a widely used remote sensing index that assesses vegetation health and density by measuring the difference between near-infrared (NIR) and red light reflectance:
N D V I = N I R + R e d N I R R e d
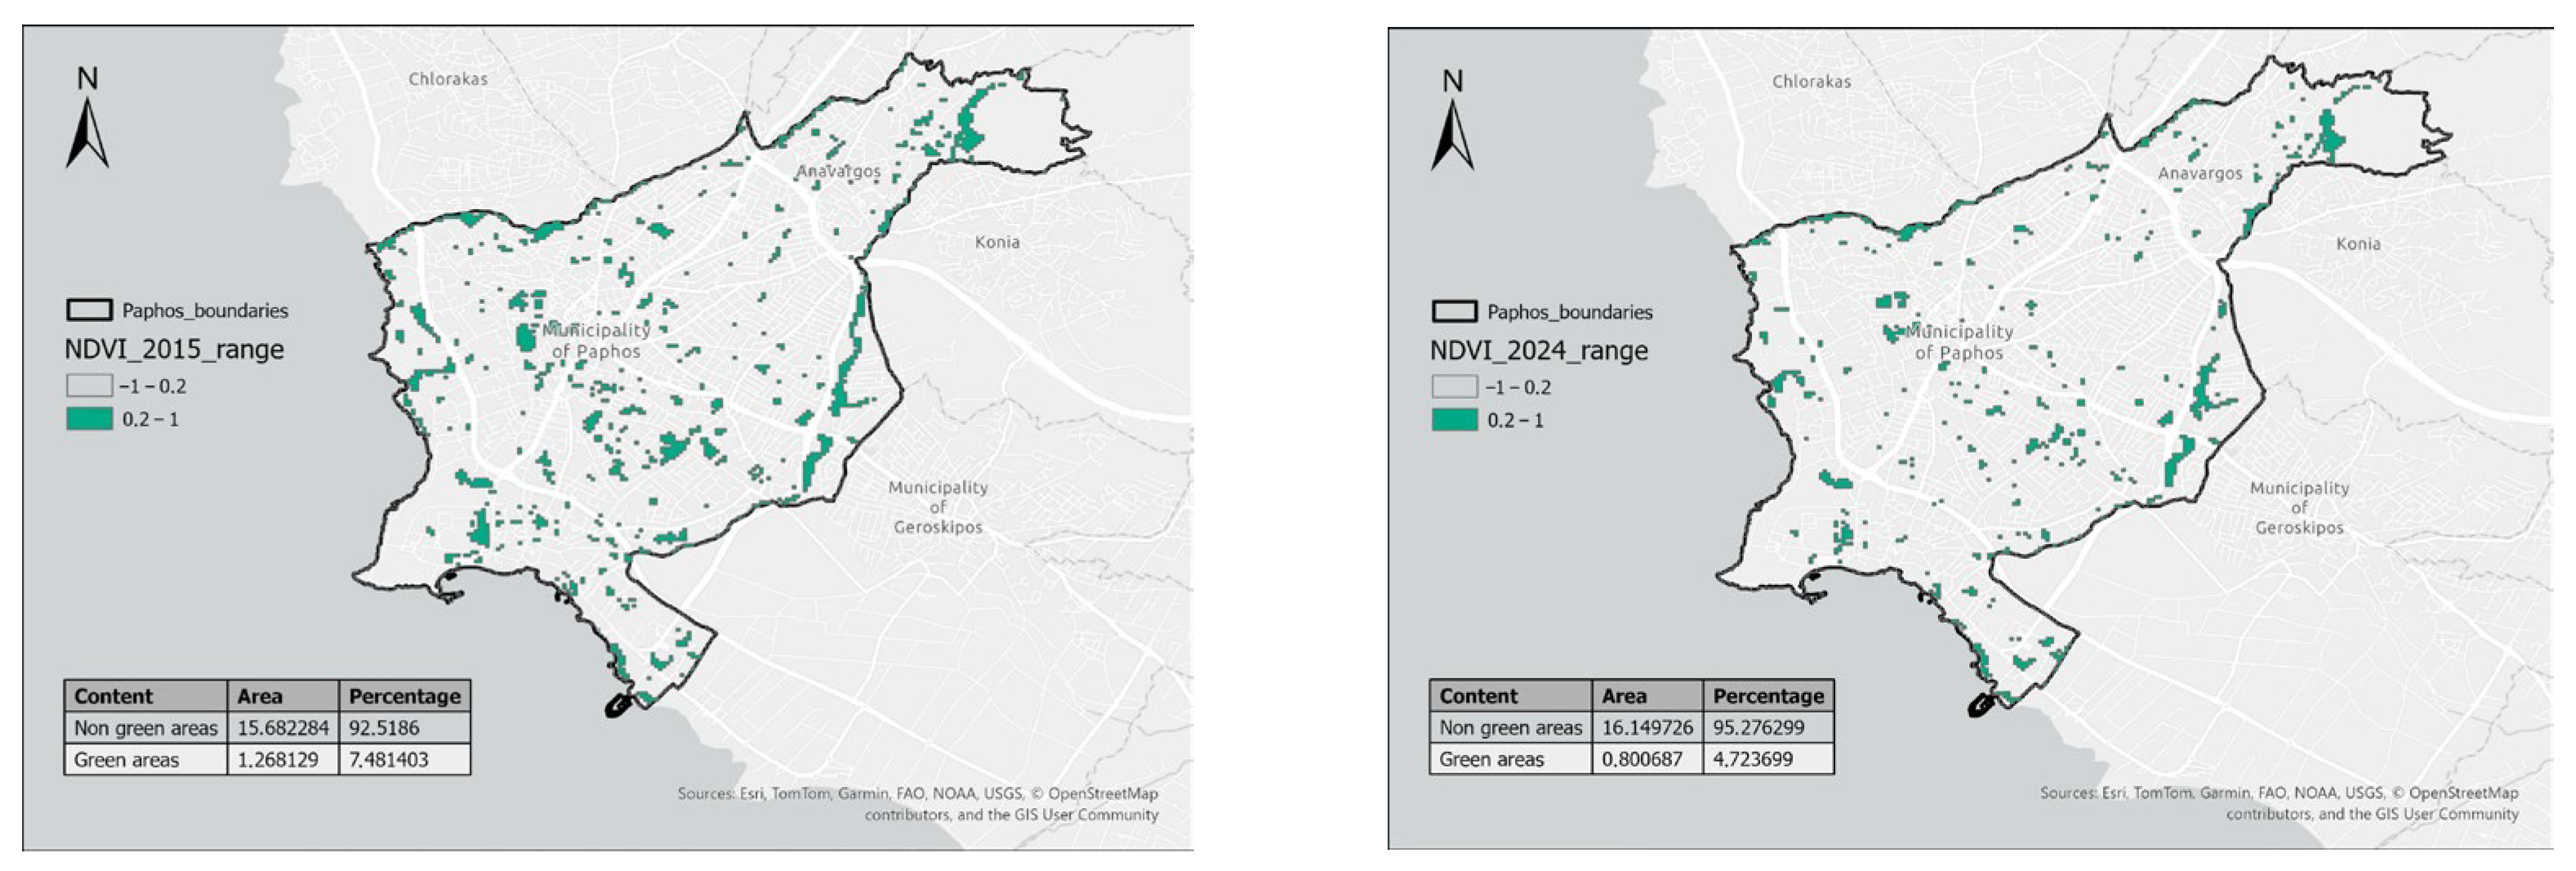
For this purpose, the NDVI was used to cross-validate the results from the NDBI. As can be seen in Figure 4, in 2015, the non-green areas dominated 92.51% of the city, while 7.48% was represented by green areas. In 2024, the green spaces decreased to 4.72%, and the non-green areas increased to 95.27%. The 2.76% reduction in green spaces corroborates the results from the use of the NDBI.

2.3. Data and Methodology

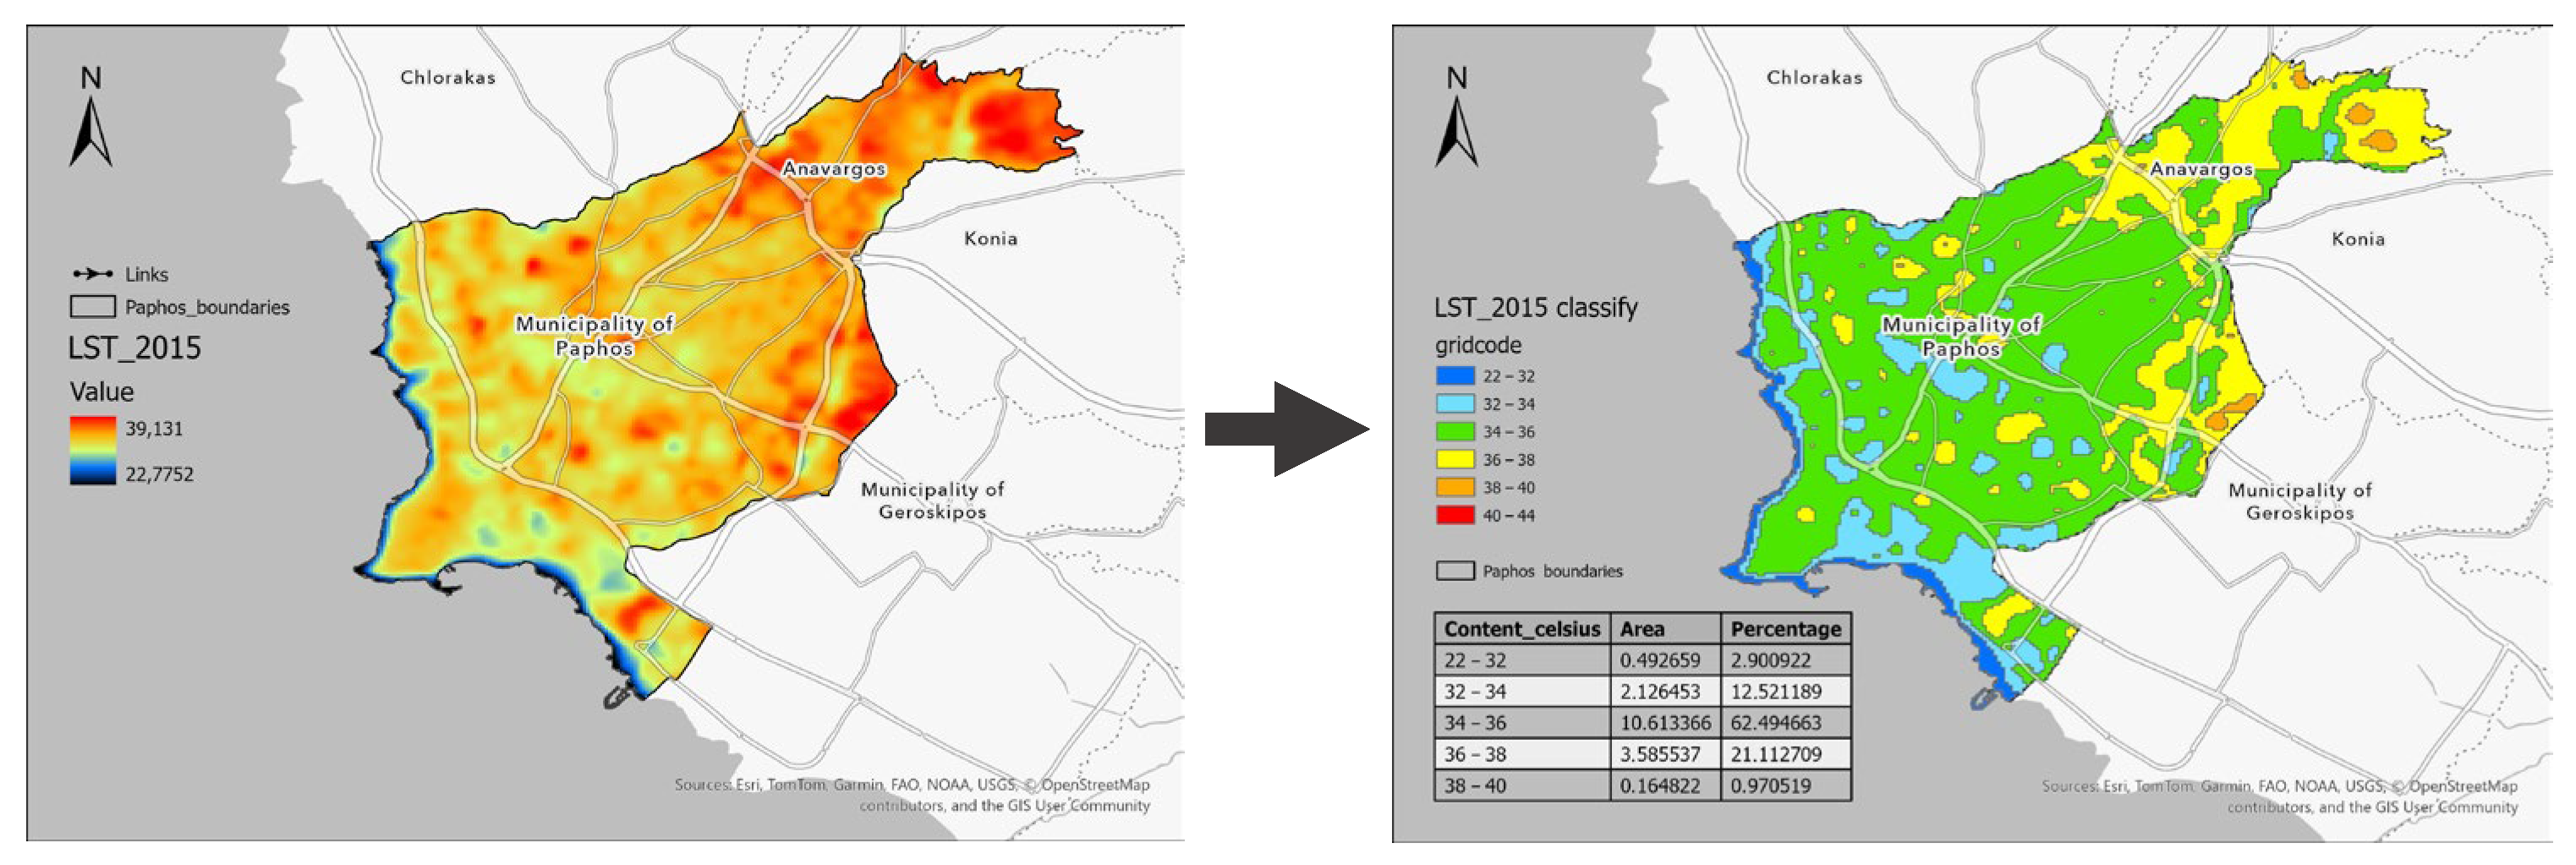
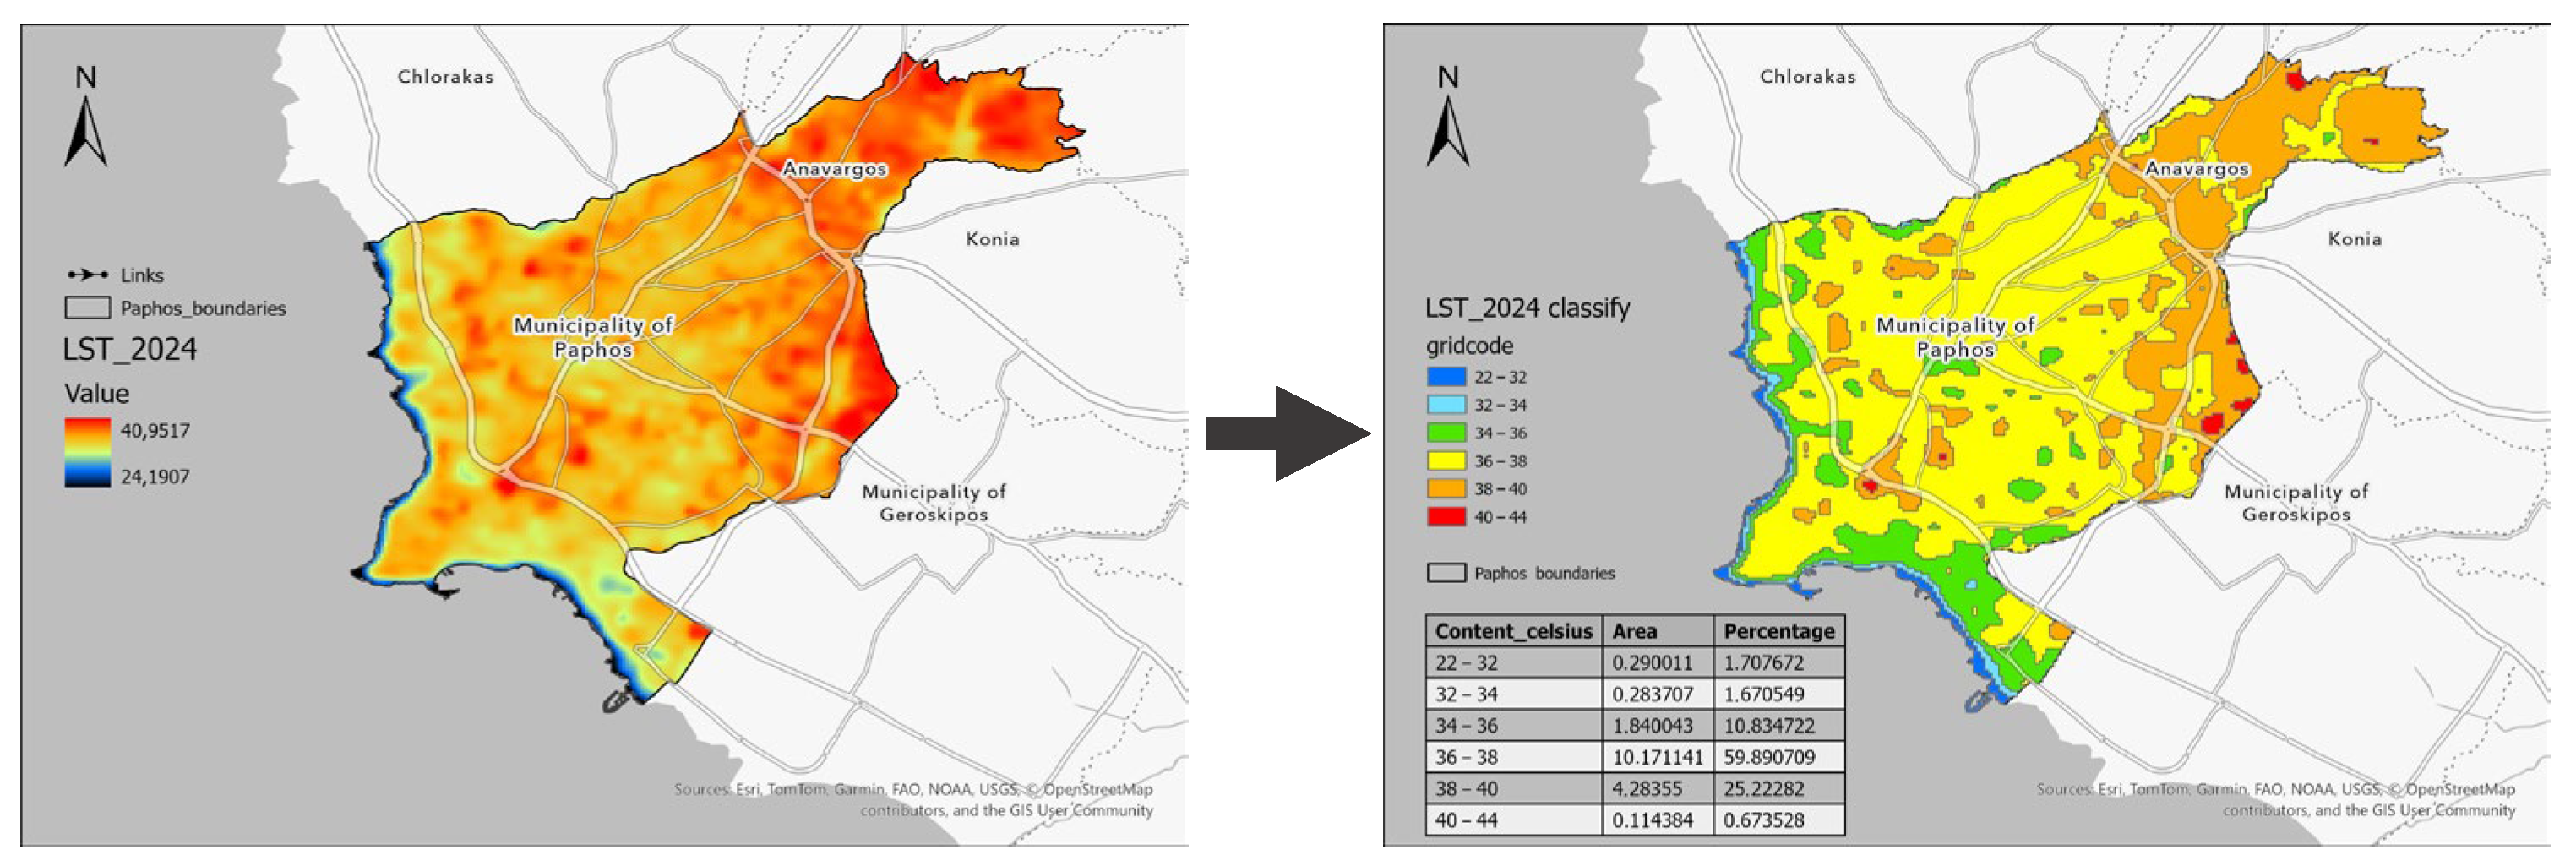
Taking the results from the NDBI and NDVI, temperature distributions were calculated and analyzed from Landsat-8 OLI/TIRS C2 L1 data. The TIRS (Thermal Infrared Sensor) has the ability to measure the energy that is radiated from materials on the Earth’s surface using band 10 TIRS 1 (10.6–11.19 µm) 100 m and Band 11 TIRS 2 (11.5–12.51 µm) 100 m. Landsat collection 2, Level 1 data were utilized for this research. The methodology process to acquire visual presentation of temperature fluctuations follows the calculation of the top-of-atmosphere spectral radiance (TOA), the conversion of TOA to brightness temperature (BT), the calculation of the NDVI, the proportion of vegetation (Pv) and emissivity (ε), and finally the Land Surface Temperature (LST). A classification approach was conducted for this study to analyze the behaviour of temperature fluctuations in the city [13]. The LST images were classified in temperature ranges: 22–32 °C, 32–34 °C, 34–36 °C, 36–38 °C, 38–40 °C, and 40–44 °C, as indicated in Figure 5 and Figure 6 for 2015 and 2024, respectively. The analysis refers to the month of July for each year from 2015 to 2024, which is normally the hottest month of the year and includes the most thermally uncomfortable days in the country.
LST = (BT/(1 + (0.00115 × BT/1.4388) × ln(ε)))

3. Results

As shown in Table 1, in 2024, areas with relatively low temperatures have diminished, while higher-temperature zones have become more prevalent, compared to 2015. The land surface area with temperatures between 22 and 32 °C decreased slightly from 2.9% to 1.70%. Meanwhile, the distributions of 32–34 °C and 34–36 °C experienced a sharp decline, dropping from 12.52% and 62.49% in 2015 to 1.67% and 10.83% in 2024, respectively.
A critical increase was observed in the 36–38 °C and 38–40 °C ranges, which rose from 21.11% and 0.97% in 2015 to 59.89% and 25.22% in 2024, respectively. Notably, temperature fluctuations between 40 and 44 °C, which were absent in 2015, accounted for 0.67% of the land surface in 2024.

4. Conclusions

The findings of this study highlight significant trends in urban development, vegetation cover, and thermal patterns in Paphos, Cyprus, between 2015 and 2024. The NDVI demonstrated a notable decline in green spaces by 2024, marking it as the year with the least vegetation cover. This inverse relationship between urbanization and vegetation loss underscores the environmental impact of rapid urban expansion [14].
Furthermore, in the Land Surface Temperature (LST) analysis, 2017 and 2018 were identified as the years with the highest thermal intensity, suggesting enhanced heat stress during these years. The correlation between the NDBI and NDVI further supports the observed trend. As built-up areas increased (particularly in 2024), vegetation cover diminished, reinforcing the hypothesis that urban densification contributes to a reduction in green spaces [15].
These findings have important implications for urban planning and climate resilience strategies in Paphos but also in other Mediterranean cities with similar climatic conditions. The decline in vegetation alongside increasing built-up density may exacerbate the Urban Heat Island (UHI) effect, leading to higher temperatures and reduced thermal comfort for residents [16]. To mitigate these effects, policymakers should consider integrating green infrastructure, enforcing sustainable land-use policies, and promoting urban greening initiatives to balance development with environmental preservation.

Author Contributions

Conceptualization, C.D. and D.G.H.; methodology, C.D. and K.T.; software, C.D. and K.T.; validation, S.M., D.G.H. and K.T.; formal analysis, C.D. and S.M.; investigation, G.P.; resources, C.D.; data curation, C.D. and K.T.; writing—original draft preparation, C.D.; writing—review and editing, S.M.; visualization, G.P.; supervision, D.G.H., S.M., I.G. and N.K.; project administration, D.G.H.; funding acquisition, D.G.H. All authors have read and agreed to the published version of the manuscript.

Funding

This research was funded by EXCELSIOR project. The ‘EXCELSIOR’ project has received funding from the European Union’s Horizon 2020 research and innovation programme under Grant Agreement No. 857510, from the Government of the Republic of Cyprus through the Directorate General for the European Programmes, Coordination and Development and the Cyprus University of Technology.

Institutional Review Board Statement

Not applicable.

Informed Consent Statement

Not applicable.

Data Availability Statement

Data is available from the authors upon reasonable request.

Acknowledgments

The authors acknowledge the ‘EXCELSIOR’: ERATOSTHENES: Excellence Research Centre for Earth Surveillance and Space-Based Monitoring of the Environment H2020 Widespread Teaming project (www.excelsior2020.eu, accessed on 12 August 2024).

Conflicts of Interest

The authors declare no conflict of interest.

References

  1. Kiara, C.; Michelle, M.; Christian, Q.; Jennifer, C.; Jose, C. Analysis of urban expansion and its relationship with climate change in Huancayo 1969–2019. In Proceedings of the E3S Web of Conferences, Tamilnadu, India, 22–23 November 2023; EDP Sciences: Les Ulis, France, 2023; pp. 249–258. [Google Scholar]
  2. Alcoforado, M.J.; Andrade, H. Global Warming and the Urban Heat Island. In Urban Ecology: An International Perspective on the Interaction Between Humans and Nature; Springer: Boston, MA, USA, 2008; pp. 249–262. [Google Scholar]
  3. Vikash, S. Urbanization Induced Climate Change: Impacts and Sustainable Solutions. Asian Res. J. Arts Soc. Sci. 2025, 5, 135–142. [Google Scholar] [CrossRef]
  4. Subhanil, G.; Himanshu, G.; Neetu, G.; Anindita, D. A long-term seasonal analysis on the relationship between LST and NDBI using Landsat data. Quat. Int. 2021, 575, 249–258. [Google Scholar] [CrossRef]
  5. Nusret, D.; Samir, D.; Muniba, O. NDVI and NDBI Indexes as Indicators of the Creation of Urban Heat Islands in the Sarajevo Basin. Geogr. Pannonica 2024, 28, 34–43. [Google Scholar] [CrossRef]
  6. Subhanil, G.; Himanshu, G.; Anindita, D.; Neetu, G. Analytical study of land surface temperature with NDVI and NDBI using Landsat 8 OLI and TIRS data in Florence and Naples city, Italy. Eur. J. Remote Sens. 2018, 51, 667–678. [Google Scholar]
  7. Zha, Y.; Gao, J.; Ni, S. Use of normalized difference built-up index in automatically mapping urban areas from TM imagery. Int. J. Remote Sens. 2003, 24, 583–594. [Google Scholar] [CrossRef]
  8. Mohammad, S.M.; Jai, P.S.; Satanand, M. Relationship of LST, NDBI and NDVI using Landsat-8 data in Kandaihimmat Watershed, Hoshangabad, India. Indian J. Geo Mar. Sci. 2018, 48, 25–31. [Google Scholar]
  9. Raihan, A.R.G.; Hamim, Z.H.; Basyar, I.A. Analysis of the Impact of Residential Land Development on LST in Semarang City. Adv. Soc. Sci. Educ. Humanit. Res. 2023, 755, 421–435. [Google Scholar]
  10. Halder, B.; Bandyopadhyay, J.; Khedher, K.M.; Fai, C.M.; Tangang, F.; Yaseen, Z.M. Delineation of urban expansion influences urban heat islands and natural environment using remote sensing and GIS-based in industrial area. Environ. Sci. Pollut. Res. 2022, 29, 73147–73170. [Google Scholar] [CrossRef] [PubMed]
  11. Muhaimin, M.; Fitriani, D.; Adyatma, S.; Arisanty, D. Mapping Build-up area density using normalized difference Built-up Index (NDBI) and Urban Index (UI) wetland in the city banjarmasin. IOP Conf. Ser. Earth Environ. Sci. (EES) 2022, 1089, 012036. [Google Scholar] [CrossRef]
  12. Firozjaei, M.K.; Sedighi, A.; Kiavarz, M.; Qureshi, S.; Haase, D.; Alavipanah, S.K. Automated Built-Up Extraction Index: A New Technique for Mapping Surface Built-Up Areas Using LANDSAT 8 OLI Imagery. Remote Sens. 2019, 11, 1966. [Google Scholar] [CrossRef]
  13. Ankush, A.; Shikha, V. Analysis of urban area extracted from NDBI and classification approach by using satellite data. In Proceedings of the 8th International Conference on Engineering and Emerging Technologies (ICEET), Kuala Lumpur, Malaysia, 26 October 2022; IEEE: New York, NY, USA, 2022. [Google Scholar]
  14. Nzoiwu, C.P.; Agulue, E.I.; Mbah, S.; Igboanugo, C.P. Impact of Land Use/Land Cover Change on Surface Temperature Condition of Awka Town, Nigeria. J. Geogr. Inf. Syst. 2017, 9, 763–776. [Google Scholar] [CrossRef]
  15. Chathuranga, M.; Sandamali, J. Time series analysis of urban temperature in Kandy city, Sri Lanka with the use of satellite remote sensing. In Proceedings of the 12th International Research Conference, Ratmalana, Sri Lanka, 11–12 September 2019; pp. 125–130. [Google Scholar]
  16. Bozorgi, M.; Nejadkoorki, F.; Bihamta, N. Trend analysis development of urban heat island using thermal remote sensing. Earth Obs. Geomat. Eng. 2021, 4, 119–131. [Google Scholar]
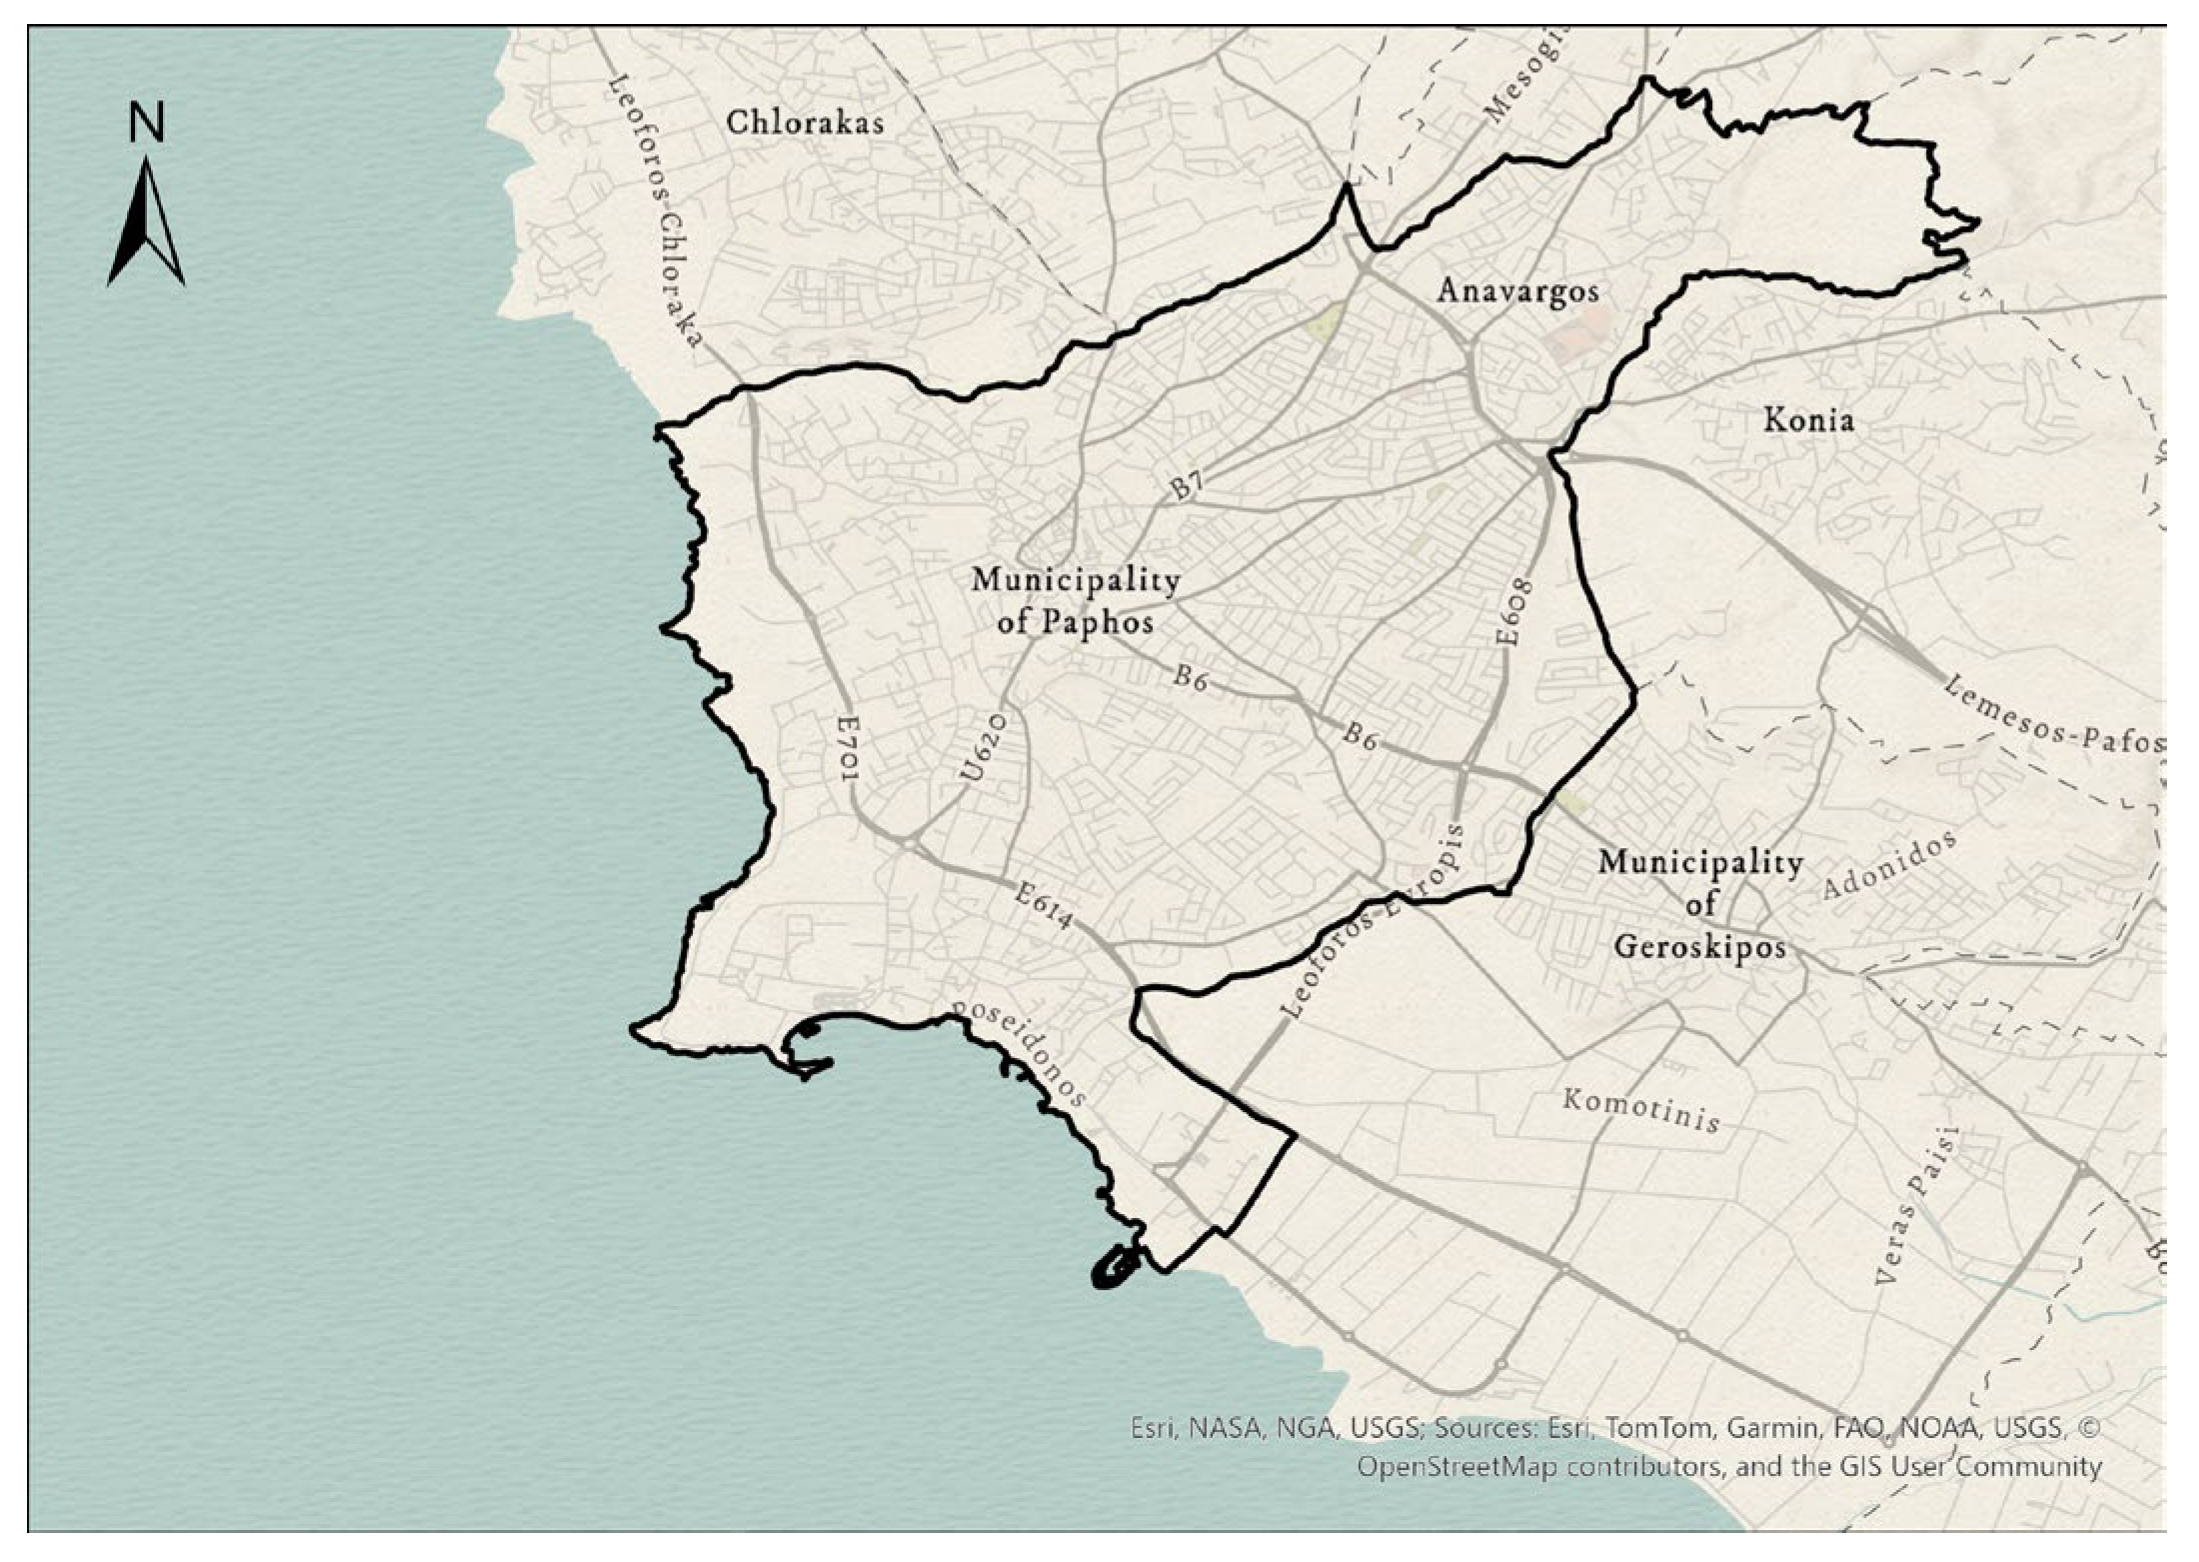
Figure 1. District boundaries of Paphos.
Eesp 35 00065 g001
Figure 2. Normalized Difference Built-Up Index (NDBI).
Eesp 35 00065 g002
Figure 3. The NDBI for Paphos centre. Green areas range from −0.26 to −0.026, built environment ranges from −0.025 to 0.037, and Bare soil ranges from 0.038 to 1. The (left) image represents the NDBI in 2015, and the (right) image represents the NDBI in 2024.
Eesp 35 00065 g003
Figure 4. NDVI represents the green spaces with values 0.2 to +1. On the (left) is the satellite image for 2015, and on the (right) is the image for 2024.
Eesp 35 00065 g004
Figure 5. LST distribution in 2015 (left) and classification of temperature fluctuations (right).
Eesp 35 00065 g005
Figure 6. LST distribution in 2024 (left) and classification of temperature fluctuations (right).
Eesp 35 00065 g006
Table 1. Temperature fluctuations between 2015 and 2024.
20152024
Temperature Fluctuation (°C)Area (m2)Area (%)Area (m2)Area (%)
22–320.492.90.291.70
32–342.1212.520.281.67
34–3610.6162.491.8410.83
36–383.5821.1110.1759.89
38–400.160.974.2825.22
40–44--0.110.67
Disclaimer/Publisher’s Note: The statements, opinions and data contained in all publications are solely those of the individual author(s) and contributor(s) and not of MDPI and/or the editor(s). MDPI and/or the editor(s) disclaim responsibility for any injury to people or property resulting from any ideas, methods, instructions or products referred to in the content.