The Evolution of the Interannual and Seasonal Variation of the Main Gaseous and Particulate Pollutants in Athens, Greece, for 2001–2023 †
Abstract
1. Introduction
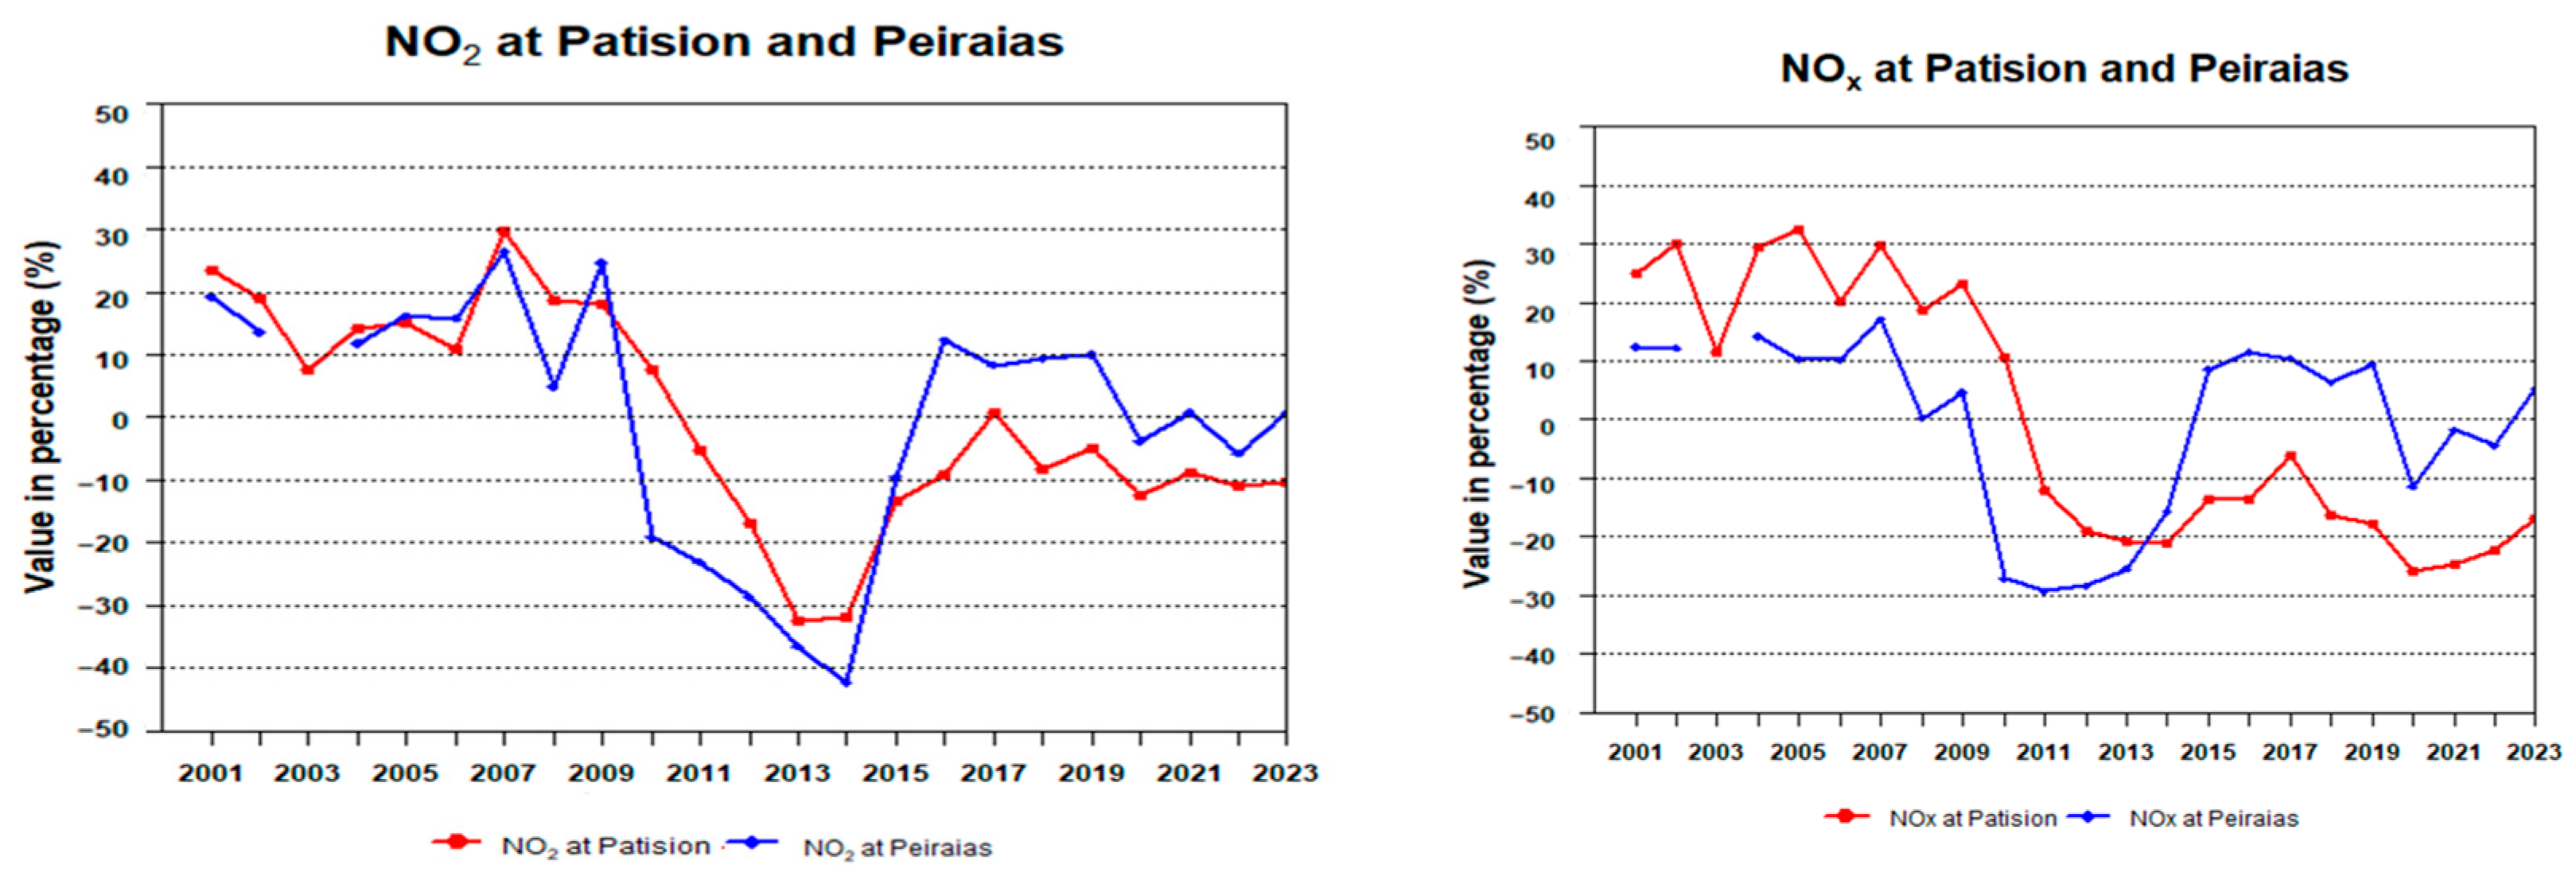
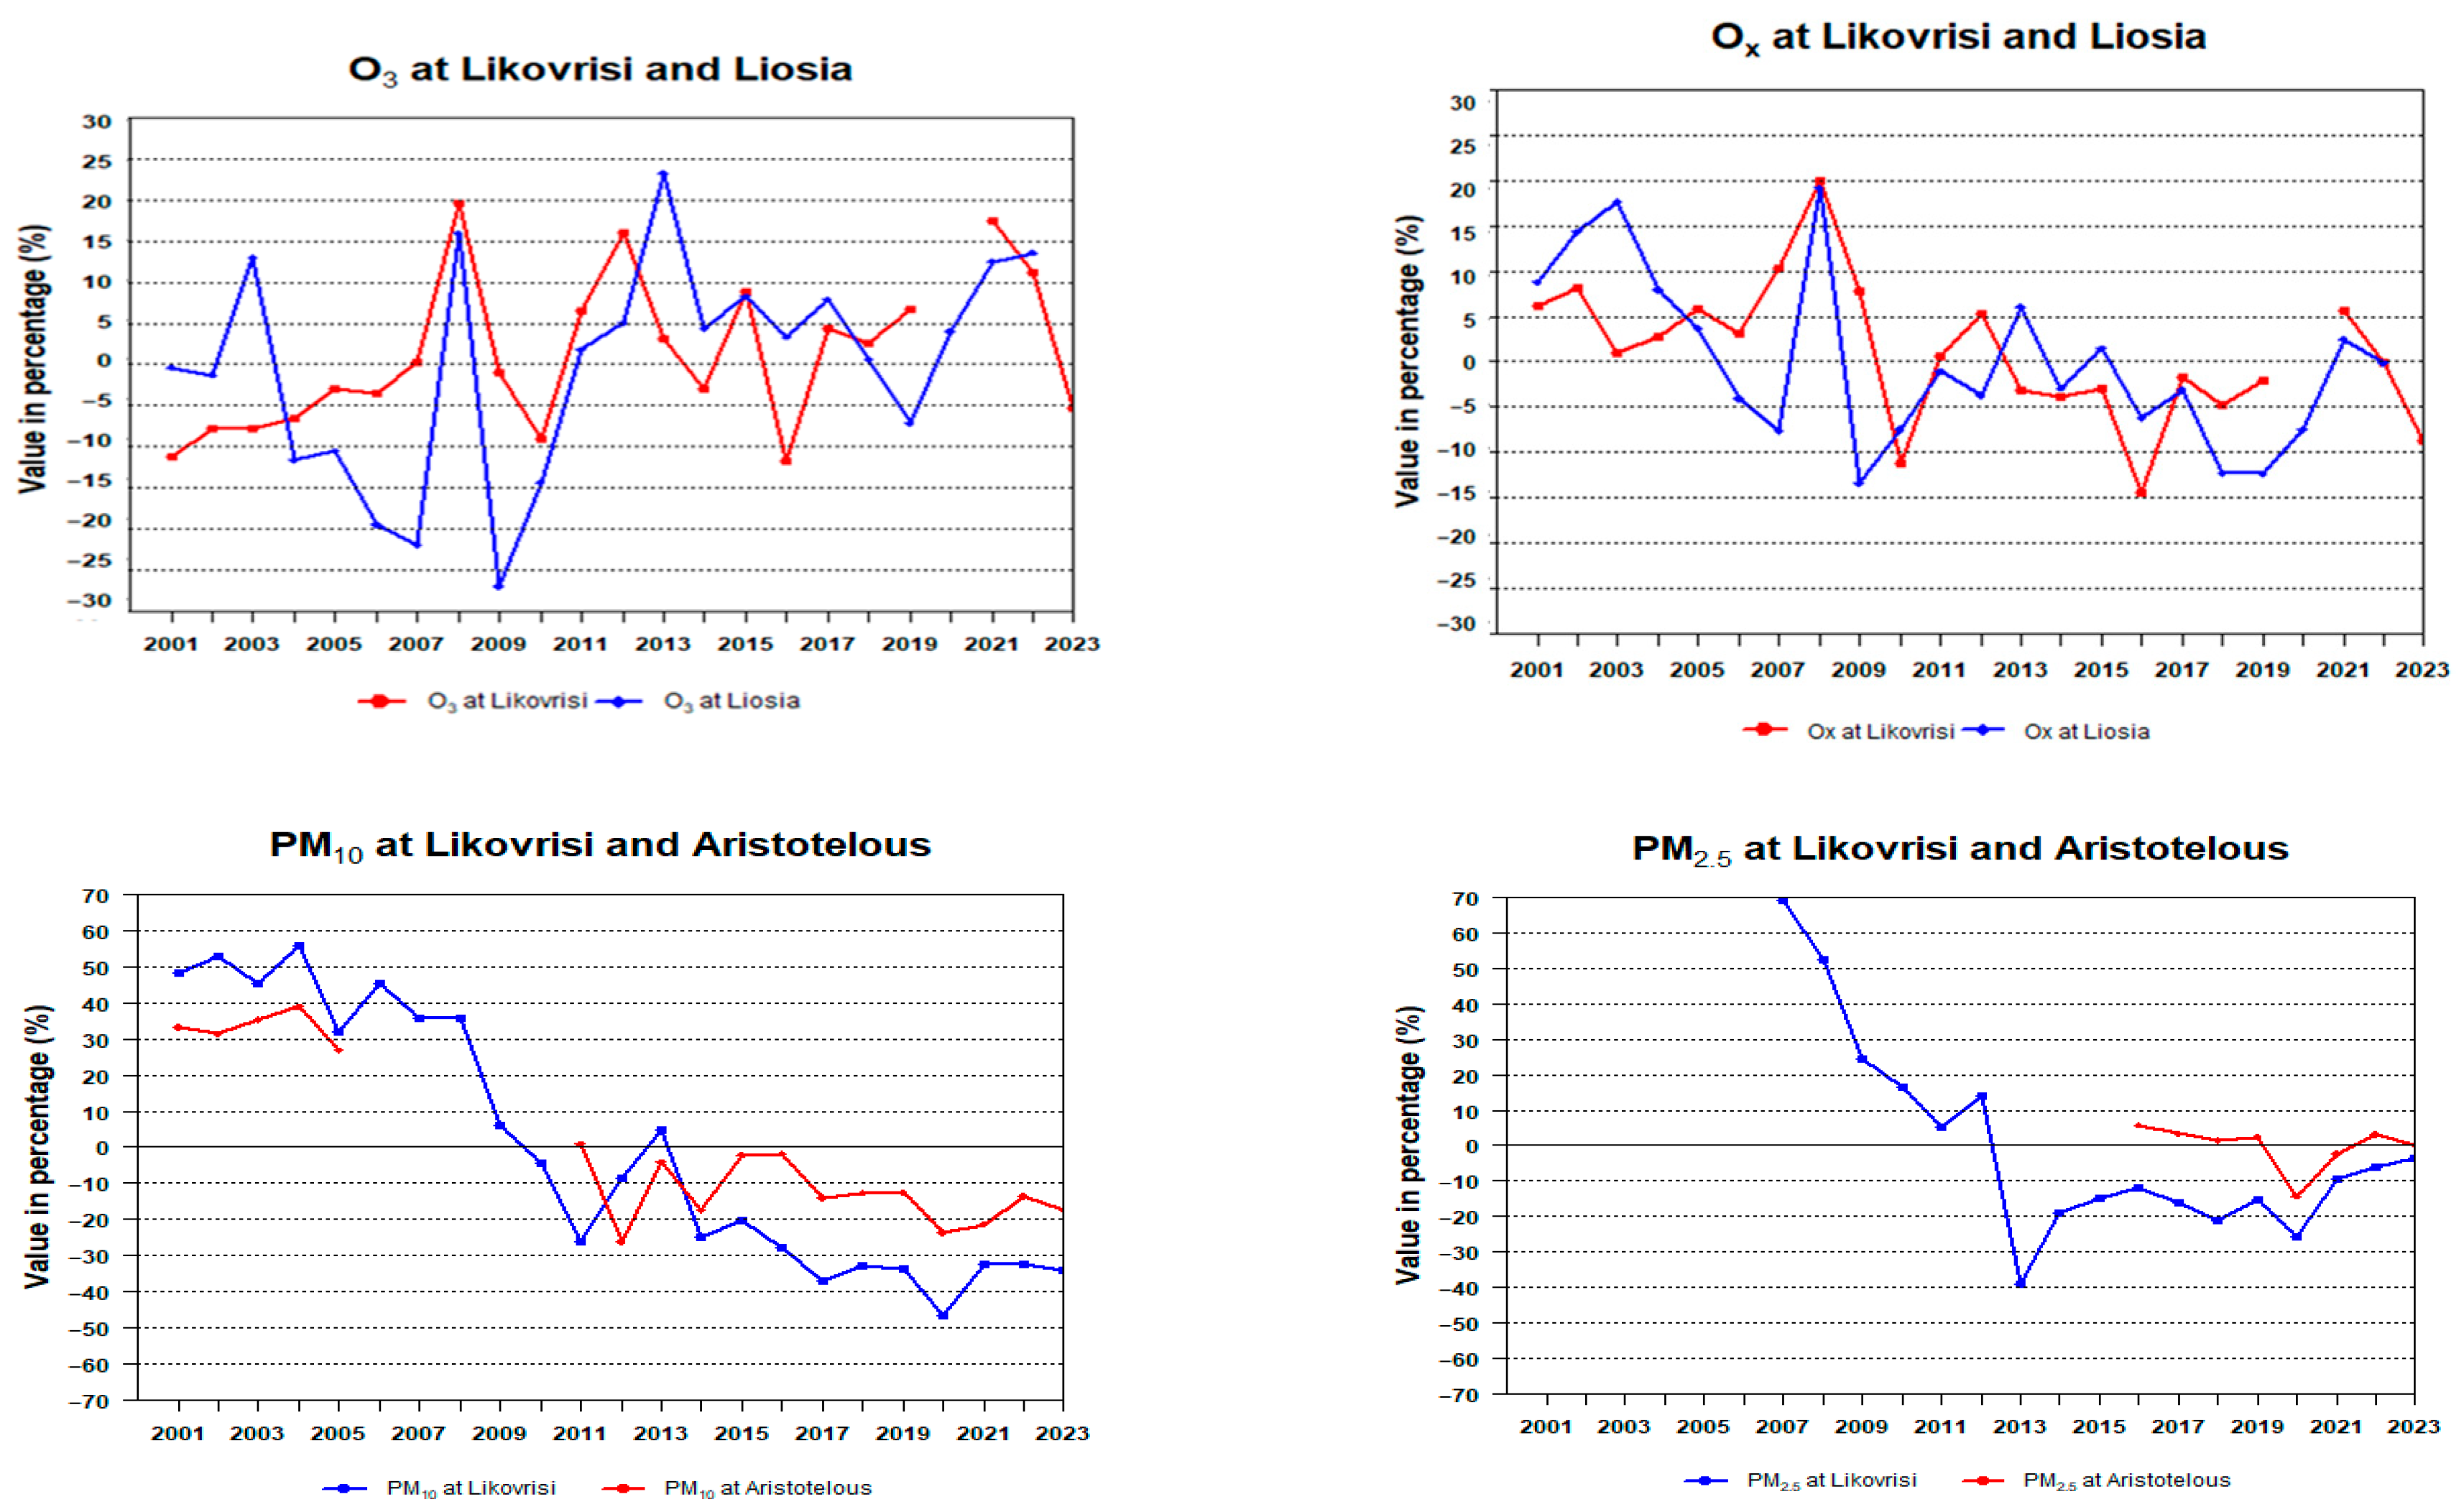
2. Results and Discussion
Author Contributions
Funding
Institutional Review Board Statement
Informed Consent Statement
Data Availability Statement
Conflicts of Interest
References
- Mantis, H.T.; Repapis, C.C.; Zerefos, C.; Ziomas, I. Assessment of the potential for photochemical air pollution in Athens: A comparison of emissions and air-pollutant levels in Athens with those in Los Angeles. J. Appl. Meteor. 1992, 31, 1467–1476. [Google Scholar] [CrossRef]
- Viras, L.; Siskos, P. Air pollution by gaseous pollutants in Athens, Greece. In Gaseous Pollutants: Characterization and Cycling; Nriagu, J.O., Ed.; J. Wiley & Sons, Inc.: New York, NY, USA, 1992; pp. 271–305. ISBN 978-0-471-54898-0. [Google Scholar]
- Kalabokas, P.D.; Viras, L.G.; Repapis, C.C. Analysis of the 11-year record (1987–1997) of air pollution measurements in Athens; Greece. Part I: Primary air pollutants. Glob. Nest Int. J. 1999, 1, 157–167. [Google Scholar] [CrossRef]
- Ziomas, I. The Mediterranean Campaign of Photochemical Tracers-Transport and Chemical Evolution (MEDCAPHOTTRACE): An outline. Atmos. Environ. 1998, 32, 2045–2054. [Google Scholar]
- Ziomas, I.C.; Tzoumaka, P.; Balis, D.; Melas, D.; Zerefos, C.S.; Klemm, O. Ozone episodes in Athens, Greece, A modelling approach using data from the MEDCAPHOT-TRACE. Atmos. Environ. 1998, 32, 2313–2322. [Google Scholar] [CrossRef]
- Chaloulakou, A.; Kassomenos, P.; Spyrellis, N.; Demokritou, P.; Koutrakis, P. Measurements of PM10 and PM2.5 particle concentrations in Athens, Greece. Atmos. Environ. 2003, 37, 649–660. [Google Scholar] [CrossRef]
- Papayannis, A.; Balis, D.; Amiridis, V.; Chourdakis, G.; Tsaknakis, G.; Zerefos, C.; Castanho, A.D.A.; Nickovic, S.; Kazadzis, S.; Grabowski, J. Measurements of Saharan dust aerosols over the Eastern Mediterranean using elastic backscatter-Raman lidar, spectrophotometric and satellite observations in the frame of the EARLINET project. Atmos. Chem. Phys. 2005, 5, 2065–2079. [Google Scholar] [CrossRef]
- Gerasopoulos, E.; Kouvarakis, G.; Babasakalis, P.; Vrekoussis, M.; Putaud, J.P.; Mihalopoulos, N. Origin and variability of particulate matter (PM10) mass concentrations over the Eastern Mediterranean. Atmos. Environ. 2006, 40, 4679–4690. [Google Scholar] [CrossRef]
- Grivas, G.; Chaloulakou, A.; Kassomenos, P. An overview of the PM10 pollution problem, in the Metropolitan Area of Athens, Greece. Assessment of controlling factors and potential impact of long-range transport. Sci. Tot. Environ. 2008, 389, 165–177. [Google Scholar] [CrossRef] [PubMed]
- Kalabokas, P.D.; Viras, L.G.; Bartzis, J.G.; Repapis, C.C. Mediterranean rural ozone characteristics around the urban area of Athens. Atmos. Environ. 2000, 34, 5199–5208. [Google Scholar] [CrossRef]
- Lelieveld, J.; Berresheim, H.; Borrmann, S.; Crutzen, P.J.; Dentener, F.J.; Fischer, H.; Feichter, J.; Flatau, P.J.; Heland, J.; Holzinger, R.; et al. Global air pollution crossroads over the Mediterranean. Science 2002, 298, 794–799. [Google Scholar] [CrossRef] [PubMed]
- Zerefos, C.S.; Kourtidis, K.A.; Melas, D.; Balis, D.; Zanis, P.; Katsaros, L.; Mantis, H.T.; Repapis, C.; Isaksen, I.; Calpini, B.; et al. Photo-chemical Activity and Solar Ultraviolet Radiation (PAUR) Modulation factors: An overview of the project. J. Geophys. Res. 2002, 107, PAU-1. [Google Scholar] [CrossRef]
- Kouvarakis, G.; Vrekoussis, M.; Mihalopoulos, N.; Kourtidis, K.; Rappenglueck, B.; Gerasopoulos, E.; Zerefos, C. Spatial and temporal variability of tropospheric ozone (O3) in the boundary layer above the Aegean Sea (eastern Mediterranean). J. Geophys. Res. Atmos. 2002, 107, 4-1–4-14. [Google Scholar] [CrossRef]
- Kalabokas, P.D.; Mihalopoulos, N.; Ellul, R.; Kleanthous, S.; Repapis, C.C. An investigation of the meteorological and photochemical factors influencing the background rural and marine surface ozone levels in the Central and Eastern Mediterranean. Atmos. Environ. 2008, 42, 7894–7906. [Google Scholar] [CrossRef]
- Varotsos, C.; Kalabokas, P.; Chronopoulos, G. Atmospheric ozone concentration at Athens, Greece. Part II: Vertical ozone distribution in the troposphere. Atmos. Res. 1993, 30, 151–155. [Google Scholar] [CrossRef]
- Kourtidis, K.; Zerefos, C.; Rapsomanikis, S.; Simeonov, V.; Balis, D.; Perros, P.E.; Thompson, A.M.; Witte, J.; Calpini, B.; Sharobiem, W.M.; et al. Regional levels of ozone in the troposphere over eastern Mediterranean. J. Geophys. Res. Atmos. 2002, 107, 7-1–7-13. [Google Scholar] [CrossRef]
- Kalabokas, P.; Stavraka, T.; Kapsomenakis, J.; Poupkou, A.; Zerefos, C. The Evolution of the Seasonal Variation and the Summer Diurnal Variation of Primary and Secondary Photochemical Air Pollution in Athens. Environ. Sci. Proc. 2023, 26, 122. [Google Scholar] [CrossRef]


| AIR POLLUTAN STATIONS | SO2 | CO(mg/m3) | NO2 | NOx | Ox | O3 | PM10 | PM2.5 |
|---|---|---|---|---|---|---|---|---|
| PEIRAIAS | 13.02 | 1.03 | 57.59 | 131.91 | 96.57 | 37.56 | 43.20 | 20.74 |
| NEA SMYRNI | 9.84 | 0.69 | 34.42 | 58.18 | 100.58 | 64.09 | - | -- |
| GEOPONIKI | 8.71 | 0.70 | 37.08 | 70.88 | 88.70 | 49.34 | - | - |
| ATHINAS | 7.71 | 1.37 | 49.92 | 123.38 | 87.60 | 35.34 | - | - |
| PATISION | 13.21 | 1.84 | 77.24 | 225.63 | 100.89 | 20.31 | - | - |
| MAROUSI | 7.83 | 0.63 | 28.94 | 55.12 | 90.78 | 60.56 | 41.77 | - |
| LYKOVRISI | - | - | 25.98 | 46.34 | 89.62 | 61.86 | 47.57 | 19.70 |
| LIOSIA | - | - | 27.86 | 48.60 | 93.97 | 64.25 | - | - |
| AG. PARASKEVI | - | - | 15.10 | 18.84 | 98.11 | 82.29 | 30.32 | 13.35 |
| THRAK/DONES | - | - | 9.10 | 15.27 | 97.50 | 87.81 | 29.98 | 12.69 |
| JAN | FEB | MAR | APR | MAY | JUN | JUL | AUG | SEPT | OCT | NOV | DEC | |
|---|---|---|---|---|---|---|---|---|---|---|---|---|
| SO2 | 44.78 | 43.05 | 35.21 | 30.02 | 24.66 | 20.58 | 24.02 | 13.07 | 11.85 | 13.31 | 33.23 | 42.86 |
| 9.18 | 8.87 | 7.83 | 5.24 | 5.02 | 5.18 | 3.95 | 4.18 | 4.77 | 4.41 | 5.10 | 5.96 | |
| CO | 3.53 | 3.34 | 3.14 | 2.87 | 2.85 | 2.78 | 2.71 | 2.29 | 3.28 | 3.68 | 4.12 | 3.29 |
| 1.54 | 1.33 | 1.00 | 0.85 | 1.02 | 0.90 | 0.65 | 0.68 | 0.86 | 1.14 | 1.34 | 1.6 | |
| NO2 | 76.15 | 86.13 | 93.55 | 96.84 | 96.78 | 108.49 | 99.42 | 93.20 | 90.65 | 91.71 | 76.82 | 67.77 |
| 64.47 | 70.94 | 68.11 | 71.80 | 78.06 | 76.66 | 71.12 | 67.87 | 71.83 | 67.84 | 61.44 | 59.76 | |
| NOx | 322.72 | 322.28 | 297.84 | 270.02 | 259.78 | 261.14 | 230.91 | 213.73 | 256.06 | 313.91 | 360.42 | 305.44 |
| 231.08 | 217.72 | 157.70 | 140.13 | 162.14 | 160.30 | 128.21 | 123.19 | 156.71 | 189.54 | 206.42 | 233.35 | |
| Ox | 68.06 | 84.18 | 98.08 | 103.91 | 115.37 | 116.15 | 111.52 | 108.68 | 94.18 | 83.10 | 68.23 | 59.91 |
| 63.81 | 73.98 | 81.24 | 90.79 | 97.45 | 100.19 | 108.90 | 104.66 | 90.67 | 76.43 | 65.61 | 58.39 | |
| O3 | 32.90 | 43.14 | 53.11 | 64.97 | 79.96 | 83.30 | 78.48 | 82.67 | 57.91 | 45.11 | 28.93 | 28.96 |
| 39.23 | 47.70 | 60.84 | 71.67 | 76.50 | 81.97 | 93.24 | 89.46 | 73.39 | 57.18 | 43.98 | 34.87 | |
| PM10 | 60.47 | 59.20 | 69.17 | 63.09 | 60.04 | 58.98 | 63.25 | 55.69 | 59.78 | 66.51 | 67.78 | 48.53 |
| 33.53 | 29.78 | 24.80 | 23.89 | 24.18 | 21.64 | 24.07 | 26.40 | 25.10 | 23.87 | 24.45 | 28.44 | |
| PM2.5 | 26.95 | 26.62 | 28.61 | 29.06 | 26.69 | 32.58 | 37.21 | 32.71 | 26.90 | 25.45 | 26.27 | 23.03 |
| 26.76 | 23.59 | 19.84 | 15.90 | 15.36 | 12.26 | 14.02 | 14.92 | 14.30 | 13.23 | 16.54 | 21.85 |
Disclaimer/Publisher’s Note: The statements, opinions and data contained in all publications are solely those of the individual author(s) and contributor(s) and not of MDPI and/or the editor(s). MDPI and/or the editor(s) disclaim responsibility for any injury to people or property resulting from any ideas, methods, instructions or products referred to in the content. |
© 2025 by the authors. Licensee MDPI, Basel, Switzerland. This article is an open access article distributed under the terms and conditions of the Creative Commons Attribution (CC BY) license (https://creativecommons.org/licenses/by/4.0/).
Share and Cite
Stavraka, T.; Kapsomenakis, J.; Poupkou, A.; Douvis, K.; Kalabokas, P. The Evolution of the Interannual and Seasonal Variation of the Main Gaseous and Particulate Pollutants in Athens, Greece, for 2001–2023. Environ. Earth Sci. Proc. 2025, 35, 41. https://doi.org/10.3390/eesp2025035041
Stavraka T, Kapsomenakis J, Poupkou A, Douvis K, Kalabokas P. The Evolution of the Interannual and Seasonal Variation of the Main Gaseous and Particulate Pollutants in Athens, Greece, for 2001–2023. Environmental and Earth Sciences Proceedings. 2025; 35(1):41. https://doi.org/10.3390/eesp2025035041
Chicago/Turabian StyleStavraka, Theodora, John Kapsomenakis, Anastasia Poupkou, Kostas Douvis, and Pavlos Kalabokas. 2025. "The Evolution of the Interannual and Seasonal Variation of the Main Gaseous and Particulate Pollutants in Athens, Greece, for 2001–2023" Environmental and Earth Sciences Proceedings 35, no. 1: 41. https://doi.org/10.3390/eesp2025035041
APA StyleStavraka, T., Kapsomenakis, J., Poupkou, A., Douvis, K., & Kalabokas, P. (2025). The Evolution of the Interannual and Seasonal Variation of the Main Gaseous and Particulate Pollutants in Athens, Greece, for 2001–2023. Environmental and Earth Sciences Proceedings, 35(1), 41. https://doi.org/10.3390/eesp2025035041


