Proceeding Paper

A Verification Procedure for Terminal Aerodrome Forecasts †

by
Dimitra Boucouvala
1,* and
David McCooey
2
1
Hellenic National Meteorological Service, El. Venizelou 14, 16777 Helliniko, Greece
2
Independent Researcher, 921 Hooks Trail, League City, TX 77573, USA
*
Author to whom correspondence should be addressed.
Presented at the 17th International Conference on Meteorology, Climatology, and Atmospheric Physics—COMECAP 2025, Nicosia, Cyprus, 29 September–1 October 2025.
Environ. Earth Sci. Proc. 2025, 35(1), 30; https://doi.org/10.3390/eesp2025035030
Published: 15 September 2025

Abstract

Terminal Aerodrome Forecasts (TAFs) and long TAFs are issued by forecasters in the Hellenic National Meteorological Service for the upcoming 9 or 24 h respectively, for all airports to aid in flight planning. The most important predicted parameters are wind speed and direction, weather phenomena, and visibility. A verification procedure comparing TAFs to Meteorological Aerodrome Reports (METARs) can be helpful for improving the skills of forecasters. To this end, software was developed to read the raw format structure of TAFs and METARs and compare them. The wind speed and direction for each forecast hour are verified according to thresholds specified by the International Civil Aviation Organization (ICAO), and a summary is produced, showing correct, overestimated, and underestimated percentages. A weather phenomenon, such as rain (RA) or thunderstorm (TSRA), is usually given inside a probability time window in a TAF (e.g., PROB40 TEMPO RA). In such a case, the occurrence or absence of the phenomenon and its frequency inside the time window are considered when determining the forecaster’s skill (correct, false alarm, or miss), evaluated using categorical indices such as POD, ETS, and FAR over a number of TAFs. A similar procedure is carried out for visibility range intervals. In this study, verification was performed for a test period of January 2023 for 14 Greek airports. Results indicate generally good performance in predicting wind speed and direction, and also demonstrate the TAFs accuracy in detecting phenomena like rain, although with a notable tendency for false alarms. A systematic tendency to underestimate actual visibility, especially inside TEMPO statements is observed.

1. Introduction

In meteorological forecasting, Terminal Aerodrome Forecasts (TAFs) are coded messages which serve as guidance for aviation, providing a prediction of expected weather conditions at an airport for a specific time period of 9 h (short TAFs) or 24 h (long TAFs). Details on the structure of these messages can be found in International Civil Aviation Organization (ICAO) and World Meteorological Organization (WMO) documents [1,2]. The accuracy of these forecasts directly impacts flight safety and operational planning. Verification of TAFs against METAR (Meteorological Aerodrome Report) observations is essential to assess their correctness and enhance the reliability of meteorological services for the aviation community. There are several studies such as [3,4,5] which deal with TAF verification. The significant challenge is the interpretation of change groups (‘TEMPO’, ‘BECMG’, ‘PROB30’,‘PROB40’), which provide a range of possible conditions over time intervals, rather than precise point forecasts. In short, a TAF provides a specific weather outlook for an airport, with ‘TEMPO’ indicating temporary deviations, and ‘BECMG’ (Becoming) signaling a lasting, gradual shift in conditions. TEMPO is often preceded by PROB40 or PROB30, indicating increased (40%) or reduced (30%) probability of occurrence, respectively. In this paper, the verification procedure was applied, comparing TAFs against METARs while taking into consideration the change groups. An evaluation of the most important forecast parameters, such as wind, significant weather phenomena and visibility, is performed, allowing TAF accuracy to be quantified, which contributes to the ongoing forecasting methodologies and forecaster efficiency.

2. Methodology

The procedure is based on a new software program (V_TAF Version 1.1) written in C language that reads its input from two ASCII input files, one containing TAFs and the other containing METARs, specified through a command-line interface. The program outputs two ASCII files, one with the verification of all TAFs individually, and the other with a summary of all verification results along with scores. It is intended to be used internally in HNMS for monthly TAF verification. TAF predictions of wind speed and direction, weather phenomena, and visibility against METARs are evaluated. METARs are usually issued twice per hour, at 20 and 50 min past the hour. Occasionally, a ‘SPECI’ (special METAR) is issued if there is a significant change in weather conditions. We selected 14 aerodromes (Appendix A) primarily because their METARs offer greater frequency and reliability, a direct result of being issued mainly by observers rather than automated systems.

2.1. Wind Speed Verification

Overestimation, underestimation, or correct estimate of wind speed is determined by comparing the TAF’s predicted wind speed to the average of the METAR observations for the same hour. For the forecast to be considered ‘correct’, the wind speed difference must be below a threshold, which, according to ICAO regulations [1] is set to 5 KT (Knots) for wind speeds ≤25 KT and ±20% for wind speeds above 25 KT. It is important to note that for this study, when wind gusts are reported (e.g., 20010G20KT), the wind speed is calculated as the average value of the mean and gust, resulting in 15 KT in this specific example. In the case of a BECMG statement, for example, “20010KT BECMG 0608 30020KT” (where 0608 means from hour 06 to hour 08), the following assumption is used:
  • For the transitional hour (in this case ‘07’), the METARs are compared against both versions of the TAF (i.e., the value before the BECMG and the value after the BECMG). For verification, the best version is kept—the one that yields the highest success rate.
  • For the final hour (e.g., 08), the METARs are compared only against the final value specified in the TAF after the BECMG statement.

2.2. Wind Direction Verification

For each forecast hour, the wind direction value provided in the TAF is compared against the METAR values that fall within that hour’s time frame (typically two METARs). The comparison is based on a threshold of 30 degrees of deviation according to ICAO regulations [1].
  • If both METARs show a wind direction difference from the TAF that is smaller than the threshold, then the success rate is 100%.
  • If only one of the two METARs has a difference smaller than the threshold, the success rate is 50%.
  • If neither of the METARs falls within the threshold, the success rate is 0%.
Should there be more than two METARs for a specific hour, the success percentage is adjusted accordingly based on the number of METARs that meet the threshold criterion. In the case of ‘BECMG’, the concept described for wind speed is applied.

2.3. Weather Phenomena Verification

Weather phenomena are often included in TEMPO, PROB30 TEMPO or PROB40 TEMPO statements. In our verification process all TEMPOs are verified one by one, using the following assumptions:
  • In case of PROB40 TEMPO RA or TEMPO RA (rain): If at least one occurrence of RA is observed, but does not cover at least half of the TEMPO period, the TEMPO statement is categorized as ‘PARTLY CORRECT’. If at least half of the METARs within the specified period show RA, the TEMPO statement is considered ‘CORRECT’.
  • In case of PROB30 TEMPO: If at least one occurrence of a forecast phenomenon is observed, the TEMPO statement is categorized as ‘CORRECT’. For any ‘PROB40/30 TEMPO RA’ version: If no METAR shows RA during the period, the result is ‘FALSE ALARM’. If a phenomenon is not predicted in the TAF, this counts as a ‘MISS’.

2.4. METAR-TAF Phenomena Correspondence

When a phenomenon is forecast in a TAF, and a different but related phenomenon appears in a METAR, it is assessed whether that METAR observation counts as a “correct” prediction. For example, if RA (rain) is forecast in a ‘TEMPO RA’ statement in the TAF, but the METAR reports TSRA (thunderstorm with rain), this is considered a correct prediction for the ‘TEMPO RA’ forecast. However, the reverse is not true: if ‘TEMPO TSRA’ is forecast in the TAF, and only RA is reported in the METAR, it is not automatically considered correct unless specified otherwise by the program’s user. Users have the flexibility to modify these correspondence rules by adjusting the data in Table 1, which defines the mapping:
Therefore, according to this table, if the TAF predicts TSRA, and the METARs show TSRA, SHRA (Shower Rain), TS (Thunderstorm), these observations would be accepted as a correct forecast. The user has the ability to modify this table. The occurrences of ‘CORRECT’/‘PARTLY CORRECT’, ‘FALSE ALARM’ and ‘MISS’ are counted, contingency tables are created, and dichotomous scores are produced.

2.5. Visibility Verification

Visibility values are categorized (shown in Table 2) as documented in [1]. For each TAF, the accuracy of its visibility forecast is checked, determining if it was correctly predicted or over/underestimated according to the category difference between TAF and METAR for each forecast hour. In TEMPO statements, where the visibility is also included (e.g., ‘PROB40 TEMPO 5000 RA’ where 5000 is visibility in meters), it is checked whether the specified visibility category actually occurred during that time frame using the same procedure as for the phenomena.

3. Results

Data for one month (January 2023) were used to test the software, evaluate the procedure, and produce an initial estimation of TAF performance in general. The TAFs issued by the forecasters were aggregated for each forecast hour. The wind speed predictions were correct at a rate of 70% for all forecast hours, about 30% were overestimated and underestimations were negligible. The wind direction verification relative to forecast hour is shown in Figure 1. About 60% of TAFs predicted correct wind direction for both METARs that fell in the forecast hour; 30% were incorrect, and about 10% correctly predicted one of the two METARs. The performance does not significantly change with forecast hour, showing only a slight decrease.
Phenomena can be verified individually or grouped together (RA, SHRA) in case of few occurrences. Every TAF is verified. Finally, all TAFs were aggregated and dichotomous scores were produced. All available TAFs were tested and the following main scores were calculated. Some of them are listed in Table 3.
Details on the statistical scores can be found in [6,7,8]. High POD score and Accuracy indicate success in detecting meteorological events, such as rain. This means that when an event occurs, TAFs generally predicted it. However, FBI (>1) and relatively high FAR reflects the forecasters’ tendency to overpredict events, especially TSRA. Visibility preliminary evaluation has revealed a significant bias: Visibilities lower than what actually occurred were predicted often. Specifically, TEMPOs with CORRECT or PARTLY CORRECT visibilities were only about 11%, while 89% of the TEMPOs predicted too low visibility compared to METARs.

4. Conclusions

A procedure to assess the quality of aerodrome forecasts by analyzing TAFs (Terminal Aerodrome Forecasts) and METARs (Meteorological Aerodrome Reports) using a new software program (V_TAF) is presented. Initial results for one month indicate generally good performance in predicting wind speed and direction. TAF accuracy in estimating phenomena like rain is apparent, although with a notable tendency for false alarms. It is crucial to recognize that the evaluation of these predictions is significantly influenced by the quality and frequency of observational data, as limitations in such data can affect the perceived accuracy of the forecasts. Furthermore, there is a challenge with common evaluation of rare events such as snow (SN). To overcome this, it is essential to adopt skill scores that accurately account for the infrequency of these events such as the HSS [6]. Future enhancements to the software will focus on improving visibility metrics and evaluation, calculating different scores, and including additional forecaster requirements such as cloud base and ensuring compliance with aerodrome regulations.

Author Contributions

Conceptualization, D.B.; methodology, D.B.; software, D.M.; validation, D.B., D.M.; writing—original draft preparation, D.B.; writing—review and editing, D.B., D.M.; All authors have read and agreed to the published version of the manuscript.

Funding

This research received no external funding.

Institutional Review Board Statement

Not applicable.

Informed Consent Statement

Not applicable.

Data Availability Statement

The raw data supporting the conclusions of this article will be made available by the authors on request.

Conflicts of Interest

The authors declare no conflict of interest.

Appendix A

List of aerodromes:
LGAD (Andravida),LGAV (El. Venizelos), LGBL (Volos), LGEL (Eleusina), LGIR (Heraklion),LGKL (Kalamata),LGKR (Kerkyra), LGLM (Limnos), LGMK (Mykonos),LGPZ (Preveza), LGRP (Rhodes), LGSA (Souda), LGTG (Tanagra), LGTS (Thessaloniki).

References

  1. International Civil Aviation Organization. Annex 3—Meteorological Service for International Air Navigation, 20th ed.; incorporating Amendment 81, applicable 28 November 2024; International Civil Aviation Organization: Montreal, QC, Canada, 2018. [Google Scholar]
  2. World Meteorological Organization (WMO). Manual on Codes: International Codes, Volume I.1—Part A: Alphanumeric Codes; WMO-No. 306; World Meteorological Organization (WMO): Geneva, Switzerland, 2019. [Google Scholar]
  3. Novotny, J.; Dejmal, K.; Repal, V.; Gera, M.; Sladek, D. Assessment of TAF, METAR, and SPECI Reports Based on ICAO ANNEX 3 Regulation. Atmosphere 2021, 12, 138. [Google Scholar] [CrossRef]
  4. Mahringer, G. Terminal aerodrome forecast verification in Austro Control using time windows and ranges of forecast conditions. Meteorol. Appl. 2008, 15, 113–123. [Google Scholar] [CrossRef]
  5. Prezerakos, N.G.; Prezerakos, H.N.; Michaelides, S.C. A verification method for aerodrome forecasts. Meteorol. Mag. 1991, 120, 31–35. [Google Scholar]
  6. Available online: https://www.cawcr.gov.au/projects/verification/ (accessed on 1 July 2025).
  7. World Meteorological Organization (WMO). Guide to the Verification of Operational Forecasts; WMO-No. 485; WMO: Geneva, Switzerland, 2015. [Google Scholar]
  8. Jolliffe, I.T.; Stephenson, D.B. Forecast Verification: A Practitioner’s Guide in Atmospheric Science, 2nd ed.; Wiley-Blackwell: Chichester, UK, 2012. [Google Scholar]
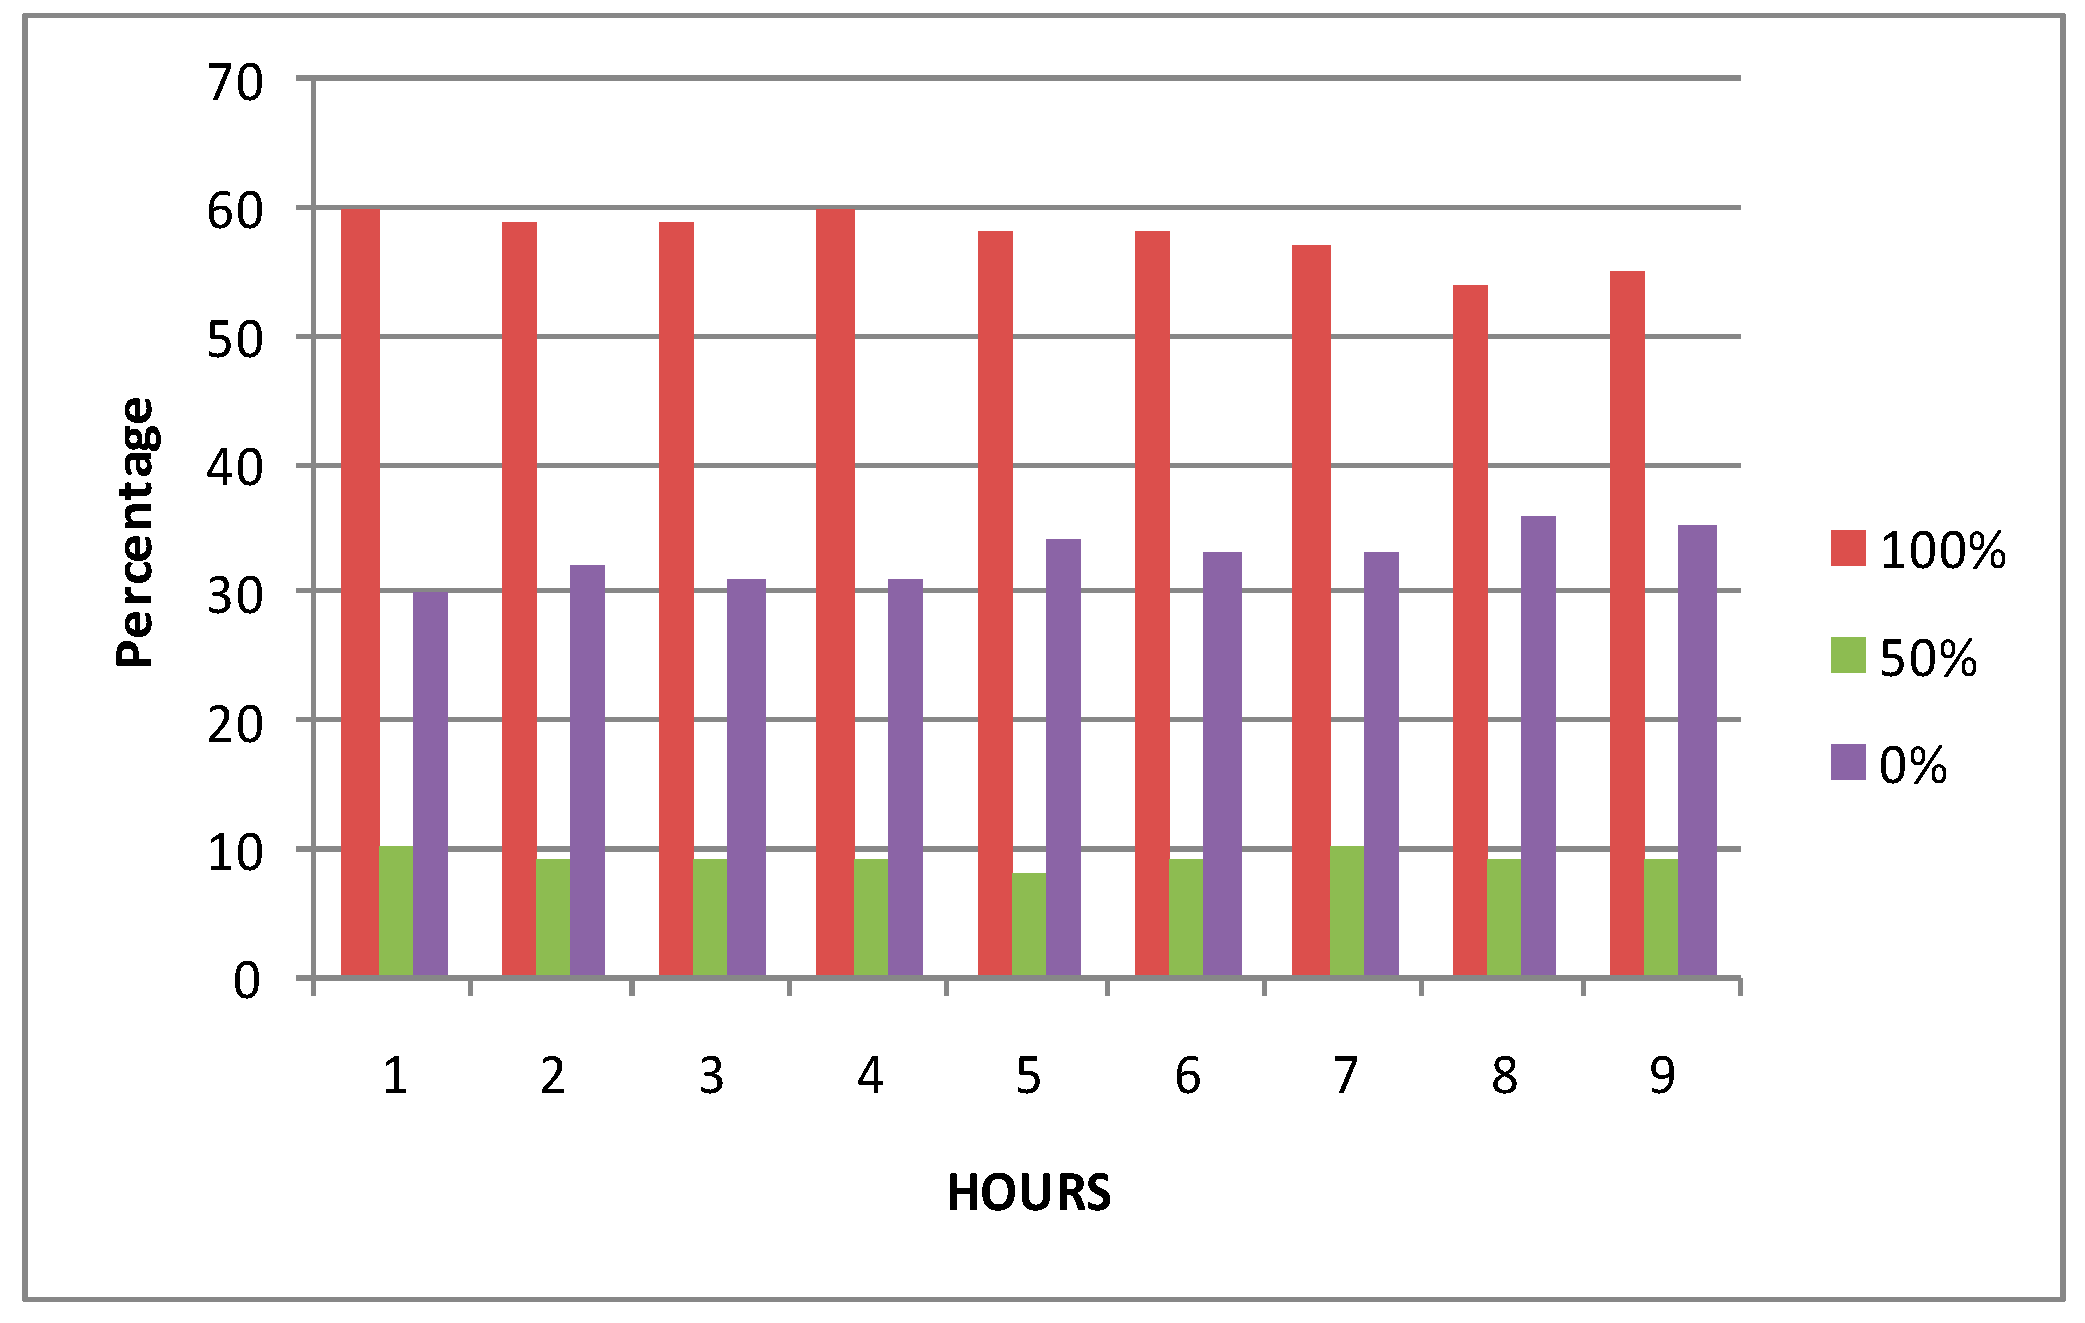
Figure 1. Wind direction verification for each forecast TAF hour. The y axis is the percentage of TAFs that scored 100%, 50%, and 0% success.
Eesp 35 00030 g001
Table 1. Indicative TAF/METAR phenomena correspondence: The left column lists the phenomenon predicted in the TAF. The right column lists the phenomena that are considered “correct” if observed in a METAR when the phenomenon in the left column was forecast.
TAFMETAR
RA (Rain)RA
RATSRA (Thunderstorm-Rain)
RASHRA(Shower Rain)
RADZ(Drizzle)
TSRATSRA
TSRASHRA
TSRATS
SHRARA
SHRATSRA
SHRASHRA
SN (Snow)SN
SNSNRA (Snow Rain)
Table 2. Visibility categories.
CategoryMeters
19999= >5000
25000= >3000
33000= >1500
41500= >800
5800= >600
6600= >350
7350= >150
8150= >000
Table 3. Statistical Scores for RA/SHRA and TSRA for all TAFs.
ScoreRA/SHRATSRA
Frequency Bias (FBI)1.53.2
Probability of Detection (POD)0.710.88
False Alarm Rate (FAR)0.540.73
Equitable Threat Score (ETS)0.240.22
Accuracy0.750.86
Heidke Skill Score (HSS)0.40.36
Disclaimer/Publisher’s Note: The statements, opinions and data contained in all publications are solely those of the individual author(s) and contributor(s) and not of MDPI and/or the editor(s). MDPI and/or the editor(s) disclaim responsibility for any injury to people or property resulting from any ideas, methods, instructions or products referred to in the content.