
Assessing the Environmental and Economic Footprint of Leakages in Water Distribution Networks †

 , , and
Abstract
1. Introduction
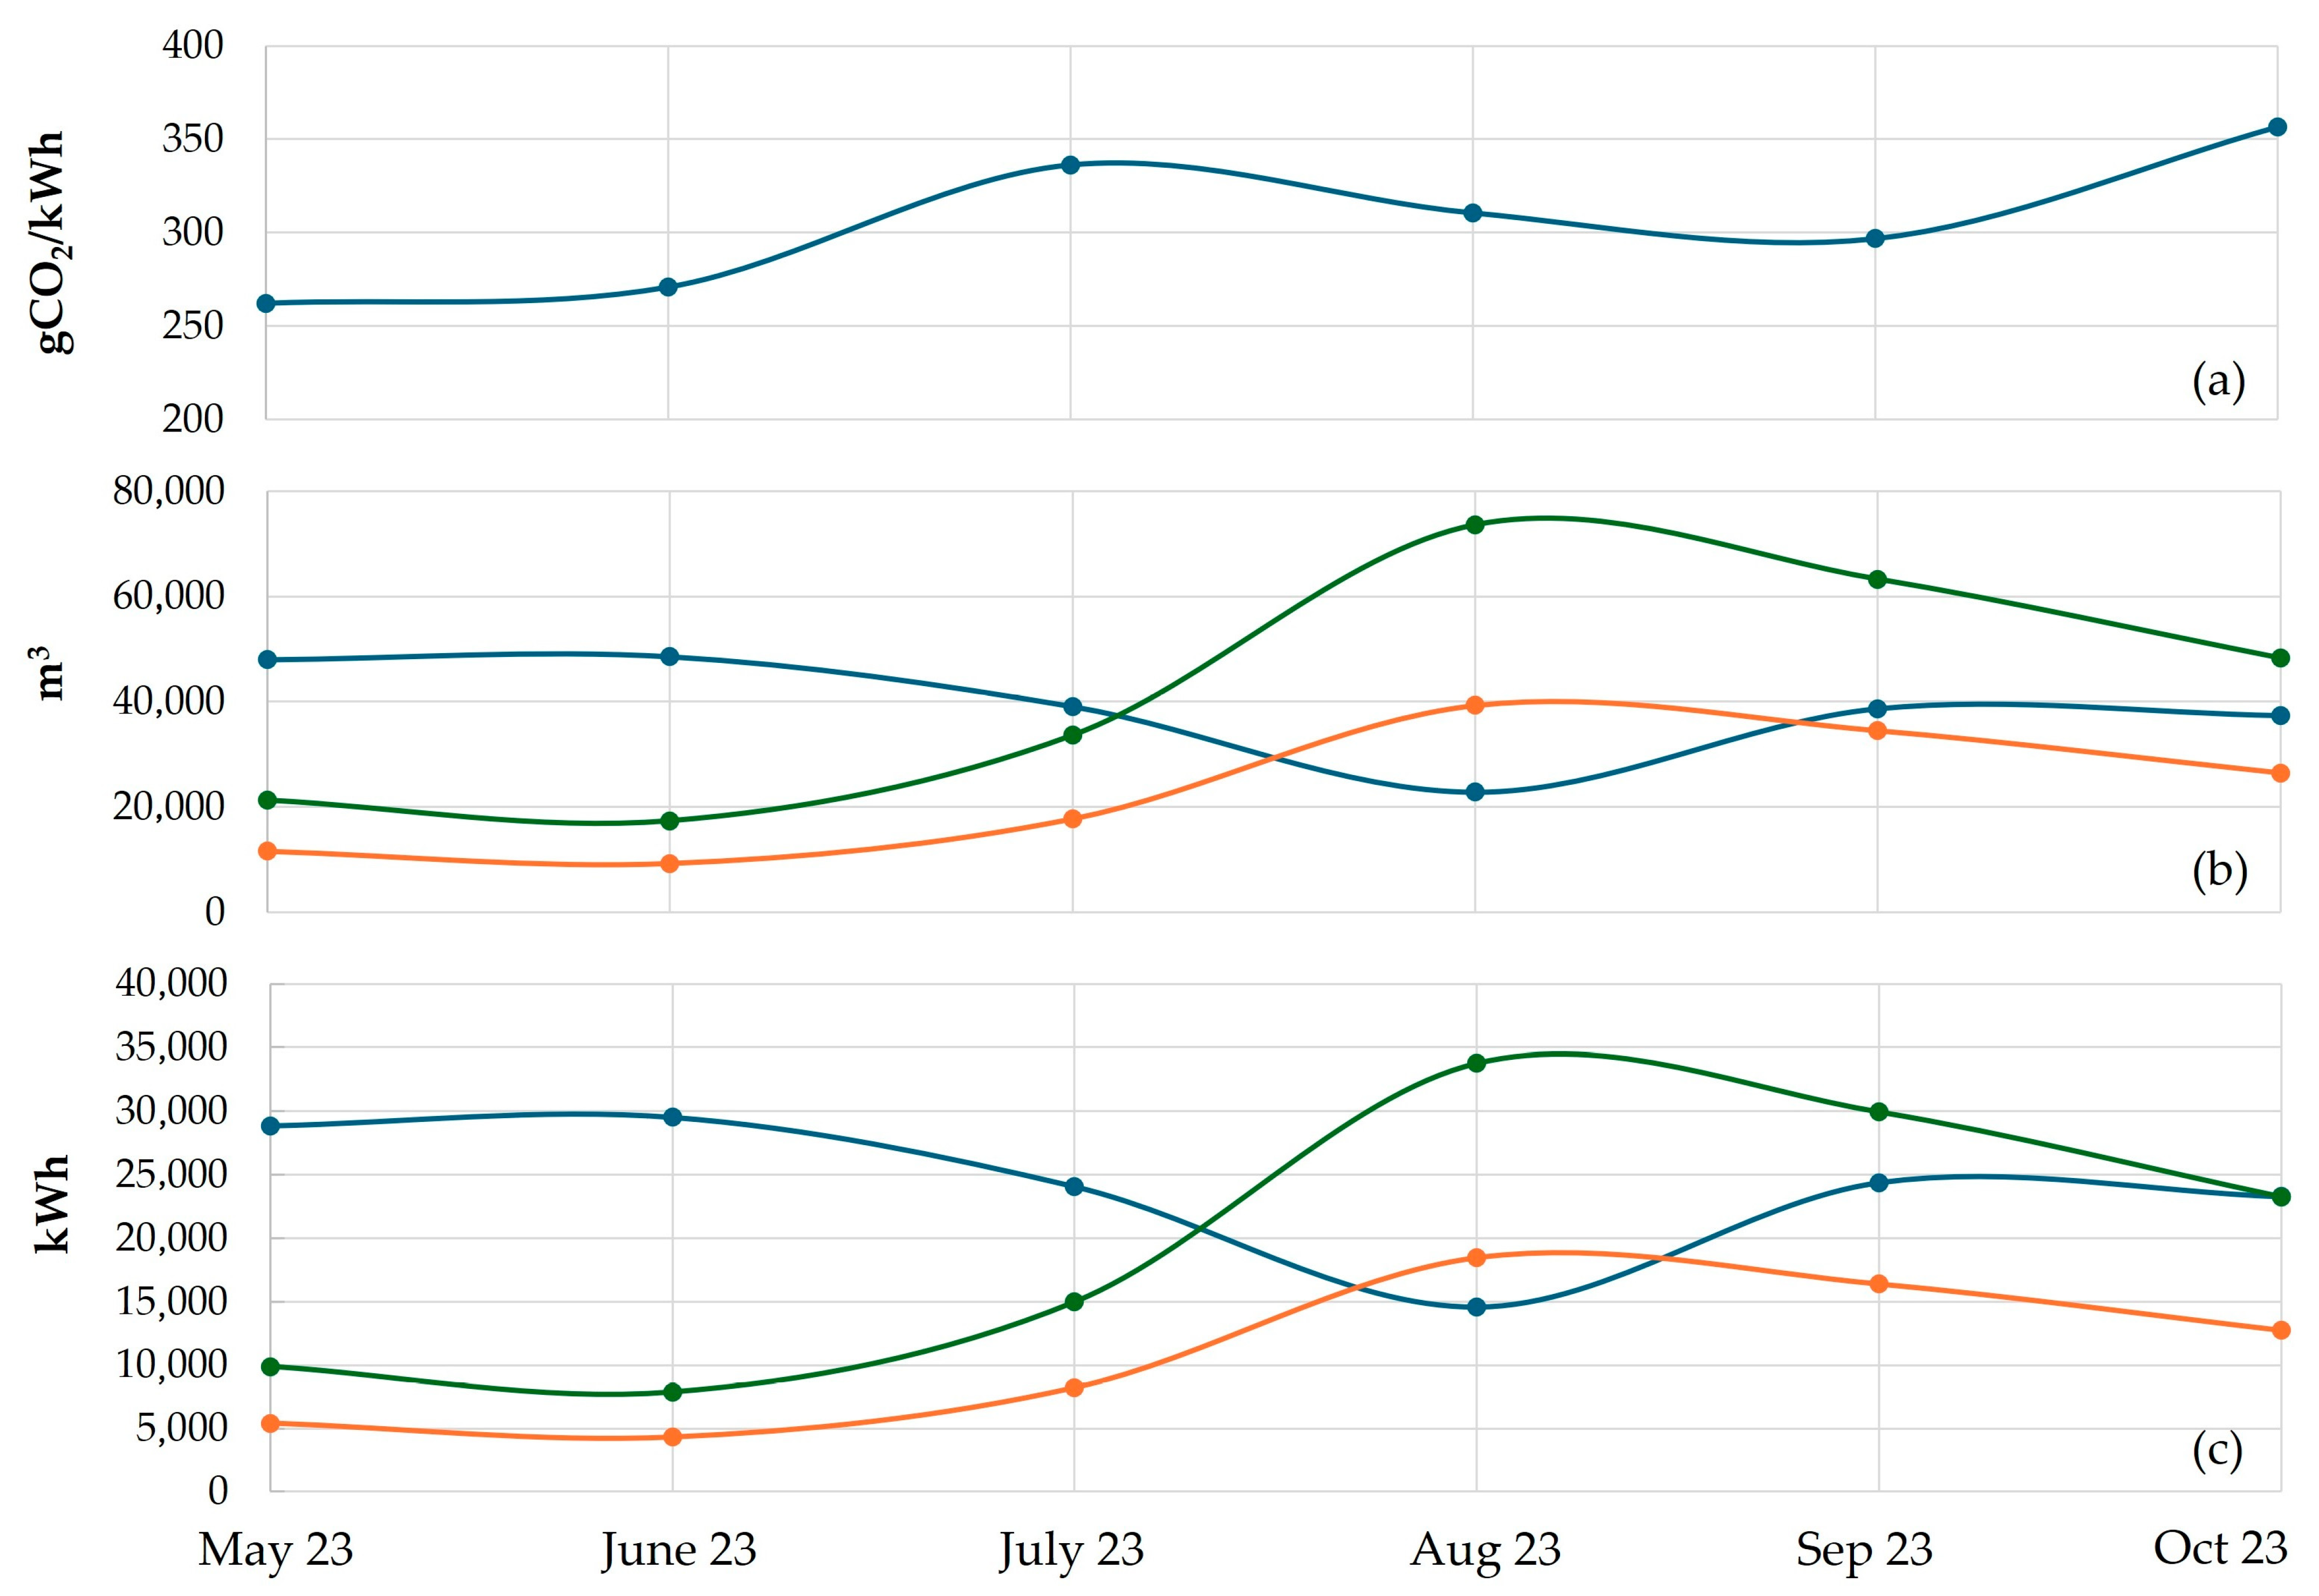
2. Data and Area of Application
3. Methods
3.1. Monthly Energy Consumption Estimation
3.2. CO2 Emmisions per Kilowatt-Hour (kWh) of Electricity Production
3.3. Hierarchical Clustering of WDNs
- Water Balance and Leakage Estimation
- 2.
- Hydraulic Model and Demand Distribution
- 3.
- Initial Hydraulic Resilience Assessment
- 4.
- Clustering and Solution Selection
4. Results
5. Conclusions
Author Contributions
Funding
Institutional Review Board Statement
Informed Consent Statement
Data Availability Statement
Conflicts of Interest
References
- Lambert, A. International Report: Water losses management and techniques. Water Supply 2002, 2, 1–20. [Google Scholar] [CrossRef]
- Zhang, K.; Li, X.; Zheng, D.; Zhang, L.; Zhu, G. Estimation of global irrigation water use by the integration of multiple satellite observations. Water Resour. Res. 2022, 58, e2021WR030031. [Google Scholar] [CrossRef]
- Lambert, A.; Lalonde, A. Using practical predictions of Economic Intervention Frequency to calculate Short-run Economic Leakage Level, with or without Pressure Management. In Proceedings of the IWA Specialised Conference ‘Leakage 2005’, Halifax, NS, Canada, 12–14 September 2005; Available online: https://www.leakssuitelibrary.com/wp-content/uploads/2020/11/LambertLalondeHalifaxSep2005.pdf (accessed on 31 January 2025).
- Liemberger, R.; Wyatt, A. Quantifying the global non-revenue water problem. Water Supply 2018, 19, 831–837. [Google Scholar] [CrossRef]
- Pearson, D.; Trow, S. Calculating economic levels of leakage. In Proceedings of the IWA Water Loss 2005 Conference, Halifax, NS, Canada, 12–14 September 2005; Available online: https://www.researchgate.net/publication/237713600_Calculating_Economic_Levels_of_Leakage (accessed on 31 January 2025).
- Serafeim, A.V.; Fourniotis, N.T.; Deidda, R.; Kokosalakis, G.; Langousis, A. Leakages in Water Distribution Networks: Estimation Methods, Influential Factors, and Mitigation Strategies—A Comprehensive Review. Water 2024, 16, 1534. [Google Scholar] [CrossRef]
- Serafeim, A.V. Probabilistic Modeling and Optimization of Leakages in Water Distribution Networks. Ph.D. Thesis, Department of Civil Engineering, University of Patras, Patra, Greece, 2022. [Google Scholar] [CrossRef]
- Xi, F.; Liu, L.; Shan, L.; Liu, B.; Qi, Y. Pipeline Leak Identification and Prediction of Urban Water Supply Network System with Deep Learning Artificial Neural Network. Water 2024, 16, 2903. [Google Scholar] [CrossRef]
- Farah, E.; Shahrour, I. Use of Data-Driven Methods for Water Leak Detection and Consumption Analysis at Microscale and Macroscale. Water 2024, 16, 2530. [Google Scholar] [CrossRef]
- Galiatsatou, P.; Ganoulis, P.; Malamataris, D.; Prinos, P. Estimating and Reducing Leakages in the Water Distribution Networks of Small Settlements: The Case of Agios Germanos in the Prespes Municipality. Water 2024, 16, 2127. [Google Scholar] [CrossRef]
- Wu, W.; Pan, X.; Kang, Y.; Xu, Y.; Han, L. To Feel the Spatial: Graph Neural Network-Based Method for Leakage Risk Assessment in Water Distribution Networks. Water 2024, 16, 2017. [Google Scholar] [CrossRef]
- Joseph, K.; Shetty, J.; Sharma, A.K.; van Staden, R.; Wasantha, P.L.P.; Small, S.; Bennett, N. Leak and Burst Detection in Water Distribution Network Using Logic- and Machine Learning-Based Approaches. Water 2024, 16, 1935. [Google Scholar] [CrossRef]
- Alsanad, A.H.; Bin Mahmoud, A.A.; Aljadhai, S.I. An Optimal Upgrading Framework for Water Distribution Systems Operation. Water 2024, 16, 1737. [Google Scholar] [CrossRef]
- Serafeim, A.V.; Kokosalakis, G.; Deidda, R.; Fourniotis, N.T.; Langousis, A. Combining Statistical Clustering with Hydraulic Modeling for Resilient Reduction of Water Losses in Water Distribution Networks: Large Scale Application Study in the City of Patras in Western Greece. Water 2022, 14, 3493. [Google Scholar] [CrossRef]
- Ávila, C.A.M.; Sánchez-Romero, F.J.; López-Jiménez, P.A.; Pérez-Sánchez, M. Improve leakage management to reach sustainable water supply networks through by green energy systems. Optimized case study. Sustain. Cities Soc. 2022, 83, 103994. [Google Scholar] [CrossRef]
- Żywiec, J.; Szpak, D.; Piegdoń, I.; Boryczko, K.; Pietrucha-Urbanik, K.; Tchórzewska-Cieślak, B.; Rak, J. An Approach to Assess the Water Resources Reliability and Its Management. Resources 2023, 12, 4. [Google Scholar] [CrossRef]
- Cansu, B.; Mahmut, F.; Abdullah, A. Development of a new comprehensive framework for the evaluation of leak management components and practices. AQUA—Water Infrastruct. Ecosyst. Soc. 2022, 71, 642–663. [Google Scholar] [CrossRef]
- Cristiano, E.; Biddau, P.; Delogu, A.; Gandolfi, N.; Deidda, R.; Viola, F. Automatic Detection of Water Consumption Temporal Patterns in a Residential Area in Northen Italy. Water Resour Manag. 2024, 38, 6213–6228. [Google Scholar] [CrossRef]
- Seyed, G.R.; Sara, N.; Mehdi, G. Optimal consequence management of pollution intrusion into water distribution networks considering demand variation and pipeline leakage: A case study. J. Hydroinform. 2023, 25, 2177–2194. [Google Scholar] [CrossRef]
- Serafeim, A.V.; Kokosalakis, G.; Deidda, R.; Fourniotis, N.T.; Langousis, A. Large-scale application of a statistically rigorous and user unbiased algorithmic approach for reduction of leakages in the water distribution networks. In Proceedings of the AGU Fall Meeting 2022, Chicago, IL, USA, 12–16 December 2022. [Google Scholar]
- Public Power Corporation. Monthly Data for CO2 Emissions; Public Power Corporation: Athens, Greece, 2024; Available online: https://www.ppcgroup.com/el/omilos-dei/dimosiefseis/miniaia-pliroforiaka-deltia/miniaia-apologistika-stoixeia-gia-ekpompes-co2/ (accessed on 13 January 2025).
- Public Power Corporation. Annual Report 2023; Public Power Corporation: Athens, Greece, 2024; Available online: https://www.ppcgroup.com/media/yndddw43/apologismos-2023-0627-eng.pdf (accessed on 13 January 2025).
- Independent Power Transmission Operator. Monthly Energy Reports. 2023. Available online: https://www.admie.gr/en/market/reports/monthly-energy-balance?since=01.01.2023&until=31.12.2023&op=Submit (accessed on 13 January 2025).
- Serafeim, A.V. Statistical Estimation of Water Losses in the Water Distribution Network (WDN) of the City of Patras. Master’s Thesis, Department of Civil Engineering, University of Patras, Patra, Greece, 2018; p. 275. [Google Scholar]
- Serafeim, A.V.; Kokosalakis, G.; Deidda, R.; Karathanasi, I.; Langousis, A. Probabilistic estimation of minimum night flow in water distribution networks: Large-scale application to the city of Patras in western Greece. Stoch. Environ. Res. Risk Assess. 2021, 36, 643–660. [Google Scholar] [CrossRef]
- Serafeim, A.V.; Kokosalakis, G.; Deidda, R.; Karathanasi, I.; Langousis, A. Probabilistic framework for the parametric modeling of leakages in water distribution networks: Large scale application to the City of Patras in Western Greece. Stoch. Environ. Res. Risk Assess. 2022, 36, 3617–3637. [Google Scholar] [CrossRef]
- Serafeim, A.V.; Kokosalakis, G.; Deidda, R.; Karathanasi, I.; Langousis, A. Probabilistic Minimum Night Flow Estimation in Water Distribution Networks and Comparison with the Water Balance Approach: Large-Scale Application to the City Center of Patras in Western Greece. Water 2022, 14, 98. [Google Scholar] [CrossRef]
- Perdios, A.; Kokosalakis, G.; Fourniotis, N.T.; Karathanasi, I.; Langousis, A. Statistical framework for the detection of pressure regulation malfunctions and issuance of alerts in water distribution networks. Stoch. Environ. Res. Risk Assess. 2022, 36, 4223–4233. [Google Scholar] [CrossRef]
- Terrados, J.; Almonacid, G.; Hontoria, L. Regional energy planning through SWOT analysis and strategic planning tools.: Impact on renewables development. Renew. Sustain. Energy Rev. 2007, 11, 1275–1287. [Google Scholar] [CrossRef]
- Meier, P.J. Life-Cycle Assessment of Electricity Generation Systems and Applications for Climate Change Policy Analysis. Ph.D. Thesis, The University of Wisconsin, Madison, WI, USA, 2002. ISBN 9780493760698. Available online: https://ui.adsabs.harvard.edu/abs/2002PhDT.......134M (accessed on 13 January 2025).
- Chuanwang, S.; Dan, D.; Mian, Y. Estimating the complete CO2 emissions and the carbon intensity in India: From the carbon transfer perspective. Energy Policy 2017, 109, 418–427. [Google Scholar] [CrossRef]
- Schestak, I.; Spriet, J.; Styles, D.; Williams, A.P. Introducing a Calculator for the Environmental and Financial Potential of Drain Water Heat Recovery in Commercial Kitchens. Water 2021, 13, 3486. [Google Scholar] [CrossRef]
- Chirinza, N.; Zerpa, F.A.L.; Muguirrima, P.; del Pino García, T.; Rodriguez, G.M.; Gutierrez, C.; Pino, C.A.M. Life-Cycle Analysis of Natural Treatment Systems for Wastewater (NTSW) Applied to Municipal Effluents. Water 2024, 16, 2653. [Google Scholar] [CrossRef]
- Jafari-Asl, J.; Hashemi Monfared, S.A.; Abolfathi, S. Reducing Water Conveyance Footprint through an Advanced Optimization Framework. Water 2024, 16, 874. [Google Scholar] [CrossRef]
- Santos, E.; Albuquerque, A.; Lisboa, I.; Murray, P.; Ermis, H. Economic Assessment of Energy Consumption in Wastewater Treatment Plants: Applicability of Alternative Nature-Based Technologies in Portugal. Water 2022, 14, 2042. [Google Scholar] [CrossRef]
- Rodríguez-Pérez, M.L.; Mendieta-Pino, C.A.; Ramos-Martín, A.; León-Zerpa, F.A.; Déniz-Quintana, F.A. Inventory of Water–Energy–Waste Resources in Rural Houses in Gran Canaria Island: Application and Potential of Renewable Resources and Mitigation of Carbon Footprint and GHG. Water 2022, 14, 1197. [Google Scholar] [CrossRef]
- Goliopoulos, N.; Mamais, D.; Noutsopoulos, C.; Dimopoulou, A.; Kounadis, C. Energy Consumption and Carbon Footprint of Greek Wastewater Treatment Plants. Water 2022, 14, 320. [Google Scholar] [CrossRef]
- Serafeim, A.V.; Perdios, A.; Fourniotis, N.T.; Langousis, A. Towards More Efficient Hydraulic Modeling of Water Distribution Networks Using the EPANET Software Engine. Environ. Sci. Proc. 2023, 25, 46. [Google Scholar] [CrossRef]
- Deidda, R.; Hellies, M.; Langousis, A. A critical analysis of the shortcomings in spatial frequency analysis of rainfall extremes based on homogeneous regions and a comparison with a hierarchical boundaryless approach. Stoch. Environ. Res. Risk Assess. 2021, 35, 2605–2628. [Google Scholar] [CrossRef]
- Scarlat, N.; Prussi, M.; Padella, M. Quantification of the carbon intensity of electricity produced and used in Europe. Appl. Energy 2022, 305, 117901. [Google Scholar] [CrossRef]


| Pumping Station | Prior to Clustering | Post-Clustering | ||||
|---|---|---|---|---|---|---|
| Lost Water (m3) | tCO2 | EUR | Lost Water (m3) | tCO2 | EUR | |
| Karnavalika | 140,723 | 26.24 | 63,325 | 70,362 | 13.12 | 31,662 |
| Glafkos 1 | 55,550 | 8.21 | 24,998 | 38,885 | 5.74 | 17,498 |
| Glafkos 2 | 102,940 | 14.98 | 46,322 | 61,764 | 8.99 | 27,793 |
Disclaimer/Publisher’s Note: The statements, opinions and data contained in all publications are solely those of the individual author(s) and contributor(s) and not of MDPI and/or the editor(s). MDPI and/or the editor(s) disclaim responsibility for any injury to people or property resulting from any ideas, methods, instructions or products referred to in the content. |
© 2025 by the authors. Licensee MDPI, Basel, Switzerland. This article is an open access article distributed under the terms and conditions of the Creative Commons Attribution (CC BY) license (https://creativecommons.org/licenses/by/4.0/).
Share and Cite
Serafeim, A.V.; Perdios, A.; Fourniotis, N.T.; Kokosalakis, G.; Langousis, A. Assessing the Environmental and Economic Footprint of Leakages in Water Distribution Networks. Environ. Earth Sci. Proc. 2025, 32, 6. https://doi.org/10.3390/eesp2025032006
Serafeim AV, Perdios A, Fourniotis NT, Kokosalakis G, Langousis A. Assessing the Environmental and Economic Footprint of Leakages in Water Distribution Networks. Environmental and Earth Sciences Proceedings. 2025; 32(1):6. https://doi.org/10.3390/eesp2025032006
Chicago/Turabian StyleSerafeim, Athanasios V., Anastasios Perdios, Nikolaos Th. Fourniotis, George Kokosalakis, and Andreas Langousis. 2025. "Assessing the Environmental and Economic Footprint of Leakages in Water Distribution Networks" Environmental and Earth Sciences Proceedings 32, no. 1: 6. https://doi.org/10.3390/eesp2025032006
APA StyleSerafeim, A. V., Perdios, A., Fourniotis, N. T., Kokosalakis, G., & Langousis, A. (2025). Assessing the Environmental and Economic Footprint of Leakages in Water Distribution Networks. Environmental and Earth Sciences Proceedings, 32(1), 6. https://doi.org/10.3390/eesp2025032006