Proceeding Paper

Nature-Based Solutions Applied in Urban Drainage Systems: A Case Study Using GIS-Based Hydrological Modeling †

by
Lineker Max Goulart Coelho
Department of Engineering Technology, Technical University of Denmark—DTU, 2750 Ballerup, Denmark
Presented at the 8th International Electronic Conference on Water Sciences, Online, 14–16 October 2024.
Environ. Earth Sci. Proc. 2025, 32(1), 2; https://doi.org/10.3390/eesp2025032002
Published: 24 January 2025
(This article belongs to the Proceedings of The 8th International Electronic Conference on Water Sciences)

Abstract

:
This work aims to show a streamlined framework to assess Nature-based Solution (NbS) scenarios in stormwater management. Different scenarios for NbS were assessed using computational modeling to estimate the extension of flooded areas. Scenario 1 represents the current situation with no NbS implemented, Scenario 2 increased vegetation cover, Scenario 3 used linear gardens, and Scenario 4 rain gardens. Hydrological modeling combined Georeferenced Information System (GIS) and flooding spot analysis. Scenarios 3 and 4 were able to avoid flooding, with almost no flooding spots. The results indicate that the proposed assessment framework was an efficient way to compare different scenarios for stormwater management.

1. Introduction

Nature-Based Solutions (NbS) consist of applying a systemic method for the maintenance, improvement, and renewal of biodiversity and ecosystem services in urban areas, supporting urban resilience in the water sector [1]. Indeed, NbS were created to mitigate the effects of urbanization on the hydrological behavior of the basin, along with the promotion of technologies that minimize the use of natural resources and focus on environmental preservation and biodiversity enhancement [2,3,4,5]. According to [6], NbS can be defined as actions implemented to protect and restore natural or modified ecosystems enabling the mitigation of social challenges in an effective and adaptative way, being beneficial at the same time to human well-being and biodiversity. Currently, there are numerous types of NbS, such as constructed wetlands [7], green roofs [8], rain gardens [9], flowerbeds [10], green walls [11], etc.
However, as pointed out by [12], NbSs have not yet become a largely used practice. Indeed, even if NbSs are a potential alternative to be used in flooding mitigation, there are challenges in how to include such solutions in the design of stormwater drainage systems in terms of modeling. For [13], NbS modeling is supportive in both quantifying the hydrologic impact of potential NbS and in prioritizing NbS location. By the way, there are already several different models that are highly advanced in physics [14,15,16], and their complexity and the amount of input data they require can be a barrier to their widespread use in the preliminary screening of NbSs through comparative scenarios.
In this context, GIS-based tools can support hydrological modeling. In fact, these tools facilitate the inclusion of spatially differentiated site characteristics, such as topography, soil properties, land cover, and other relevant aspects important to simulate watershed hydrological processes. Indeed, GIS-based hydrological simulations can be a potential solution for a streamlined scenario assessment of NbS alternatives. So, this work aims to present a case study in which NbS scenarios were tested using a computational modeling framework based on the Georeferenced Information System (GIS) and hydrological analysis to identify flooded areas.

2. Material and Methods

2.1. Streamlined Simulation Framework

The proposed framework described aims to provide a simplified way to enable the assessment of different NbS technologies, going beyond a simple technical comparison of NbS one to each other based only on a generic description of each technology. As NbS performance is highly dependent on hydrological processes and physical characteristics of the area, the purpose of this paper is to describe a streamlined step-by-step process that enables a simplified NbS case study simulation using GIS-based tools using spatially differentiated soil and land cover properties. Figure 1 presents the steps proposed by the recommended NbS screening process which will be validated in a case study.

2.2. Hydrologic Modeling

In this study, a static (non-dynamic) hydrological analysis was used, i.e., the simulations considered the mass balance of rain dropping in the catchment area combined with other hydrological processes without taking into account time-related effects, such as rain intensity variation over time or water runoff flow duration. These assumptions are commonly adopted in small-scale watersheds, such as those used in this case study, which cannot be the case for larger watersheds for which temporal differentiation and dynamic analysis are recommended. So, the focus of the analysis is on the flooded area and volume of flooded water, and due to the nature of the model used, time-related indicators such as the duration of the inundation were not determined. The Scalgo software version 2024 [17] was used, which combines Georeferenced Information System (GIS) tools with flood spot analysis, based on the amount of precipitation, the local topography, and the estimate of infiltrated water, land cover, and land use. The analysis of flood spots was carried out based on a rainfall event, resulting in a total precipitation of 50 mm. This value was chosen as it corresponds to the maximum rainfall before the area under study starts to overflow downstream. So, 50 mm is a critical condition in terms of flooding, as higher rainfalls do not impact the extension and the depth of the flooded area.
In order to complement the flood spot analysis, rainfalls of 25, 30, 40 mm, and 50 mm were applied to each scenario in order to check the sensitivity of the results, which corresponds to extreme rains with a 10-year return period with durations of 60, 90, 360, and 720 min, respectively, according to [18]. Water infiltration into the soil was estimated in Scalgo based on the type of soil and type of coverage (paved or natural) using Horton’s equation [19].

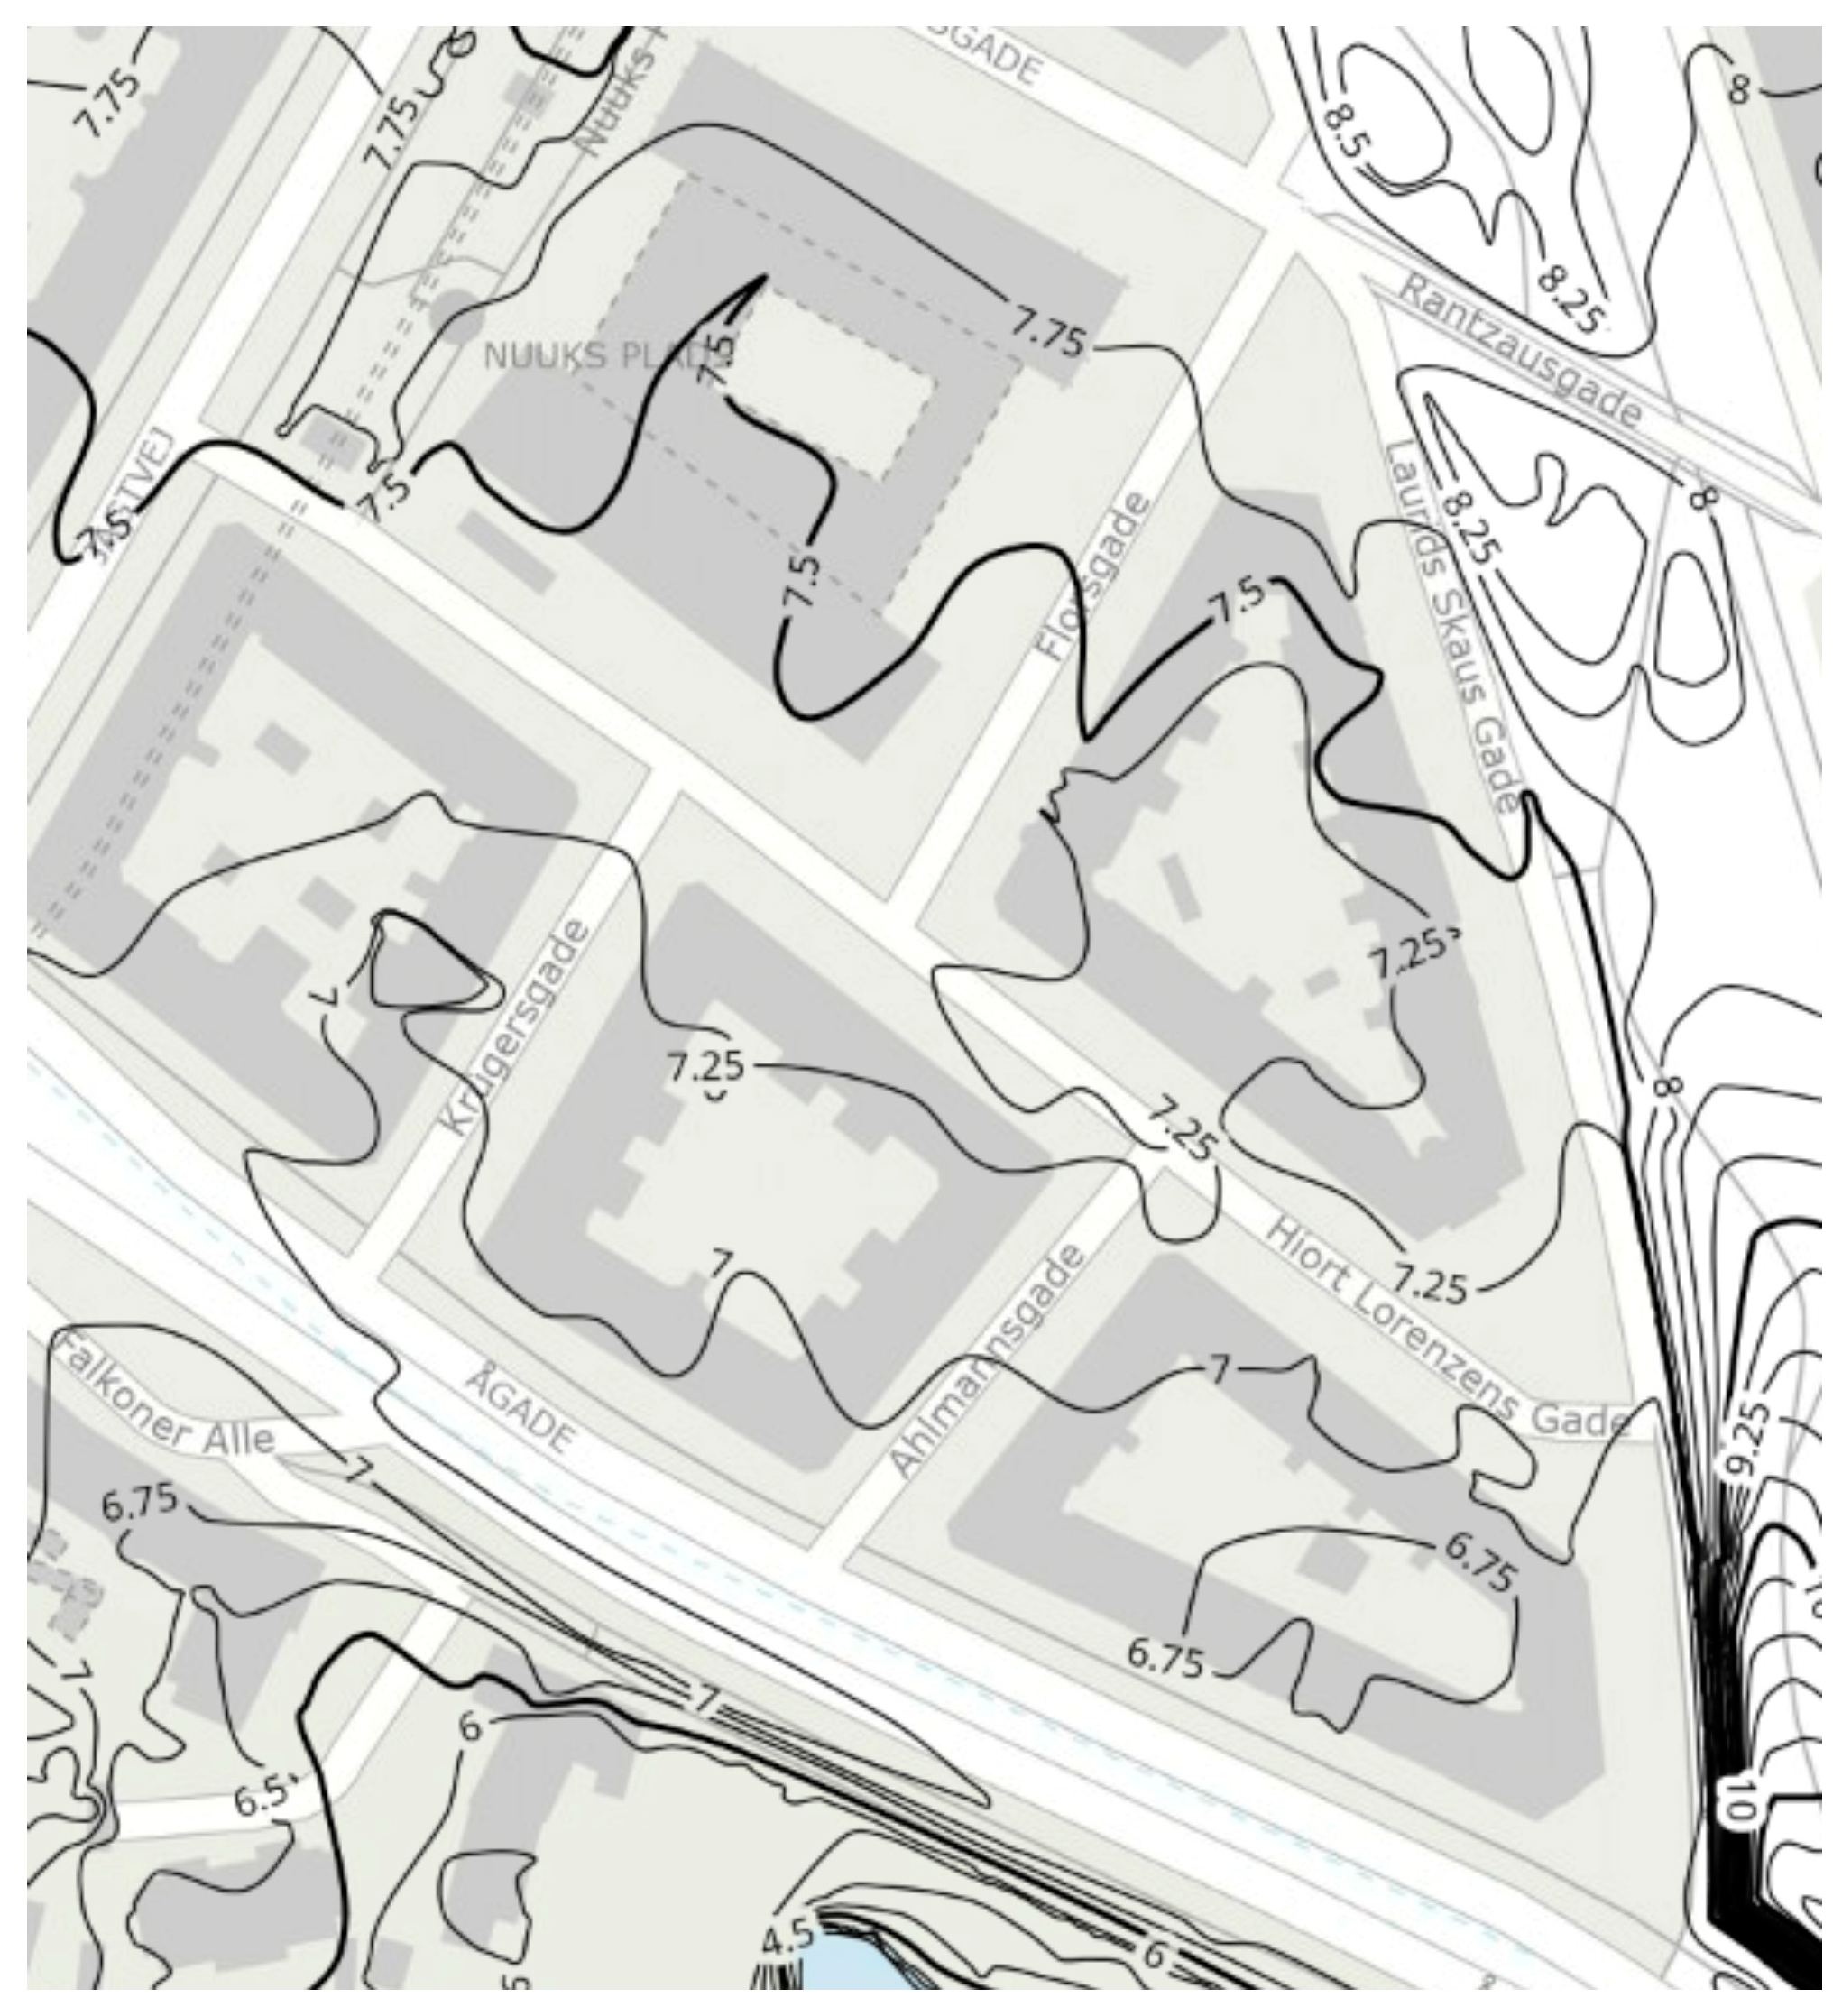
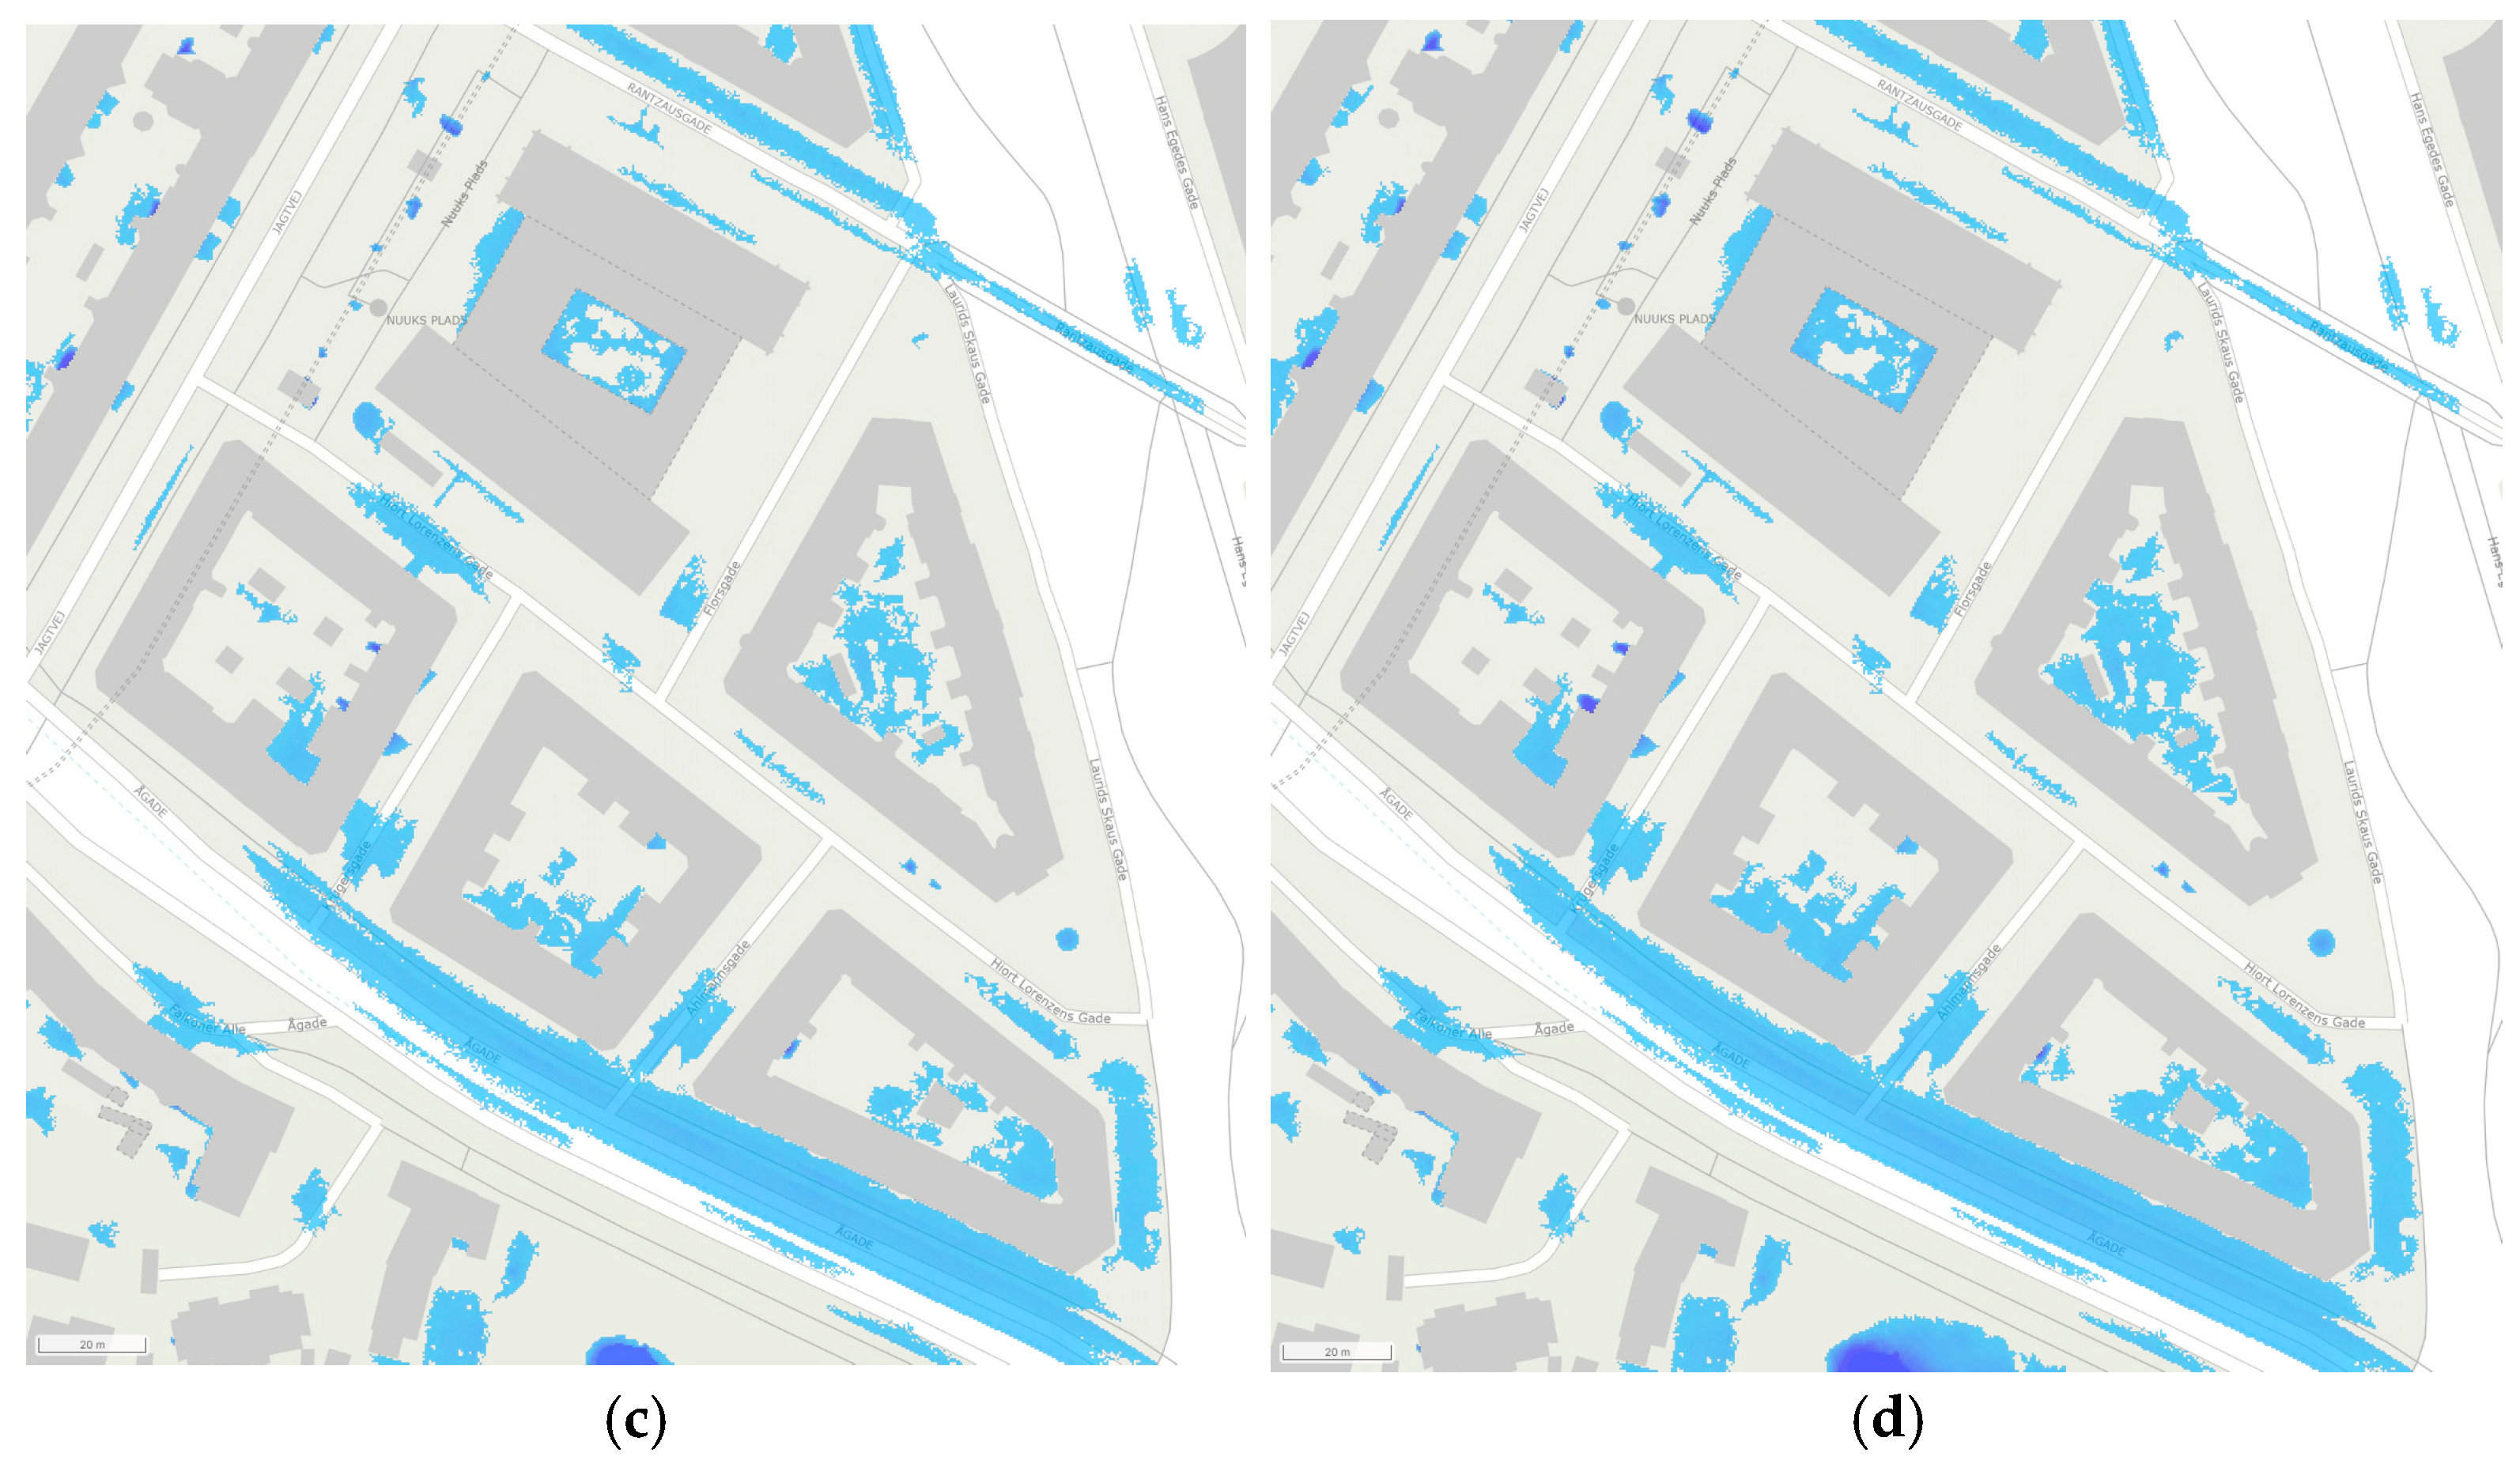
2.3. Description of the Case Study

The case study is an urban area in the city of Frederiksberg, a municipality located in Denmark’s Sjælland region, and it is part of the greater Copenhagen. Frederiksberg has a population of about 100,000 inhabitants, and occupies an area of 8.7 km2 [20].
On 2 July 2011, the great Copenhagen region was reached by a cloudburst which resulted in many flooded areas [21,22]. During this event, a rainfall of about 50 mm in 30 min and almost 120 mm after 3 h was registered [23]. This event flooded several streets, basements, and ground-floor apartments in the great Copenhagen region, causing an estimated damage of more than DKK 3 billion [24], which corresponds to almost EUR 400 million.
Particularly, the area in which the application of NbS was assessed is a densified area with a high degree of impermeable land cover and a mostly flat topography. By the way, in the aforementioned rain event of 2 July 2011, this area was completely flooded, which is why it was chosen as the case study to be studied in this paper. In fact, the main street in the case study area is called Ågade and it is in the lower portion of the watershed, being a critical point for two reasons: on the one hand, it has a high flow of vehicles and people. On the other hand, in terms of flooding, this street corresponds to the region that receives the runoff of the upstream areas of the watershed. In terms of land cover, the catchment area is about 6.7 ha, with 85% of impermeable surfaces and 15% of surfaces with vegetation cover. Figure 2 shows a topographic plan for the case study area.
In terms of drainage infrastructure, this area has a conventional stormwater system that collects water from the streets using gutters that direct the flow to the inlets of the piping collection network. Details about the dimensions and capacity of the pipe network were not available. To overcome this lack of information, it was assumed that the system is capable of supporting a 10-year rain with a duration of 10 min, which corresponds to the design criteria adopted in Denmark [25,26]. This assumption represents a limitation in this study, but enables us to carry out an overall analysis of the potential of NbS, which needs to be further investigated before application. This design criteria leads to a rain intensity of 23 μm/s according to [18], corresponding to a total rainfall of 14 mm, which was assumed as the capacity of the existing system.

2.4. Description of the NbS Scenarios

Different scenarios for Nature-based Solutions were considered as a potential solution to mitigate flooding. Scenario 1 is the reference scenario and corresponds to the current configuration of the case study area, where there is no NbS installed.
Scenario 2 consisted of increasing areas of vegetation cover. In this scenario, the impervious surfaces of public areas in local roads were partially replaced by vegetation cover on the sidewalks, which resulted in an increase in the green land cover, changing from 15% to 21% of the total area of the watershed.
Scenario 3, in turn, consisted of infiltration trenches below linear gardens located along the sidewalks and designed following the recommendations from [27]. In this scenario, the infiltration trenches were standardized with depths of 1.5 m and 50 cm wide, allowing the temporary storage of water and infiltration, and were arranged in the areas indicated in Figure 3a. The linear gardens have a total extension of 800 m. It was assumed that trenches have a porosity of 30%, being filled with gravel with an average size of 20 mm.
Scenario 4 was based on the use of rain gardens, arranged in the middle and at the ends of the block’s length, as shown in Figure 3b. They were also designed following the recommendations from [27], with a depth of 50 cm and a width varying between 2 m and 5 m depending on the available space. A total of 39 rain gardens were distributed in the area, and they occupied a total area of about 1300 m2.

3. Results and Discussion

Figure 4 shows the flooded spot on the main road considering the reference scenario (Scenario 1), that is, the current condition of the area under study when a rainfall event of 25, 30, 40, and 50 mm of precipitation occurs. It is possible to see that in all the cases flooded areas mainly occur in the area close to the main street.
It is important to highlight that an increase in the flooded volume is easily observed from Figure 4a–d, with a maximum volume reached of 286 m3, for 50 mm rainfall. This maximum value does not change for rainfalls above 50 mm, because when 286 m3 is reached, the water level is high enough to start overflowing towards a depression located downstream. These results agree with the flooded areas observed in real events. Indeed, the flooded region shown in Figure 4c,d coincides with the main area affected by the flood observed in the extreme rain event that occurred on 2 July 2011. It is important to outline that due to the lack of scientific or technical reports providing accurate data on the inundation that occurred on 2 July 2011, a comparison between the model results and the real flooded area was performed qualitatively by comparing the flooded areas observed in Figure 4 with photos and videos that circulated from media channels at the time of the event.
Table 1 presents the results of the flood spot analysis for the three NbS scenarios investigated for different rainfall values. Focusing on 50 mm, the highest rainfall simulated, Scenario 1 reached a total volume of flood equal to 286 m3. For the same rainfall, Scenario 2 was not able to improve the volume of the flooded area in the main street compared to the base scenario. Scenarios 3 and 4, in turn, resulted in a significant reduction in flooding volume: Scenario 3 basically eliminated flooded areas, whereas Scenario 4 reached a reduction of 93% in the flooding volume.
It is important to note that when the same NbS scenarios are submitted to other rainfall conditions, it can be seen how different the conclusions can be. In fact, as shown in Table 1, for rainfalls of 25, 30, and 40 mm, as expected, the flooded areas were different. For the lowest rainfall values, all the NbS scenarios were able to reduce flooding, the lower performance was reached by Scenario 2 with a reduction of 52%. For 30 mm and 40 mm rainfall, Scenario 2 was not able to provide relevant flooding reduction, whereas Scenarios 3 and 4 showed to be very effective in flooding mitigation for all the rainfalls considered. So, it shows how important is to clearly state in the NbS requirements the level of protection required regarding the precipitation events.
In terms of the case study results, based on the observations of these simulated scenarios, it is possible to see how much the extensive use of NbS can contribute to the management of stormwater in urban areas for the prevention of local flooding, relieving the stormwater drainage system and avoiding inconvenience to pedestrian and vehicle traffic, as well as reducing the risk of accidents and transmission of waterborne diseases. Scenarios 3 and 4 were able to avoid flooding with no flooding spots, showing the benefits of implementing NbSs in the urban landscape.
It is worth highlighting that more important than the case study result itself is the verification of the efficacy of the proposed framework in the comparison of NbSs. Indeed, the recommended conceptual pathway for the fast-track analysis of NbS alternatives showed to be an interesting approach for scenario comparisons of such technologies, enabling us to compare NbSs not only in terms of a generic description of characteristics but also using hydrological simulations taking into account the local conditions of the potential place where the NbS can be located. Indeed, the area occupied by the NbS, as well as the rainfall used in the analysis, can play an important role in the comparison of different scenarios.
So, from the results it can be seen that the proposed assessment framework using GIS-based hydrological modeling was a streamlined way to compare different NbS scenarios for stormwater management, enabling us to incorporate local specificities and hydrological simulations in preliminary NbS screening.

4. Conclusions

This work presented a streamlined GIS-based framework to support the hydrological modeling assessment of the effect of NbSs to prevent flooding due to stormwater runoff in a central urban area. Different scenarios were compared as a case study to identify the potential use of different NbS to mitigate flooding. From the results, it is possible to see that all the scenarios using NbSs resulted in a much better situation than the reference scenarios representing the current system. These results outline how valuable the widespread use of NbSs can be in supporting more sustainable stormwater management in cities, showing it to be an essential part of urban infrastructure towards climate adaptation.
In terms of the proposed approach for testing NbSs, the case study provided in this paper gives an example of how to use a streamlined GIS-based framework to support hydrological analysis in urban areas, being an essential aspect to be included in the assessment of NbS scenarios as well as of other potential solutions aimed at to be evaluated for flooding mitigation. So, it is expected that the suggested step-by-step framework can be supportive not only to researchers assessing NbSs, but also to engineers and urban planners aiming to evaluate the potential benefits of the implementation of NbS having a robust approach for fast-track preliminary comparisons.
It is important to note that the approach presented can be implemented using not only the software adopted in this case study but also any other similar GIS tools that can combine spatial land characterization with hydrological analysis. For future research, it is recommended to include dynamic hydraulic modeling in this framework and sensitivity analysis regarding the parameters related to the shape and NbS configurations and the hydrological parameters.

Funding

This research received no external funding.

Institutional Review Board Statement

Not applicable.

Informed Consent Statement

Not applicable.

Data Availability Statement

Data are available upon request by contacting the author.

Conflicts of Interest

The author declares no conflicts of interest. The funders had no role in the design of the study; in the collection, analyses, or interpretation of data; in the writing of the manuscript; or in the decision to publish the results.

References

  1. Beceiro, P.; Brito, R.S.; Galvão, A. Assessment of the contribution of Nature-Based Solutions (NBS) to urban resilience: Application to the case study of Porto. Ecol. Eng. 2022, 175, 106489. [Google Scholar] [CrossRef]
  2. Biswal, B.K.; Bolan, N.; Zhu, Y.G.; Balasubramanian, R. Nature-based Systems (NbS) for mitigation of stormwater and air pollution in urban areas: A review. Resour. Conserv. Recycl. 2022, 186, 106578. [Google Scholar] [CrossRef]
  3. Sowińska-Świerkosz, B.; García, J. What are Nature-based solutions (NBS)? Setting core ideas for concept clarification. Nat.-Based Solut. 2022, 2, 100009. [Google Scholar] [CrossRef]
  4. Lafortezza, R.; Chen, J.; Van Den Bosch, C.K.; Randrup, T.B. Nature-based solutions for resilient landscapes and cities. Environ. Res. 2018, 165, 431–441. [Google Scholar] [CrossRef] [PubMed]
  5. Maes, J.; Jacobs, S. Nature-based solutions for Europe’s sustainable development. Conserv. Lett. 2017, 10, 121–124. [Google Scholar] [CrossRef]
  6. Naumann, S.; Burgos Cuevas, N.; Davies, C.; Bradley, S.; Mahmoud, I.H.; Arlati, A. Harnessing the Power of Collaboration for Nature-Based Solutions: New Ideas and Insights for Local Decision-Makers. Publications Office of the European Union, 2023. Available online: https://data.europa.eu/doi/10.2777/954370 (accessed on 13 November 2024).
  7. Coelho, L.M.G. Assessing the effect of local characteristics on environmental impacts of Constructed Wetlands by regionalized life cycle assessment. Ecol. Eng. 2024, 209, 107423. [Google Scholar] [CrossRef]
  8. Mihalakakou, G.; Souliotis, M.; Papadaki, M.; Menounou, P.; Dimopoulos, P.; Kolokotsa, D.; Paravantis, J.A.; Tsangrassoulis, A.; Panaras, G.; Giannakopoulos, E.; et al. Green roofs as a nature-based solution for improving urban sustainability: Progress and perspectives. Renew. Sustain. Energy Rev. 2023, 180, 113306. [Google Scholar] [CrossRef]
  9. Greksa, A.; Blagojević, B.; Grabić, J. Nature-based solutions in Serbia: Implementation of rain gardens in the suburban community Kać. Environ. Process. 2023, 10, 41. [Google Scholar] [CrossRef]
  10. Poje, M.; Židovec, V.; Prebeg, T.; Kušen, M. Does the Use of Perennials in Flower Beds Necessarily Imply Sustainability? Plants 2023, 12, 4113. [Google Scholar] [CrossRef]
  11. Radić, M.; Brković Dodig, M.; Auer, T. Green Facades and Living Walls—A Review Establishing the Classification of Construction Types and Mapping the Benefits. Sustainability 2019, 11, 4579. [Google Scholar] [CrossRef]
  12. International Union for Conservation of Nature and Natural Resources—IUCN. Guidance for Using the IUCN Global Standard for Nature-Based Solutions. A User-Friendly Framework for the Verification, Design and Scaling up of Nature-Based Solutions, 1st ed.; IUCN: Gland, Switzerland, 2020; ISBN 978-2-8317-2061-6. [Google Scholar] [CrossRef]
  13. Brauman, K.A.; Bremer, L.L.; Hamel, P.; Ochoa-Tocachi, B.F.; Roman-Dañobeytia, F.; Bonnesoeur, V.; Arapa, E.; Gammie, G. Producing valuable information from hydrologic models of nature-based solutions for water. Integr. Environ. Assess. Manag. 2022, 18, 135–147. [Google Scholar] [CrossRef]
  14. Kumar, P.; Debele, S.E.; Sahani, J.; Rawat, N.; Marti-Cardona, B.; Alfieri, S.M.; Basu, B.; Basu, A.S.; Bowyer, P.; Charizopoulos, N.; et al. Nature-based solutions efficiency evaluation against natural hazards: Modeling methods, advantages, and limitations. Sci. Total Environ. 2021, 784, 147058. [Google Scholar] [CrossRef] [PubMed]
  15. Guido, B.I.; Popescu, I.; Samadi, V.; Bhattacharya, B. An integrated modelling approach to evaluate the impacts of nature-based solutions of flood mitigation across a small watershed in the southeast United States. Nat. Hazards Earth Syst. Sci. Discuss. 2023, 2023, 2663–2681. [Google Scholar] [CrossRef]
  16. Santos, K.A.; Coelho, L.M.G.; Santos, H.A. Proposal of a new approach to perform advanced flow modeling for subsurface flow treatment wetlands. Water Sci. Technol. 2023, 88, 1155–1177. [Google Scholar] [CrossRef]
  17. Scalgo. Available online: https://scalgo.com/en-US/ (accessed on 13 November 2024).
  18. Aabling, T.; Gabriel, S.; Arnbjerg-Nielsen, K. Dimensionering af LAR-anlæg. Spildevandskomiteens Skrifter (2023). 2023. Available online: https://spildevandskomiteen.dk/dimensionering-lar/ (accessed on 13 November 2024).
  19. Scalgo: Soil Types—Infiltration Properties. Available online: https://scalgo.com/en-US/scalgo-live-documentation/soil-vegetation-atmosphere-properties/soil/properties (accessed on 13 November 2024).
  20. Frederiksberg Kommune. Available online: https://www.frederiksberg.dk/kommunen/forvaltning-og-fakta-om-kommunen/fakta-om-kommunen#befolkningsprognose-83 (accessed on 13 November 2024).
  21. Vejen, F. Tropisk Styrtregn over København d. 2. juli 2011. Alle Danske Monsterregns Moder. Vejret-Tidsskr. Vejr Og Klima 2011, 33. Available online: https://www.yumpu.com/da/document/view/18472388/-tidsskrift-for-vejr-og-klima (accessed on 13 November 2024).
  22. Lindholm, O.; Buhler, L.; Bjerkholt, J. Hva hvis monsterregnet fra København 2. juli 2011 hadde falt i Norge. What If the Monster Rain from Copenhagen on. 2011, Volume 2. Available online: https://vannforeningen.no/wp-content/uploads/2015/06/2013_882444.pdf (accessed on 13 November 2024).
  23. Skybrudssikring af København—Skybrudsopland: Østerbro. Available online: https://kk.sites.itera.dk/apps/kk_pub2/pdf/1189_i4uujk7E4M.pdf (accessed on 13 November 2024).
  24. Dansk Meteorologisk Institut—DMI. July 2—One Year Since the Copenhagen Cloudburst. 2024. Available online: https://www.dmi.dk/nyheder/2012/2-juli-et-aar-siden-det-koebenhavnske-skybrud/ (accessed on 13 November 2024).
  25. Code DS 432; Code of Practice for Sanitary Drainage. Dansk Standard: Copenhagen, Denmark, 2009; 87p.
  26. Spildevandskomiteen. Skrift 27: Funktionspraksis for Afløbssystemer Under Regn; IDA: Copenhagen, Denmark, 2005; 66p, Available online: https://svendborg.cowiplan.dk/media/2936/skrift_27.pdf (accessed on 13 November 2024).
  27. Dansk Teknologisk Institut—DTI. Anvisning for håndtering af regnvand på egen grund Rørcenter-anvisning 016 1. udgave, 1. oplag 2012. ISBN 87-991239-7-5. Available online: https://www.teknologisk.dk/ydelser/roercenter-anvisninger-og-rapporter-fra-roercentret/486 (accessed on 13 November 2024).
Figure 1. Schematics of the proposed framework to test the Nature-based Solution scenarios using a GIS-based hydrological modeling approach.
Eesp 32 00002 g001
Figure 2. Topographic plan of the case study area in Frederiksberg, Denmark.
Eesp 32 00002 g002
Figure 3. Distribution of NbS for Scenarios 3 and 4: (a) infiltration trench and linear garden location for Scenario 3; (b) rain garden location for Scenario 4.
Eesp 32 00002 g003
Figure 4. Flood area for the current condition of the watershed in the case study for three rainfall events: (a) 25 mm; (b) 30 mm: (c) 40 mm; (d) 50 mm.
Eesp 32 00002 g004aEesp 32 00002 g004b
Table 1. Flood spot volume results based on the proposed framework for NbS screening applied in the chosen case study.
ScenarioScenario 1 Scenario 2Scenario 3Scenario 4
NbS used-Increased vegetation coverLinear gardens sRain gardens
Flooded volume for 25 mm rainfall3818 m30 m34 m3
Flooded volume for 30 mm rainfall84 m361 m30 m310 m3
Flooded volume for 40 mm rainfall233 m3195 m30 m319 m3
Flooded volume for 50 mm rainfall286 m3286 m31 m319 m3
Disclaimer/Publisher’s Note: The statements, opinions and data contained in all publications are solely those of the individual author(s) and contributor(s) and not of MDPI and/or the editor(s). MDPI and/or the editor(s) disclaim responsibility for any injury to people or property resulting from any ideas, methods, instructions or products referred to in the content.

