Proceeding Paper

Performance Evaluation of the ERA5, MERRA-2, and PERSIANN-CDR Gridded Products in the Tambo Basin †

by
Cristhian Apaza-Vilca
1,*,
Maria Liz Mamani-Yupanqui
1,* and
Efrain Lujano
1,2,*
1
Escuela Profesional de Ingeniería Agrícola, Universidad Nacional del Altiplano, Puno 21001, Peru
2
Instituto Nacional de Investigación en Glaciares y Ecosistemas de Montaña, Huaraz 02002, Peru
*
Authors to whom correspondence should be addressed.
Presented at the 8th International Electronic Conference on Water Sciences, 14–16 October 2024; Available online: https://sciforum.net/event/ECWS-8.
Environ. Earth Sci. Proc. 2025, 32(1), 17; https://doi.org/10.3390/eesp2025032017
Published: 22 April 2025
(This article belongs to the Proceedings of The 8th International Electronic Conference on Water Sciences)

Abstract

:
Gridded meteorological data help to address the scarcity of data in sparse hydrometeorological networks, but their validation is crucial. This study evaluated the performance of ERA5, MERRA-2, and PERSIANN-CDR gridded products in the Tambo basin, comparing their data with meteorological stations and basin-wide averages using the Pearson correlation coefficient (CC), percent bias (PBIAS), and root mean square error (RMSE). PERSIANN-CDR showed the best performance (CC: 0.84–0.94, PBIAS: 6.90–83.10%, RMSE: 21.97–38.78 mm/month). MERRA-2 underestimated precipitation, while ERA5, despite its high correlation (CC: 0.83–0.94), overestimated it. PERSIANN-CDR is the recommended product for the region, providing a better representation of precipitation for hydrological studies and water resource management.

1. Introduction

Precipitation is a fundamental climatic variable whose variations affect numerous human activities. Understanding its spatial and temporal variability is essential for planning and decision-making, especially to minimize the impacts of extreme events [1]. It has a significant impact on people’s lives and the hydrological cycle, as well as fluctuations that affect water resource management, environmental planning, and disaster mitigation [2]. Its application is crucial for improving the accuracy of hydrological models and predictions [3], thus contributing to a deeper understanding of hydrological balance [4]. However, the insufficient network of rain gauges poses a challenge for accurately estimating the spatial variability of precipitation [5].
Satellite and grid-based data estimates offer an alternative to address data scarcity, although their usefulness depends on product accuracy [6]. With high spatiotemporal resolution, they can serve as substitutes for ground-based measurements in hydrological and atmospheric models [7]. Their main advantage is broad coverage, but their accuracy varies depending on the sensor, atmospheric conditions, and other technical factors [8].
In this context, gridded precipitation products have been widely applied in various studies. Examples include multisatellite precipitation analysis in China [9], hydroclimatological analysis in the Great Lakes basin [10], comparisons of the GPM IMERG, TMPA 3B42, and PERSIANN-CDR satellite precipitation products in Malaysia [11], and evaluation of CHIRPS, TRMM 3B42 V7, and PERSIANN-CDR in different climate regimes in Arabia [12]. MERRA-2 has been used for hydrological estimation alongside MERRA, MERRA-Land, and ERA-Interim/Land [13]. In the Sinu River Basin, Colombia, precipitation estimates from MERRA-2 and ERA5 have been compared with rain gauge measurements [14]. Furthermore, precipitation products such as GSMaP-G-NRT, PERSIANN-CCS, PERSIANN-CDR, and PERSIANN have been evaluated in the Titicaca Basin [15].
However, no evaluation of the ERA5, MERRA-2, and PERSIANN-CDR gridded products has been conducted in the Tambo Basin. Therefore, this study aims to evaluate the performance of ERA5, MERRA-2, and PERSIANN-CDR gridded products in the Tambo Basin. This evaluation is essential for improving the understanding of precipitation variability in the region and enhancing the accuracy of hydroclimatic studies.

2. Materials and Methods
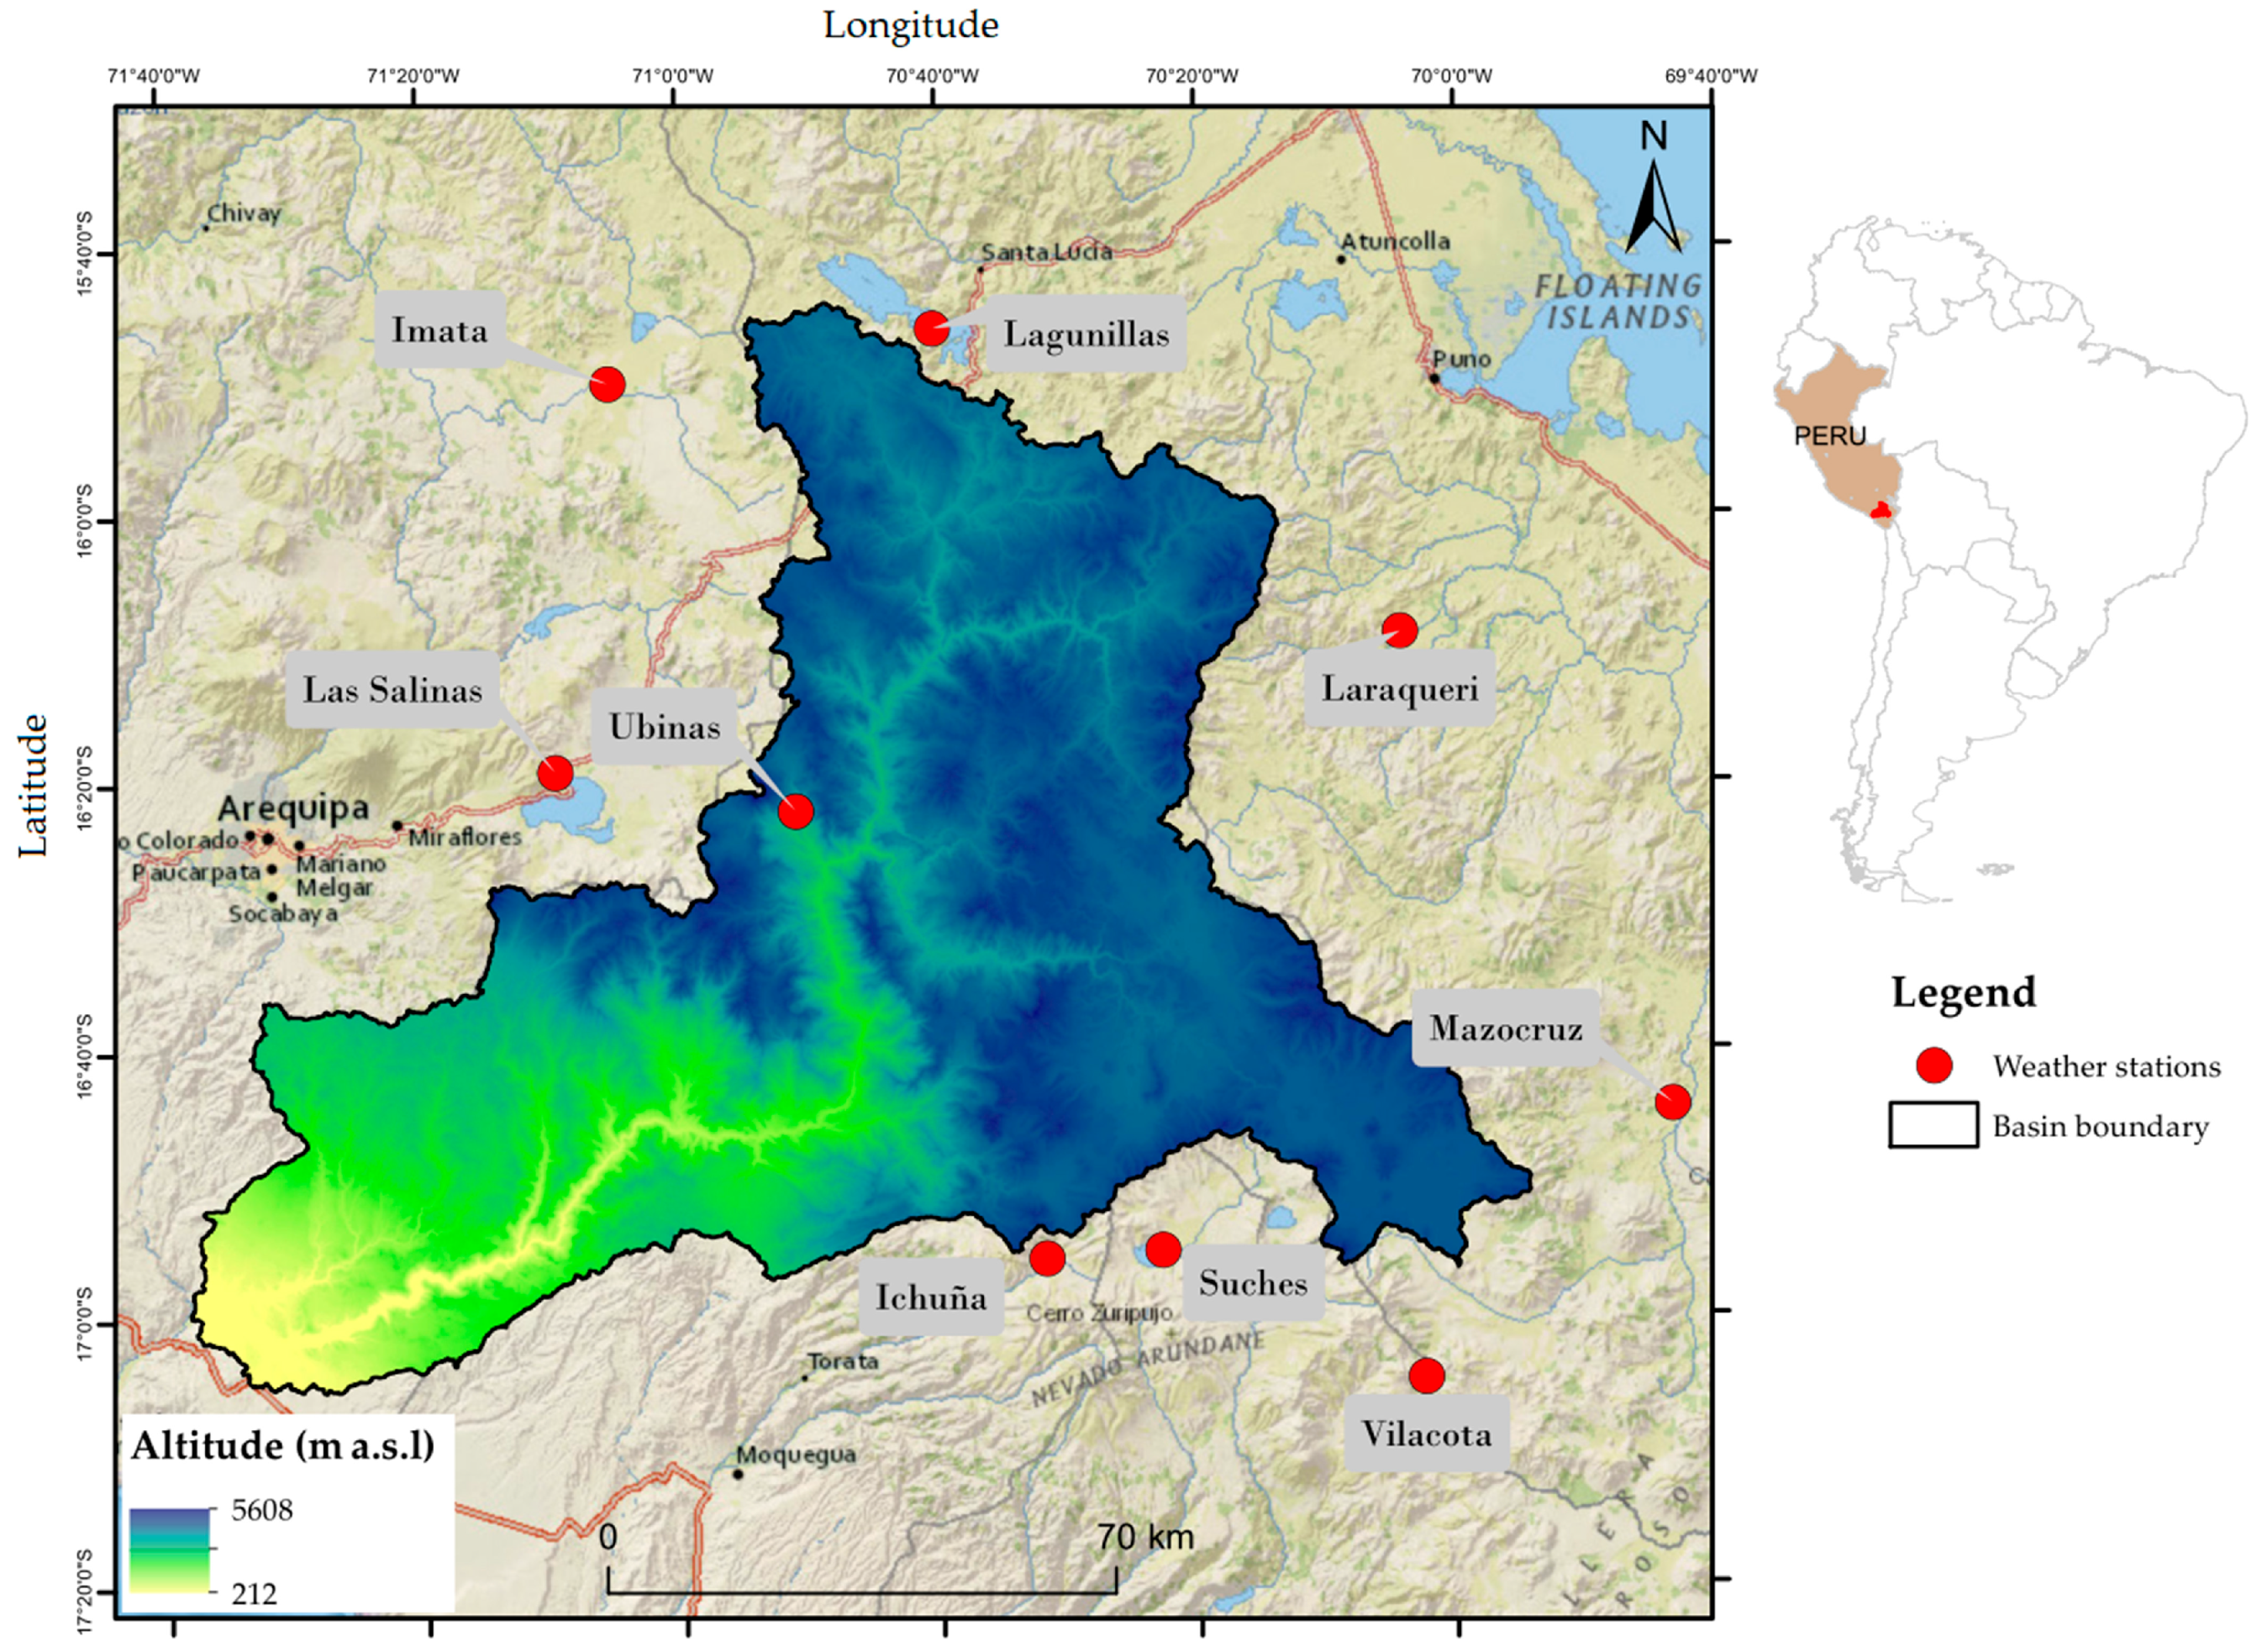
2.1. Study Area

The Tambo Basin (TB) is located in southern Peru, in the Moquegua department (Figure 1). It covers an area of approximately 11,826.63 km2, with elevations ranging from 212 to 5608 m above sea level (m a.s.l.) and an average elevation of 3741.52 m a.s.l. The basin has an average slope of 15.92% and an annual mean precipitation of 427.70 mm.

2.2. Terrain Data

The Digital Elevation Model (DEM) was obtained through the Google Earth Engine (GEE) platform, with an approximate spatial resolution of 30 m (https://earthengine.google.com/, accessed on 20 April 2024).

2.3. Meteorological Data

Precipitation data were provided by the Servicio Nacional de Meteorología e Hidrología of Peru and the Sistema Nacional de Inforación de Recursos Hídricos (SNIRH) of the Autoridad Nacional del Agua (ANA). Nine meteorological stations were selected based on the influence of Thiessen polygons in the study basin (Figure 1 and Table 1). The daily total precipitation data cover the period from 1 January 1984 to 31 December 2019.

2.4. Gridded Meteorological Data

ERA5 is a global climate dataset developed by the Copernicus Climate Change Service of the ECMWF, covering more than 30 years. It has a spatial resolution of 24 km (0.25° × 0.25°) and spans the period from 2 January 1979 to the present. ERA5 has proven its ability to reproduce the spatial and temporal distribution of precipitation [16], as well as to represent spatial patterns and temporal trends. However, its performance varies depending on the climatic region, precipitation intensity, and topography [17].
PERSIANN-CDR was developed by the Center for Hydrometeorology and Remote Sensing at the University of California, Irvine (UC-IRVINE/CHRS) and utilizes satellite infrared data to estimate precipitation with high accuracy. It has a spatial resolution of 24 km, enabling detailed analysis on a high-precision grid. This dataset has been available since 1 January 1983.
MERRA-2 is a climate dataset produced by the Global Modeling and Assimilation Office (GMAO). It has a spatial resolution of approximately 50 km (0.5° × 0.625°) and covers the period from 31 December 1980 onward. Like its predecessor, MERRA, it is designed for historical climate analysis, providing estimates based on satellite observations, global climate models, and ground-based station data worldwide to enhance the representation of initial conditions [18].
The daily total precipitation products from ERA5, PERSIANN-CDR, and MERRA-2 were obtained through the online server Climate Engine (https://www.climateengine.org/, accessed on 20 June 2024), covering the same period as the observed precipitation data. This cloud-based web platform facilitates access, processing, and downloading of climate and remote sensing data through Google Earth Engine, offering more than 600 datasets without requiring programming [19].

2.5. Methodology

The homogenization and filling of missing data were carried out using ANDREA (Análisis de Datos Hídricos y Recursos Estadísticos) (https://snirh.ana.gob.pe/ANDREA/Inicio.aspx, accessed on 23 July 2024). To group the stations into homogeneous regions, the Ward method (1963) was used, which minimizes differences within each group while balancing their size and variability [20]. Subsequently, based on these groupings, the Regional Vector Model (RVM) was applied, comparing each station with the regional average to identify hydrological patterns [21].
To evaluate the performance of ERA5, MERRA-2, and PERSIANN-CDR, daily data were extracted from the Climate Engine platform using the point pixel sampling method. This method directly assigns the pixel value corresponding to the location of each meteorological station without additional interpolations, preserving consistency with the original dataset. The extracted data and observed records were aggregated to a monthly scale to ensure the same temporal resolution. The evaluation was conducted without filling in missing values in the observed data. The basin-wide average precipitation was estimated using the arithmetic mean for both datasets.
The evaluation metrics (Table 2) included the Pearson correlation coefficient (CC), percentage bias (PBIAS), and root mean square error (RMSE), which are widely used for validating climate products.
Where i represents the location index, S i corresponds to the simulated precipitation value, O i are the observed values, S ¯ and O ¯ refer to the average values of S and O , respectively, and n indicates the number of data pairs.

3. Results

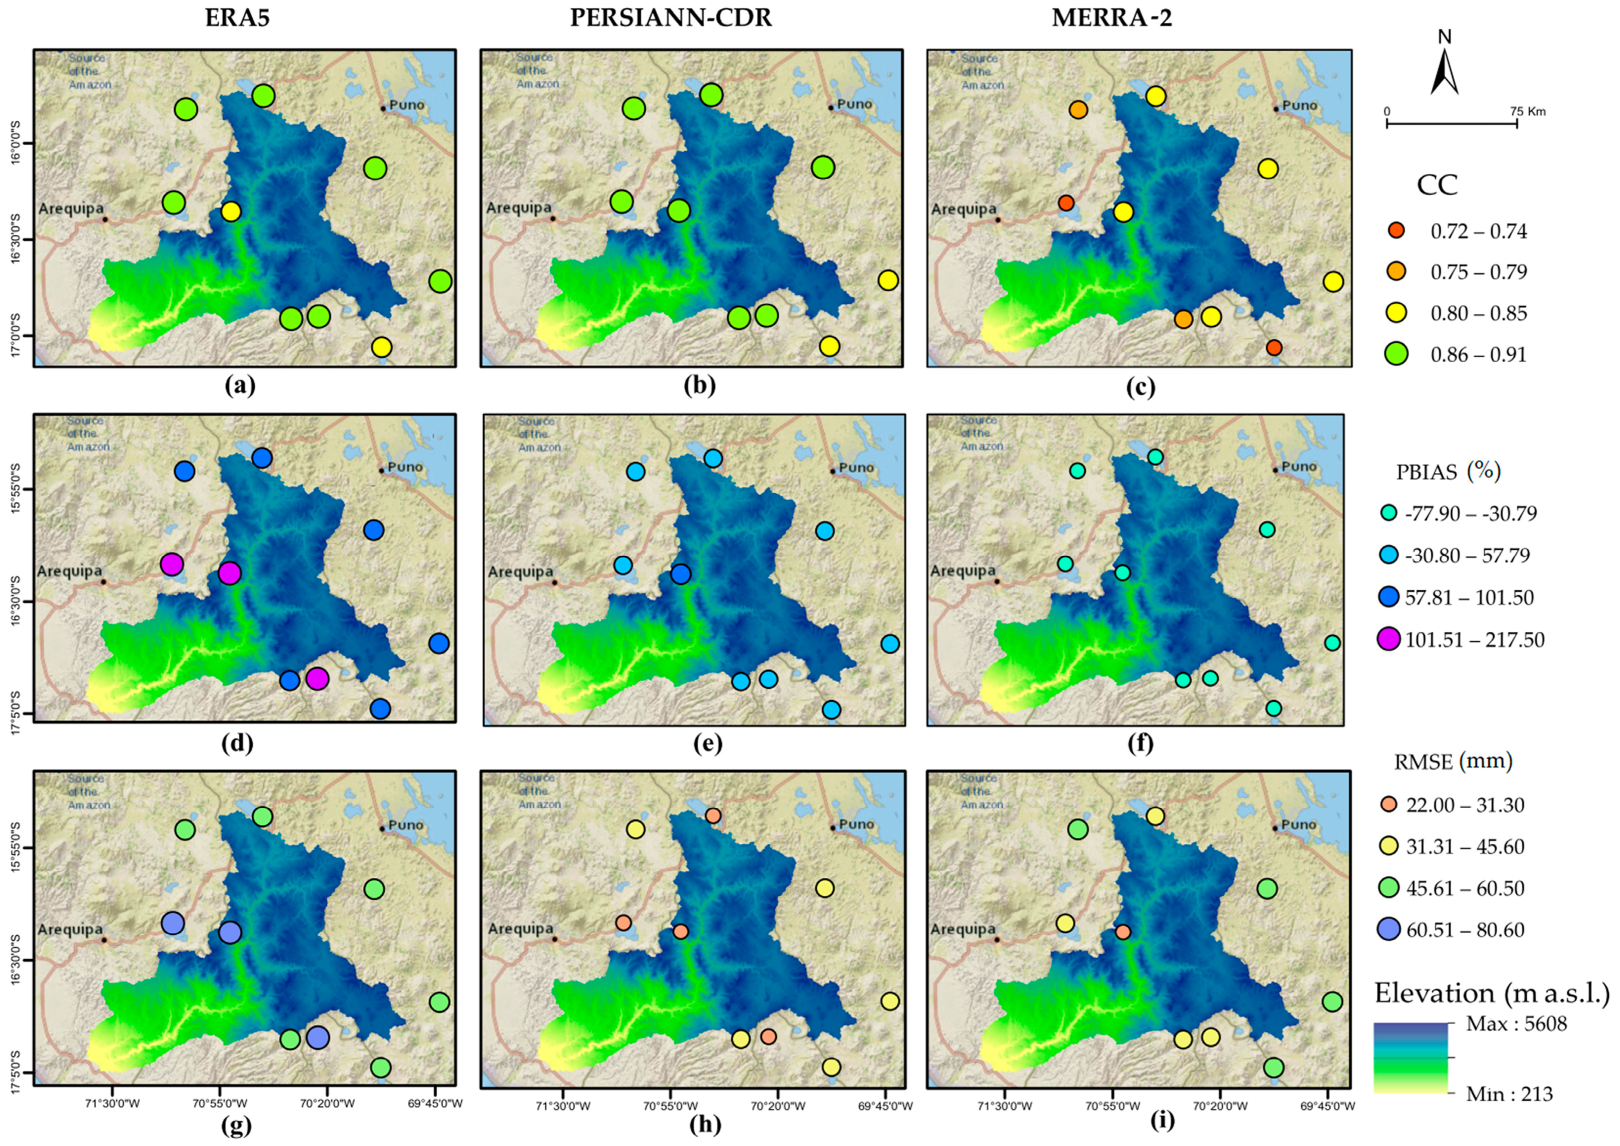
3.1. Evaluation by Meteorological Station

Figure 2 shows the spatial distribution of CC, PBIAS, and RMSE at a monthly scale in the Tambo basin. ERA5 exhibits a high correlation with observations (CC between 0.83 and 0.91) (Figure 2a), indicating a good alignment of its precipitation temporal patterns. However, it significantly overestimates precipitation (PBIAS between 71.98% and 217.47%) (Figure 2d) and shows high RMSE values (51.67 mm/month to 80.58 mm/month) (Figure 2g), suggesting considerable dispersion from the observed data.
PERSIANN-CDR shows the highest correlation among the three products (CC between 0.84 and 0.91) (Figure 2b), reflecting a strong agreement with observations. Its bias (PBIAS) ranges from 6.90% to 83.10% (Figure 2e) and presents moderate RMSE values (21.97 mm/month to 38.78 mm/month) (Figure 2h), indicating greater accuracy compared to ERA5.
On the other hand, MERRA-2 exhibits a lower correlation (CC between 0.72 and 0.82) (Figure 2c) and underestimates precipitation (PBIAS between −77.86% and −30.80%) (Figure 2f). However, it records RMSE values between 26.58 mm/month and 60.55 mm/month) (Figure 2i).

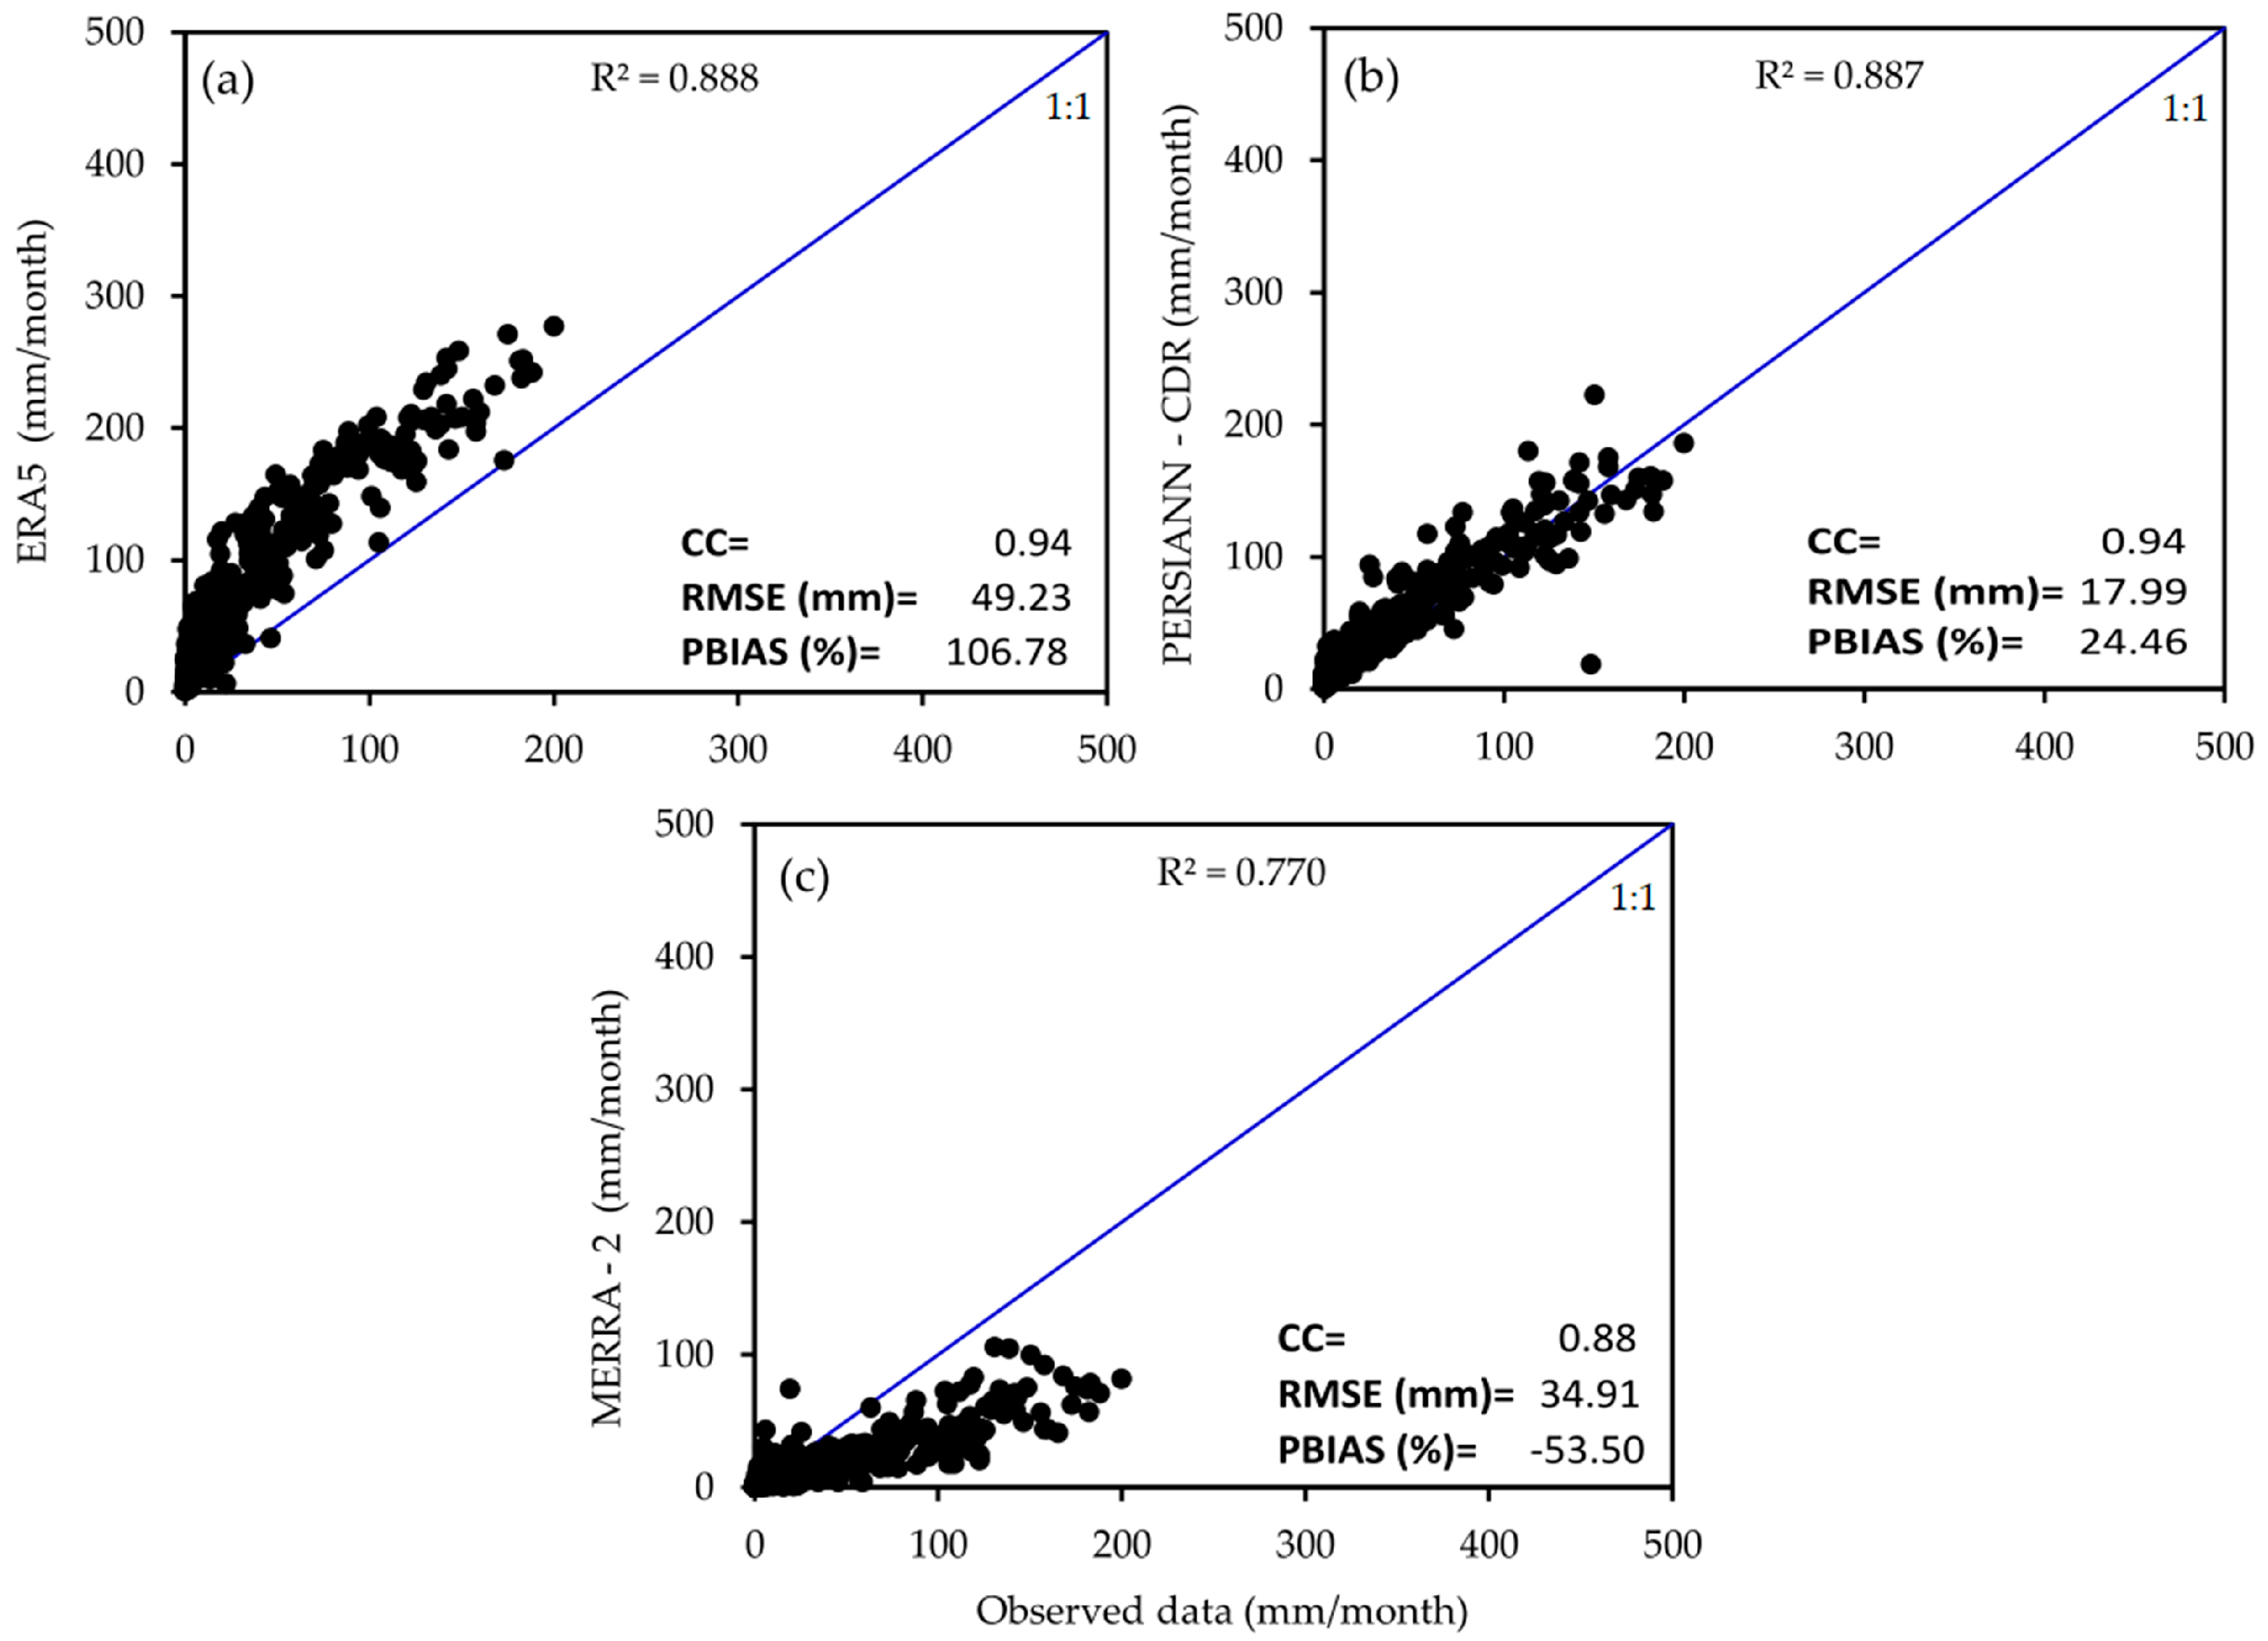
3.2. Areal Average Evaluation

The comparison of basin-averaged precipitation between observed data and the ERA5, PERSIANN-CDR, and MERRA-2 products revealed significant differences in their performance. ERA5 (Figure 3a) exhibits a high correlation (CC = 0.94) but considerably overestimates precipitation, with a bias of 106.8% and an RMSE of 49.2 mm/month. In contrast, PERSIANN-CDR (Figure 3b) demonstrates the best performance, providing the highest accuracy in precipitation estimation, the lowest RMSE (18.0 mm/month), and a moderate bias of 24.5%, while maintaining a high correlation (CC = 0.94). MERRA-2 (Figure 3c), although showing a lower bias (−53.5%) and an RMSE of 34.9 mm/month, has a slightly lower correlation (CC = 0.88).

4. Discussion

Validation of precipitation products is crucial for climate and hydrological studies [22]. The results indicate that PERSIANN-CDR is the most accurate, with a lower percentage bias (PBIAS) and root mean square error (RMSE), as well as a high correlation coefficient (CC) across most stations, confirming its strong agreement with observed data. This performance aligns with studies in the Lake Titicaca basin [15] and South Asia [23].
ERA5, while showing a high temporal correlation with observed data, outperforms MERRA-2 [24,25] but significantly overestimates precipitation [26]. This overestimation may be linked to the irregular distribution of meteorological stations, introducing uncertainty in regional precipitation estimates.
In contrast, MERRA-2 underestimates precipitation but maintains a moderate correlation with observed data [18,27]. Despite this bias, its lower error dispersion compared to ERA5 suggests a better fit under certain conditions.

5. Conclusions

The evaluation of precipitation products in the Tambo basin reveals significant differences in their accuracy and reliability. PERSIANN-CDR exhibits the best overall performance, with the highest correlation, lower bias, and moderate RMSE values, indicating a strong agreement with observed data. ERA5, despite its high correlation, considerably overestimates precipitation, limiting its applicability for accurate hydrological assessments. MERRA-2, while showing lower bias and RMSE compared to ERA5, underestimates precipitation and has a slightly lower correlation.

Author Contributions

Conceptualization: C.A.-V. and M.L.M.-Y.; methodology: C.A.-V. and M.L.M.-Y.; software: C.A.-V.; validation: C.A.-V., M.L.M.-Y. and E.L.; formal analysis: C.A.-V. and M.L.M.-Y.; investigation: C.A.-V.; resources: M.L.M.-Y.; data curation: M.L.M.-Y.; writing—original draft preparation: M.L.M.-Y.; writing—review and editing: C.A.-V. and M.L.M.-Y.; visualization: M.L.M.-Y.; supervision: E.L.; project administration: C.A.-V. and M.L.M.-Y. All authors have read and agreed to the published version of the manuscript.

Funding

This research received no external funding.

Institutional Review Board Statement

Not applicable.

Informed Consent Statement

Not applicable.

Data Availability Statement

Data cannot be made publicly available; readers should contact the corresponding author for details.

Acknowledgments

The authors wish to thank the Servicio Nacional de Meteorología e Hidrología (SENAMHI) of Peru and the Autoridad Nacional del Agua (ANA) for providing the climate and hydrological information used in this research.

Conflicts of Interest

The authors declare no conflicts of interest.

References

  1. Araújo, P.A.A.; Silva, C.M.S.E.; Rodrigues, D.T.; Valentim, A.M. Analysis of Extreme Rainfall Events on a Sub-Daily Scale in Northeast. Environ. Sci. Proc. 2023, 25, 97. [Google Scholar] [CrossRef]
  2. Gehne, M.; Hamill, T.M.; Kiladis, G.N.; Trenberth, K.E. Comparison of Global Precipitation Estimates across a Range of Temporal and Spatial Scales. J. Clim. 2016, 29, 7773–7795. [Google Scholar] [CrossRef]
  3. Lavers, D.A.; Harrigan, S.; Andersson, E.; Richardson, D.S.; Prudhomme, C.; Pappenberger, F. A vision for improving global flood forecasting. Environ. Res. Lett. 2019, 14, 121002. [Google Scholar] [CrossRef]
  4. Kidd, C.; Becker, A.; Huffman, G.J.; Muller, C.L.; Joe, P.; Skofronick-Jackson, G.; Kirschbaum, D.B. So, How Much of the Earth’s Surface Is Covered by Rain Gauges? Bull. Am. Meteorol. Soc. 2017, 98, 69–78. [Google Scholar] [CrossRef]
  5. Sun, Q.; Miao, C.; Duan, Q.; Ashouri, H.; Sorooshian, S.; Hsu, K.-L. A Review of Global Precipitation Data Sets: Data Sources, Estimation, and Intercomparisons. Rev. Geophys. 2018, 56, 79–107. [Google Scholar] [CrossRef]
  6. Chawla, I.; Mujumdar, P.P. Evaluating rainfall datasets to reconstruct floods in data-sparse Himalayan region. J. Hydrol. 2020, 588, 125090. [Google Scholar] [CrossRef]
  7. Nguyen, T.H.; Masih, I.; Mohamed, Y.A.; Van der Zaag, P. Validating Rainfall-Runoff Modelling Using Satellite-Based and Reanalysis Precipitation Products in the Sre Pok Catchment, the Mekong River Basin. Geosciences 2018, 8, 5. [Google Scholar] [CrossRef]
  8. Ramirez Camargo, L.; Gruber, K.; Nitsch, F. Assessing variables of regional reanalysis data sets relevant for modelling small-scale renewable energy systems. Renew. Energy 2019, 133, 1468–1478. [Google Scholar] [CrossRef]
  9. Jiang, S.; Wei, L.; Ren, L.; Zhang, L.; Wang, M.; Cui, H. Evaluation of IMERG, TMPA, ERA5, and CPC precipitation products over mainland China: Spatiotemporal patterns and extremes. Water Sci. Eng. 2023, 16, 45–56. [Google Scholar] [CrossRef]
  10. Xu, X.; Frey, S.K.; Ma, D. Hydrological performance of ERA5 and MERRA-2 precipitation products over the Great Lakes Basin. J. Hydrol. Reg. Stud. 2022, 39, 100982. [Google Scholar] [CrossRef]
  11. Tan, M.L.; Santo, H. Comparison of GPM IMERG, TMPA 3B42 and PERSIANN-CDR satellite precipitation products over Malaysia. Atmos. Res. 2018, 202, 63–76. [Google Scholar] [CrossRef]
  12. Zhang, Y.; Wu, C.; Yeh, P.J.-F.; Li, J.; Hu, B.X.; Feng, P.; Jun, C. Evaluation and comparison of precipitation estimates and hydrologic utility of CHIRPS, TRMM 3B42 V7 and PERSIANN-CDR products in various climate regimes. Atmos. Res. 2022, 265, 105881. [Google Scholar] [CrossRef]
  13. Reichle, R.H.; Draper, C.S.; Liu, Q.; Girotto, M.; Mahanama, S.P.P.; Koster, R.D.; Lannoy, G.J.M.D. Assessment of MERRA-2 Land Surface Hydrology Estimates. J. Clim. 2017, 30, 2937–2960. [Google Scholar] [CrossRef]
  14. Vega-Durán, J.; Escalante-Castro, B.; Canales, F.A.; Acuña, G.J.; Kaźmierczak, B. Evaluation of Areal Monthly Average Precipitation Estimates from MERRA2 and ERA5 Reanalysis in a Colombian Caribbean Basin. Atmosphere 2021, 12, 11. [Google Scholar] [CrossRef]
  15. Lujano, E.; Diaz, R.D.; Tapia, B.; Lujano, A. Evaluación de Productos de Precipitación Satelital sobre la Cuenca del Lago Titicaca. Rev. Bras. Meteorol. 2023, 38, e38230078. [Google Scholar] [CrossRef]
  16. Xin, Y.; Lu, N.; Jiang, H.; Liu, Y.; Yao, L. Performance of ERA5 reanalysis precipitation products in the Guangdong-Hong Kong-Macao greater Bay Area, China. J. Hydrol. 2021, 602, 126791. [Google Scholar] [CrossRef]
  17. Gomis, J.C.; Rattayova, V.; Salazar-Galán, S.; Francés, F. Evaluation of ERA5 and ERA5-Land reanalysis precipitation datasets over Spain (1951–2020). Atmos. Res. 2023, 284, 106606. [Google Scholar] [CrossRef]
  18. Quagraine, K.A.; Nkrumah, F.; Klein, C.; Klutse, N.A.B.; Quagraine, K.T. West African Summer Monsoon Precipitation Variability as Represented by Reanalysis Datasets. Climate 2020, 8, 10. [Google Scholar] [CrossRef]
  19. Huntington, J.L.; Hegewisch, K.C.; Daudert, B.; Morton, C.G.; Abatzoglou, J.T.; McEvoy, D.J.; Erickson, T. Climate Engine: Cloud Computing and Visualization of Climate and Remote Sensing Data for Advanced Natural Resource Monitoring and Process Understanding. Bull. Am. Meteorol. Soc. 2017, 98, 2397–2410. [Google Scholar] [CrossRef]
  20. Hosking, J.R.M.; Wallis, J.R. Regional Frequency Analysis: An Approach Based on L-Moments; Cambridge University Press: Cambridge, UK, 1997. [Google Scholar]
  21. Espinoza, J.C. El Método Del Vector Regional de Índices Pluviométricos. 2005. Available online: https://pdfcoffee.com/el-metodo-del-vector-regional-de-indices-pluviometricos-9-pdf-free.html (accessed on 15 May 2024).
  22. Wong, J.S.; Razavi, S.; Bonsal, B.R.; Wheater, H.S.; Asong, Z.E. Inter-comparison of daily precipitation products for large-scale hydro-climatic applications over Canada. Hydrol. Earth Syst. Sci. 2017, 21, 2163–2185. [Google Scholar] [CrossRef]
  23. Hamza, A.; Anjum, M.N.; Masud Cheema, M.J.; Chen, X.; Afzal, A.; Azam, M.; Kamran Shafi, M.; Gulakhmadov, A. Assessment of IMERG-V06, TRMM-3B42V7, SM2RAIN-ASCAT, and PERSIANN-CDR Precipitation Products over the Hindu Kush Mountains of Pakistan, South Asia. Remote Sens. 2020, 12, 23. [Google Scholar] [CrossRef]
  24. Mahto, S.S.; Mishra, V. Does ERA-5 Outperform Other Reanalysis Products for Hydrologic Applications in India? J. Geophys. Res. Atmos. 2019, 124, 9423–9441. [Google Scholar] [CrossRef]
  25. Huang, L.; Mo, Z.; Liu, L.; Zeng, Z.; Chen, J.; Xiong, S.; He, H. Evaluation of Hourly PWV Products Derived From ERA5 and MERRA-2 Over the Tibetan Plateau Using Ground-Based GNSS Observations by Two Enhanced Models. Earth Space Sci. 2021, 8, e2020EA001516. [Google Scholar] [CrossRef]
  26. Clarke, R.T.; Buarque, D.C.; de Paiva, R.C.D.; Collischonn, W. Issues of spatial correlation arising from the use of TRMM rainfall estimates in the Brazilian Amazon. Water Resour. Res. 2011, 47, W05539. [Google Scholar] [CrossRef]
  27. Gaibor Velasco, N.I.; López Bravo, O.E.; Vallejo Ilijama, M.T.; Arreguín Samano, M. Análisis de la variabilidad climática utilizando producto satelital MERRA 2 para la microcuenca del Río Chazo Juan-Bolívar Ecuador. J. Sci. Res. Rev. Cienc. Investig. 2023, 8, 102–116. [Google Scholar]
Figure 1. Location of the study area.
Eesp 32 00017 g001
Figure 2. Spatial distribution of CC (ac), PBIAS (df), and RMSE (gi) for ERA5, PERSIANN-CDR and MERRA-2.
Eesp 32 00017 g002
Figure 3. Scatter plot of basin-averaged precipitation comparing observed data with gridded products, including performance metrics, (a) ERA5, (b) PERSIANN-CDR and (c) MERRA-2.
Eesp 32 00017 g003
Table 1. Geographical location and elevation of weather stations.
StationLatitude
(°)
Longitude
(°)
Altitude
(m a.s.l.)
1Mazocruz−16.74−69.724003
2Vilacota−17.08−70.044465
3Ubinas−16.37−70.853380
4Ichuña−16.14−70.543756
5Suches−16.92−70.384452
6Laraqueri−16.15−70.073970
7Las Salinas−16.32−71.164378
8Lagunillas−15.77−70.674200
9Imata−15.84−71.094475
Table 2. Performance metrics.
MetricEquationUnitOptimal Value
PBIAS P B I A S = 100 i = 1 n ( S i O i ) i = 1 n O i % 0
RMSE R M S E = 1 N i = 1 n ( S i O i ) 2 mm 0
CC r = i = 1 n O i O ¯ S i S ¯ i = 1 n O i O ¯ 2 i = 1 n ( S i S ¯ ) 2 1
Disclaimer/Publisher’s Note: The statements, opinions and data contained in all publications are solely those of the individual author(s) and contributor(s) and not of MDPI and/or the editor(s). MDPI and/or the editor(s) disclaim responsibility for any injury to people or property resulting from any ideas, methods, instructions or products referred to in the content.

