Abstract
The cooling effect from the para-ortho hydrogen conversion (POC) combined with a vapor-cooled shield (VCS) and multi-layer insulation (MLI) can effectively extend the storage duration of liquid hydrogen in cryogenic tanks. However, there is currently no effective and straightforward empirical correlation available for predicting the catalytic POC efficiency in VCS pipelines. This study focuses on the development of correlations for the catalytic conversion of para-hydrogen to ortho-hydrogen in pipelines, particularly in the context of cryogenic hydrogen storage systems. A model that incorporates the Langmuir adsorption characteristics of catalysts and introduces the concept of conversion efficiency to quantify the catalytic process’s performance is introduced. Experimental data were obtained in the temperature range of 141.9~229.9 K from a cryogenic hydrogen catalytic conversion facility, where the effects of temperature, pressure, and flow rate on the catalytic conversion efficiency were analyzed. Based on a validation against the experimental data, the proposed model offers a reliable method for predicting the cooling effects and optimizing the catalytic conversion process in VCS pipelines, which may contribute to the improvement of liquid hydrogen storage systems, enhancing both the efficiency and duration of storage.
1. Introduction
Liquid hydrogen (LH2), an attractive cryogenic propellant, plays a crucial role in future Earth-to-space transportation, deep space exploration, in-space refueling stations, and the development and operation of the Earth-Moon space zone [1]. However, the extremely low boiling point (20.3 K) and low latent heat of vaporization (445 kJ/kg at 1 atm) of liquid hydrogen result in easy evaporation losses. In particular, under on-orbit space conditions, liquid hydrogen is subjected to space thermal radiation and heat conduction from the flight system, creating a significant temperature difference inside and outside the storage tank. Therefore, maintaining the stability of LH2 in the storage tank requires careful thermal management [2,3]. Various solutions have been proposed to address this issue, including passive insulation techniques by multi-layer insulation (MLI) [4,5], vapor-cooled shield (VCS) [6], and thermodynamic vent systems (TVS) [7], as well as active cooling approaches exemplified by zero boil-off (ZBO) technology [8]. Currently, owing to the lack of conditions for the mature application of ZBO technology based on cryocoolers, passive insulation techniques are more feasible and have been extensively implemented in contemporary aerospace engineering [9].
It is well known that hydrogen has two isomers: ortho-hydrogen (o-H2) and para-hydrogen (p-H2), both of which co-exist in hydrogen fluid. At room temperatures, hydrogen consists of 75% o-H2 and 25% p-H2 under equilibrium conditions. However, p-H2 accounts for about 99% of the total hydrogen content when the temperature drops to 20 K [10]. O-H2 has a higher ground-state energy compared to p-H2, leading to an endothermic effect during the para-to-ortho hydrogen conversion (POC) process. Either POC or ortho-para hydrogen conversion (OPC) involves two conversion modes: self-conversion and catalytic conversion. In the absence of external factors, self-conversion from a non-equilibrium state to an equilibrium state takes a longer time, whereas catalytic conversion can significantly increase the conversion rate. Therefore, integrating the POC effect into a VCS surrounding a liquid hydrogen tank offers a promising approach to prolonging its storage duration [11].
Researchers have conducted experiments to investigate the characteristics and mechanism of OPC/POC. Milenko et al. [12] studied the OPC process in the absence of catalysts, focusing on liquid hydrogen in the range from 17 K to 32 K and gaseous hydrogen between 40 K and 120 K to investigate the spontaneous conversion rate of hydrogen. Based on the experimental data and along with Wigner’s theory [13] of OPC, a fitting correlation applicable to both gas and liquid phases was proposed, with a deviation of less than 4.8% from the experimental results. Hutchinson et al. [14] presented studies of the catalytic POC process over a temperature range from 20 to 80 K and a pressure range from 20 to 1000 psig utilizing a standard ferric oxide gel catalyst, which helped to discover the mechanism of POC and to develop a better catalyst. Petitpas et al. [15] investigated the spontaneous POC process in a 151 L automotive cryogenic pressurized hydrogen storage tank and studied the rate of temperature and pressure rise inside the tank under different natural environmental conditions with the impact of POC on this process. The results revealed that the spontaneous POC process lasts 25–30 days and effectively extends the hydrogen storage duration by 3–7 days. However, the conditions of these experiments differ significantly from those in liquid hydrogen propellant storage tanks, and there is a lack of sufficient experimental data in that temperature range.
Recently, Meng et al. [16] conducted a study on measuring component concentration and the conversion rate from p-H2 to o-H2 in a catalytic converter. A cryogenic hydrogen catalytic conversion facility was designed to produce and purify liquid p-H2, convert p-H2 to o-H2 using a catalyst, and measure the concentrations of hydrogen isomers utilizing the Raman spectrum method. The effects of the flow rate, temperature, and pressure on the flow isomer conversion performance were investigated. The catalytic conversion performance deteriorated with increasing flow rate and temperature but improved under elevated pressure. The results of this study may play a crucial role in advancing the potential application of endothermic effects of the POC process for enhanced thermal insulation.
Harrison, Petzinger, and Ishii et al. [17,18,19] conducted a detailed theoretical analysis of the catalytic conversion process of hydrogen molecules on magnetic surfaces. They found that catalytic conversion efficiency is closely related to microscopic factors such as the number of active sites on the catalyst surface, magnetic field strength, magnetic moment size, and hydrogen adsorption rate.
Recent studies have increasingly focused on the combined application of POC with vapor-cooled shields (VCS) to enhance thermal insulation in LH2 storage. Meng et al. [20] developed a hybrid model integrating polyurethane foam, MLI, VCS, and POC, finding that a POC-equipped converter embedded within the insulation structure can reduce net heat flux by approximately 10%. Xu et al. [11] compared MLI+VCS systems under different POC implementation strategies and demonstrated significant improvements when POC is included. Lv et al. [21] conducted a thermodynamic analysis of composite VDMLI+VCS systems with continuous POC, providing optimized design insights for future system configurations. However, these studies have mainly addressed steady-state problems and have not analyzed intermittent transient venting processes, for which transient models require simple and reliable correlations for catalytic conversion.
Hutchinson et al. [22,23] analyzed the reaction process between the catalyst and hydrogen molecules under microscope conditions based on their experimental results. They proposed four empirical models based on the adsorption and desorption behaviors of hydrogen molecules, among which the Langmuir-Hinshelwood model is computationally simple and therefore more practical. Wilhelmsen et al. [24] summarized previous experimental studies and developed an empirical correlation applicable to both OPC and POC through data fitting. However, its pressure and temperature ranges are more relevant to the hydrogen liquefaction regime. Karlsson et al. [25] investigated the catalytic OPC process in liquid hydrogen and discussed the reaction order of the OPC process. Results revealed that the concentration-time curve exhibits a clear two-stage behavior. Nevertheless, existing catalytic conversion models are generally expressed in terms of concentration, whereas the POC process in VCS pipelines is more strongly influenced by venting rate. Therefore, it is necessary to further develop empirical models that can capture catalytic POC trends in VCS pipelines with sound physical meaning.
Herein, this study presents correlations for para-to-ortho hydrogen catalytic conversion in vapor-cooled shield pipelines outside the cryogenic storage tank based on the Langmuir Equation. The pore size of the catalyst was considered. A new parameter, conversion efficiency rather than component concentration, was applied to the model for validation and prediction. The proposed correlations are derived and validated under operating conditions characteristic of VCS pipelines in cryogenic LH2 tanks, which constitute the intended primary application.
2. Model Development
Figure 1 presents a schematic of the catalytic para-ortho hydrogen conversion process within the external VCS pipeline of a storage tank. As is shown in Figure 1a, the vapor in the ullage of the tank is supposed to be stable at 100% p-H2. As the p-H2 flows through the para-ortho hydrogen converter, the para/ortho composition ratio changes with the flow rate under the effect of a catalyst (Figure 1b). The endothermic conversion cools the vented hydrogen stream inside the VCS pipeline and lowers the temperature of the vapor-cooled shield itself, which enhances the thermal protection performance of the VCS.
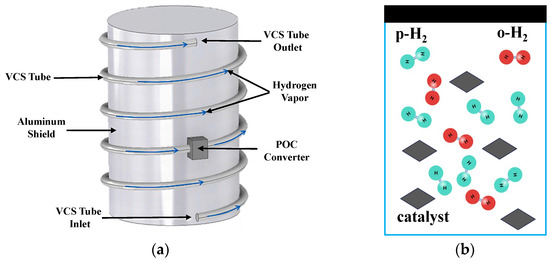
Figure 1.
Schematic of catalytic para-ortho conversion process in a VCS tube. (a) Catalytic para-ortho hydrogen conversion under flowing conditions inside the VCS tube; (b) Internal mechanism of catalytic conversion.
For a constant total amount of hydrogen in an enclosed space, the para/ortho hydrogen composition changes over time under the action of a catalyst. The changing rate is generally expressed as a differential equation of component concentration concerning time,
where x represents the concentration of o-H2 component; xeq represents the concentration of o-H2 when the catalytic conversion reaches equilibrium; T and P represent temperature and pressure of the hydrogen, respectively; k1 and n1 are fitted correlations as functions of pressure and temperature, k1 has a unit of min−1. However, when hydrogen flows through the VCS pipeline, the variation in component concentration with flow rate, rather than with time, is of greater interest. Therefore, instead of introducing the time-dependent microscopic composition change in this process, we prefer to focus the variation in composition ratio directly on the flow rate after catalytic conversion. Therefore, Equation (1) is transformed to,
where k2 is a dimensionless fitted parameter; Vspace denotes the space velocity, defined as the ratio of the total internal volumetric flow rate at standard temperature and pressure (STP) to the catalyst volume, which reflects the residence time of the hydrogen molecule on the catalyst surface [16].
Vspace has the unit of min−1. VH2,STP is the volume flow rate of hydrogen gas under standard conditions, m3/min. mcatalyst and ρcatalyst represent the mass and density of the iron-based catalyst, respectively.
The ambient temperature determines the p-H2 concentration in the mixed gas at the converter outlet. However, the concentration curve is not adequate to show the impact of temperature on the catalytic conversion efficiency of the hydrogen flow. Therefore, the conversion efficiency Rconversion is introduced to quantify the completeness of the catalytic conversion process [16],
where x represents the concentration of ortho-hydrogen or para-hydrogen; The subscripts eq, inlet, and outlet represent the equilibrium state, the converter inlet, and the converter outlet at the given temperature, respectively. xeq can be calculated by Equations (5)–(8) [20].
where Z is the nuclear rotation partition function; J is the quantum number; εJ is the rotational energy, in J; kB is the Boltzmann constant; T is the environment temperature, in K; and θR is the characteristic rotational temperature, which has a fixed value of 84.837 for the hydrogen, in K.
To better calculate the cooling effect released by the conversion, the conversion efficiency Rconversion rather than component concentration x is utilized to characterize the extent to which the composition ratio after catalytic conversion approaches equilibrium. In other words, replacing x with Rconversion in Equation (2), we obtain
where Vref = 1 min−1; k3 is the fitting parameter, with a unit of min.
Activated Fe-based catalysts are generally employed for the POC [16]. The catalyst used in the present study is a compound of Fe2O3/Fe3O4, with a density of 5.1 g/mL, a specific surface area of 160.7 m2/g, and a nominal powder diameter of 0.55 mm. The material was manufactured by the Beijing Institute of Aerospace Test Technology. To avoid dispersion, the catalyst powders were wrapped in a 300-mesh stainless-steel woven wire mesh. The pore size distribution on the surface of this catalyst is illustrated in Figure 2. As shown in the figure, the catalyst pores are primarily composed of micropores (<2 nm) and mesopores (2~7 nm). Statistics showed that micropores (<2 nm) account for ~6.8% of the total pore volume, mesopores (2~7 nm) dominate with ~91.4%, and macropores (>7 nm) contribute only ~1.8%. These microporous and mesoporous structures provide a sufficiently high specific surface area, allowing gas molecules to adsorb as a monolayer on the surface. Under cryogenic conditions, hydrogen molecules adsorb as a monolayer on these sites, with minimal intermolecular interaction [26]. These structural and adsorption characteristics satisfy the fundamental assumption of the Langmuir adsorption model, justifying its use in fitting the adsorption isotherm [27,28]. Therefore, the Langmuir equation is introduced to fit the adsorption isotherm,
where Vadsorp represents the volume of gas adsorbed per unit mass of the catalyst at pressure P; VL represents the Langmuir volume, which is the maximum adsorption capacity when the catalyst is saturated (cm3/g); b = 1/PL; PL is the Langmuir pressure, defined as the pressure at which the catalyst reaches half of its maximum adsorption capacity (kPa).
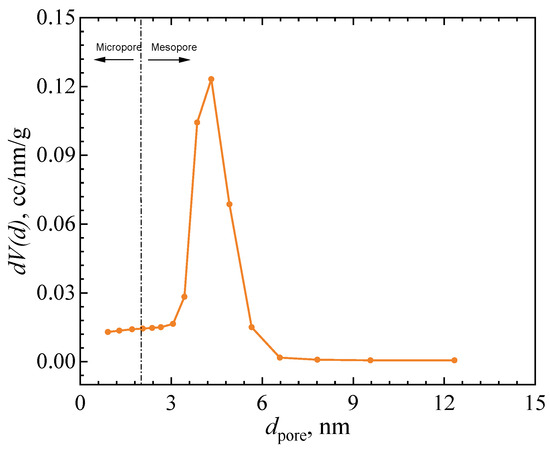
Figure 2.
Pore size distribution on catalyst surface. (Reprinted with permission from Ref [16]. Copyright 2024 Elsevier).
Therefore, the distribution of conversion rate Rconversion with respect to space velocity Vspace under fixed conditions (constant temperature and pressure) is fitted to a formula that is similar to the Langmuir equation:
where a(Tr, Pr), b(Tr, Pr), and c(Tr, Pr) are coefficients to be determined by fitting; the logarithm of the independent variable Vspace is taken, and an exponential term of (1 − c) is added to reduce errors.
The fitting process is further extended to cover the full operating conditions, with temperature ranging from 141.9 K to 229.9 K and pressure ranging from 150 kPa to 550 kPa. The coefficients in Equation (11) are defined as simple polynomials of temperature and pressure combination,
where Tr and reduced temperature Tr; Tr = T/Tc and Pr = P/Pc; Tc and Pc are the critical temperature and critical pressure, respectively.
3. Results and Discussion
The validation of the model was primarily based on the experimental results from the cryogenic hydrogen catalytic conversion facility [16], as shown in Figure 3. The experimental system utilized a cryocooler to liquefy hydrogen and maintain long-term storage. In the liquid hydrogen container, an Fe-based catalyst was used to produce pure p-H2, which serves as the feedstock to the para-ortho hydrogen catalytic converter. By adjusting the temperature, pressure, and flow rate of p-H2 in the catalytic conversion process, the catalytic conversion of hydrogen in the VCS outside the storage tank was simulated. Finally, the p-H2/o-H2 mixture exhausted from the converter is collected for Raman spectrum analysis, based on which the catalytic conversion efficiency is calculated. The experimental data with a temperature range from 141.9~229.9 K and a pressure range from 150 to 550 kPa were selected and utilized to validate the model.
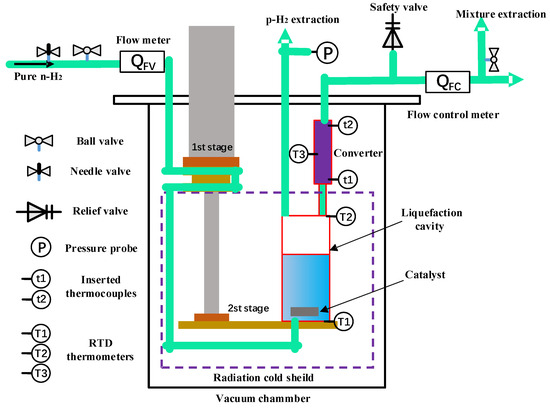
Figure 3.
Schematic of the cryogenic hydrogen catalytic conversion facility.
3.1. Validation of Isothermal Hydrogen Adsorption
Firstly, the hydrogen adsorption and desorption curves were measured at pressures ranging from 0.15 to 5 MPa by utilizing a BSD-PH automated high-pressure gas adsorption analyzer, with an experimental uncertainty of ±2%. The pressure transducers were calibrated with 0.01% full-scale accuracy (long-term stability 0.025% FS). The gravimetric method was employed to measure the catalyst’s hydrogen adsorption capacity at different pressures under fixed temperatures. Figure 4a shows that the catalyst’s hydrogen adsorption capacity increases sharply with pressurization at the beginning and gradually levels off at the cryogenic temperature of 77 K. This indicates that the micropores on the catalyst surface play a significant role during the rapid increase in adsorption capacity in the low-pressure range. The subsequent leveling-off phase suggests that the micropores are fully saturated. The isothermal adsorption curve agrees with the Langmuir adsorption law. Equation (10) is utilized to fit the adsorption isotherm in Figure 4a. VL was measured to be 45.9918 cm3/g, while PL was determined to be 468 kPa. The fitted result is shown in Figure 4b. It can be observed that the experimental measurements and the predicted values from the fitted curve exhibit a generally consistent trend. For the hydrogen adsorption isotherm fitting in Figure 4b, the deviation between experimental values and the fitted Langmuir curve remains below 5% except in the very low pressure range, which indicates the appropriateness of adopting a Langmuir-like equation for correlation.
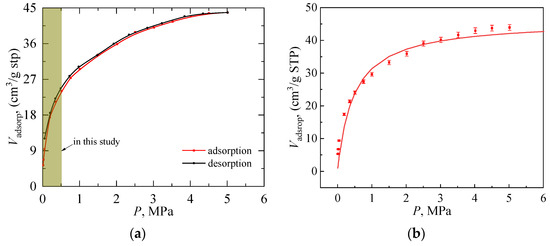
Figure 4.
Measurement and fitting of hydrogen adsorption/desorption isotherm at 77 K. (a) Hydrogen adsorption/desorption isotherm at 77 K, the brown area denotes the pressure range utilized for the validation of the model; (b) Comparison between experimental values and the fitting curve of adsorption behavior.
The statistical results show that the proposed correlation reproduces the experimental data with high accuracy. The relative residual distribution between the experimental and fitted values is presented in Figure 5, where the orange-shaded region denotes relative residuals within ±5%. It can be found that most relative residuals fall within ±5% except in the extremely low pressure range. In addition, the coefficient of determination (R2) is calculated to be 0.987. These results confirm that the correlation provides a statistically consistent description of the catalytic POC behavior within the investigated range.

Figure 5.
Relative Residual distribution between the experimental and fitted values. The orange-shaded region denotes relative residuals within ±5%.
3.2. Influence of the Flow Rate on the Conversion Efficiency
Figure 6 depicts the effect of flow speed on the conversion rate under steady-state conditions at 350 kPa and 197.0 K. Instead of using an absolute flow rate, the dimensionless parameter Vspace introduced previously as defined in Equation (3) was adopted, which includes the coupling relationship between the gas flow and the catalyst porous media in the converter. As shown by the curve, the conversion efficiency Rconversion approaches 100% under very low Vspace and declines sharply with increasing Vspace, dropping to below 20% when it exceeds 2000 min−1. This phenomenon is owing to the fact that at low Vspace, the residence time of gas molecules on the catalyst surface is sufficiently long, allowing the catalyst surface to accommodate all gas molecules for complete catalytic conversion, resulting in a high Rconversion. However, as the catalyst surface becomes increasingly occupied by the adsorbed gas molecules, further increases in flow speed lead to a bypass of a large portion of the p-H2 that does not participate in the catalytic conversion process. Additionally, such a higher flow speed suppresses the adsorption of gas molecules, causing the conversion rate to decrease gradually.
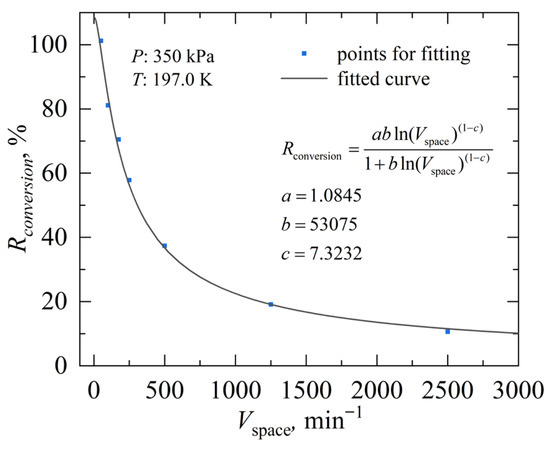
Figure 6.
Fitting beween Rconversion and Vspace under a fixed working condition.
The parameters a, b, and c in Equation (11) are fitted to be 1.0854, 53075, and 7.3232, respectively. The well-fitted performance demonstrates that the model effectively reflects the relationship between conversion efficiency and space velocity.
3.3. Influence of the Temperature and Pressure on the Conversion Efficiency
Figure 7 presents the variation in catalytic conversion efficiency with space velocity within the temperature range of 141.9~229.9 K and the pressure range of 150~550 kPa. The curves are created by Equation (11), while the points represent the experimental measurement. The parameters of a, b, and c in the empirical correlation are given in Table 1. In general, the curves agree well with the measurements at different pressures and temperatures, which both show that the conversion efficiency is higher at low space velocities and decreases as the space velocity increases.
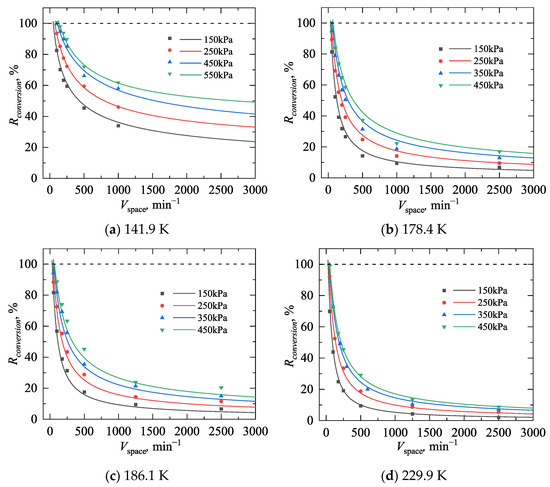
Figure 7.
Comparison between the conversion efficiency model and experimental values.

Table 1.
Correlation coefficients used to fit the parameter a/b/c.
For the application of the POC process within a VSC, it is important to determine the minimum space velocity required to achieve 100% catalytic conversion efficiency. It can be observed from the figure that at the same temperature, a high-pressure environment (350~550 kPa) ensures 100% conversion efficiency at a maximum space velocity of 50 min−1, while a low-pressure environment (150~250 kPa) requires further reduction in space velocity to achieve high conversion efficiency. At the same pressure, as the temperature increases, the conversion efficiency decreases more rapidly with increasing space velocity, indicating the suppression effect of temperature on the catalytic POC process. This finding aligns with the experimental results measured by Nast et al. under negative pressure conditions [29]. These correlations are qualified for subsequent simulations.
4. Conclusions
In summary, correlations for the para-to-ortho hydrogen conversion efficiency in the vapor-cooled shield pipelines were developed based on the Langmuir equation. Conversion efficiency rather than component concentration was defined and utilized to quantify the performance of the catalytic para-to-ortho hydrogen conversion processes. Hydrogen adsorption isotherms were measured and utilized for the validation of the developed correlations. Results show that the fitted values align closely with the actual values, with a deviation of less than 5% except at very low pressures, indicating the appropriateness of adopting a Langmuir-like equation for correlation development. Moreover, the experimental results from the cryogenic hydrogen catalytic conversion facility designed before were applied and utilized for the validation. The developed correlation effectively captures the effects of temperature, pressure, and flow rate on catalytic conversion efficiency observed in the experimental results, making it suitable for subsequent simulation calculations.
Author Contributions
Y.Z.: writing—original draft, investigation, formal analysis. C.M.: writing—review and editing, investigation, formal analysis. Y.H.: review and editing, methodology, supervision, funding acquisition. All authors have read and agreed to the published version of the manuscript.
Funding
This study was supported by the National Key Research and Development Program of China (Grant No. 2022YFE0210200), the Oceanic Interdisciplinary Program of Shanghai Jiao Tong University (project number SL2023ZD101), and the Sichuan Tianfu Emei Program (2728).
Data Availability Statement
The original contributions presented in this study are included in the article. Further inquiries can be directed to the corresponding author.
Conflicts of Interest
The authors declare no conflicts of interest.
References
- Simonini, A.; Dreyer, M.; Urbano, A.; Sanfedino, F.; Himeno, T.; Behruzi, P.; Avila, M.; Pinho, J.; Peveroni, L.; Gouriet, J.-B. Cryogenic propellant management in space: Open challenges and perspectives. npj Microgravity 2024, 10, 34. [Google Scholar] [CrossRef] [PubMed]
- Zhang, T.; Uratani, J.; Huang, Y.; Xu, L.; Griffiths, S.; Ding, Y. Hydrogen liquefaction and storage: Recent progress and perspectives. Renew. Sustain. Energy Rev. 2023, 176, 113204. [Google Scholar] [CrossRef]
- Morales-Ospino, R.; Celzard, A.; Fierro, V. Strategies to recover and minimize boil-off losses during liquid hydrogen storage. Renew. Sustain. Energy Rev. 2023, 182, 113360. [Google Scholar] [CrossRef]
- Jiang, W.B.; Yang, Z.H.; Zuo, Z.Q.; Sun, P.J.; Li, P.; Huang, Y.H. Experimental investigation on combination of vapor cooled shield (VCS) and multilayer insulation (MLI) for cryogenic application. IOP Conf. Ser. Mater. Sci. Eng. 2020, 755, 012153. [Google Scholar] [CrossRef]
- Jiang, W.; Yang, Y.; Hu, C.; Li, P.; Sun, P.; Huang, Y. Experimental study on composite insulation with foam, multilayer and vapor cooled shield for cryogen storage under different vacuum conditions. Cryogenics 2023, 129, 103604. [Google Scholar] [CrossRef]
- Jiang, W.; Sun, P.; Li, P.; Zuo, Z.; Huang, Y. Transient thermal behavior of multi-layer insulation coupled with vapor cooled shield used for liquid hydrogen storage tank. Energy 2021, 231, 120859. [Google Scholar] [CrossRef]
- Zhou, Z.; Wu, J.; Zhang, S.; Gong, M.; Liu, X. Experimental Investigation on Pressure-Control Characteristics of Liquid Hydrogen Tank Based on Active and Passive Thermodynamic Venting System Technology. Processes 2023, 11, 1831. [Google Scholar] [CrossRef]
- Zhang, W.; Zhang, H.; Wang, B.; Jiang, W.; Miao, R.; Huang, Y. Liquefaction and filling of liquid methane and oxygen bipropellant in a common bulkhead tank equipped with a zero boil-off system. Cryogenics 2024, 143, 103943. [Google Scholar] [CrossRef]
- Jiang, W.B.; Zuo, Z.Q.; Huang, Y.H.; Wang, B.; Sun, P.J.; Li, P. Coupling optimization of composite insulation and vapor-cooled shield for on-orbit cryogenic storage tank. Cryogenics 2018, 96, 90–98. [Google Scholar] [CrossRef]
- Stewart, A.T.; Squires, G.L. Analysis of ortho- and para-hydrogen mixtures by the thermal conductivity method. J. Sci. Instrum. 1955, 32, 26. [Google Scholar] [CrossRef]
- Xu, Z.; Tan, H.; Wu, H. Performance comparison of multilayer insulation coupled with vapor cooled shield and different para-ortho hydrogen conversion types. Appl. Therm. Eng. 2023, 234, 121250. [Google Scholar] [CrossRef]
- Milenko, Y.Y.; Sibileva, R.M.; Strzhemechny, M.A. Natural ortho-para conversion rate in liquid and gaseous hydrogen. J. Low Temp. Phys. 1997, 107, 77–92. [Google Scholar] [CrossRef]
- Wigner, E.P. Über die paramagnetische Umwandlung von Para-Orthowasserstoff. III. In Part I: Physical Chemistry. Part II: Solid State Physics; Wightman, A.S., Ed.; Springer: Berlin/Heidelberg, Germany, 1997; pp. 126–130. ISBN 978-3-642-59033-7. [Google Scholar]
- Hutchinson, H.L.; Barrick, P.L.; Brown, L.F. Experimental Study of Reaction Kinetics for Para-Orthohydrogen at 20° to 80°K. In Advances in Cryogenic Engineering; Timmerhaus, K.D., Ed.; Springer: Boston, MA, USA, 1965; pp. 190–196. [Google Scholar]
- Petitpas, G.; Aceves, S.M.; Matthews, M.J.; Smith, J.R. Para-H2 to ortho-H2 conversion in a full-scale automotive cryogenic pressurized hydrogen storage up to 345 bar. Int. J. Hydrogen Energy 2014, 39, 6533–6547. [Google Scholar] [CrossRef]
- Meng, C.; Zhang, J.; Zhang, W.; Zheng, Z.; Huang, Y. Measurement of component concentration and conversion rate from parahydrogen to orthohydrogen in a catalytic converter. Int. J. Hydrogen Energy 2025, 97, 970–980. [Google Scholar] [CrossRef]
- Petzinger, K.G.; Scalapino, D.J. Para- to Ortho-Hydrogen Conversion on Magnetic Surfaces. Phys. Rev. B 1973, 8, 266–279. [Google Scholar] [CrossRef]
- Harrison, L.G.; McDowell, C.A.; Bawn, C.E.H. The catalysis of the para-hydrogen conversion by the solid free radical αα-diphenyl-β-picryl hydrazyl. Proc. R. Soc. London. Ser. A Math. Phys. Sci. 1997, 220, 77–90. [Google Scholar] [CrossRef]
- Ishii, Y. Theory of non-dissociative ortho-para conversion on magnetic surfaces. Prog. Surf. Sci. 1986, 21, 163–208. [Google Scholar] [CrossRef]
- Meng, C.; Qin, X.; Jiang, W.; Pu, L.; Liu, W.; Huang, Y. Cooling effect analysis on para-ortho hydrogen conversion coupled in vapor-cooled shield. Int. J. Hydrog. Energy 2023, 48, 15600–15611. [Google Scholar] [CrossRef]
- Lv, H.; Zhang, Z.; Chen, L.; Zhang, Z.; Chen, S.; Hou, Y. Thermodynamic analysis of vapor-cooled shield with para-to-ortho hydrogen conversion in composite multilayer insulation structure for liquid hydrogen tank. Int. J. Hydrogen Energy 2024, 50, 1448–1462. [Google Scholar] [CrossRef]
- Hutchinson, H.L.; Brown, L.F.; Barrick, P.L. A comparison of rate expressions for the low-temperature para-orthohydrogen shift. In Advances in Cryogenic Engineering; Timmerhaus, K.D., Ed.; Springer: Boston, MA, USA, 1971; pp. 96–103. ISBN 978-1-4757-0244-6. [Google Scholar]
- Hutchinson, H.L. Analysis of Catalytic Ortho-Parahydrogen Reaction Mechanisms; University of Colorado: Boulder, CO, USA, 1966. [Google Scholar]
- Wilhelmsen, Ø.; Berstad, D.; Aasen, A.; Nekså, P.; Skaugen, G. Reducing the exergy destruction in the cryogenic heat exchangers of hydrogen liquefaction processes. Int. J. Hydrogen Energy 2018, 43, 5033–5047. [Google Scholar] [CrossRef]
- Karlsson, E. Catalytic Ortho- to Parahydrogen Conversion in Liquid Hydrogen. Master’s Thesis, Lund University, Lund, Sweden, 2017. [Google Scholar]
- Thommes, M.; Kaneko, K.; Neimark, A.V.; Olivier, J.P.; Rodriguez-Reinoso, F.; Rouquerol, J.; Sing, K.S.W. Physisorption of gases, with special reference to the evaluation of surface area and pore size distribution (IUPAC Technical Report). Pure Appl. Chem. 2015, 87, 1051–1069. [Google Scholar] [CrossRef]
- Pang, J.; Hampsey, J.E.; Wu, Z.; Hu, Q.; Lu, Y. Hydrogen adsorption in mesoporous carbons. Appl. Phys. Lett. 2004, 85, 4887–4889. [Google Scholar] [CrossRef]
- Murialdo, M.; Weadock, N.J.; Liu, Y.; Ahn, C.C.; Baker, S.E.; Landskron, K.; Fultz, B. High-pressure hydrogen adsorption on a porous electron-rich covalent organonitridic framework. ACS Omega 2019, 4, 444–448. [Google Scholar] [CrossRef]
- Nast, T.C. Investigation of a Para-Ortho Hydrogen Reactor for Application to Spacecraft Sensor Cooling; Lockheed Missiles and Space Company: Palo Alto, CA, USA, 1983. [Google Scholar]
Disclaimer/Publisher’s Note: The statements, opinions and data contained in all publications are solely those of the individual author(s) and contributor(s) and not of MDPI and/or the editor(s). MDPI and/or the editor(s) disclaim responsibility for any injury to people or property resulting from any ideas, methods, instructions or products referred to in the content. |
© 2025 by the authors. Licensee MDPI, Basel, Switzerland. This article is an open access article distributed under the terms and conditions of the Creative Commons Attribution (CC BY) license (https://creativecommons.org/licenses/by/4.0/).