1. Introduction
Highly expansive soils, as a type of special soil with significant expansiveness, exert substantial impacts and pose challenges to various engineering projects [
1,
2,
3,
4]. Based on on-site geological investigations conducted in the Nanyang section of the South-to-North Water Diversion Project’s middle route [
5,
6,
7,
8], over 100 expansive soil samples were collected and classified into expansion levels. The typical distribution areas of highly expansive soils were identified [
8,
9,
10], including segments such as Nanyang Segment 2 and Nanyang Segment 3. These soils are primarily found at the excavation bases of channels, with some occurrences on channel slopes. Investigations reveal that highly expansive soils exhibit distinct macro-characteristics, notably the development of fissures filled with a significant amount of infill material. These fissured soils present considerable challenges to the design and construction of channels.
This study proposes a nonlinear regression expansion model tailored to the characteristics of fissured highly expansive soils. Through an in-depth analysis of the distribution characteristics of soil fissures, the model aims to elucidate the expansion mechanism of expansive soils and their relationship with fissure characteristics. By integrating field geological data and employing nonlinear regression methods, the model provides more accurate predictions of the expansive behavior of highly expansive soils under various construction conditions. This serves as theoretical and technical support for the design and construction of channels in regions with highly expansive soils.
In recent years, machine learning has emerged as an effective approach for analyzing the complex nonlinear behavior of expansive soils. Neural-network-based models have shown high accuracy in estimating swelling pressure and deformation parameters. Taherdangkoo et al. [
11] developed an efficient neural network model for predicting the maximum swelling pressure of clayey soils, while Elakiya and Keerthana [
12] confirmed the feasibility of applying artificial neural networks to represent soil–water interaction processes.
Subsequent studies have further extended these methods to more complex and small-sample problems. Mohammed et al. [
13] demonstrated that data-driven regression approaches outperform traditional empirical formulas in predicting soil swelling. Li et al. [
14] proposed a multi-algorithm ensemble framework to improve generalization in high-dimensional, small-sample datasets, and Yao et al. [
15] incorporated fissure ratio, density, moisture, and loading effects into a nonlinear regression model, verifying that fissure development plays a dominant role in swelling behavior.
Meanwhile, time-dependent and stress-dependent responses have been investigated to capture long-term deformation characteristics. Li et al. [
10] examined the in-situ creep behavior of expansive soils through pressuremeter tests, and Alnmr et al. [
16] introduced a machine-learning-powered approach for optimizing unit weight and stress parameters to mitigate swelling.
These advances demonstrate that data-driven modeling provides a promising pathway for improving the accuracy of swelling prediction and control. However, few existing studies have explicitly coupled fissure ratio with key physical parameters in a unified nonlinear framework. To address this limitation, the present study develops a nonlinear regression expansion model that integrates fissure ratio, dry density, initial water content, and overburden stress. The proposed model enhances predictive reliability for fissured expansive soils and offers practical guidance for deformation control and risk management in dam and channel engineering.
2. Characteristics of Fissures and Quantitative Representation
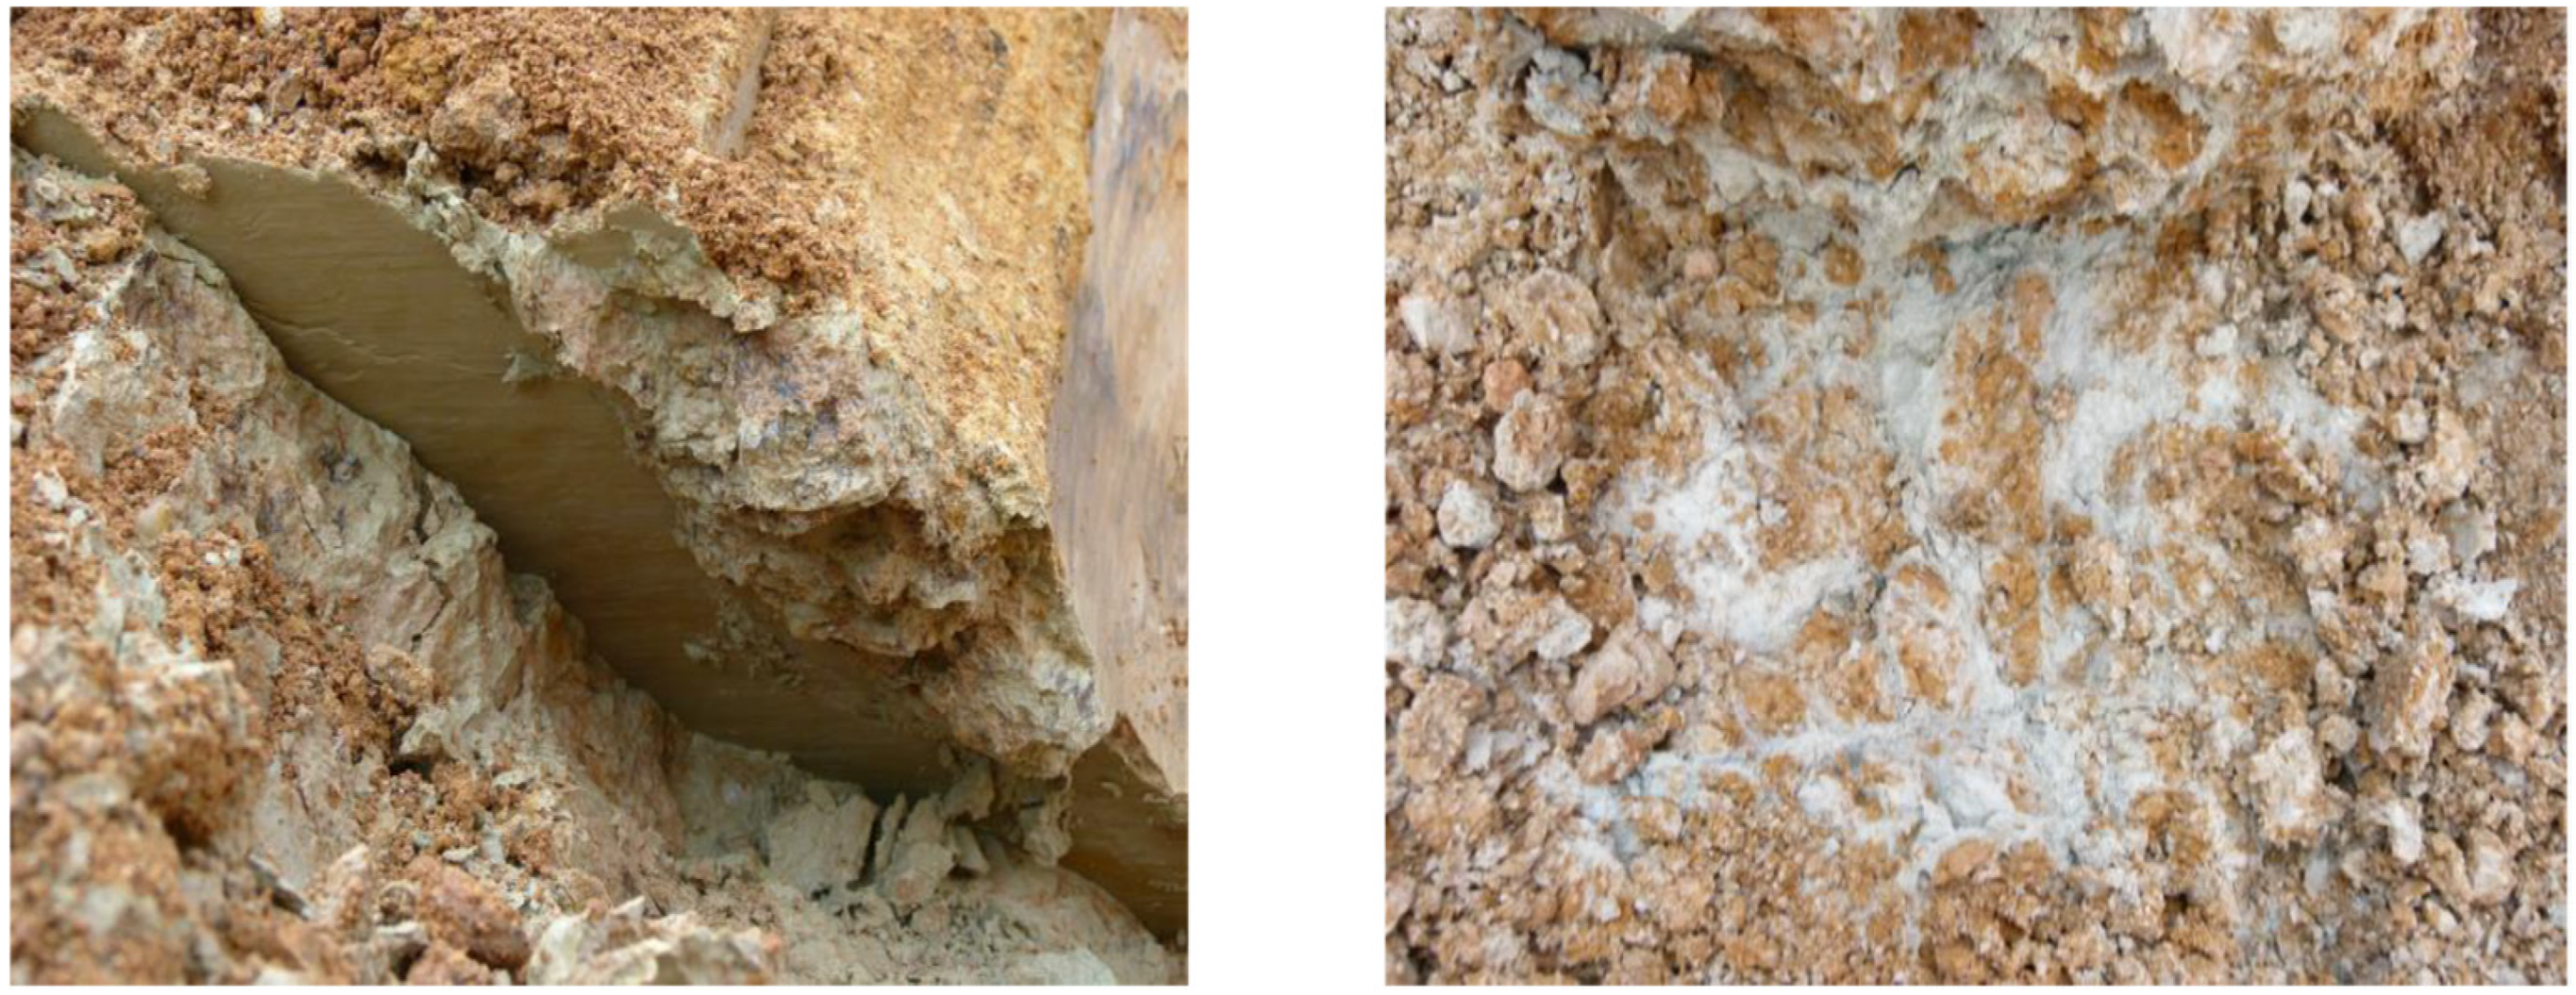
Fissures in expansive soils are generally categorized into primary and secondary types according to their formation mechanisms. The primary fissures arise from differential shrinkage stresses within the soil mass and represent the original structural planes; they usually taper downward and are commonly filled with later-deposited clay. Secondary fissures are mainly tension- or shear-induced cracks produced by variations in external or internal stresses. They are more widespread, have relatively smooth surfaces, and are frequently filled with gray-green or grayish-white clay that is more expansive and exhibits poorer engineering performance than the parent material [
17], as illustrated in
Figure 1.
Field observations indicate that fissures in the Nanyang expansive clay are predominantly filled rather than open. Even at depths greater than 15 m, well-developed fissure traces can still be observed within the slope profile. Under high overburden stress, the fissures are typically filled with gray-green clay rich in hydrophilic minerals such as montmorillonite and illite. The infill, believed to result from long-term groundwater-mediated ion exchange and mineral deposition, usually ranges from 2 to 5 mm in thickness, occasionally reaching more than 10 mm. These fine-grained, high-moisture infills exhibit pronounced expansiveness and low strength (modified from [
17]).
In the expansive soil slopes of Nanyang, where groundwater activity is frequent, most fissures are filled with gray-green clay, with a smaller proportion filled with calcareous or ferruginous material. Fissures without infill are rare. Studies indicate that weakly expansive soils have 64.3% to 83.9% of fissures filled with gray-green clay. In moderately expansive soil zones, this proportion exhibits vertical zonation, with approximately 80% of fissures within 6 m’ depth being filled. In contrast, in highly expansive soils, where the depth is greater, over 90% of fissures are filled with gray-green clay. In practice, Kr was prescribed at mixing by converting oven-dry masses of the gray-green infill and the matrix to volumes using their particle densities (V = m/ρs, measured by pycnometer); thus the reported Kr equals the target volumetric fraction at mixing.
Geological setting (Nanyang). The tested soil in this study comes from the Nanyang section and belongs to the lower part of the Middle Pleistocene alluvial–proluvial deposits (al-plQ2). Macroscopically, the strong expansive layer is light-yellow to light-brown with gray-green streaks; very large fissures are absent, large fissures occur, and small fissures are extremely dense. Fissure surfaces are smooth and slightly undulating and are predominantly filled by gray-green clay of 2–5 mm thickness; no groundwater was observed during excavation of the strong expansive layer.
Mineralogical composition (XRD, Nanyang). Representative bulk X-ray diffraction of the Nanyang strong expansive clay (al-plQ2) shows a smectite-dominated assemblage with the following average composition taken from the Nanyang entry of our XRD table: smectite 53.0%, chlorite 4.0%, illite 3.0%, kaolinite 3.0%, quartz 40.0%, feldspar 1.0%, calcite ~0%. The gray-green fissure infill was sampled from the same stratigraphic horizon; separate XRD was not performed, and no additional mineral phases were identified at the macroscopic investigation scale. Accordingly, the remolded specimens are treated as volumetric mixtures of matrix and infill within the same mineral suite.
Representativeness of remolded specimens. The specimens in this study were intentionally remolded as controlled volumetric mixtures of the matrix clay and the gray-green fissure infill, both sampled from the same stratigraphic horizon of the Nanyang section. This design prescribes the fissure ratio Kr through the mixture proportion and thereby isolates the compositional effect (mineral suite and fines content) together with the state variables (ρd, wi, σv) on the ultimate expansion δep under confinement. In the Nanyang field setting, fissures are predominantly infilled and the infill shares the same clay-mineral assemblage as the matrix; under one-dimensional inundation tests, the final expansion magnitude is therefore expected to be governed primarily by composition and state, rather than by the intact macro-fissure geometry. Consequently, the present regression model does not address behaviors controlled by open or partially infilled fissures or by intact macro-fabric anisotropy (which mainly affect wetting paths and early-time kinetics). Applications to such cases should be made with caution.
To quantify fissure development in highly expansive soils, the infill content is proposed as a determinant. Assuming that fissures in highly expansive soils are entirely filled with gray-green clay, the fissure ratio (Kr), defined as the ratio of fissure volume to the volume of the surrounding soil matrix, can be indirectly described using the ratio of gray-white clay to yellow-brown matrix clay content. This establishes a quantitative index for the fissure content in highly expansive soils.
Swell test procedure. One-dimensional swell tests were performed in an oedometer following ASTM D4546-14 [
18] under a constant vertical stress (
σv). Remolded specimens were prepared to the target dry density (
ρd) and initial water content (
wi), placed in the ring, seated under
σv, and then inundated at room temperature. Vertical deformation was recorded versus time on a logarithmic schedule until the deformation–time curve stabilized (plateau), at which point the ultimate expansion
δep (%) was read. Because swelling causes irreversible structural changes, one freshly prepared specimen per condition was tested under standardized preparation/compaction/moisture-conditioning.
Specimen preparation and test conditions. Cylindrical specimens were prepared in oedometer rings with an inner diameter of 61.8 mm and a height of 20 mm, consistent with the Specification of Soil Test Methods (SL 237-1999) [
19]. The test procedure followed ASTM D4546-14 for one-dimensional swelling under vertical stresses of 0, 25, and 50 kPa. Specimens were compacted to target dry densities of 1.45, 1.50, and 1.55 g/cm
3 with initial water contents of 20, 25, and 30%. Each condition was tested on three parallel specimens, and the average ultimate expansion (
δep) was reported. After seating under the applied stress, distilled water was added until the water level was 1–2 mm above the specimen surface. Vertical deformation was monitored at 20 ± 2 °C with a displacement transducer of 0.001 mm resolution. Swelling was considered complete when the deformation rate was less than 0.01 mm h
−1 for 24 h, and the ultimate expansion was calculated as the ratio of stabilized vertical deformation to the initial specimen height.
3. Analysis of Factors Influencing Hygroscopic Expansion in Fissured Expansive Soils
Using the quantified fissure ratio (
Kr) as a key factor, the hygroscopic expansion deformation of expansive soils was incorporated into the model. Expansion rate experiments were conducted using fissure-filling gray-white clay collected from Nanyang Segment 2 and Segment 3. The matrix soil samples, consisting of yellow-brown expansive soil from channel slopes and bottoms, had their physical properties analyzed (see
Table 1).
Gray-white clay content ratios of 35%, 50%, and 65% were used to prepare remolded expansive soil samples in the laboratory, simulating fissure ratios of 35%, 50%, and 65% for highly expansive soils. Hygroscopic expansion deformation was studied under different conditions, including dry densities (1.45, 1.50, 1.55 g/cm
3), initial water contents (20%, 25%, 30%), and loads (0, 25, 50 kPa). Expansion experiments were conducted, and results are summarized in
Table 2.
Subsequently, the correlations between the ultimate expansion (
δep) and fissure ratio (
Kr), dry density (
ρd), and initial water content (
w0) are illustrated in
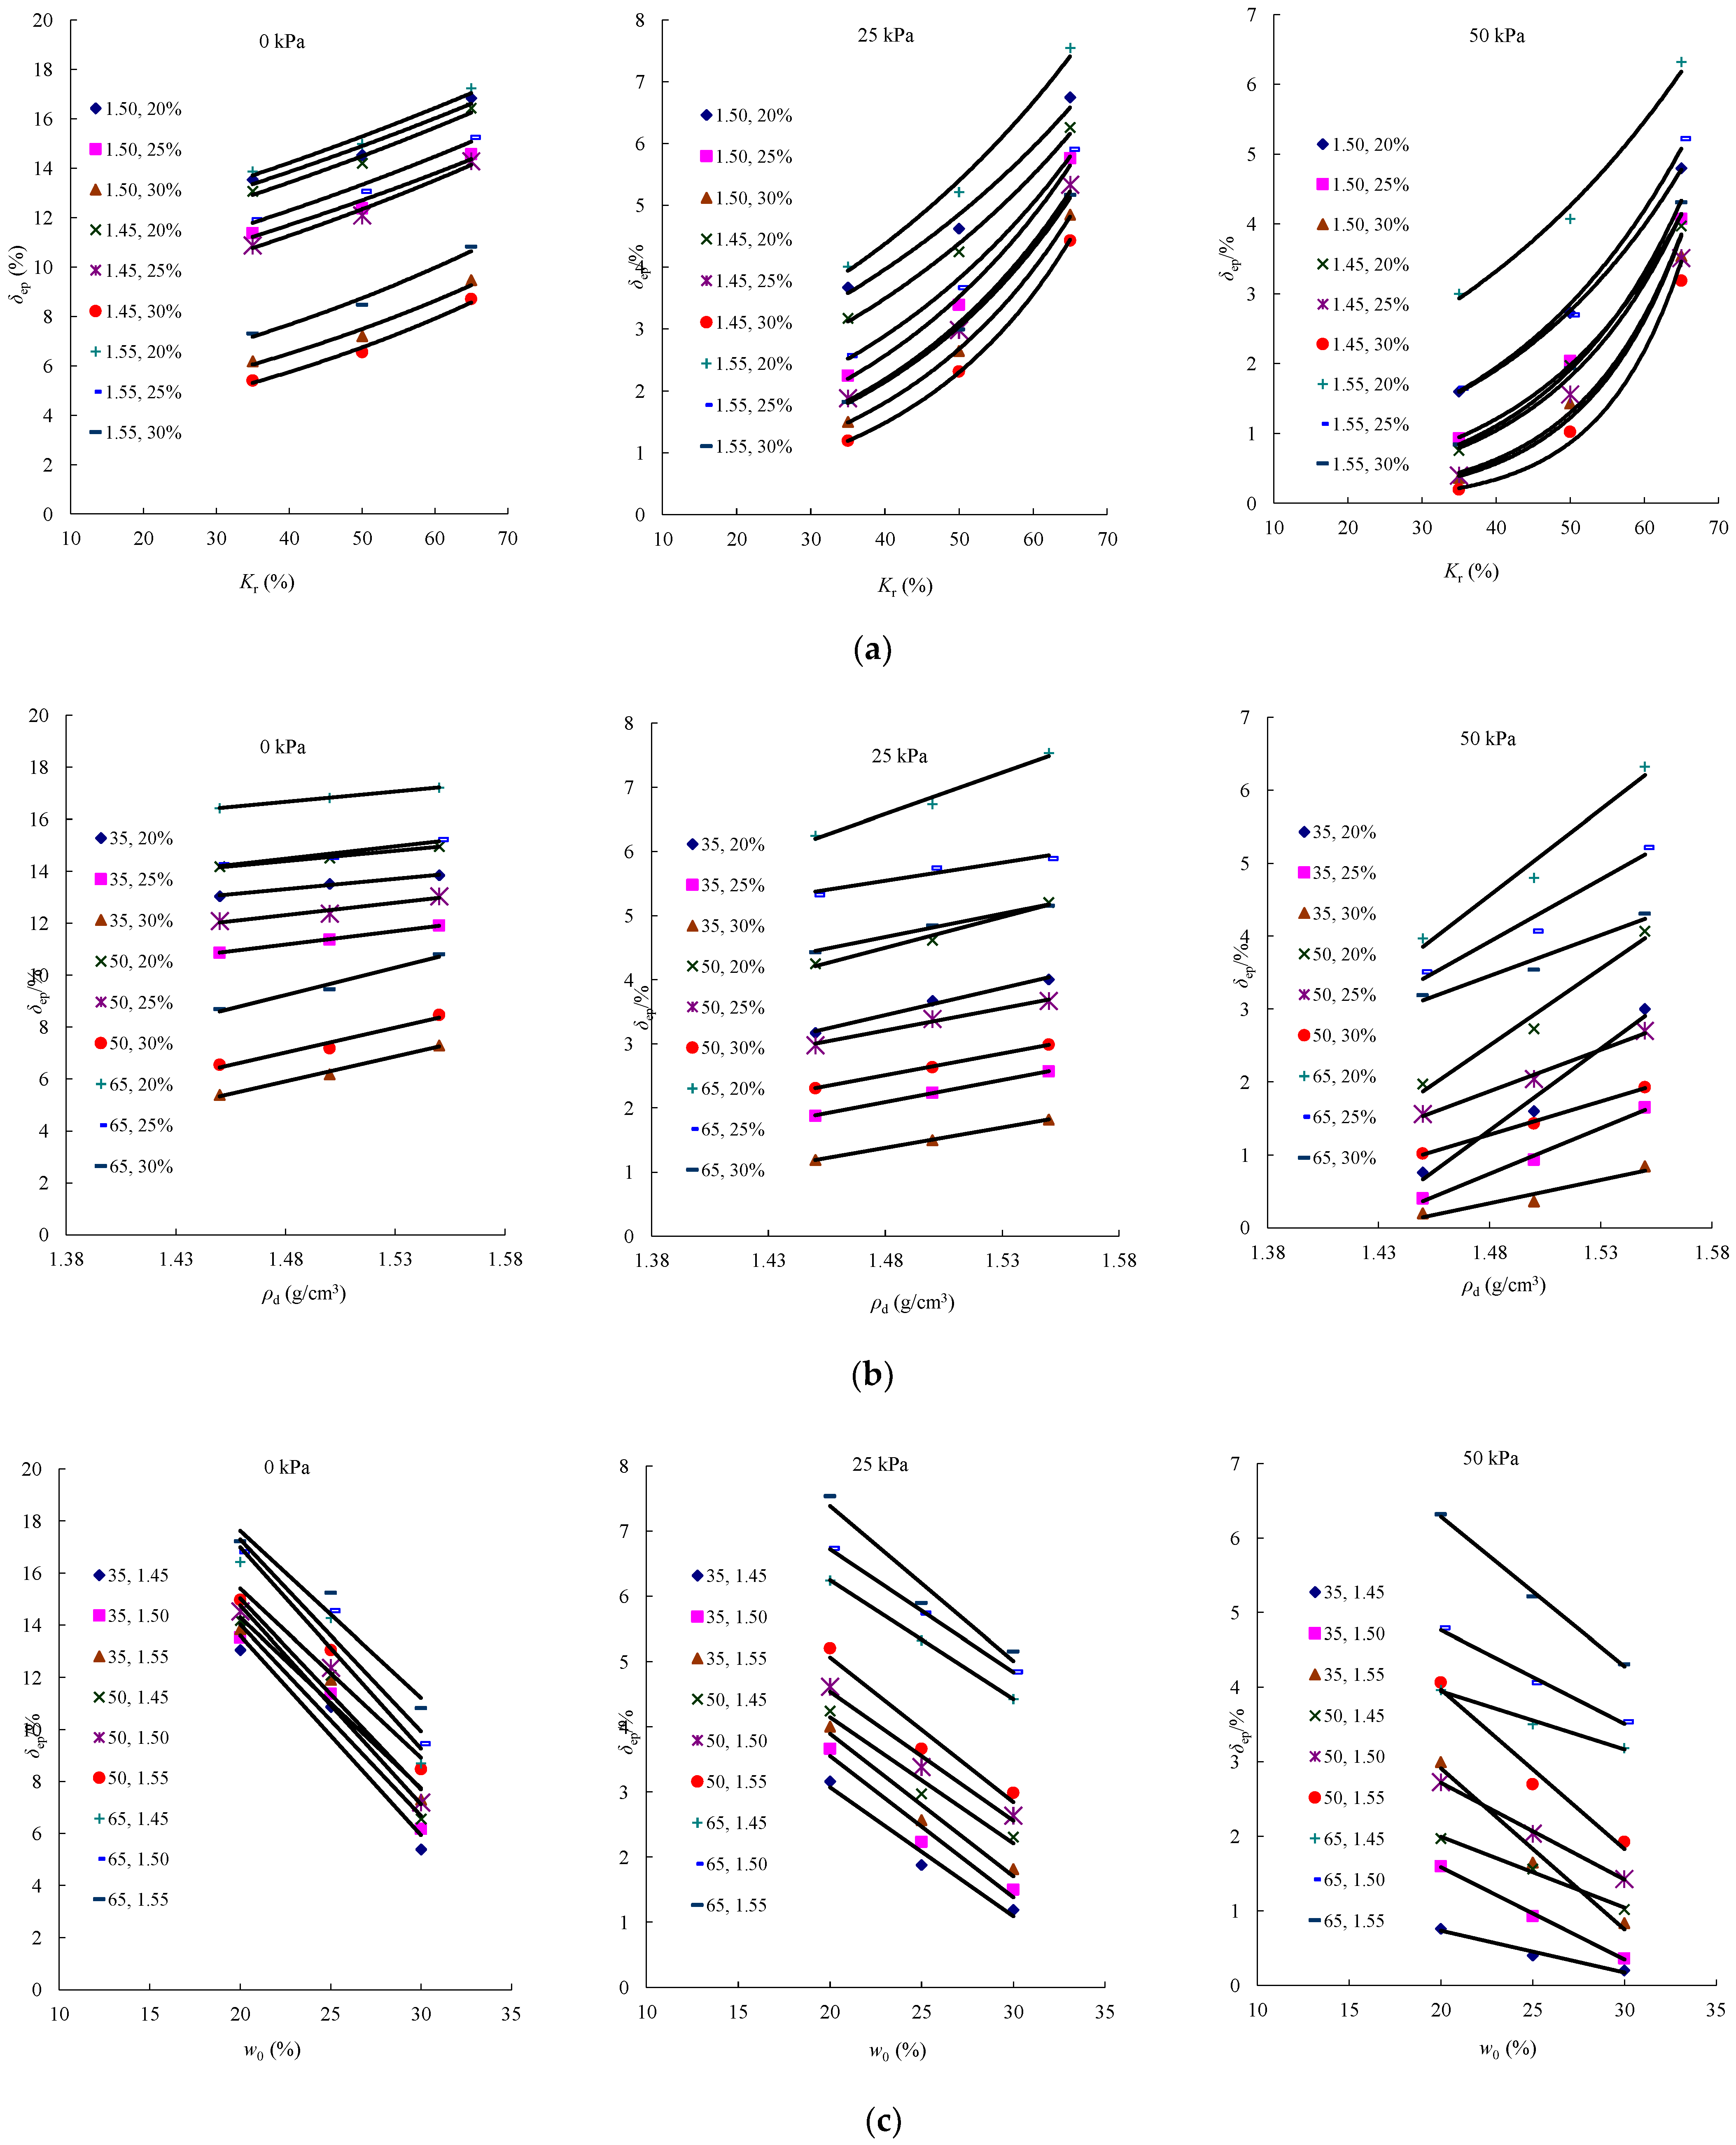
Figure 2 and analyzed as follows:
3.1. Correlation Between Ultimate Expansion (δep) and Fissure Ratio (Kr)
The relationship between ultimate expansion (
δep) and fissure ratio (
Kr) under varying conditions of overburden stress (σ), dry density (
ρd), and initial water content (
w0) is illustrated in
Figure 2a.
Analysis reveals that, under different initial water contents, dry densities, and overburden stress levels, the trend of ultimate expansion (δep) with fissure ratio (Kr) remains consistent, following an exponential relationship. A higher fissure ratio corresponds to stronger fissure characteristics in expansive soils, greater infill material content, and a larger ultimate expansion. Additionally, soils with more infill-filled fissures exhibit greater variation in ultimate expansion.
Overall, fissure ratio primarily reflects the structural characteristics of the soil, while dry density represents the compaction state of the matrix. Their combined influence governs the overall swelling potential.
3.2. Correlation Between Ultimate Expansion (δep) and Dry Density (ρd)
The relationship between ultimate expansion (
δep) and dry density (
ρd) under varying conditions of overburden stress (σ), fissure ratio (
Kr), and initial water content (
w0) is illustrated in
Figure 2b.
It is observed that, for all given conditions, the ultimate expansion (δep) exhibits a nearly linear relationship with dry density (ρd). In particular, when initial water content (w0) and fissure ratio (Kr) are constant, increasing dry density leads to an increase in the ultimate expansion (δep), indicating that dry density plays a significant role in determining the expansion behavior of fissured expansive soils.
In addition to fissure ratio and dry density, the initial water content also plays a critical role, as it directly controls the moisture absorption and subsequent expansion of the soil skeleton.
3.3. Correlation Between Ultimate Expansion (δep) and Initial Water Content (w0)
The relationship between ultimate expansion (
δep) and initial water content (
w0) under varying conditions of overburden stress (σ), fissure ratio (
Kr), and dry density (
ρd), is illustrated in
Figure 2c.
Analysis shows that, across different dry densities, fissure ratios, and overburden stresses, the ultimate expansion (δep) exhibits a negative linear relationship with initial water content (w0). Specifically, under identical conditions, when the dry density is higher, the ultimate expansion is more significantly influenced by the initial water content, with a rapid decrease in the ultimate expansion as the initial water content increases.
4. Expansion Models and Sensitivity Analysis for Expansive Soils with Different Fissure Ratios
Based on the results of the expansion rate experiments, the ultimate expansion of expansive soils (δep) is influenced by the combined effects of initial water content (w0), dry density (ρd), overburden stress (σ), and fissure ratio (Kr). The ultimate expansion exhibits linear relationships with w0, ρd, and ln(1 + σ), while showing an exponential relationship with Kr. To this end, statistical analysis software (SPSS 26.0) was employed to conduct regression analysis on the ultimate expansion of highly expansive soils. Sensitivity analysis indicators for the influencing factors were established, and multivariate linear and nonlinear regression expansion models were developed accordingly.
When the fissure ratio (Kr) is constant, the ultimate expansion (δep) exhibits linear relationships with its influencing factors w0, ρd, and ln(1 + σ). Therefore, multivariate linear regression models can be established under different fissure ratios (Kr). SPSS provides multiple methods for regression analysis, including enter method, stepwise elimination method, forward selection method, backward elimination method, and stepwise selection method. In this study, the ultimate expansion (δep) was set as the dependent variable, while w0, ρd, and ln(1 + σ) were set as independent variables. The relationships and significance of these variables with the dependent variable were analyzed theoretically. To ensure the completeness and comprehensiveness of the model, the enter method was adopted, which incorporates all selected independent variables into the regression model during analysis.
The significance of the multivariate regression equation and regression coefficients was evaluated using standard statistical procedures implemented in SPSS 26.0 (IBM Corp., Armonk, NY, USA). The analysis was conducted to examine whether the key physical parameters, namely initial water content (w0), dry density (ρd), and overburden stress ln(1 + σ), had statistically significant effects on the ultimate expansion (δep) under different fissure ratios (Kr).
The overall significance of the regression model was tested using the F-test. The null hypothesis assumes that none of the independent variables contribute to
δep:
where
R2 is the coefficient of determination,
n is the sample size, and
p is the number of independent variables included in the regression model. The obtained
p-values (<0.05) confirmed that the regression equations were significant at the 95% confidence level, indicating that the three independent variables jointly affect the expansion behavior.
The contribution of each independent variable was further evaluated using the
t-test:
where
denotes the estimated regression coefficient of the
j-th independent variable,
lⱼⱼ is the corresponding diagonal element of the covariance matrix, and
Yᵢ and
Ŷᵢ are the measured and predicted values of the dependent variable, respectively. The results showed that both
w0 and
ρd exerted significant effects on
δep, while ln(1 + σ) had a comparatively weaker but still meaningful influence, consistent with the physical trends observed in
Figure 2.
4.1. Fissure Ratios Kr = 35%
The summary of Regression Model and the Analysis of Variance (ANOVA) under fissure ratios
Kr = 35% are listed in
Table 3 and
Table 4.
The regression analysis results are as follows:
It can be observed that the square root of the defined model’s coefficient of determination
R is 0.984, the determination coefficient
is 0.967, and the adjusted determination coefficient
is 0.963, with a standard error of 1.24. These results indicate a high covariation ratio between the independent variables (
w0,
ρd, and ln(1 + σ)) and the dependent variable, demonstrating a good fit between the model and data. The ANOVA table (
Table 2) lists the sources of variation, degrees of freedom, mean squares, F-value, and the significance test for F. The significance level (Sig. < 0.05) confirms the validity and high significance of the regression equation.
The regression coefficients are summarized in
Table 5.
Table 5 lists the values of the regression coefficients and their significance tests. The significance levels for
w0,
ρd, and ln(1 + σ) are all Sig. = 0.000, indicating that these factors significantly influence the ultimate expansion (
δep). Thus, the regression equation for
Kr = 35% is:
The sensitivity coefficients for dry density (ρd), initial water content (w0), and overburden stress (ln(1 + σ)) are 12.757, −35.122, and −2.386, respectively, indicating that initial water content has the greatest impact on ultimate expansion, followed by dry density, with overburden stress having the smallest influence.
4.2. Fissure Ratios Kr = 50%
As shown in the results, the square root of the determination coefficient (R) is 0.987, the determination coefficient () is 0.975, and the adjusted determination coefficient () is 0.972, with a standard error of 1.22. The high R-value indicates a strong fit between the regression model and the data. The significance level of the regression equation (Sig. < 0.05) demonstrates that the model is statistically significant.
Additionally, the significance levels (Sig. = 0.000) for
w0,
ρd, and ln(1 + σ) indicate that all independent variables have a significant impact on the dependent variable. Therefore, the regression equation for
Kr = 35% is given as:
The sensitivity coefficients for dry density (ρd), initial water content (w0), and overburden stress (ln(1 + σ)) are 13.501, −35.161, and −2.389, respectively. This indicates that initial water content has the greatest influence on the ultimate expansion, followed by dry density, with overburden stress having the smallest influence.
4.3. Fissure Ratios Kr = 65%
As with the cases for Kr = 35% and Kr = 50%, the regression model for Kr = 65% demonstrates a high R-value, indicating a strong fit to the data. The significance level of the regression equation (Sig. < 0.05) confirms the validity of the model, and the coefficients of the independent variables (w0, ρd, and ln(1 + σ)) are also statistically significant (Sig. = 0.000).
For
Kr = 65%, the sensitivity coefficients for dry density (
ρd), initial water content (
w0), and overburden stress (ln(1 + σ)) are 14.934, −34.811, and −2.404, respectively. Thus, the regression equation is given as:
4.4. Expansion Model Including Fissure Ratio
According to previous analysis from
Section 4.1,
Section 4.2,
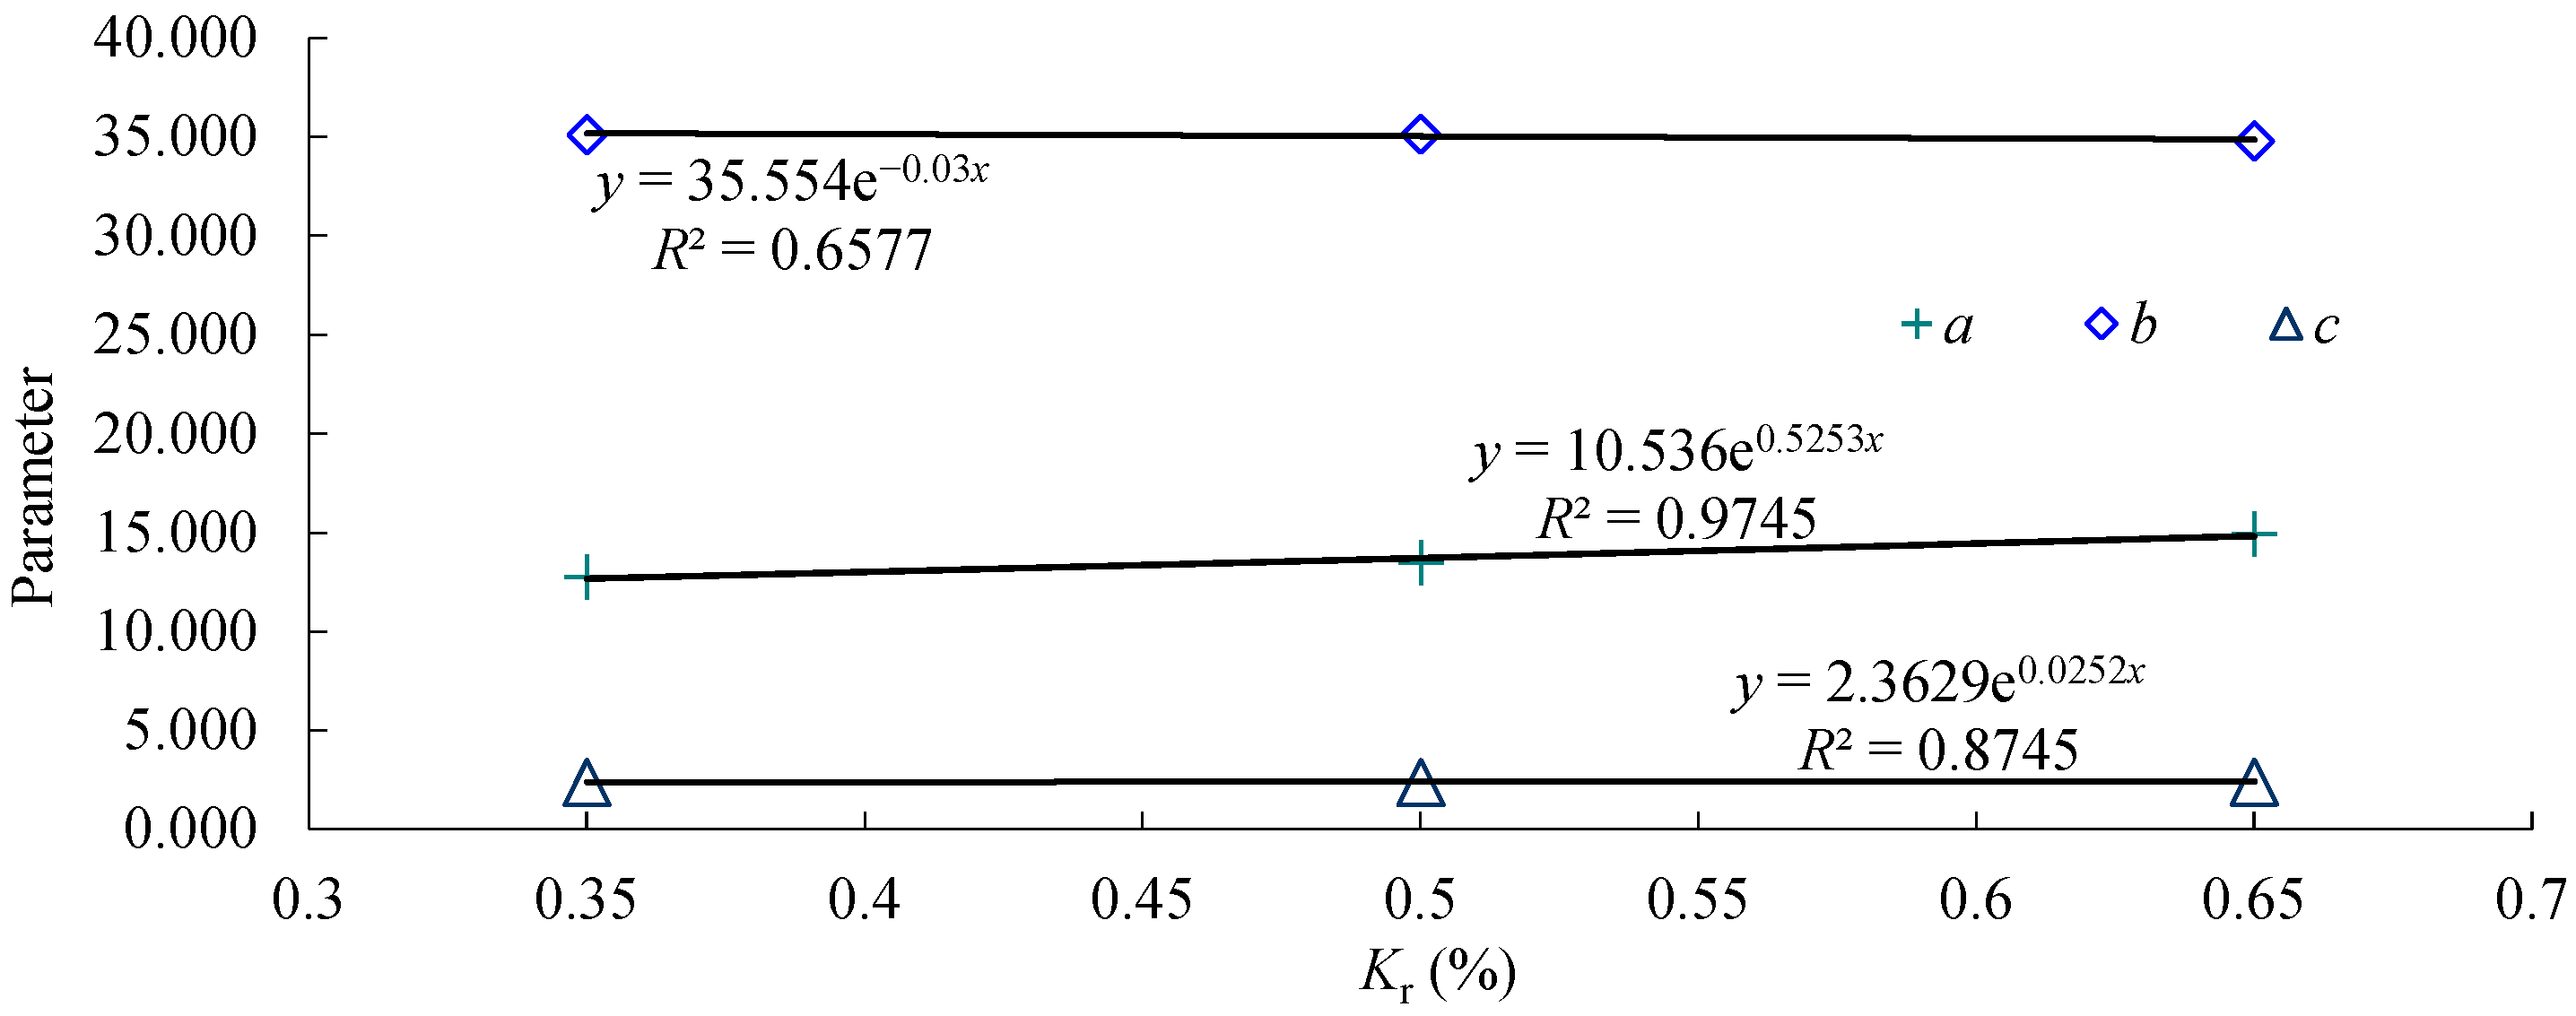
Section 4.3, the regression equation across different fissure ratios can be unified into a generalized form based on Equations (5)–(7):
where
a,
b, and
c are empirical parameters that vary with
Kr. The values of
a,
b, and
c for different fissure ratios are summarized in
Table 12. These values were fitted using exponential functions, and the resulting fitted curves are shown in
Figure 3.
The relationships between fissure ratios
Kr and the parameters
a,
b, and
c are expressed as exponential functions:
Although linear fitting gives a similar coefficient of determination within the tested Kr range, the exponential form was retained because it better represents the nonlinear and asymptotic influence of fissure ratio on the expansion parameters.
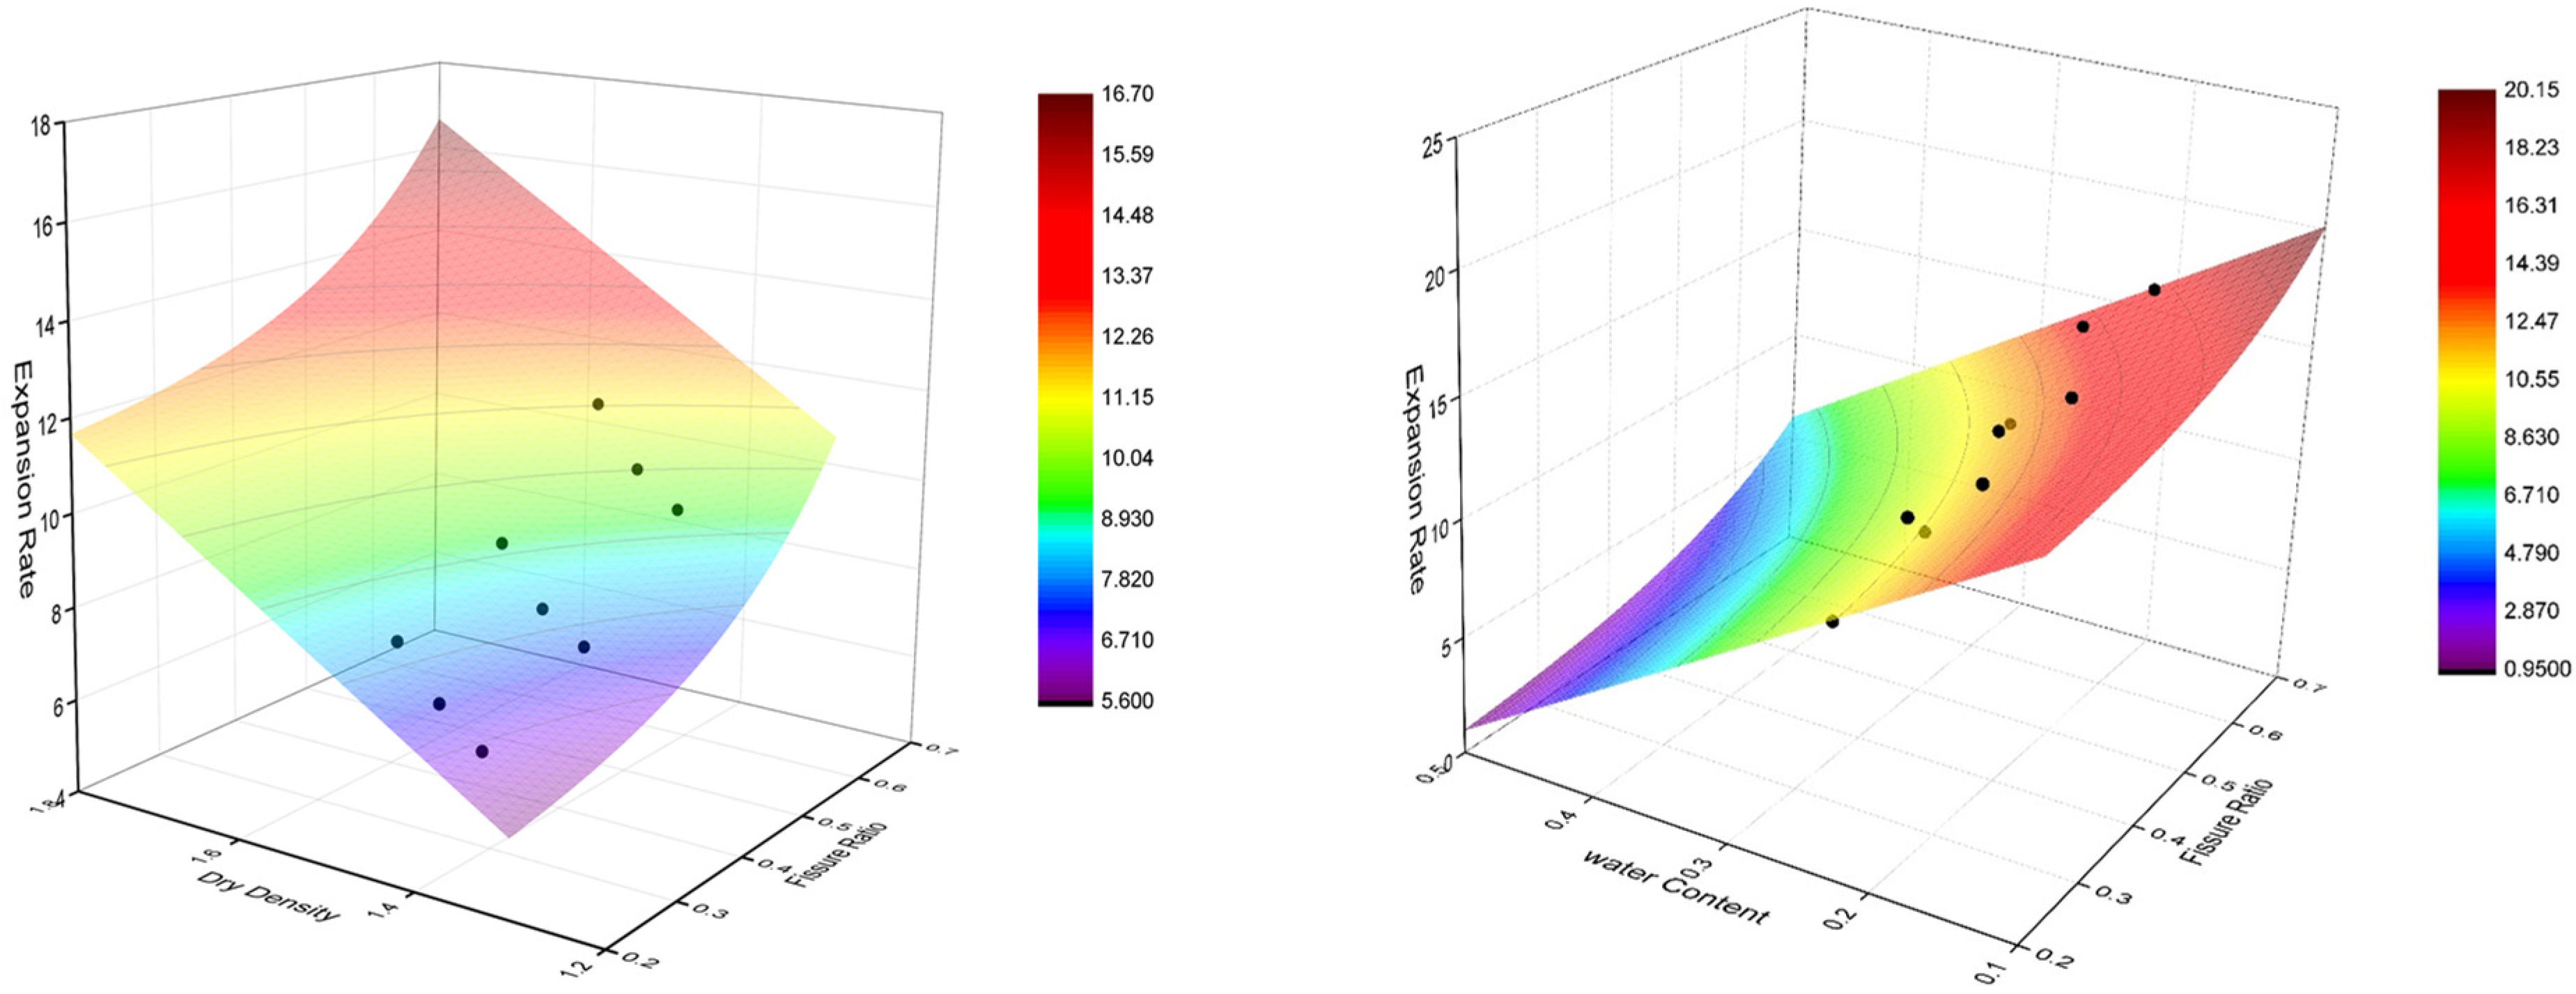
Using the above relationships, the expansion rate model including fissured expansive soils can be expressed as:


