Abstract
Under the impetus of the global urbanization, the synergistic relationship between smart city policies and green innovation capabilities has emerged as a critical agenda for achieving sustainable development goals. While existing studies have explored the techno-economic effects of smart cities, systematic evidence remains scarce regarding their pathways and heterogeneous impacts on green growth. This study investigates the influence of smart city pilot policies on urban green growth trajectories and their heterogeneous characteristics. Leveraging panel data from 293 Chinese prefecture-level cities, we employ a multi-period difference-in-differences (DID) model with two-way fixed effects to control for unobserved city-specific and time-specific factors, complemented by robustness checks including parallel trend tests, placebo tests, and alternative dependent variable specifications. Data sources encompass the China City Statistical Yearbook, CNRDS, and CSMAR databases, covering core metrics such as green patent applications and grants, industrial upgrading indices, and environmental regulation intensity, with missing values being addressed via mean imputation. The findings demonstrate that smart city pilot policies significantly enhance green innovation levels in treated cities, with effects exhibiting pronounced spatial and resource-based heterogeneity; there are notably stronger impacts in non-resource-dependent cities and eastern regions. Mechanism analysis shows that policies are driven by a dual effect of industrial upgrading and environmental regulation. The former is manifested by the high substitution elasticity of the digital economy for traditional manufacturing, while the latter is reflected in the rising compliance costs of polluting enterprises. This research advances a cross-nationally comparable theoretical framework for understanding green transition mechanisms in smart city development while providing empirical benchmarks for policy design in emerging economies.
1. Introduction
Under the dual constraints of sustainable development and the “dual carbon” goals, Chinese cities are facing a dual challenge: low resource utilization efficiency and insufficient environmental carrying capacity [1]. The traditional extensive development model not only exacerbates energy consumption and pollution but also stifles the intrinsic motivation for green technological innovation. Green innovation, a key pathway to sustainable development, is being heavily invested in globally through green infrastructure and renewable energy projects. China is no exception, but despite the rapid increase in green patent applications in recent years, issues such as insufficient core technological innovation and barriers to technology transfer between regions remain significant. This contradiction highlights the limitations of existing policy tools in promoting green innovation—Over-reliance on administrative regulations can lead to distorted allocation of resources, while single-market incentives can easily result in “greenwashing” behavior [2]. In this context, systematic policy design to address the “quality–efficiency” paradox in green innovation has become a critical issue for China’s low-carbon transition.
To address these challenges, China launched smart city pilot policies in three batches starting from 2012, aiming to reshape urban governance systems through digital technology while promoting the deep integration of “digital empowerment” and “green transformation”. This policy marks a fundamental shift in urban development paradigms: from scale expansion driven by factor inputs to efficiency improvements centered on data-driven approaches. The policy enhances the quantity and quality of green patents through mechanisms such as environmental subsidies [3] and easing financing constraints [4]. Research on the effects of China’s “smart city” policies focuses partly on how digital infrastructure optimizes economic efficiency, for example, by improving corporate performance [5], optimizing industrial structures [6], promoting employment [7], and narrowing the urban–rural gap [8]; another part focuses on environmental performance improvements, noting that smart city construction can enhance urban resilience [9] and reduce carbon intensity [10]; besides the positive effects of digitization, some scholars argue that technological investment may lead to factor misallocation, such as high-tech investments in smart cities potentially causing the decline of labor-intensive industries and the “crowding out” of highly skilled workers occurring due to rising living costs [11]. Additionally, regarding regional heterogeneity, Li et al. further revealed that the lag in digital infrastructure in central and western regions results in lower policy effectiveness compared with eastern regions, exacerbating regional green innovation disparities [12]; concerning resource heterogeneity, resource-based cities face the challenge of “resource misallocation” during the process of digital economy promotion [13].
However, despite the ongoing and deepening research on smart cities and green innovation, and the existing literature beginning to focus on the path of green performance [14], some controversies remain: First, a single policy struggles to balance innovation incentives with environmental regulation. For instance, Zhang et al. found that heavily polluting companies avoid environmental responsibilities through “greenwashing mergers,” leading to a decrease in green technology investment [2]. Second, most studies rely on the number of green patents, overlooking the lag in technology commercialization and the review period for patent authorization. Although some research, such as Qu et al., recognizes that the effects of green technological innovation take 1 to 2 years to materialize, they still use the number of green patent applications as an indicator of corporate green technological innovation, neglecting the importance of green patent authorizations [15]. Additionally, some existing literature employs static analysis, failing to consider the possibility that infrastructure investments in the early stages of policy implementation can lower efficiency, with significant long-term effects later on.
In this context, further exploring how smart city policies reshape green innovation through digital technology has become a valuable topic. Do smart city policies effectively promote urban green growth? Are there significant spatial heterogeneities and temporal dynamic characteristics in their effects? Through what pathways do these policies function? A thorough study of these questions not only provides empirical evidence for optimizing smart city policies but also offers important references for promoting urban green growth and achieving sustainable development goals at the macro level. Furthermore, it provides a reference for developing countries to coordinate their digital and green transitions. To this end, this study uses panel data from 293 prefecture-level cities between 2009 and 2019, treating smart city pilot policies as quasi-natural experiments. It employs a multi-period difference-in-differences (DID) model to evaluate the impact of smart city pilot policies on China’s urban green growth.
The marginal contributions of this paper are summarized as follows: First, it breaks through the limitations of a single patent indicator by using the entropy-weighted TOPSIS method to construct a multi-dimensional innovation index that integrates the number of authorized green patents, reverse indicators of industrial “three wastes” emissions, and the policy regulation intensity over several periods, which effectively avoids the time lag effect in technology commercialization and patent approval. Second, it introduces a multi-period DID model to verify the “J-curve” characteristics of policy effects, revealing the dynamic balance between the initial inhibitory effects of infrastructure investment and the long-term benefits of technology diffusion, and it obtains the net effect of smart city construction on improving the level of green innovation through multiple robustness tests. Third, it analyzes the driving paths of smart cities promoting green growth. Fourth, it focuses on the structural challenges faced by resource-based cities, exploring the roots of their inhibitory effects and proposing differentiated compensation schemes as a policy tool. By integrating the dual perspectives of smart city policy effects and green innovation mechanisms, this study provides new empirical evidence for addressing the synergistic challenges of “digital empowerment” and “green transformation”.
2. Theoretical Analysis and Research Hypotheses
Under the strategic framework of Digital China, the smart city pilot policy serves as a core vehicle for urban digital transformation [16]. Drawing on the theoretical framework from Liu et al., its green innovation effects should be examined within a dynamic system of “technology–institution–behavior” co-evolution [17]. Furthermore, integrating the work of Yang et al., intelligent social governance must balance technological empowerment with legal constraints, emphasizing adaptability as the foundation for governance efficacy [18], so this study constructs an analytical framework of “empowerment–constraint–adaptation”, combining the intrinsic mechanisms of smart city pilot policy responses with urban heterogeneity, and proposes the following theoretical analysis.
2.1. Empowerment: The Technological Transmission Path of Industrial Upgrading
Through the large-scale deployment of digital infrastructure such as 5G base stations and industrial Internet platforms, smart city pilot projects have built a sensor network and cloud computing platform covering the whole region and have promoted the deep integration of data elements and traditional industries in key links such as production scheduling and quality testing [19]. This technology enables further restructuring of the industrial chain: On the one hand, IoT technology optimizes the production process and drives industrial technological transformation. For example, Felipe et al. find the greater impact of IoT is in the commercialization phase, which is mainly used to improve and optimize production processes, better execute and synchronize new product launches, and improve the production capacity of factories [20]; Cao et al. pointed out that digital transformation capability is positively correlated with product innovation [21], that is, digital technology triggers the technological transformation of the industrial chain and improves the innovation ability of enterprises. Based on the empirical research of state-owned metallurgical enterprises, Gao et al. found that big data and artificial intelligence technologies have application value in optimizing production processes, improving energy efficiency and reducing emissions, and revealed that these technologies can help enterprises in green transformation through specific cases [22]. On the other hand, big data analysis enhances the efficiency of R&D resource allocation, further promoting the upgrading of high-tech industries [23]. For example, big data analysis and blockchain technology have improved governance efficiency and transparency, driving the transformation of industrial structures towards “software-defined, data-driven” models [24]; BCG China Chairman Liao Tianshu also noted that “AI + consumption” will be a key driver for the intelligent restructuring of the industrial chain [25]. This forms a transmission chain “digital infrastructure → technology diffusion → industrial upgrading”, encouraging companies to adopt green technology-intensive production models.
2.2. Constraint: The “Pressure–Response” Mechanism of Environmental Regulation
The pilot policy strengthens the rigidity of environmental regulation by building a compound governance system of “digital supervision platform + environmental credit evaluation” and forms a data-driven “pressure–response” mechanism. In terms of intelligent supervision, taking Zhejiang Province’s Environmental Protection e-Enterprise Management as an example, it integrates real-time monitoring data of corporate emissions, administrative penalty records, and public complaint information to establish a multi-source data fusion analysis platform. This platform dynamically generates red, yellow, and green risk warning codes, enabling minute-level responses to environmental risks. As a result, the new model for exhaust gas treatment rectification in Wenzhou, Zhejiang Province, is eight times more efficient compared with traditional methods. The environmental credit evaluation system amplifies regulatory effects through a two-way transmission mechanism of “incentives for good faith and penalties for dishonesty”. For instance, Jiangsu Province’s Environmental Credit Rating system closely links corporate environmental credit with green loans. Green-rated companies receive a reduction in loan interest rates, while black-rated companies face credit freezes and restrictions on bidding qualifications. This system has compelled black-rated companies in the Yangtze River Delta region to complete pollution control facility upgrades within 12 months.
This composite governance system significantly increases the cost of environmental violations and encourages enterprises to internalize green innovation as a competitive advantage. Empirical studies have shown that environmental target constraints play an important role in promoting the green innovation of enterprises, especially those in the eastern part of China and high productivity and state-owned enterprises [26]; Yu et al. found that the strictness of environmental supervision increases the level of green development of enterprises in a nonlinear and inverted “U” shape, and this effect is particularly obvious in high-tech industries and non-heavy polluting enterprises [27].
Based on the above analysis, the following hypotheses are proposed:
H1a:
The smart city pilot policy has a positive promoting effect on green innovation levels in pilot cities.
H1b:
The smart city pilot policy drives green innovation by advancing industrial structure upgrading and strengthening environmental regulation, significantly improving urban green innovation levels.
2.3. Adaptation: Heterogeneous Responses to Policy Effects
The key to policy lies in “local adaptation” and avoiding the pitfall of “what thrives in the south may wither in the north”. Given China’s vast regional disparities, an analysis of different regions’ endowment conditions reveals that eastern regions, leveraging their first-mover advantage in digital infrastructure [28] and market-oriented institutional environments [29], are more likely to establish a virtuous cycle of “digital technology–green industry” interaction. However, resource-based cities are restricted by “double lock”: First, the proportion of mining industry in GDP exceeds 40%, forming a technical path dependence [30]. Second, resource-based cities are faced with more severe and urgent environmental pollution control problems. The end-of-pipe emission reduction investment accounts for a relatively high proportion of the environmental governance funds [31], which squeezes the green research and development budget at the source of pollution control. However, the growth-oriented resource cities in resource-based cities have higher policy flexibility in the early stage of resource development [32], so they can break through the inertia of traditional industries through digital technology embedding; for example, the Ordos’ smart mine project has increased the coal recovery rate to more than 80% while generating multiple green technology patents in waste treatment and carbon capture.
Accordingly, this study proposes H2 to more meticulously examine policy “maladaptation” and provide tailored recommendations for smart city pilot implementation in cities with varying endowments:
H2:
The smart city pilot policy has a more pronounced green innovation-promoting effect in non-resource-based cities and eastern regions. Among resource-based cities, only growing cities exhibit a positive response.
3. Research Design and Model Specification
3.1. Sample Selection
This study treats the smart city pilot policy as a quasi-natural experiment and employs a multi-period difference-in-differences (DID) model to assess its impact on urban green innovation. The sample selection follows these principles:
- ①
- Sample Selection and Treatment Group Definition
To account for heterogeneity in administrative hierarchy and economic scale, municipalities directly under the central government (e.g., Beijing, Shanghai) are excluded. The treatment group consists of prefecture-level cities officially designated as smart city pilots by the National Development and Reform Commission (NDRC) and the Ministry of Housing and Urban-Rural Development (MOHURD), while non-pilot cities serve as the control group. To ensure policy impact integrity, cities where the pilot was implemented only in certain counties (districts) without being fully incorporated into the pilot plan were excluded. The final sample retained 34 cities from the first pilot batch in 2012, 42 cities from the second batch in 2013, and 26 cities from the third batch in 2014, collectively covering 102 treatment cities, while the control group consisted of 191 non-pilot prefecture-level cities.
- ②
- Time Window Setting
The study period spans 2009–2019, avoiding exogenous shocks from the 2008 global financial crisis and the 2020 COVID-19 pandemic to ensure clean policy effect estimation.
- ③
- Data Balance
The baseline regression uses an unbalanced panel (N = 2822, T = 11), while robustness checks employ a balanced panel to verify result stability.
3.2. Model Specification
Given the gradual rollout of the smart city pilot policy, a multi-period DID model is constructed to evaluate its impact on urban green innovation:
In the model specification, i and t denote city and time respectively; represents the dependent variable indicating the level of green innovation; serves as the core explanatory variable, taking the value of 1 if city i was included in the smart city pilot list at or after time t and 0 otherwise; constitutes a set of control variables. and represent time and city dummy variables, respectively, employed to control for year and city fixed effects, while denotes the random error term.
3.3. Variable Definitions and Measurement
- ①
- Dependent Variable:
Green innovation level (SCORE): The green innovation level is constructed as a comprehensive index system based on its multi-dimensional connotation, encompassing four key dimensions: green technology R&D, green industry application, environmental governance performance, and green policy support, with a total of 11 secondary indicators as shown in Table 1. These 11 secondary indicators are measured using the entropy-weighted TOPSIS method, with the specific formula expressed as:
The variables and represent the Euclidean distances between each city’s annual indicators and the positive/negative ideal solutions, respectively, with the final score ranging between [0, 1], where higher values indicate superior green innovation performance.

Table 1.
Dependent variable construction.
Table 1.
Dependent variable construction.
| Primary Indicator | Secondary Indicator | Type | Direction |
|---|---|---|---|
| Green Technology R&D | Patent applications for green inventions per capita | Count | + |
| Green utility model patent applications per capita | Count | + | |
| Patents for green inventions per capita (3-year lag) | Count | + | |
| Green utility patents per capita (1-year lag) | Count | + | |
| Green Industry Application | The proportion of energy conservation and environmental protection in fiscal expenditure | Percentage | + |
| Environmental Governance | Industrial soot emissions per capita | Continuous | − |
| Industrial wastewater discharge per capita | Continuous | − | |
| Industrial sulfur dioxide emissions per capita | Continuous | − | |
| Greening coverage in built-up areas | Percentage | + | |
| Non-hazardous treatment rate of domestic waste | Percentage | + | |
| Green Policy Support | Environmental regulation word frequency (policy texts) | Percentage | + |
Note: The plus sign indicates an indicator that is positively correlated with the level of green innovation, and the minus sign indicates an indicator that is negatively correlated with the level of green innovation.
The negative indicators (industrial emissions of three wastes) underwent inverse transformation, while missing values were addressed through mean imputation.
- ②
- Core Explanatory Variable:
Smart city piloting policy (): The smart city pilot policy is treated as a policy shock in this study, with the interaction term between the pilot city dummy and time period dummy serving as the explanatory variable, where equals 1 for city i in year t and all subsequent years after being designated as a pilot city and 0 otherwise.
- ③
- Control Variables:
Drawing upon the research of Liu Jingxing et al., the following control variables were selected to mitigate omitted variable bias: First, the level of economic development is reflected by the logarithm of per capita GDP (lnPGDP), reflecting the resource support capacity of the city’s economic base for green innovation [33]. Second, the logarithm of the annual average number of all employees (lnAE) is used to reflect the size of the labor force, which characterizes the complementarities between human capital accumulation and complementarity between technological innovation [34]. Third, the logarithm of population density (lnPOP) is chosen to measure the resource pressure and environmental governance needs in the process of urbanization [35]. Fourth, the logarithm of the total amount of postal business (lnTPB) and the logarithm of the amount of highway passenger volume (lnPHV) are chosen to reflect the efficiency of the logistics diffusion and the level of the logistics infrastructure, characterizing the transportation network density, which affects the efficiency of green technology diffusion [36]. Fifth, the logarithm of the number of international Internet users (lnIIU) is used to characterize the enabling effect of digitalization on green innovation [37]. Sixth, the logarithm of the road area per capita (lnRA) is used as an indicator of urban density for measuring the development of urban low-carbon transportation [38].
3.4. Data Sources and Descriptive Statistics
To ensure data completeness and availability, the empirical research data were primarily sourced from China City Statistical Yearbook, the CSMAR database, and the WIND database, with the exception of green innovation patent data, which were obtained from the CNRDS database. For the secondary indicators used to construct the dependent variable, any missing values were addressed through mean imputation.
As shown in Table 2, the descriptive statistics reveal that the green innovation level (SCORE) has a mean value of 0.200, median of 0.110, standard deviation of 0.210, minimum value of 0.0300, and maximum value of 0.950, with this distribution suggesting the absence of significant outlier influence and thus supporting the validity of subsequent analyses. Similar distributional characteristics were observed for all other variables in the study.
Table 2.
Descriptive statistics of variables.
4. Empirical Results and Analysis
4.1. Benchmark Regression Analysis
Table 3 presents the benchmark regression results examining the impact of smart city pilot policies on urban green innovation levels. Columns (1)–(5) progressively demonstrate estimation results from models without control variables or fixed effects to the full model incorporating both control variables and fixed effects. The coefficients of the core explanatory variable (DID) are statistically significant at either the 1% or 5% level across all specifications, consistent with theoretical expectations. These results confirm Hypothesis H1, indicating that smart city pilot policies significantly promote green innovation.
Table 3.
Benchmark regression results.
4.2. Parallel Trend and Dynamic Effects Analysis
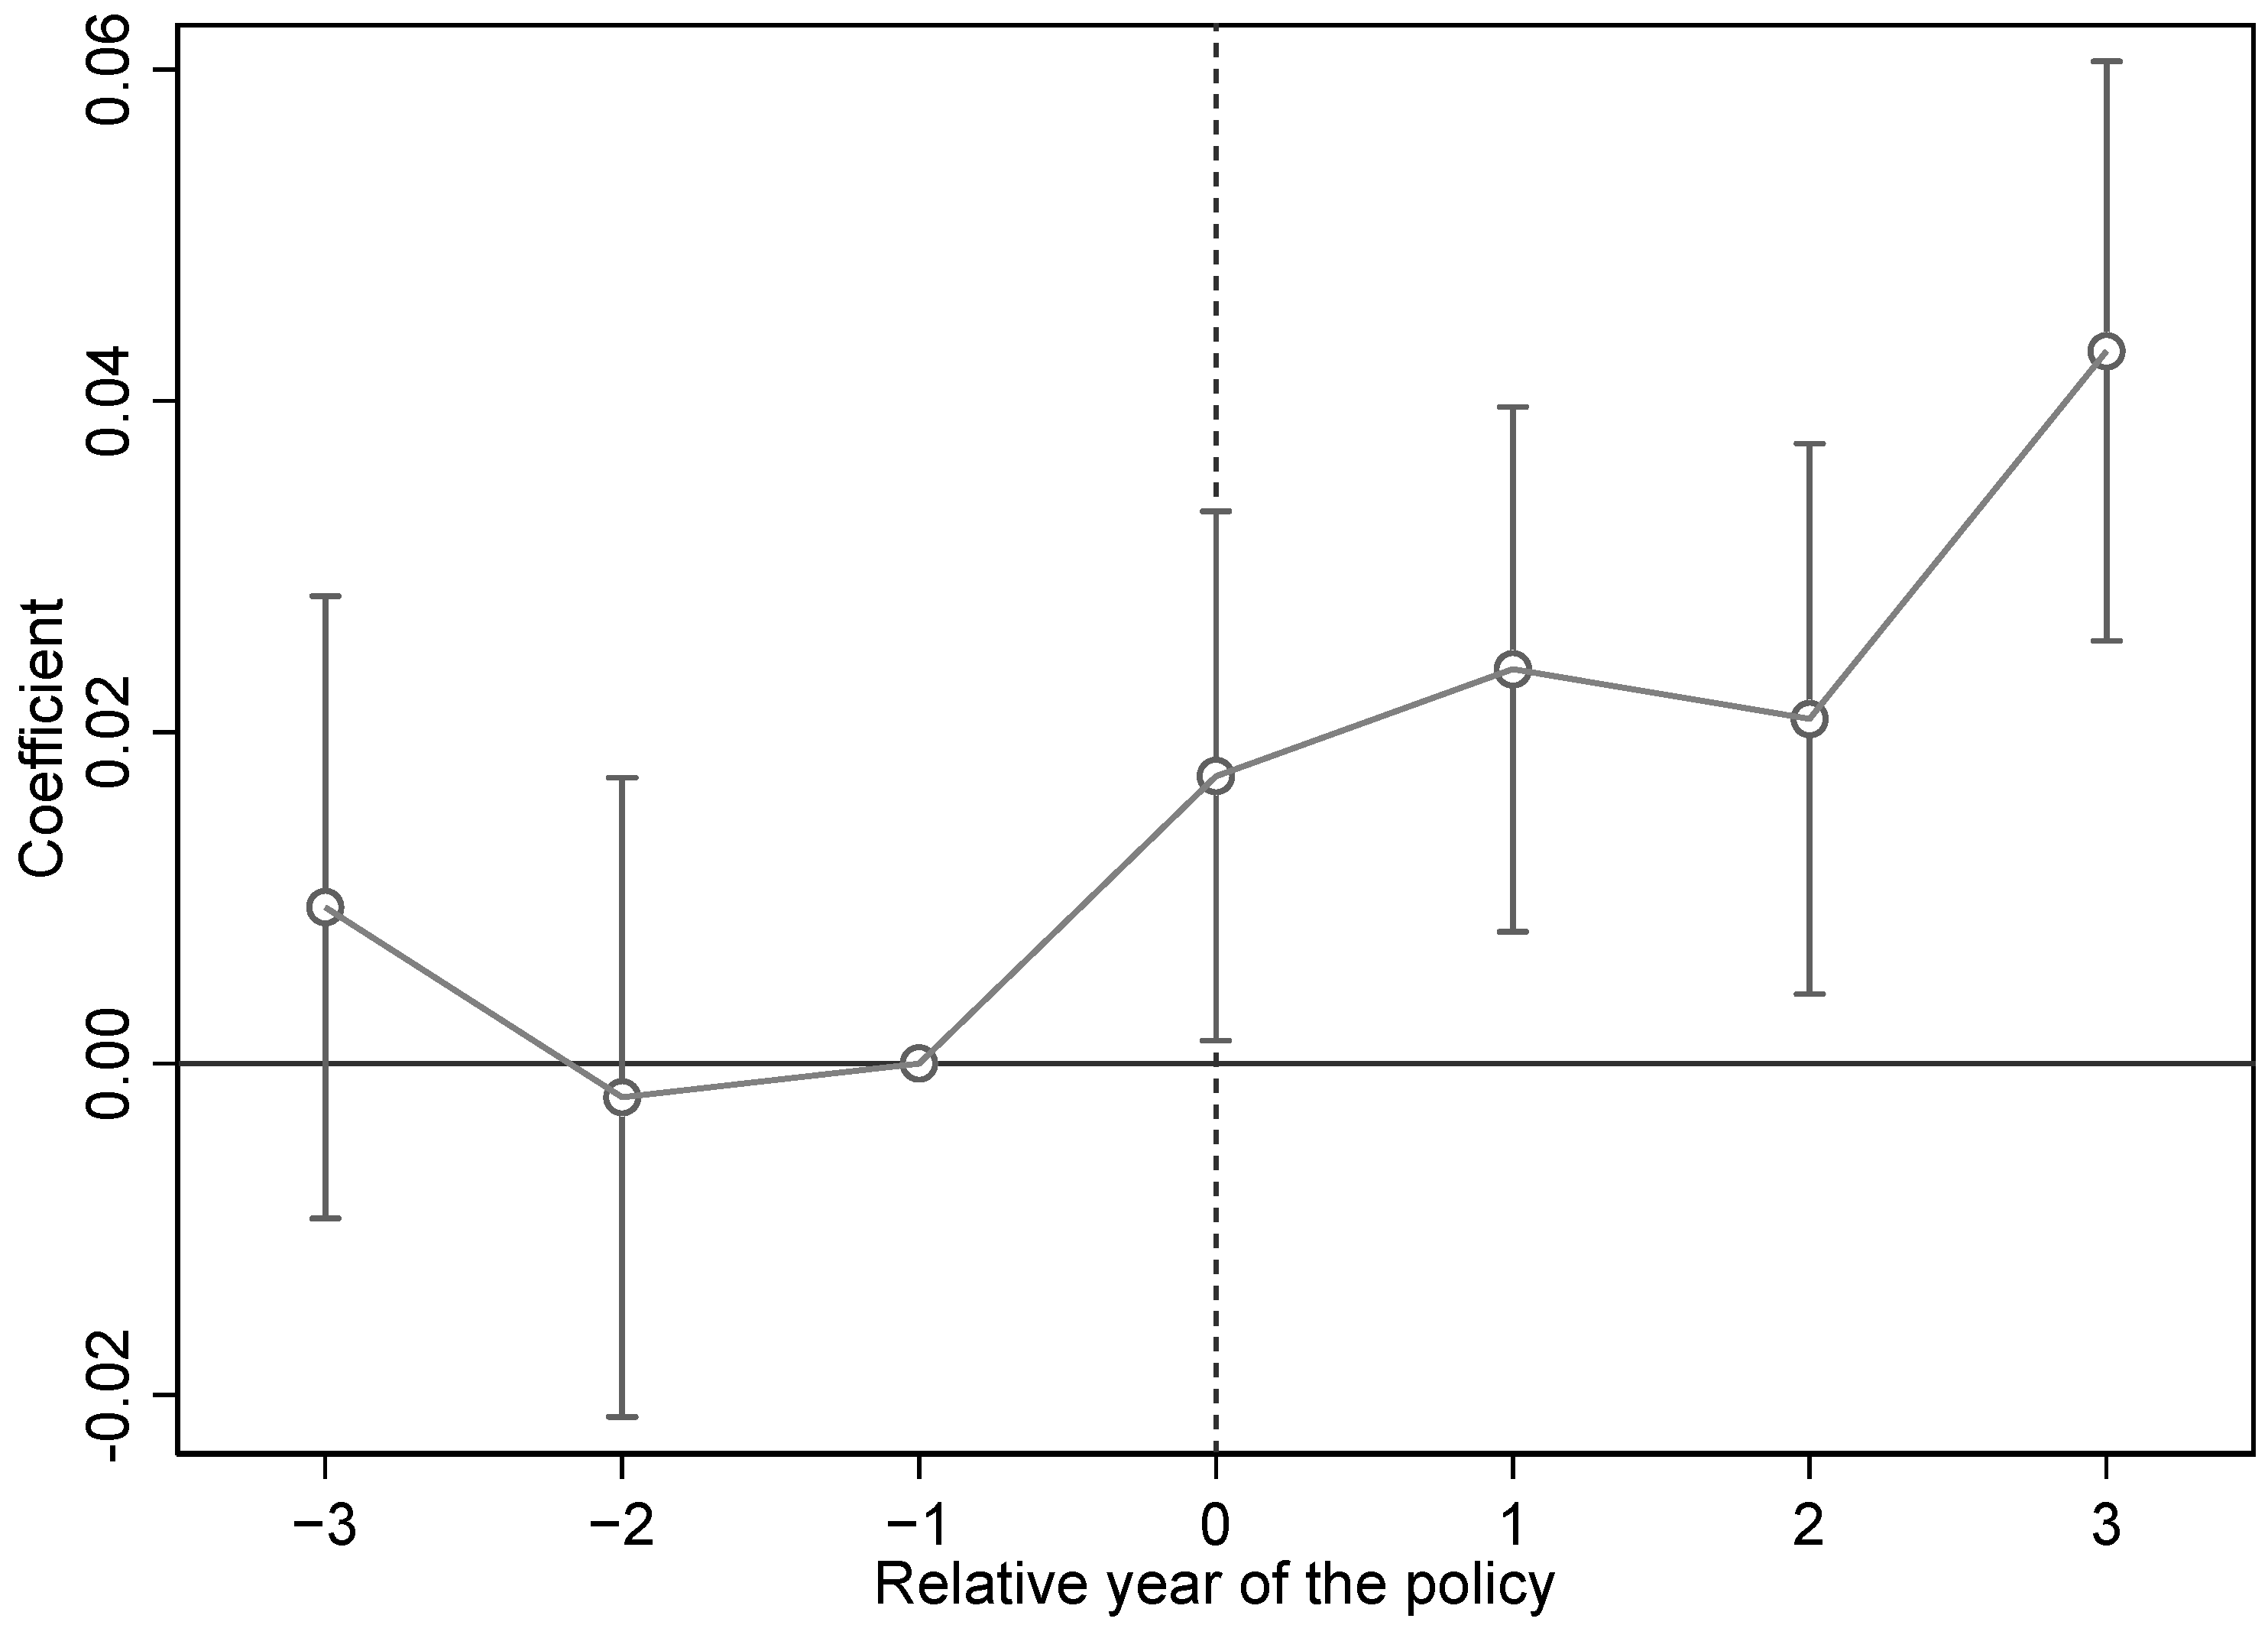
To validate the applicability of the multi-period DID model and examine dynamic policy characteristics, we employ the event study approach following Beck, et al. [39]. Figure 1 illustrates the parallel trend test and dynamic policy effects. The horizontal axis represents relative time to policy implementation (with the pilot approval year as baseline), while the vertical axis shows the marginal effect coefficients. The results demonstrate that all pre-treatment coefficients fail significance tests at the 10% level, satisfying the parallel trend assumption.

Figure 1.
Parallel trend test and policy dynamic effects.
Post-implementation effects exhibit progressive enhancement: The marginal effect coefficient reaches 0.017 (p < 0.1) in the baseline year, indicating that the improvement in green innovation levels remains in the nascent stage during the initial policy period when continuously investing in infrastructure construction. Three years later, the coefficient grows to 0.042 (p < 0.01), reflecting cumulative effects of digital infrastructure development and institutional coordination. The sustained coefficient growth suggests enduring policy impacts, forming a J-curve trend that aligns with existing research on policy time-lag effects [40].
Further analysis incorporating considerations of policy implementation reveals that the temporal heterogeneity in policy effects may also be associated with technology absorption cycles, where the deployment of IoT equipment and establishment of environmental data platforms typically require a 2–3 year break-in period, while the commercialization of green technologies, such as the industrialization of energy-saving patents, demands an even longer duration for full realization.
4.3. Robustness Checks
4.3.1. Balanced Panel Conversion
To verify the robustness of the benchmark regression results, this study further conducts estimations by converting the unbalanced panel data into balanced panel data. As reported in Table 4, the core explanatory variable (DID) maintains statistical significance at the 1% level across all three model specifications, with coefficient signs being consistent with the benchmark results, demonstrating that the positive promoting effect of smart city pilot policies on green innovation levels remains unaffected by variations in sample structure and confirming the strong robustness of our conclusions.
Table 4.
Balanced panel regression results.
4.3.2. Goodman-Bacon Decomposition
According to Andrew (2021) [41], since traditional two-way fixed-effects DID models may have heterogeneous biases depending on the time of entry of the treatment group, the use of the Bacon decomposition can deconstruct the confounding weights in the two-way fixed-effects estimator: it identifies distortions in the estimation results caused by the negative weights by disentangling the weighted combinations of all the two-period DID subsamples, thus separating the policy effects more accurately.
Because each city becomes a policy pilot at a different point in time, this paper subdivides the overall double-difference-in-differences (DID) estimator into three categories. The detailed results are presented in Table 5, and it can be found that the weight of “Post-treatment group vs. Pre-treatment group” is small, only 4.4%, which does not cause a large negative weight estimation problem.
Table 5.
Bacon decomposition results.
4.3.3. CSDID Estimation
To further address the negative weighting issue, this study employs the CSDID method proposed by Callaway et al. (2021), which effectively mitigates estimation bias caused by temporal variations in treatment groups through inverse probability weighting and covariate balancing strategies [42]. Table 6 presents the CSDID estimation results. Model (1) without control variables yields an average treatment effect of 0.043 (p < 0.05) for the smart city pilot policy. After incorporating control variables, Model (2) shows a slightly reduced but still statistically significant coefficient of 0.033 (p < 0.05). The consistency of results across both models demonstrates strong robustness in the policy’s promoting effect on green innovation levels.
Table 6.
CSDID estimation results.
4.3.4. Alternative Dependent Variable
To verify the robustness of benchmark regression conclusions, this study replaces the core measurement of green innovation level with green patent application counts (GSQ) to examine whether policy effects are influenced by indicator construction methods.
The regression results in Table 7 demonstrate that the coefficients of the smart city pilot policy (DID) maintain statistical significance at either the 1% or 10% levels across models with varying controls and fixed effects, indicating consistent policy effects on green patent applications across different specifications.
Table 7.
Replacement of explanatory variables.
4.3.5. Placebo Test
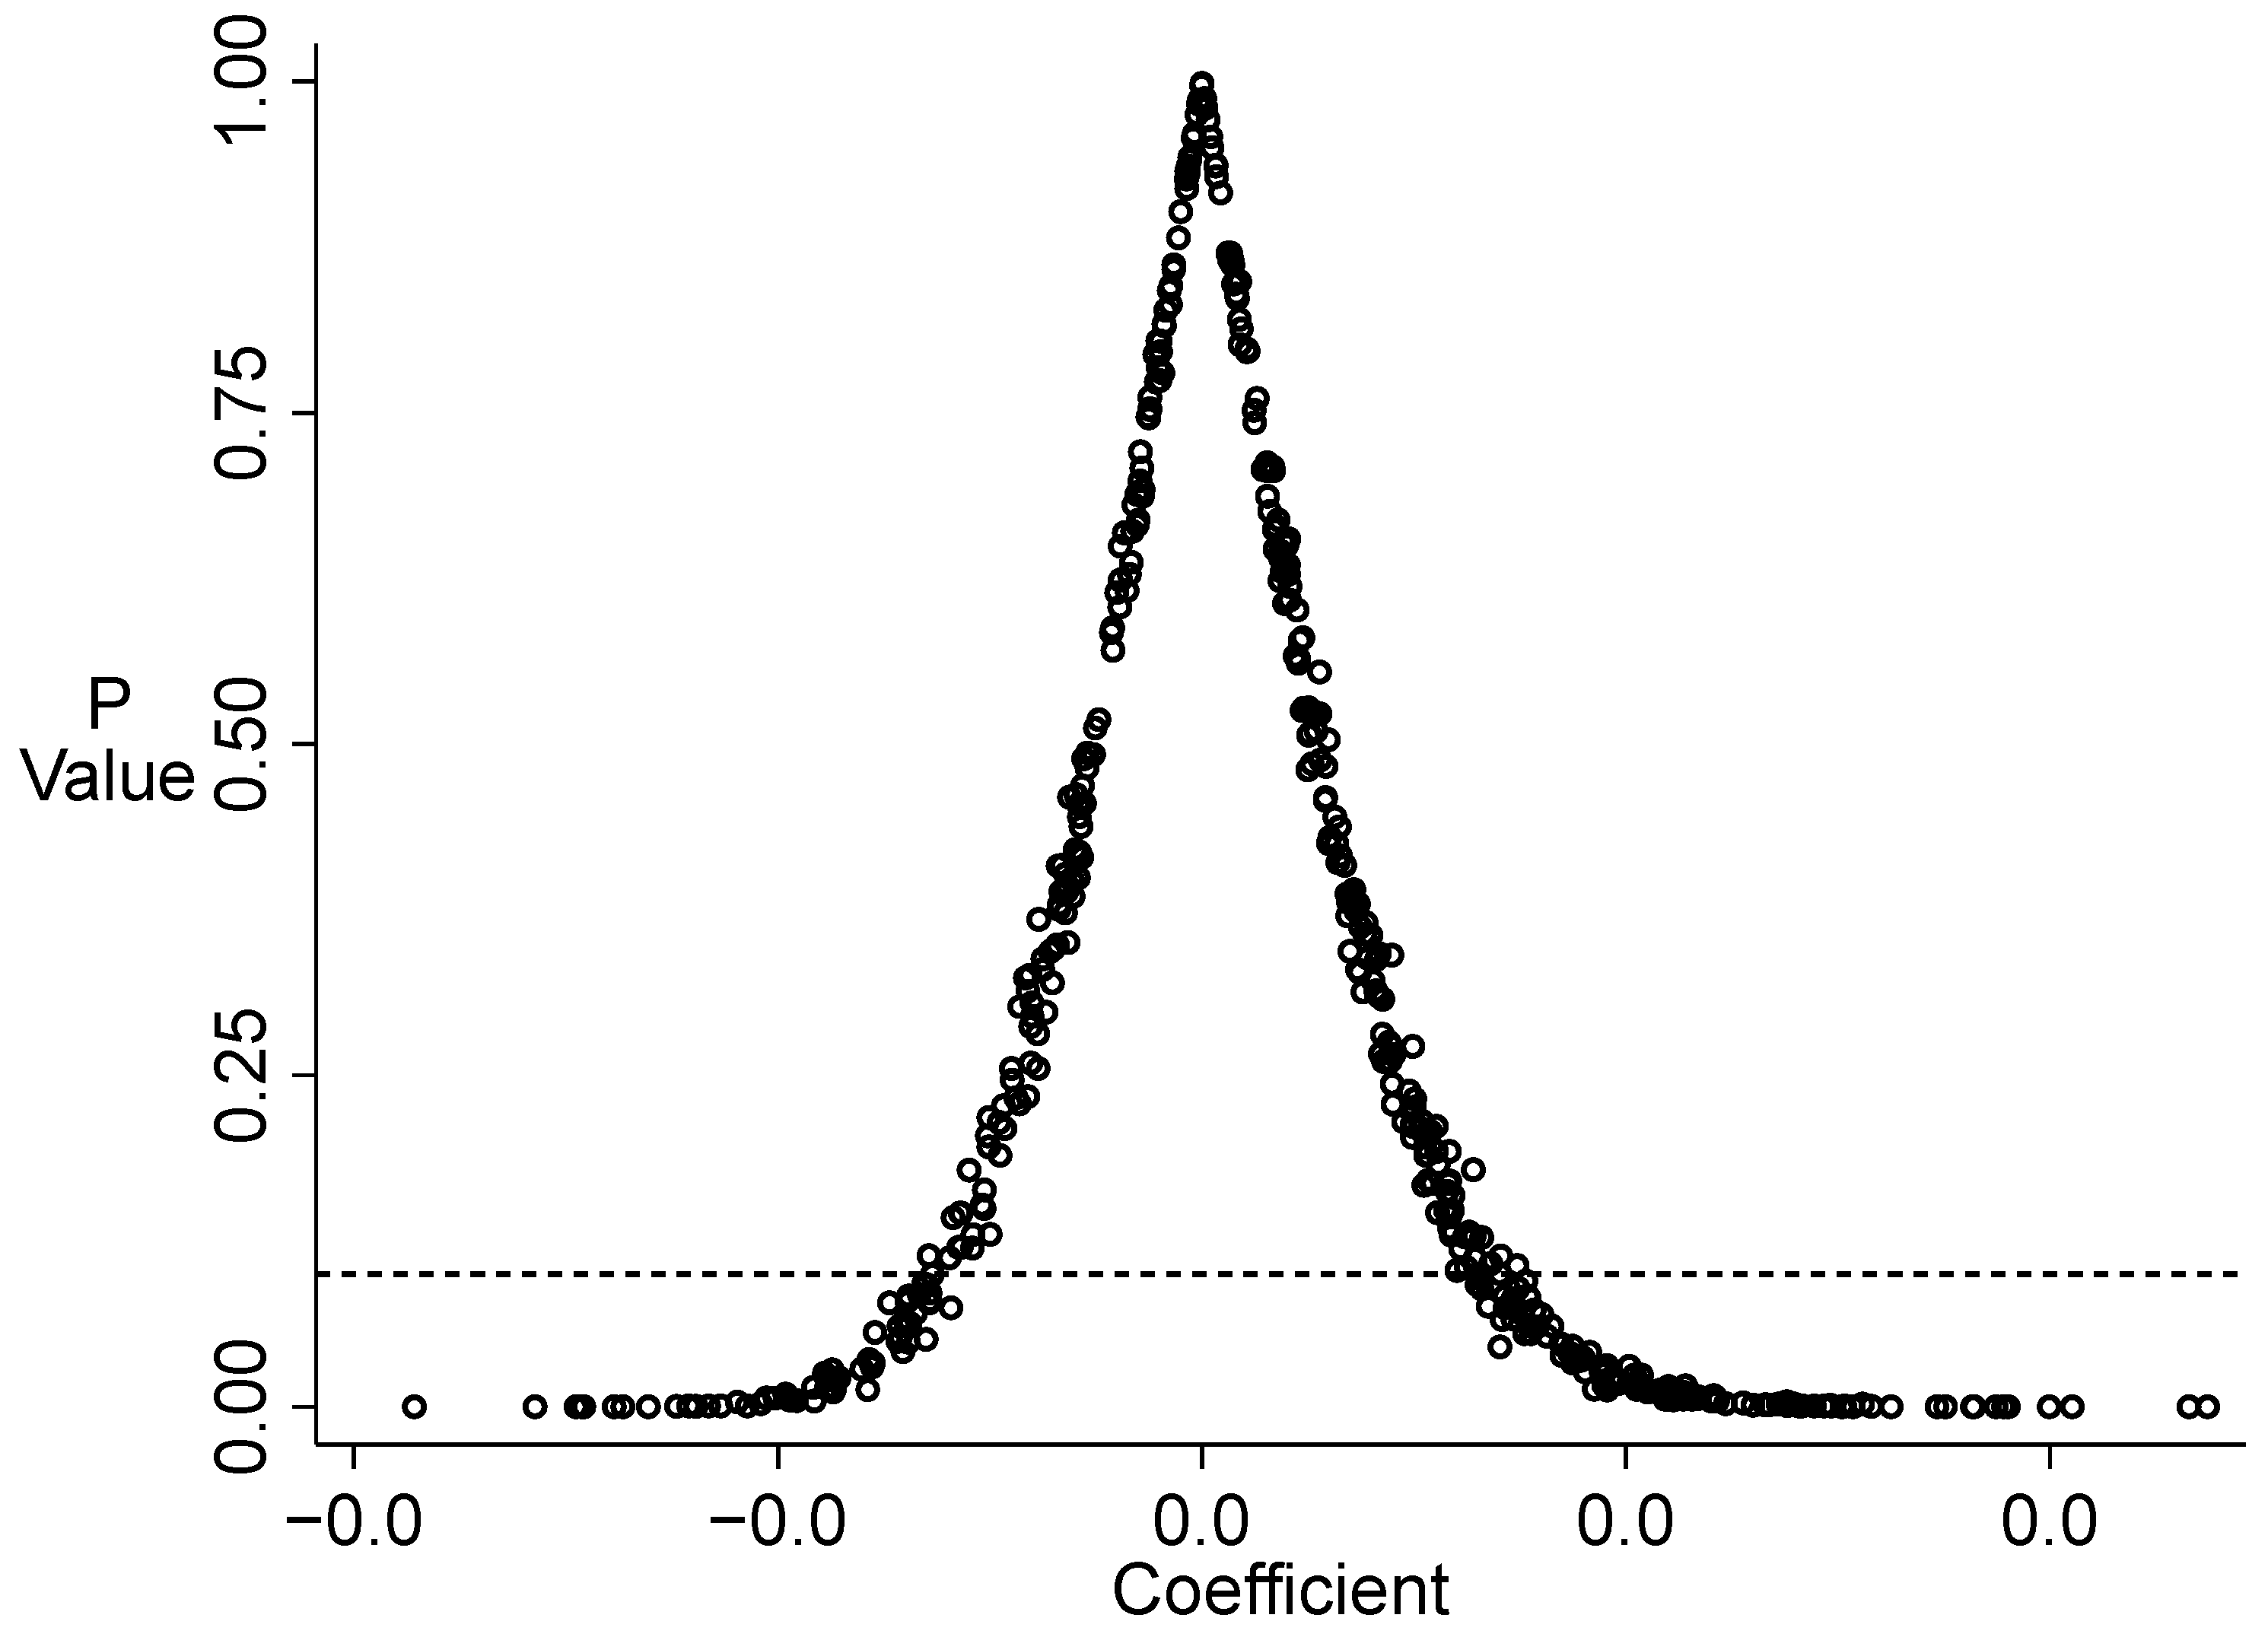
Following Ferrara et al. (2008) [43], this study conducts a placebo test by constructing virtual treatment groups to examine potential confounding factors. From the sample cities, 102 cities were randomly selected as pseudo-treatment groups with randomly assigned implementation times, repeating the regression process 500 times. Figure 2 displays the p-value distribution of the 500 pseudo-policy effect coefficients, showing an approximately normal distribution centered at zero with over 97% of simulations failing the 10% significance test (p > 0.1). These results suggest that random factors do not account for the observed promoting effects of smart city pilot policies on green innovation levels.
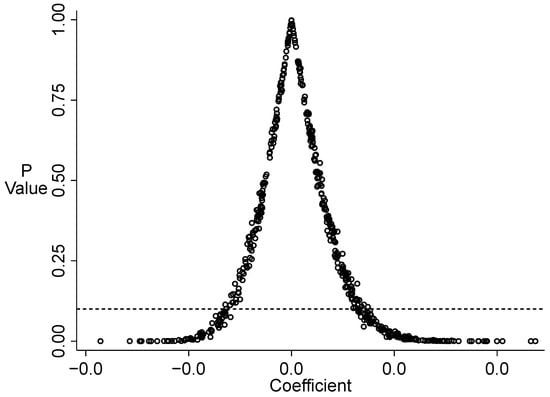
Figure 2.
Placebo test. Note: Each scatter in the graph represents the result of a placebo test, the abscissa is the pseudo-policy effect coefficient, and the ordinate is the corresponding p-value. The horizontal dashed line represents the significance horizontal line of p = 0.1.
4.4. Heterogeneity Analysis
4.4.1. Resource-Based City Heterogeneity
Following the sample classification in the National Sustainable Development Plan for Resource-Based Cities, we categorize cities into resource-based and non-resource-based groups based on their resource endowments. The impact of smart city pilot policies on green innovation exhibits significant heterogeneity between these groups. As shown in Table 8, the policy effect coefficient for non-resource-based cities is 0.050, which is significant at 1% level, while resource-based cities show no significant effect. This validates the persistent “resource curse” during their transitional phase—despite policy attempts to inject new momentum through digital technologies, the legacy of extensive development models continues to weaken factor reallocation efficiency.
Table 8.
Heterogeneity of resource-based cities.
Further classification of resource-based cities by lifecycle stage, as shown in Table 9, reveals that only growing cities demonstrate significant policy effects at 10% level, while mature and declining cities show negative significance, and regenerating cities exhibit no statistical significance. This pattern suggests growing cities, being at early development stages without entrenched industrial path dependence, can effectively integrate data resources through digital infrastructure to unleash green innovation potential. In contrast, mature and declining cities face weakened technological absorption capacity due to resource depletion and industrial hollowing-out, struggling to break through locked-in effects of traditional interest patterns, where smart city construction may even divert attention from urgent environmental governance needs. This lifecycle-based heterogeneity further confirms the “resource curse” influence.
Table 9.
Grouping of resource-based cities by lifecycle type.
4.4.2. Spatial Heterogeneity
According to the Regional Economic Classification Standard, China’s eastern, central, and western regions exhibit gradient development patterns: In 2022, the eastern region (11.3% of national territory) contributed 52% of GDP while hosting 38% of population, forming high-density economic agglomerations; The central-western regions (88.7% of territory) accounted for 48% of GDP with a population density of only one-fifth of eastern levels. These developmental disparities profoundly affect policy implementation efficacy.
Our empirical results demonstrate significant regional heterogeneity in the policy’s impact (Table 10). The eastern region shows significance at 10% level, the central region shows no significance, while the western region’s effect size is merely 19.5% of the eastern region despite statistical significance. This indicates that eastern regions, leveraging their economic advantages and factor agglomeration, can more effectively transform policy dividends into green innovation momentum.
Table 10.
Spatial heterogeneity.
The heterogeneity tests not only validate Hypothesis H2 but also reveal the necessity for deep alignment between smart city policy implementation and regional characteristics to avoid efficiency losses from uniform application.
4.5. Mechanism Testing
By constructing mediating variables, this paper finds that the promotion effect of smart city pilot policies on green innovation is realized through the dual path of industrial structure upgrading and environmental regulation strengthening.
4.5.1. Industrial Structure Upgrading
Using a mediation effect model, we first examine the mediating role of industrial structure upgrading (ISUG), defined as the transition toward high-value-added, technology-intensive, and efficiency-driven industries. Following Zhao et al. (2025) [44], ISUG is measured as the ratio of tertiary industry value-added to the sum of primary and secondary industry value-added.
As shown in Table 11, the smart city pilot policy significantly promotes industrial structure upgrading at the 5% level, with ISUG contributing a marginal effect of 0.027 to green innovation at the 10% significance level. This indicates that smart cities accelerate technology substitution in traditional industries by fostering agglomeration of producer services through data element flows.
Table 11.
Mediating effects of advanced industrial structure.
4.5.2. Enhanced Environmental Regulation
We employ the number of environmental violation cases (CASE) as an inverse proxy for regulatory efficacy, where higher values reflect weaker compliance and reactive “post-penalty” governance, while lower values signal proactive “preventive” regulation.
Table 12 demonstrates that the policy significantly reduces CASE at the 10% level, while CASE reduction itself promotes green innovation at the 1% level. This suggests smart cities shift environmental governance from punitive enforcement (high number of cases) to preventive monitoring (low number of cases) via IoT-based real-time warnings, converting compliance pressure into green innovation incentives.
Table 12.
Mediating effects of stronger environmental regulation.
Paradoxically, higher CASE indicates severe violations, which forces firms to innovate under regulatory stress.
In this regard, this paper further groups the environmental departure cases according to the median as shown in Table 13, and finds stronger policy effects in high-CASE cities (1% significance) where reduced penalties free up resources for green R&D, forming a “preventive regulation → proactive innovation” cycle. In low-CASE cities, the policy effect is not significant, because the original environmental regulation in these areas is more complete, the marginal benefit of the policy is diminishing, and it is necessary to turn to other paths, such as structural optimization.
Table 13.
Results after grouping CASE according to medians.
In summary, smart city pilots drive green innovation through dual mechanisms—“structural optimization–technological penetration” and “preventive regulation–proactive innovation”—with efficacy being deeply moderated by local institutional contexts. Future policy design must balance industrial adaptability and regulatory intelligence dynamically.
5. Discussion and Conclusions
5.1. Discussion
This study verifies the promoting effect of smart city pilot policies on green innovation, revealing their heterogeneous responses and mechanisms of action, providing new evidence for understanding the relationship between digital governance and sustainable development. To more clearly present the framework of this paper, we further combine the empirical results obtained in this paper with the existing knowledge system and theory for discussion:
Firstly, in the benchmark regression, we obtained significant policy effects, which align with most studies on the impact of pilot policies in smart cities. In the parallel trend regression, we observed a gradual increase in the effect after policy implementation. The marginal effect coefficient in the base year was only 0.017 (p < 0.01), but it increased to 0.042 (p < 0.01) by the third year, reflecting the cumulative effect of improved digital infrastructure and institutional synergy. This is consistent with existing research on policy lags.
Secondly, in the heterogeneity test, the policy effect is significant in the eastern region (coefficient 0.128*), while it is weaker in central and western regions, corroborating that the high level of marketization and digital infrastructure density in the east provide institutional and technological “dual advantages” for policy implementation; the failure of the policy effect in resource-based cities echoes the “resource curse” theory—resource dependence leads to institutional rigidity, which inhibits technology absorption capabilities. Further analysis by segmenting resource-based cities according to their lifecycles reveals that growth-oriented resource cities, which are in the early stages of resource development and have not yet formed entrenched industrial path dependencies, exhibit higher policy flexibility (coefficient 0.013*), whereas mature and declining cities show no effect or even negative effects, further validating the “resource curse” theory and aligning with the theory of institutional flexibility window periods—the early development stage is more likely to break path dependencies [45].
Thirdly, in the mechanism testing section, the dual mediation pathways of industrial structure upgrading and environmental regulation expansion broaden the existing research framework. The path of industrial structure upgrading indicates that smart cities promote the agglomeration of production-oriented services through data element flow, accelerating technological substitution in traditional industries, which aligns with the structural dividend hypothesis [46]. The environmental regulation part reflects a shift from “end-of-pipe punishment” to “preventive monitoring”, validating the argument in the Porter hypothesis that “appropriate regulation stimulates innovation” [47]. Moreover, the effect is stronger in highly non-compliant cities, indicating that policies have greater marginal benefits in regions with weaker institutions, consistent with Acemoglu et al.’s concept of the “institutional dividend gap” [48].
5.2. Main Conclusions
This study employs unbalanced panel data from 293 prefecture-level cities (2009–2019) and a multi-period difference-in-differences approach to evaluate the impact of smart city pilots on green innovation. Key findings include:
First, smart city pilot policies significantly enhance urban green innovation levels, validating the synergy between “digital empowerment” and “green transition”. Second, dynamic effect analysis reveals a 147% increase in green innovation indices three years post-implementation, demonstrating cumulative effects of technological diffusion and institutional adaptation, which breaks through the cognitive limitations of existing literature on the conduction path. Third, heterogeneity analysis highlights stronger policy effects in non-resource-based cities and cities in Eastern China, emphasizing the moderating role of regional disparities and resource endowments. Fourth, mechanism tests confirm dual transmission pathways: industrial structure upgrading and enhanced environmental regulation, achieving substitution of “preventive regulation” for end-of-pipe treatment.
5.3. Policy Implications
To translate findings into actionable strategies, the following policy recommendations are proposed: First, smart city initiatives must adopt region-specific strategies to avoid “one-size-fits-all approach”. For resource-based cities, efforts should prioritize green transformation of traditional industries, while western regions require targeted digital infrastructure investments and “enclave economy” collaborations with eastern counterparts to leverage technological and human capital resources. Second, differentiated compensation mechanisms should address structural constraints across resource-based cities at varying lifecycle stages; growing cities could allocate coal resource tax revenues to smart ecological projects and green technology R&D, while declining cities need subsidies tied to green patent commercialization to overcome technological absorption barriers. Third, environmental regulation systems should establish comprehensive monitoring platforms integrating real-time emission tracking and innovation incentives, replacing punitive fines with tax credits for proactive green technology adoption. Regional industrial upgrade roadmaps must be context-sensitive—for example by deploying intelligent eco-production lines in manufacturing clusters and piloting digital ecological compensation mechanisms in fragile ecosystems—to realize bidirectional synergies between digital governance and green development.
5.4. Limitations and Future Research
This study also has several limitations. First, the analysis covers data up to 2019, which may not fully capture recent advancements in smart city infrastructure or post-pandemic digitalization trends. Second, while the focus on prefecture-level cities provides macro-level insights, micro-level dynamics—such as firm-specific innovation behaviors or intra-city spatial heterogeneity—remain underexplored. Third, the role of informal institutional factors and subnational policy enforcement variations warrants further investigation. Future research could extend the temporal scope with real-time data, incorporate enterprise-level analyses, and employ mixed methods to disentangle the interplay between technological, institutional, and social dimensions of smart city development.
Future research can expand this analysis with updated data or more microscopic information such as enterprises, and combining the structural and spatial differences to further develop the smart city initiatives and promoting green innovation through digital governance.
Author Contributions
Conceptualization, D.Z.; methodology, D.Z.; software, D.Z.; validation, D.Z. and S.Z.; formal analysis, D.Z.; investigation, D.Z.; resources, D.Z.; data curation, D.Z.; writing—original draft preparation, D.Z.; writing—review and editing, D.Z. and S.Z.; visualization, D.Z.; supervision, S.Z.; project administration, S.Z.; funding acquisition, D.Z. All authors have read and agreed to the published version of the manuscript.
Funding
This research received no external funding.
Data Availability Statement
No new data was created.
Conflicts of Interest
The authors declare no conflict of interest.
References
- Zhao, X.; Ehigiamusoe, K.U. A Study on the Evaluation and Determinants of Green Economic Efficiency: Empirical Evidence from Provincial Panel Data in China. SAGE Open 2024, 14, 21582440241280750. [Google Scholar] [CrossRef]
- Zhang, Q.; Yuan, X. Green mergers and acquisitions, investment in green technology innovation and low-carbon transformation of heavily polluting enterprises. J. Nanjing Univ. Financ. Econ. 2024, 4, 78–88. [Google Scholar]
- Zhang, Z.; Wu, Y.; Wang, H. Corporate financial fragility, R&D investment, and corporate green innovation: Evidence from China. Financ. Res. Lett. 2024, 62, 105190. [Google Scholar]
- Nie, W.; Ma, Y. Impact of Financial Technology on Enterprises’ Green Innovation Performance—Based On Chinese A-Share Listed Companies. World J. Econ. Bus. Res. 2025, 3, 70. [Google Scholar]
- Zhang, B.; Chen, P. Digital Technology Innovation as a Catalyst for Real Economy Enhancement: A Chinese Perspective. J. Knowl. Econ. 2024, 16 (Suppl. 1), 1–40. [Google Scholar] [CrossRef]
- Chen, C.; Li, S.E.; Wang, L. Can smart cities reduce labor misallocation? Evidence from China. Technol. Forecast. Soc. Change 2024, 201, 123264. [Google Scholar] [CrossRef]
- Rongjie, L.; Hao, G. Effects of smart city construction on employment: Mechanism and evidence from China. Empir. Econ. 2023, 65, 31–33. [Google Scholar]
- Duanmu, X.; Yu, J.; Yuan, X.; Zhang, X. How Does Digital Infrastructure Mitigate Urban–Rural Disparities? Sustainability 2025, 17, 1561. [Google Scholar] [CrossRef]
- Feng, Y.; Wang, J.; Zhang, T. The Impact of Smart City Policies on City Resilience: An Evaluation of 282 Chinese Cities. Sustainability 2024, 16, 8669. [Google Scholar] [CrossRef]
- Xia, X.; Yu, R.; Zhang, S. Evaluating the Impact of Smart City Policy on Carbon Emission Efficiency. Land 2023, 12, 1292. [Google Scholar] [CrossRef]
- Du, J.; Wang, Y.; Zhao, A. Research on the influence and mechanism of smart city construction on urban green development. Soft Sci. 2020, 34, 59–64. [Google Scholar]
- Wang, X.; Duan, C.; Zhang, S. How public services affect human capital allocation—The regulatory effect of digital economy. Int. Rev. Econ. Financ. 2025, 100, 104102. [Google Scholar] [CrossRef]
- Yu, R.; Luo, Z. Factor mismatch measurement of resource-based cities: Evidence from all-round optimization total factor productivity decomposition framework. Heliyon 2024, 10, e33772. [Google Scholar] [CrossRef] [PubMed]
- Mubarak, N.; Khan, J.; Ali, M.; Pesämaa, O. Roadmap to Achieve Green Project Performance: The Role of Knowledge Co-creation. J. Knowl. Econ. 2024, 15, 17003–17025. [Google Scholar] [CrossRef]
- Qu, K.; Zhang, Y.; Liu, Y. Research on the influence and mechanism of smart city construction on enterprise green technology innovation. Environ. Sci. Manag. 2023, 48, 174–179. [Google Scholar]
- Chen, S.; Zhang, X.; Wang, W.; Liang, Y.; He, W.; Tan, Z. The Effect of Smart City Policies on City Innovation—A Quasi-Natural Experiment from the Smart City Pilot Cities in China. Sustainability 2024, 16, 8007. [Google Scholar] [CrossRef]
- Liu, Q. Technology empowerment, institutional innovation and behavior remodeling—How can the “decentralization, regulation and service” reform optimize the business environment? Nanjing Soc. Sci. 2024, 6, 36–46. [Google Scholar]
- Yang, X. Legal regulation and technology empowerment are combined to achieve effective governance of intelligent society. China Internet Inf. 2023, 6, 52–55. [Google Scholar]
- Ge, K.; Creutzig, F.; Hintz, M.J. Technology first, sustainability later: A systematic review on the literature on the policy development of China’s smart city strategy. Environ. Res. Infrastruct. Sustain. 2024, 4, 042003. [Google Scholar] [CrossRef]
- Felipe, B.d.R.; Vasconcelos, G.L.A.d.; Souza, N.P.d. Impacts of IoT adoption on NPD processes: Optimization and control. Rev. Gestão 2022, 29, 367–379. [Google Scholar]
- Cao, G.; Duan, Y.; Edwards, J.S. Organizational culture, digital transformation, and product innovation. Inf. Manag. 2025, 62, 104135. [Google Scholar] [CrossRef]
- Jiaze, G. Big data and AI empower innovative practices in low-carbon production processes. Int. J. Front. Eng. Technol. 2024, 6, 85–92. [Google Scholar]
- Michael, B. The New Science of Cities; The MIT Press: Cambridge, MA, USA, 2013; p. 520. [Google Scholar]
- Peng, S. National Governance and Economic Transformation in the Digital Economy. Sci. J. Econ. Manag. Res. 2024, 6, 39–44. [Google Scholar] [CrossRef]
- Zheng, Q. This Year Is the First Year of Large-Scale Application of GenAI in Asia, Chinese Enterprises Have Threefold Advantages. In 21st Century Business Herald; Tongfang Knowledge Network: Beijing, China, 2025. [Google Scholar] [CrossRef]
- Xu, Y.; Lu, Y.; Kong, L.; Xu, K. Do environmental target constraints promote the green technology innovation of Chinese enterprises? Clean Technol. Environ. Policy 2025, 1–17. [Google Scholar] [CrossRef]
- Xiao, Y.; Wu, J.; Tu, Y. Intensity of environmental regulation, integration of digital and physical realms, and level of corporate green development. Financ. Res. Lett. 2025, 78, 107138. [Google Scholar] [CrossRef]
- Huang, M.; Zhang, W.; Lan, X. Research on the impact of digital infrastructure construction on urban economic resilience. Stat. Decis. Mak. 2025, 41, 101–106. [Google Scholar]
- Peng, X. Research on the Influence of Home Country Institutional Environment on OFDI Performance of Listed Enterprises. Master’s Thesis, Foshan University, Foshan, China, 2024. [Google Scholar]
- Duan, J.; Yu, Z.; Wen, Y. Research on the green technology innovation effect of high-speed rail opening and network in cities. J. Southwest Univ. Natl. 2024, 45, 98–113. [Google Scholar]
- Zhang, M. Study on the Influence of Environmental Regulation on Green Total Factor Productivity in Resource-Based Cities. Ph.D. Thesis, Chongqing University, Chongqing, China, 2023. [Google Scholar] [CrossRef]
- Yue, L.; Yin, Y.; Huang, C. Research on the influence of low-carbon city pilot on urban digital technology innovation. Ind. Technol. Econ. 2023, 42, 30–37. [Google Scholar]
- Xing, Y. Under the Goal of Sustainable Development, Do Regions with Higher Energy Intensity Generate More Green Innovation? Evidence from Chinese Cities. Sustainability 2024, 16, 6679. [Google Scholar] [CrossRef]
- Yeo, Y.; Lee, J.-D. Revitalizing the race between technology and education: Investigating the growth strategy for the knowledge-based economy based on a CGE analysis. Technol. Soc. 2020, 62, 101295. [Google Scholar] [CrossRef]
- Zhao, H.; Liu, Q.; Zhang, M.; Li, J. Analysis of spatial pattern and driving factors of ecosystem services in Beijing based on XGBoost-SHAP model. Environ. Sci. 2025, 1–16. [Google Scholar] [CrossRef]
- Cui, W.; Tang, J.; Yuan, S.; Dai, X. Innovation Convergence: A System Review. J. Knowl. Econ. 2024, 1–44. [Google Scholar] [CrossRef]
- Diao, L.; Zhao, X.; Xie, W.; Liu, J. Research on the Role of Digital Finance in Urban Green Innovation. Reg. Sci. Environ. Econ. 2025, 2, 3. [Google Scholar] [CrossRef]
- Zhao, P.; Tian, B.S.; Yang, Q.; Zhang, S. Influencing Factors and Their Spatial–Temporal Heterogeneity of Urban Transport Carbon Emissions in China. Energies 2024, 17, 756. [Google Scholar] [CrossRef]
- Beck, T.; Levine, R.; Levkov, A. Big Bad Banks? The Winners and Losers from Bank Deregulation in the United States. J. Financ. 2010, 65, 1637–1667. [Google Scholar] [CrossRef]
- Li, G.; Wang, C. Can smart cities promote Green technology innovation? Evidence from Chinese cities. Clean Technol. Environ. Policy 2024, 1–17. [Google Scholar] [CrossRef]
- Andrew, G.-B. Difference-in-differences with variation in treatment timing. J. Econom. 2021, 225, 254–277. [Google Scholar]
- Callaway, B.; Sant’Anna, P.H.C. Difference-in-Differences with multiple time periods. J. Econom. 2021, 225, 200–230. [Google Scholar] [CrossRef]
- Ferrara, E.; Chong, A.; Duryea, S. Soap Operas and Fertility: Evidence from Brazil. Am. Econ. J. Appl. Econ. 2008, 4, 1–31. [Google Scholar] [CrossRef]
- Zhao, X.; Xie, Q. The impact of intellectual property protection on the development of urban digital economy—A quasi-natural experiment based on the construction of national intellectual property demonstration cities. Account. Mon. 2025, 46, 102–108. [Google Scholar]
- North, D.C. Institutions, Institutional Change and Economic Performance; Cambridge University Press: Cambridge, UK, 1990. [Google Scholar]
- Peneder, M. Industrial structure and aggregate growth. Struct. Chang. Econ. Dyn. 2003, 14, 427–448. [Google Scholar] [CrossRef]
- Porter, M.E.; van der Linde, C. Toward a New Conception of the Environment-Competitiveness Relationship. J. Econ. Perspect. 1995, 9, 97–118. [Google Scholar] [CrossRef]
- Daron, A.; Robinson, J.A. Why Nations Fail: The Origins of Power, Prosperity and Poverty. Asean Econ. Bull. 2012, 29, 168. [Google Scholar]
Disclaimer/Publisher’s Note: The statements, opinions and data contained in all publications are solely those of the individual author(s) and contributor(s) and not of MDPI and/or the editor(s). MDPI and/or the editor(s) disclaim responsibility for any injury to people or property resulting from any ideas, methods, instructions or products referred to in the content. |
© 2025 by the authors. Licensee MDPI, Basel, Switzerland. This article is an open access article distributed under the terms and conditions of the Creative Commons Attribution (CC BY) license (https://creativecommons.org/licenses/by/4.0/).